
Measurements of the Magnetic Field Variations Related with the Size of V-Shaped Notches in Steel Pipes

 , ,
, ,  , and
, and 
Abstract
:1. Introduction
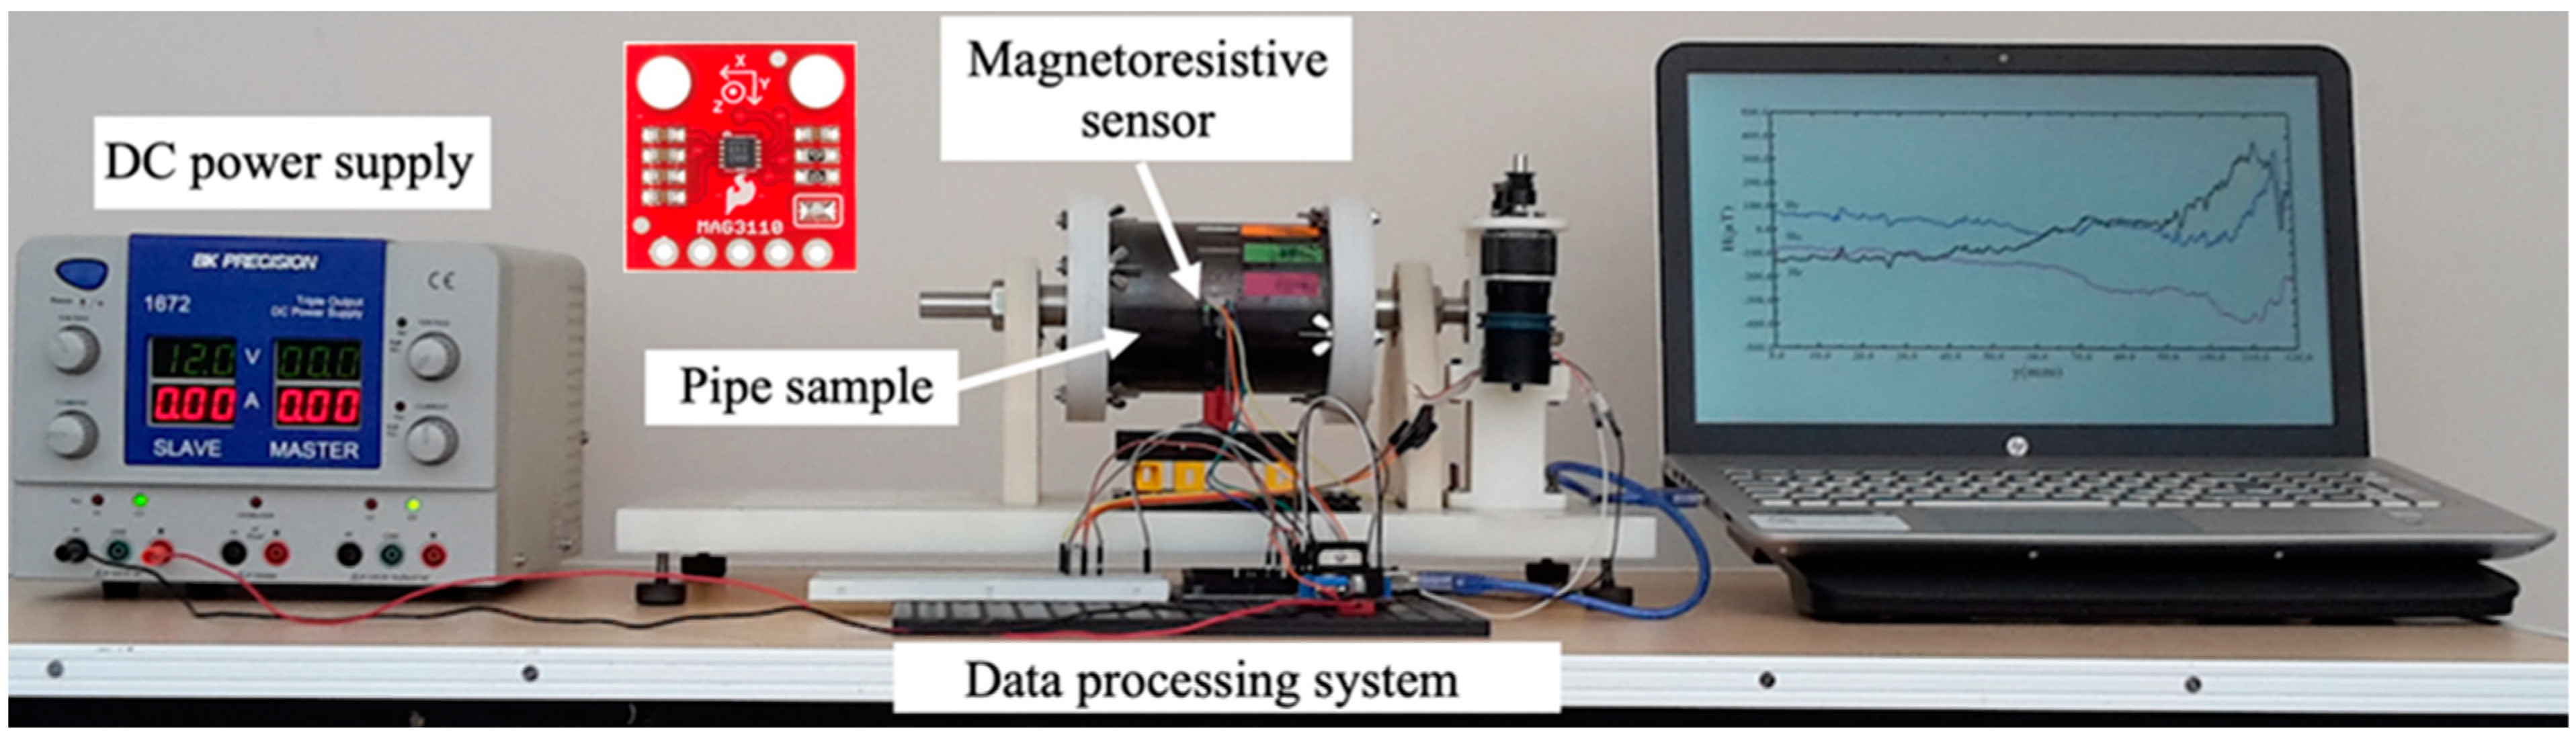
2. Materials and Methods
3. Results and Discussion
4. Conclusions
Author Contributions
Funding
Institutional Review Board Statement
Informed Consent Statement
Data Availability Statement
Acknowledgments
Conflicts of Interest
References
- Mudugamuwa, A.; Jayasundara, C.; Baokun, H.; Amarasinghe, R. Development of a Robotic System with Stand-Alone Monocular Vision System for Eco-friendly Defect Detection in Oil Transportation Pipelines. In Sustainable Design and Manufacturing; Smart Innovation, Systems and Technologies; Scholz, S.G., Howlett, R.J., Setchi, R., Eds.; Springer: Singapore, 2021; Volume 200. [Google Scholar] [CrossRef]
- Dai, L.S.; Feng, Q.S.; Xiang, X.Q.; Sutherland, J.; Wang, T.; Wang, D.P.; Wang, Z.J. Application of USCCD on girth weld defect detection of oil pipelines. Appl. Sci. 2020, 10, 2736. [Google Scholar] [CrossRef] [Green Version]
- Mevissen, F.; Meo, M. A Review of NDT/Structural Health Monitoring Techniques for Hot Gas Components in Gas Turbines. Sensors 2019, 19, 711. [Google Scholar] [CrossRef] [PubMed] [Green Version]
- Masri, Y.E.; Rakha, T. A scoping review of non-destructive testing (NDT) techniques in building performance diagnostic inspections. Constr. Build. Mater. 2020, 265, 120542. [Google Scholar] [CrossRef]
- Piri, B.; Amini, R.; Asadinia, E.; Vardak, S.; Mehdilouee, R.; Mojarrad, A. Investigation of failure mechanisms and remaining life prediction of firewater pipelines used in industrial applications. Eng. Fail. Anal. 2021, 124, 105301. [Google Scholar] [CrossRef]
- Lorenzo, C.; Janko, S.; Gianluca, R.; Miha, B. Thermoelasticity-based modal damage identification. Inter. J. Fatigue 2020, 137, 105661. [Google Scholar] [CrossRef]
- Yan, W.-J.; Chronopoulos, D.; Papadimitriou, C.; Cantero-Chinchilla, S.; Zhu, G.-S. Bayesian inference for damage identification based on analytical probabilistic model of scattering coefficient estimators and ultrafast wave scattering simulation scheme. J. Sound Vib. 2020, 468, 115083. [Google Scholar] [CrossRef]
- Dehui, W.; Zhitian, L.; Xiaohong, W.; Lingxin, S. Composite magnetic flux leakage detection method for pipelines using alternating magnetic field excitation. NDT E Inter. 2017, 91, 148–155. [Google Scholar] [CrossRef]
- Gholizadeh, S. A review of non-destructive testing methods of composite materials. Procedia Struct. Integr. 2016, 1, 50–57. [Google Scholar] [CrossRef] [Green Version]
- Liu, J.; Xu, G.; Gu, X.; Zhou, G. Ultrasonic test of resistance spot welds based on wavelet package analysis. Ultrasonics 2015, 56, 557–565. [Google Scholar] [CrossRef] [PubMed]
- Purna-Chandra-Rao, B. Non-destructive Testing and Damage Detection. In Aerospace Materials and Material Technologies; Prasad, N., Wanhill, R., Eds.; Indian Institute of Metals Series; Springer: Singapore, 2017; Volume 2, pp. 209–218. ISBN 978-981-10-2143-5. [Google Scholar] [CrossRef]
- García-Martín, J.; Gómez-Gil, J.; Vázquez-Sánchez, E. Non-destructive techniques based on Eddy current testing. Sensors 2011, 11, 2525–2565. [Google Scholar] [CrossRef] [PubMed] [Green Version]
- Zhang, W.; Shi, Y.; Li, Y.; Luo, Q. A study of quantifying thickness of ferromagnetic pipes based on remote field Eddy current testing. Sensors 2018, 18, 2769. [Google Scholar] [CrossRef] [PubMed] [Green Version]
- Abdalla, A.; Alo, K.; Paw, J.K.S.; Rifai, D.; Faraj, M.A. A novel Eddy current testing error compensation technique based on Mamdani-type fuzzy coupled differential and absolute probes. Sensors 2018, 18, 2108. [Google Scholar] [CrossRef] [PubMed] [Green Version]
- Senck, S.; Scheerer, M.; Revol, V.; Plank, B.; Hannesschläger, C.; Usenbauer, C.; Kastner, J. Microcrack characterization in loaded CFRP laminates using quantitative two- and three-dimensional X-ray dark-field imaging. Compos. Part A Appl. Sci. Manuf. 2018, 115, 206–214. [Google Scholar] [CrossRef]
- Yang, R.; He, Y.; Zhang, H. Progress and trends in nondestructive testing and evaluation for wind turbine composite blade. Renew. Sust. Energ. Rev. 2016, 60, 1225–1250. [Google Scholar] [CrossRef]
- Lu, Q.Y.; Wong, C.H. Applications of non-destructive testing techniques for post-process control of additively manufactured parts. Virtual Phys. Prototyp. 2017, 12, 301–321. [Google Scholar] [CrossRef]
- Antipov, A.G.; Markov, A.A. 3D simulation and experiment on high speed rail MFL inspection. NDT E Int. 2018, 98, 177–185. [Google Scholar] [CrossRef]
- Witek, M. Validation of in-line inspection data quality and impact on steel pipeline diagnostic intervals. J. Nat. Gas Sci. Eng. 2018, 56, 121–133. [Google Scholar] [CrossRef]
- Xu, K.; Qiu, X.; Tian, X. Theoretical investigation of metal magnetic memory testing technique for detection of magnetic flux leakage signals from buried defect. Nondestruct. Test. Eval. 2018, 33, 45–55. [Google Scholar] [CrossRef]
- Dubov, A.; Kolokolnikov, S. Assessment of the material state of oil and gas pipeline based on the metal magnetic memory method. Welding World 2012, 56, 11–19. [Google Scholar] [CrossRef]
- Li, Y.; Zeng, X.; Wei, L.; Wan, Q. Characterizations of damage induced magnetization for X80 pipeline steel by metal magnetic memory testing. Inter. J. Appl. Electromagn. Mech. 2017, 1, 23–35. [Google Scholar] [CrossRef]
- Pengpeng, S.; Ke, J.; Xiaojing, Z. A magnetomechanical model for the magnetic memory method. Int. J. Mech. Sci. 2017, 124–125, 229–241. [Google Scholar] [CrossRef]
- Liu, B.; Fu, P.; Li, R.; He, P.; Dong, S. Influence of crack size on stress evaluation of ferromagnetic low alloy steel with metal Magnetic Memory Technology. Materials 2019, 12, 4028. [Google Scholar] [CrossRef] [PubMed] [Green Version]
- Su, S.; Zhao, X.; Wang, W.; Zhang, X. Metal magnetic memory inspection of Q345 steel specimens with butt weld in tensile and bending test. J. Nondestruct. Eval. 2019, 38, 64. [Google Scholar] [CrossRef]
- Shi, P.; Su, S.; Chen, Z. Overview of researches on the nondestructive testing method of metal magnetic memory: Status and challenges. J. Nondest. Eval. 2020, 39, 43. [Google Scholar] [CrossRef]
- Villegas-Saucillo, J.J. Detección de Defectos Geométricos en Tubos Ferromagnéticos Mediante Procesamiento Digital de Señales con el Método de memoria Magnética. Ph.D. Thesis, Instituto Tecnológico de Celaya, Guanajuato, Mexico, 2019. [Google Scholar]


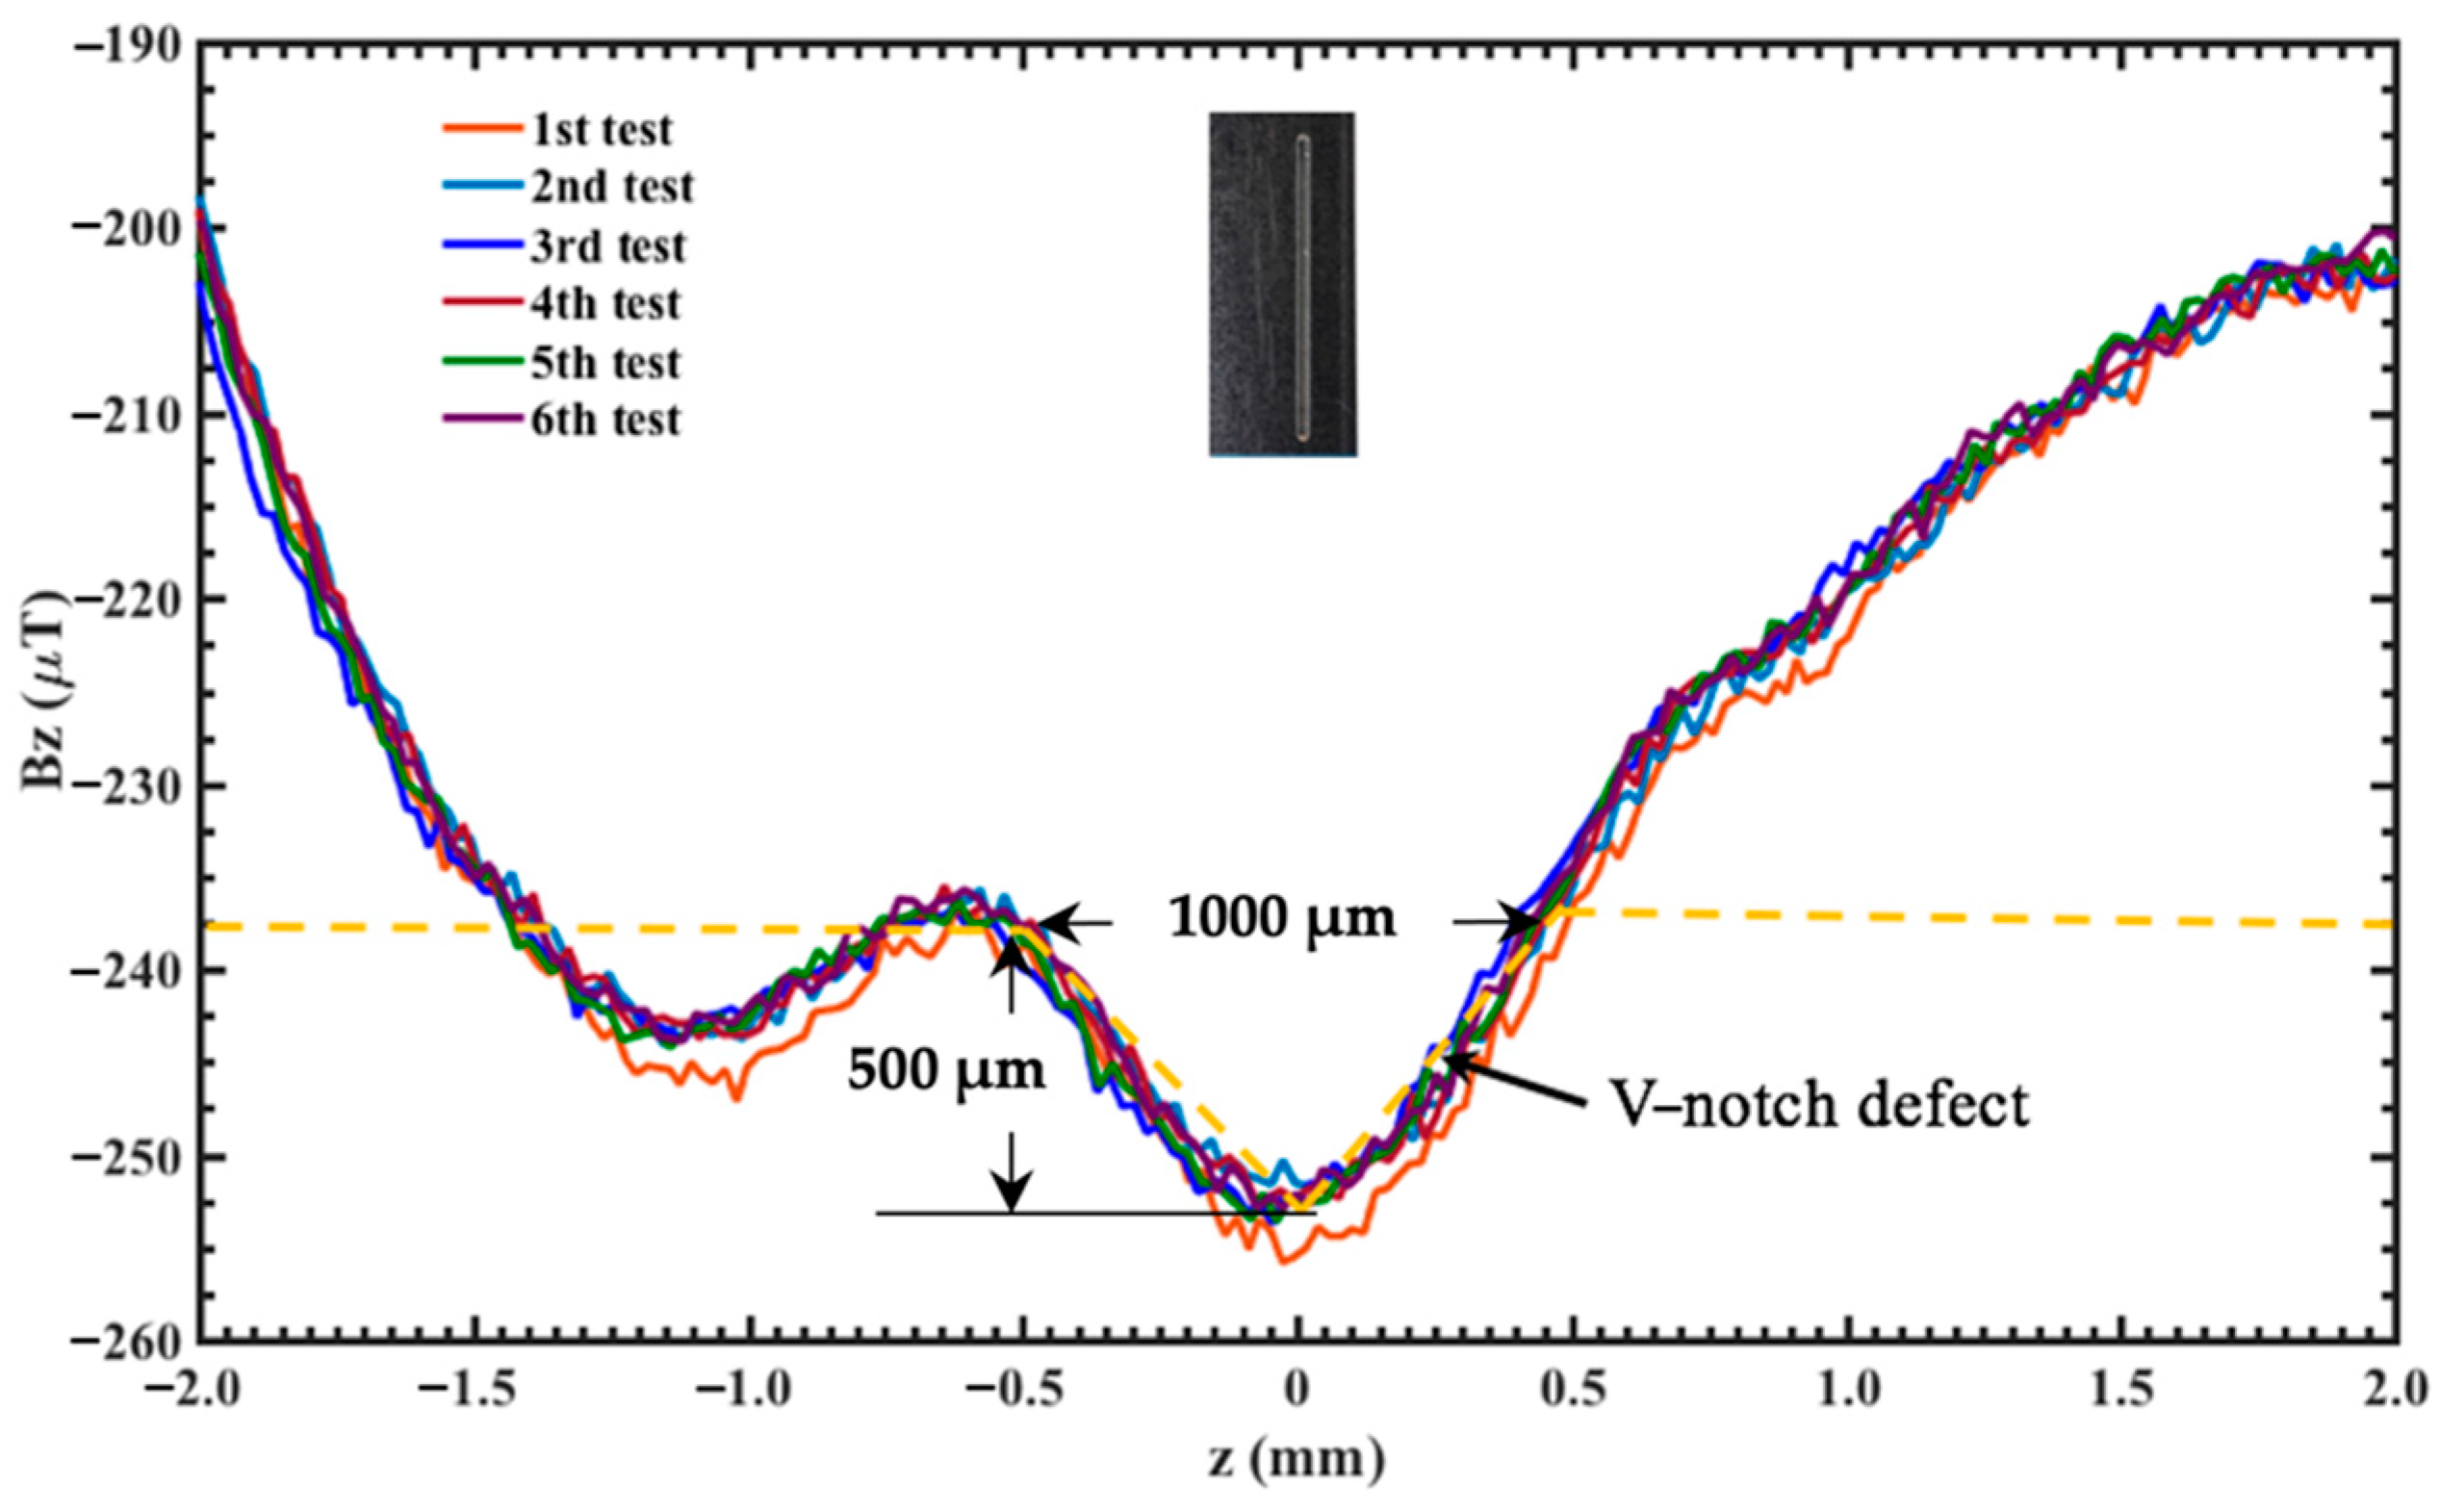
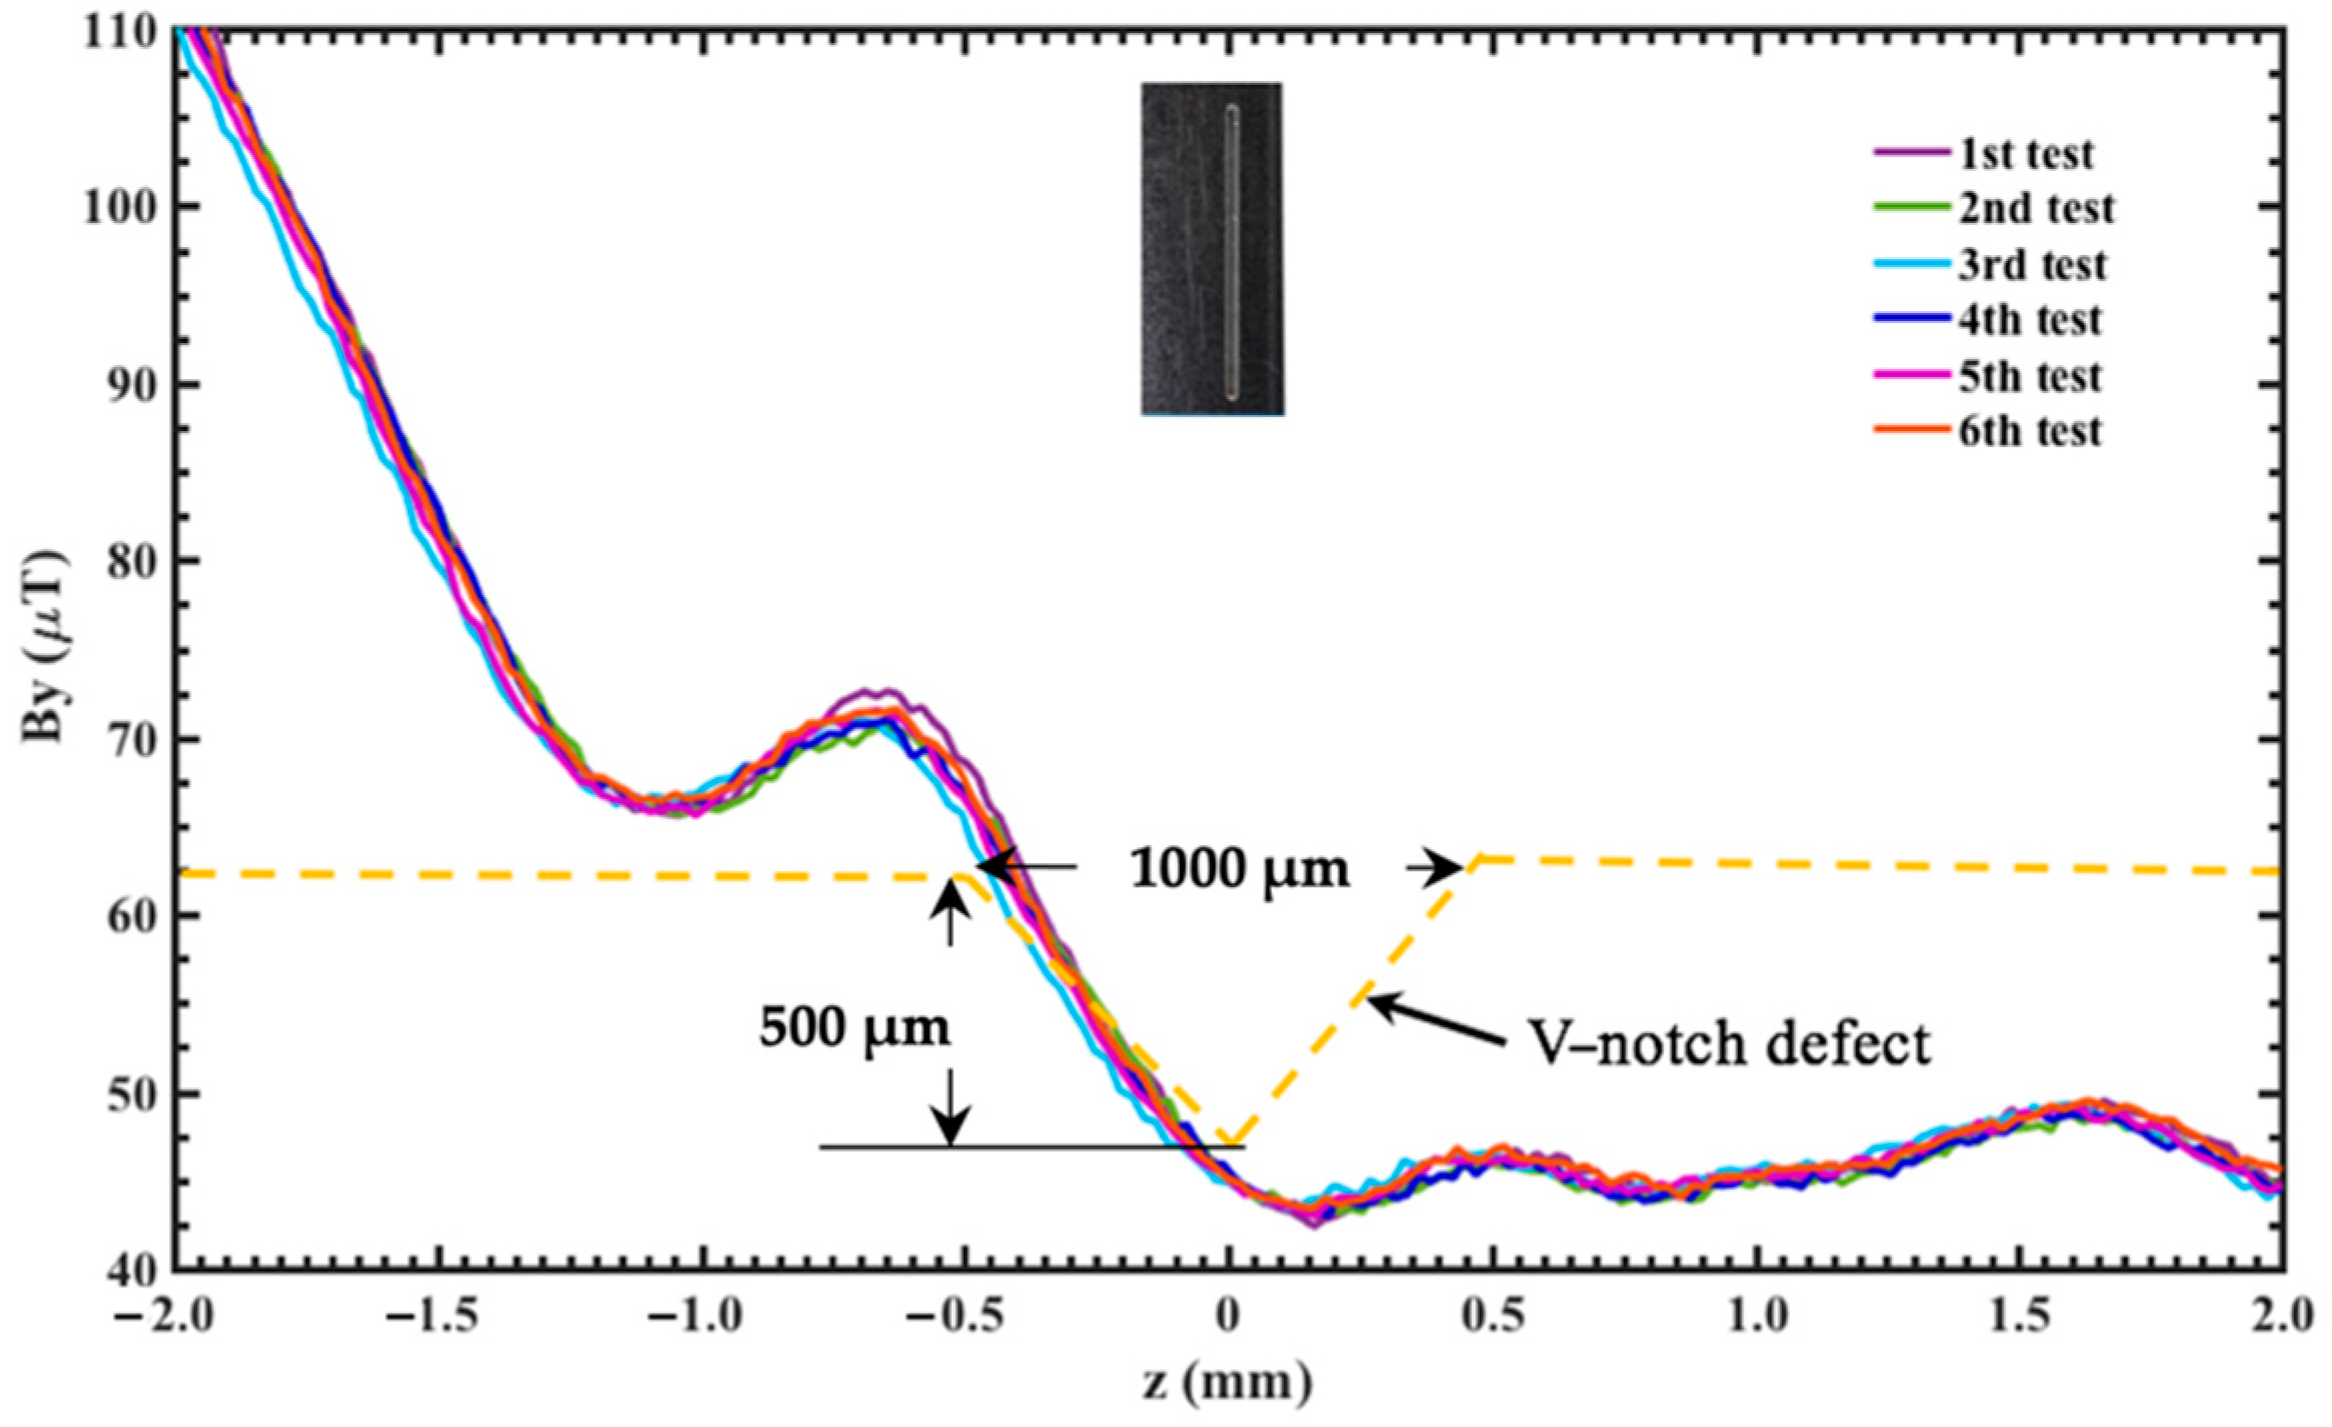
| V-Notch Defect | Width (µm) | Depth (µm) |
|---|---|---|
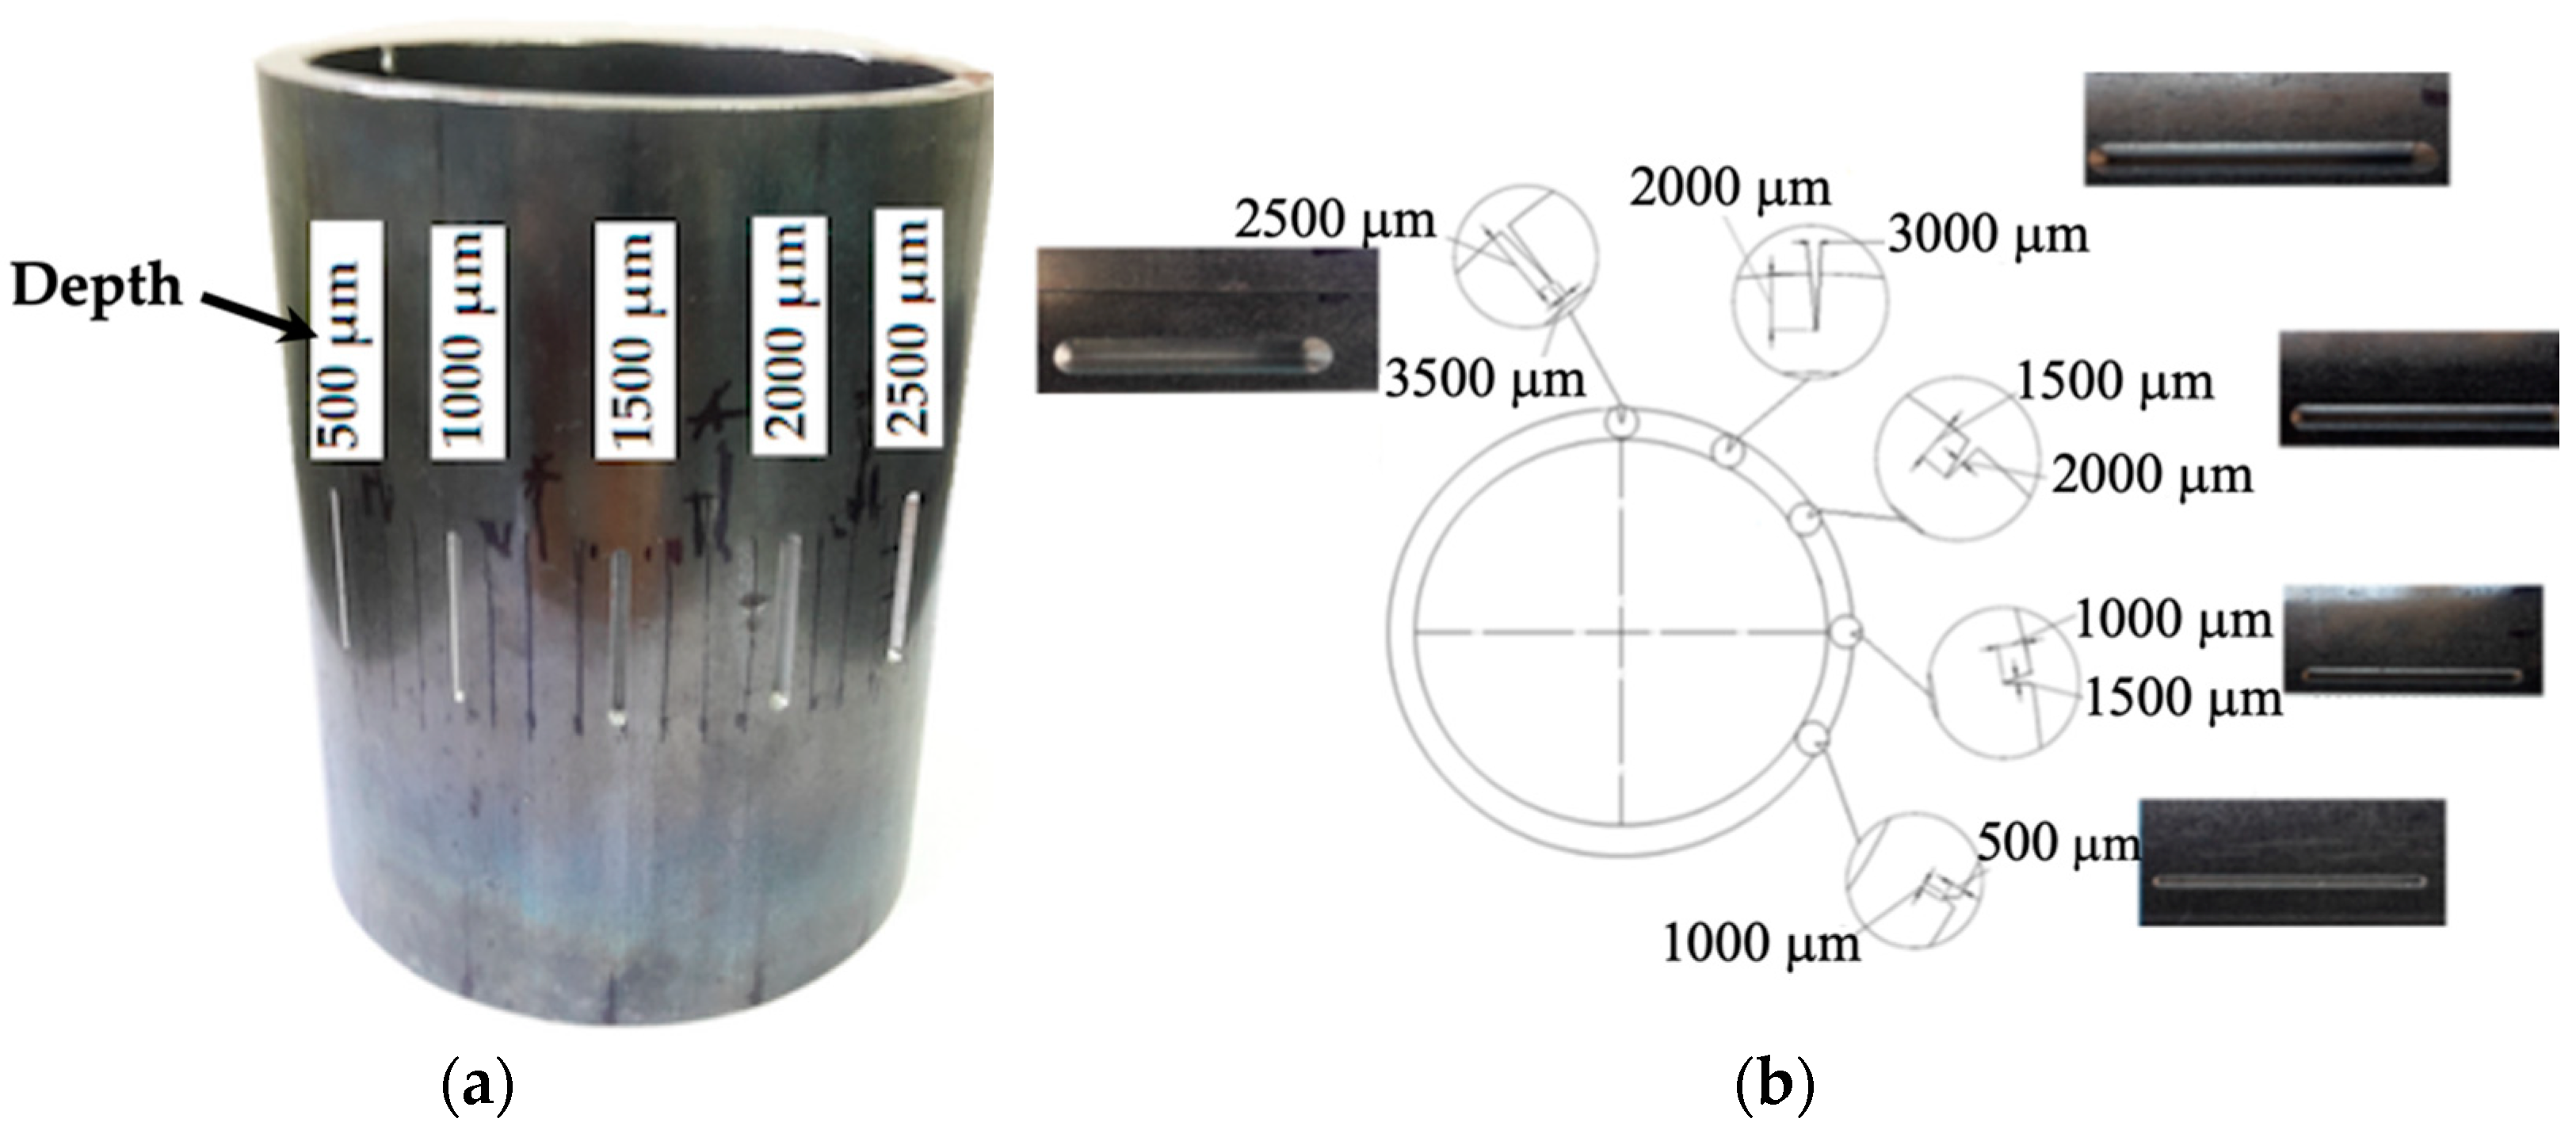
| S1 | 1000.0 | 500.0 |
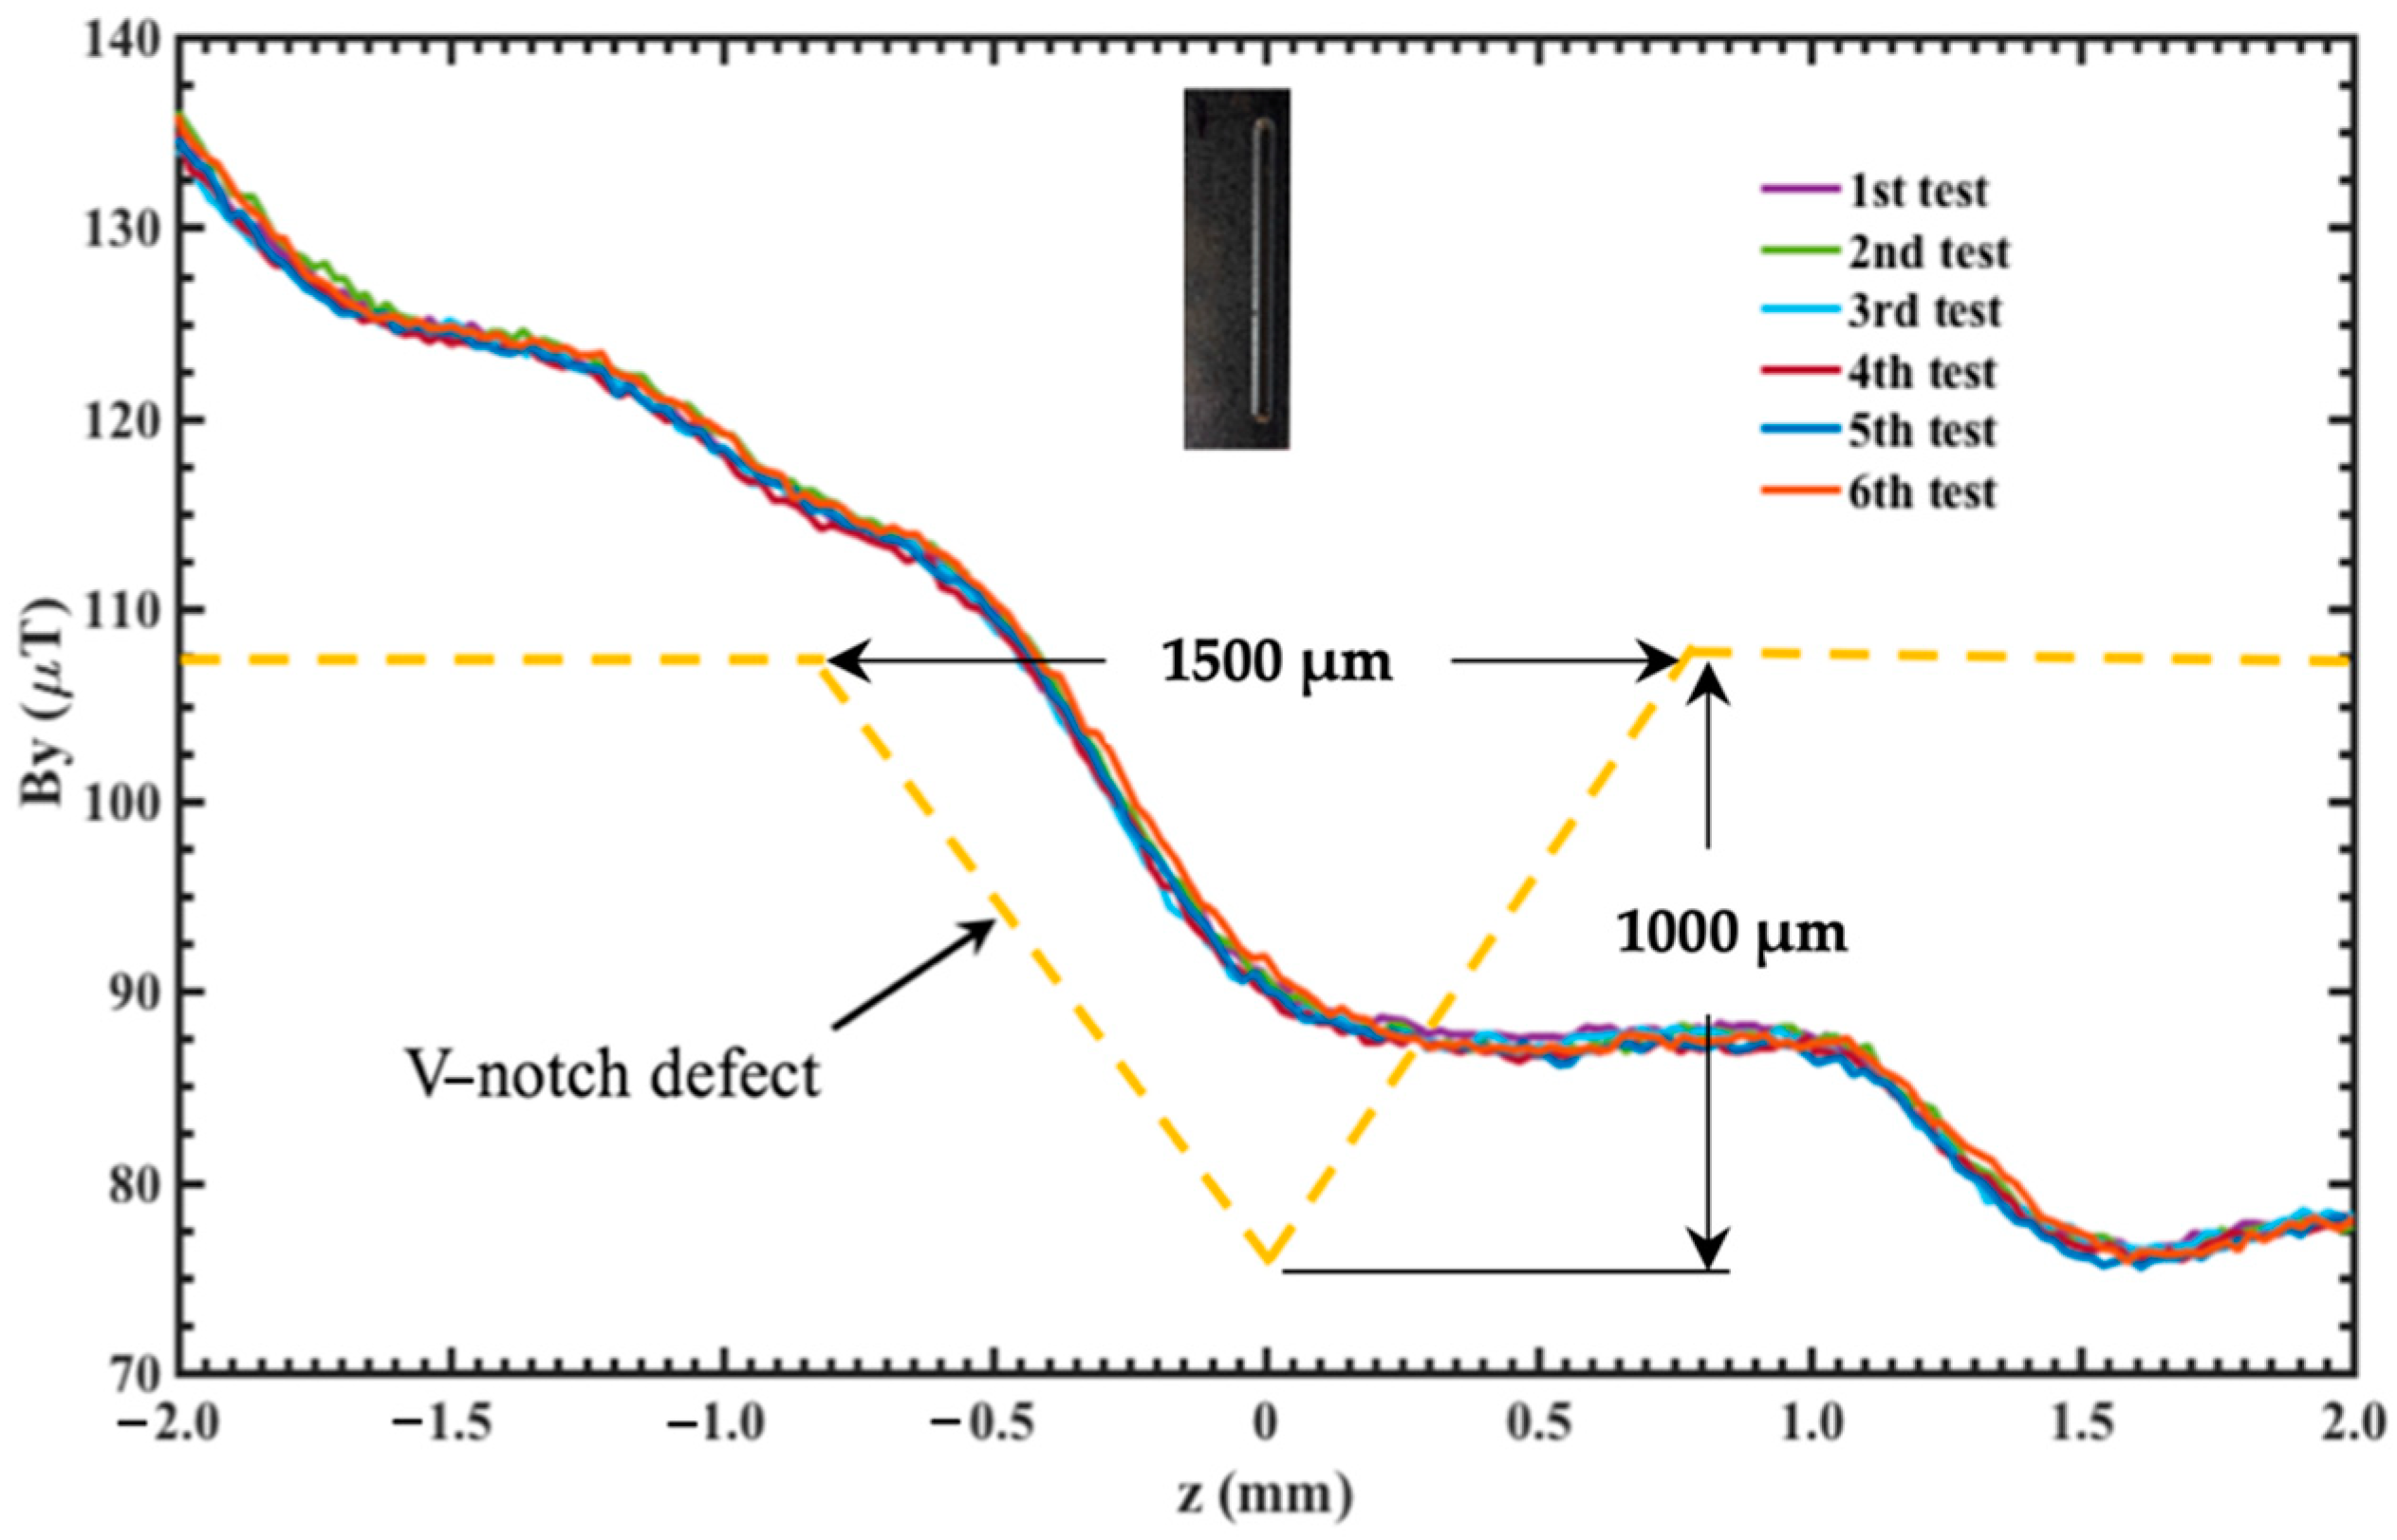
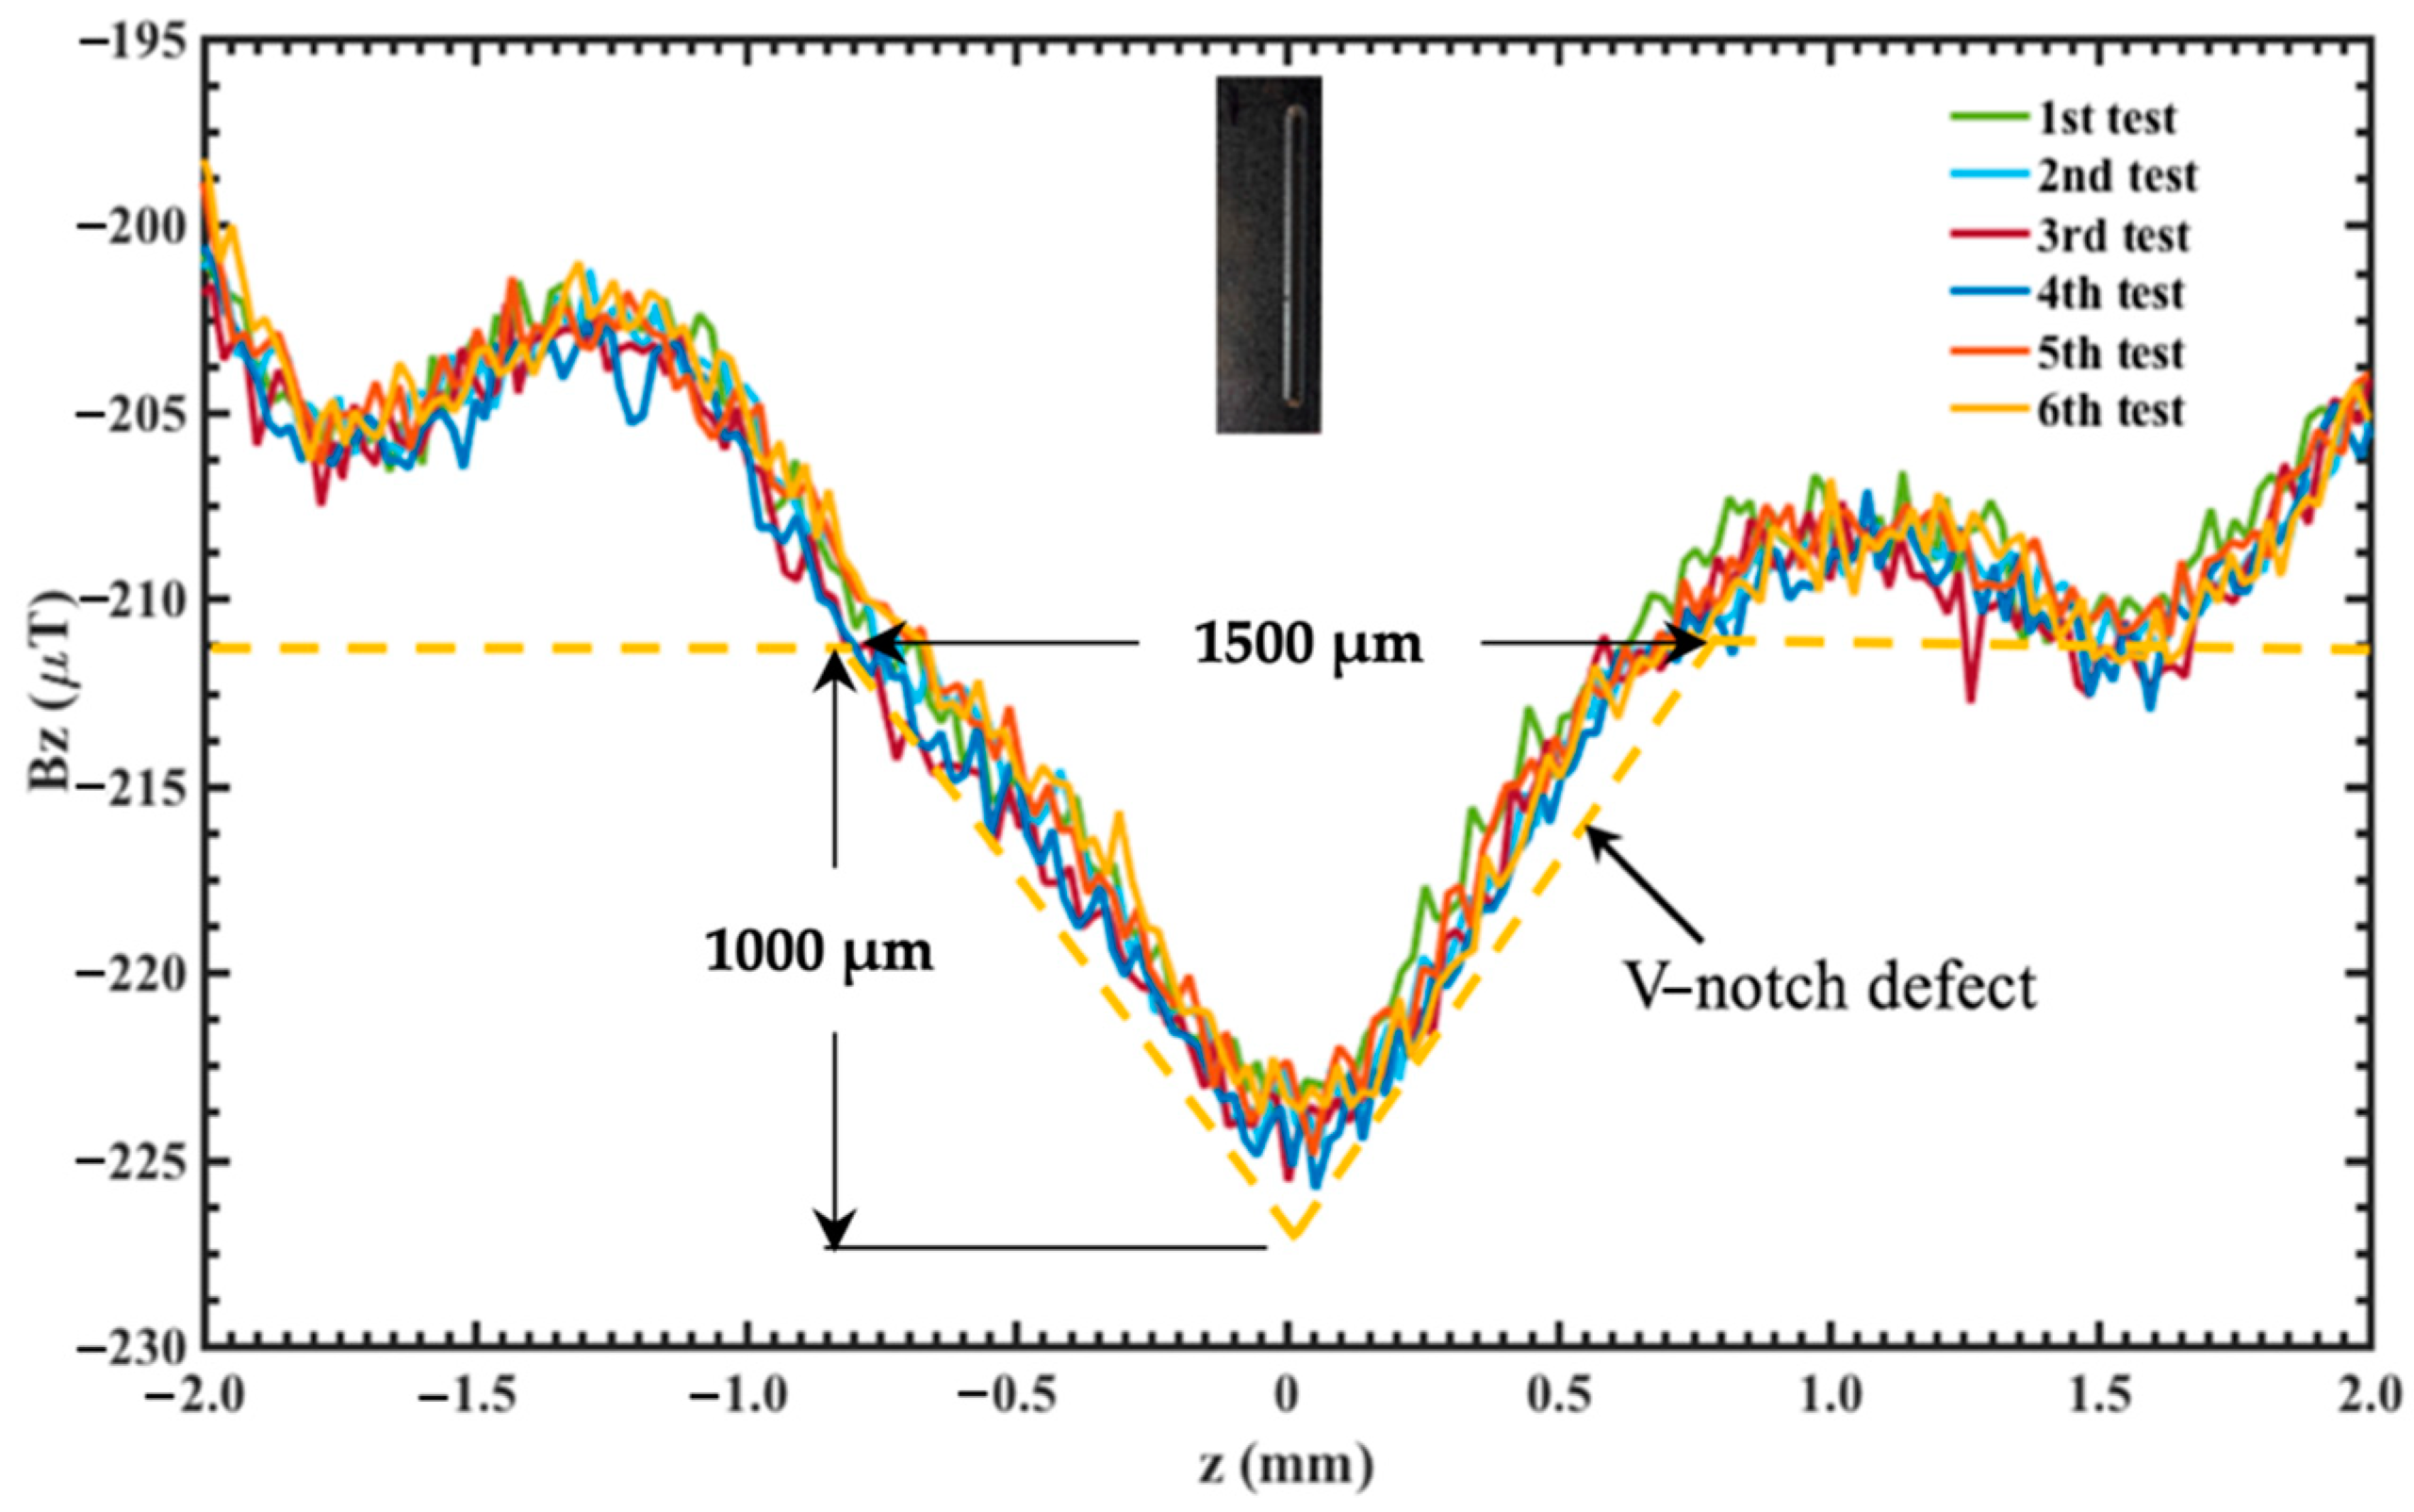
| S2 | 1500.0 | 1000.0 |
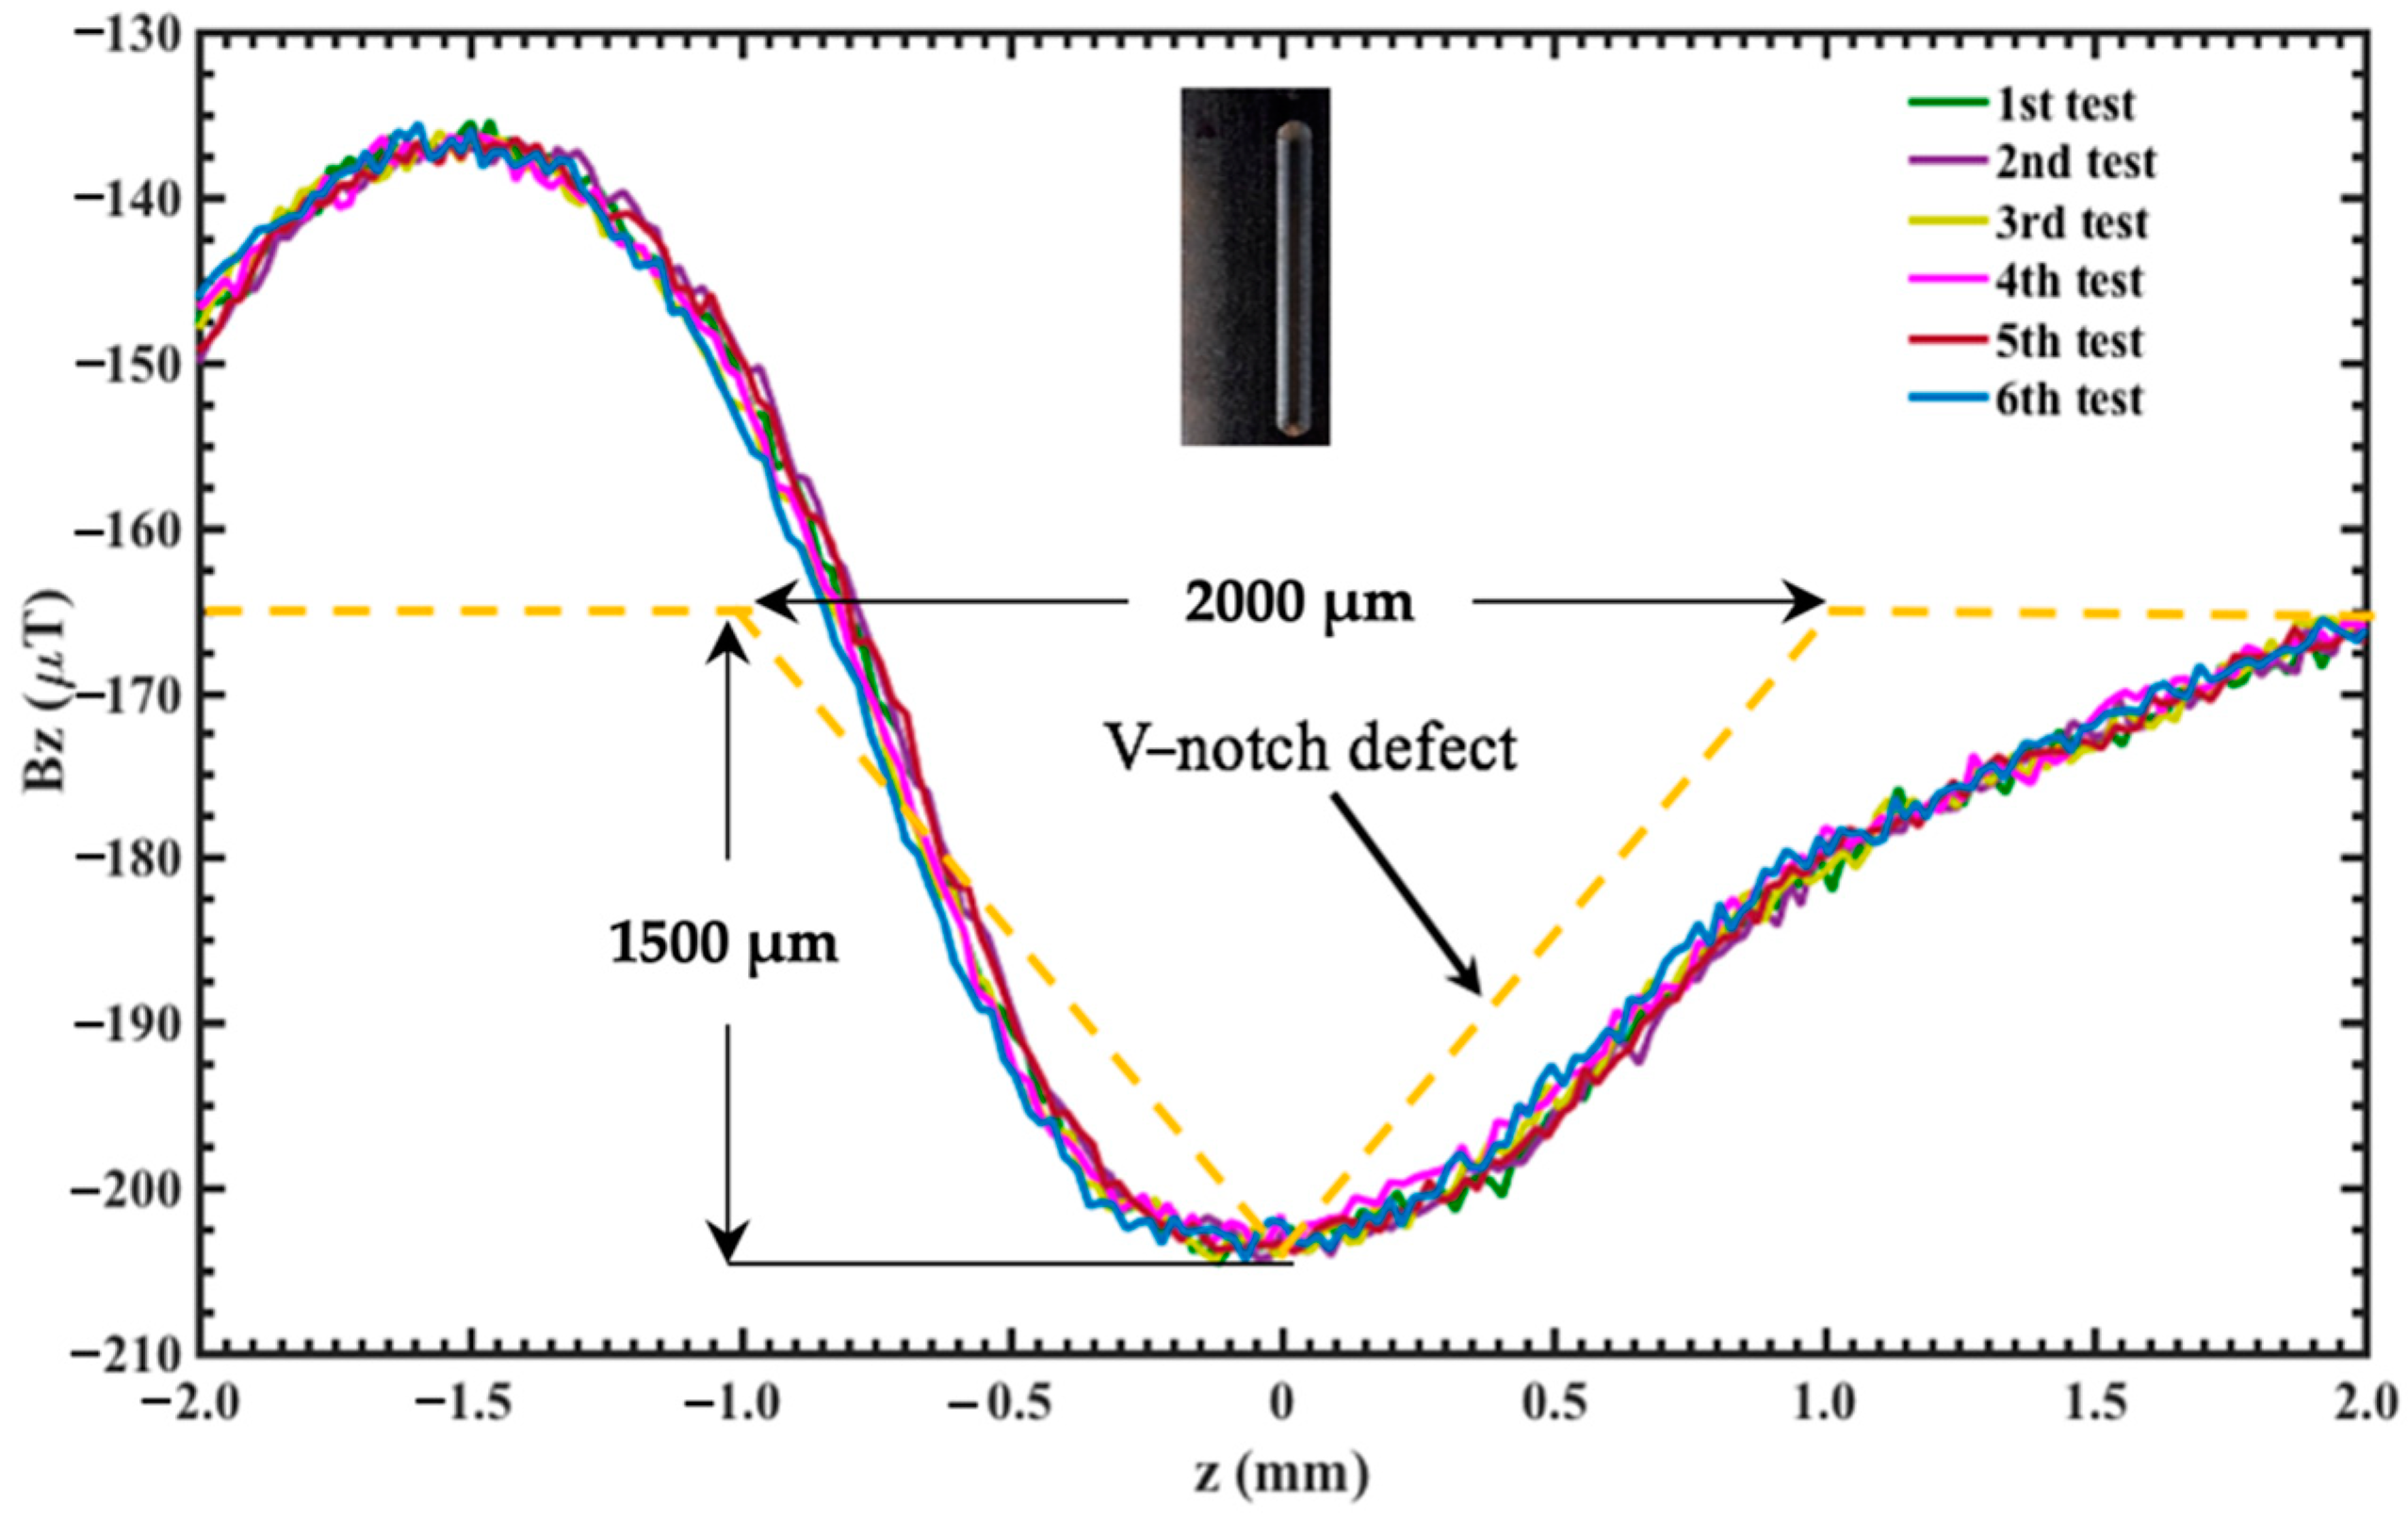
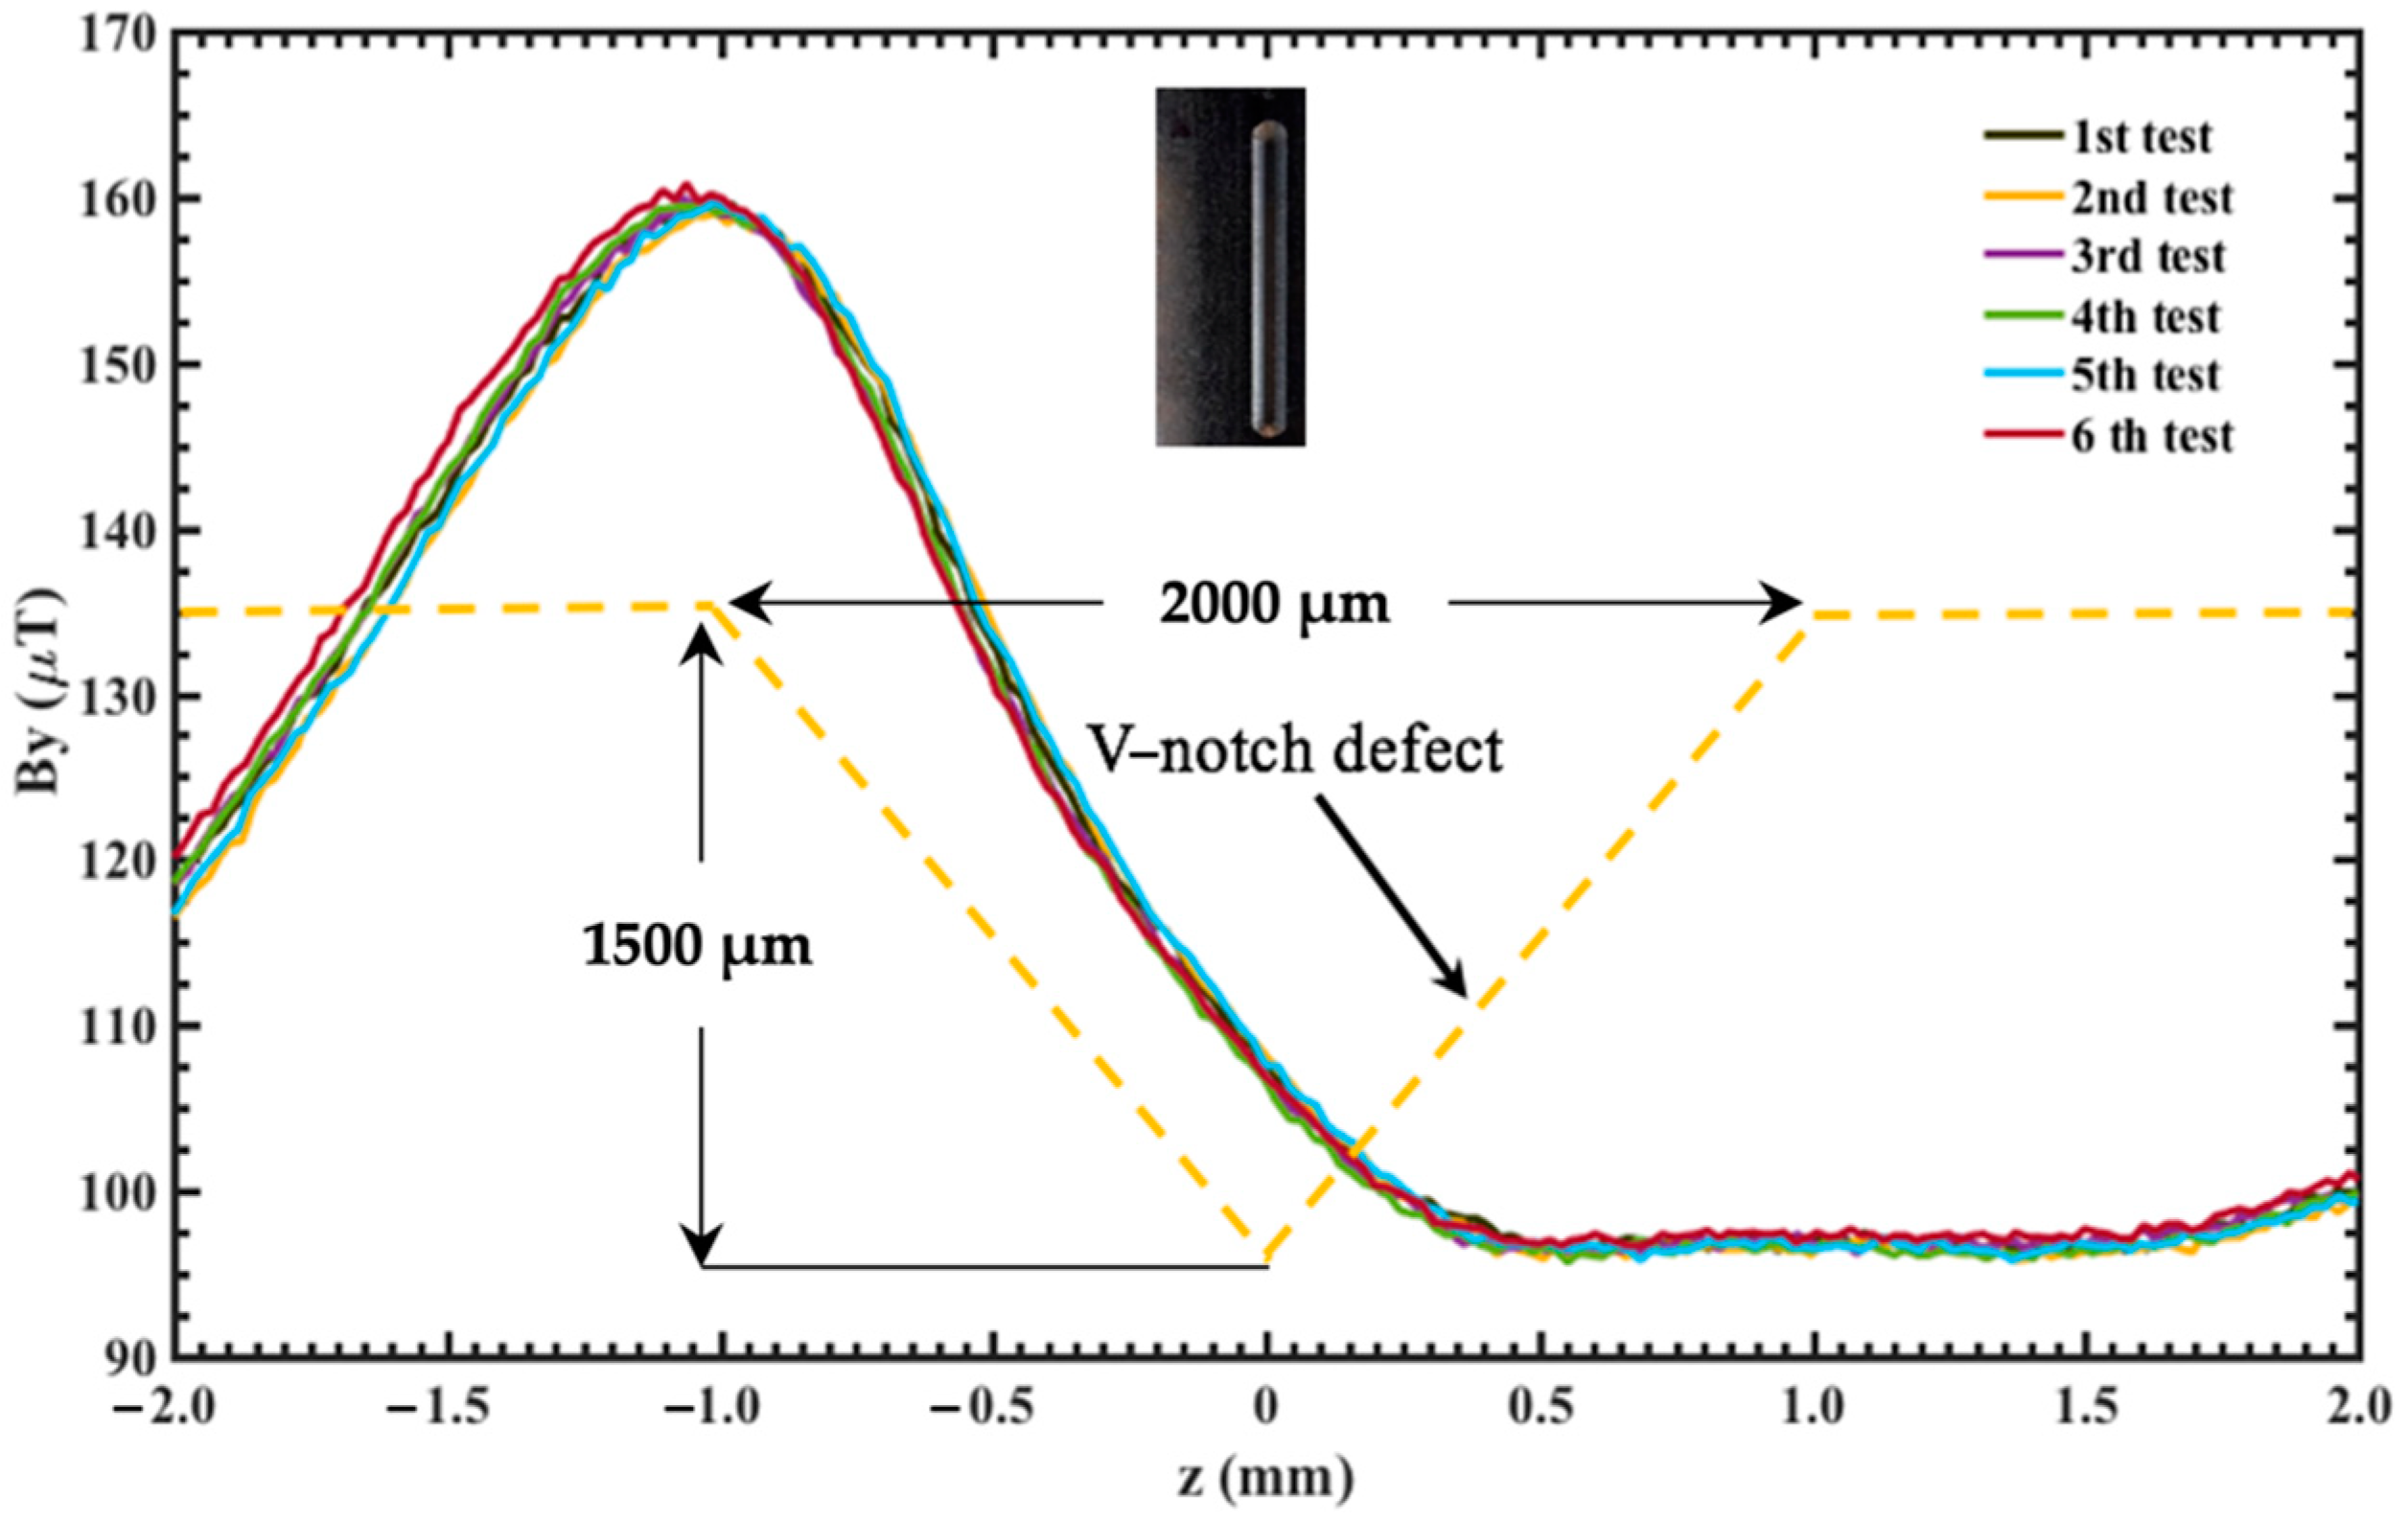
| S3 | 2000.0 | 1500.0 |
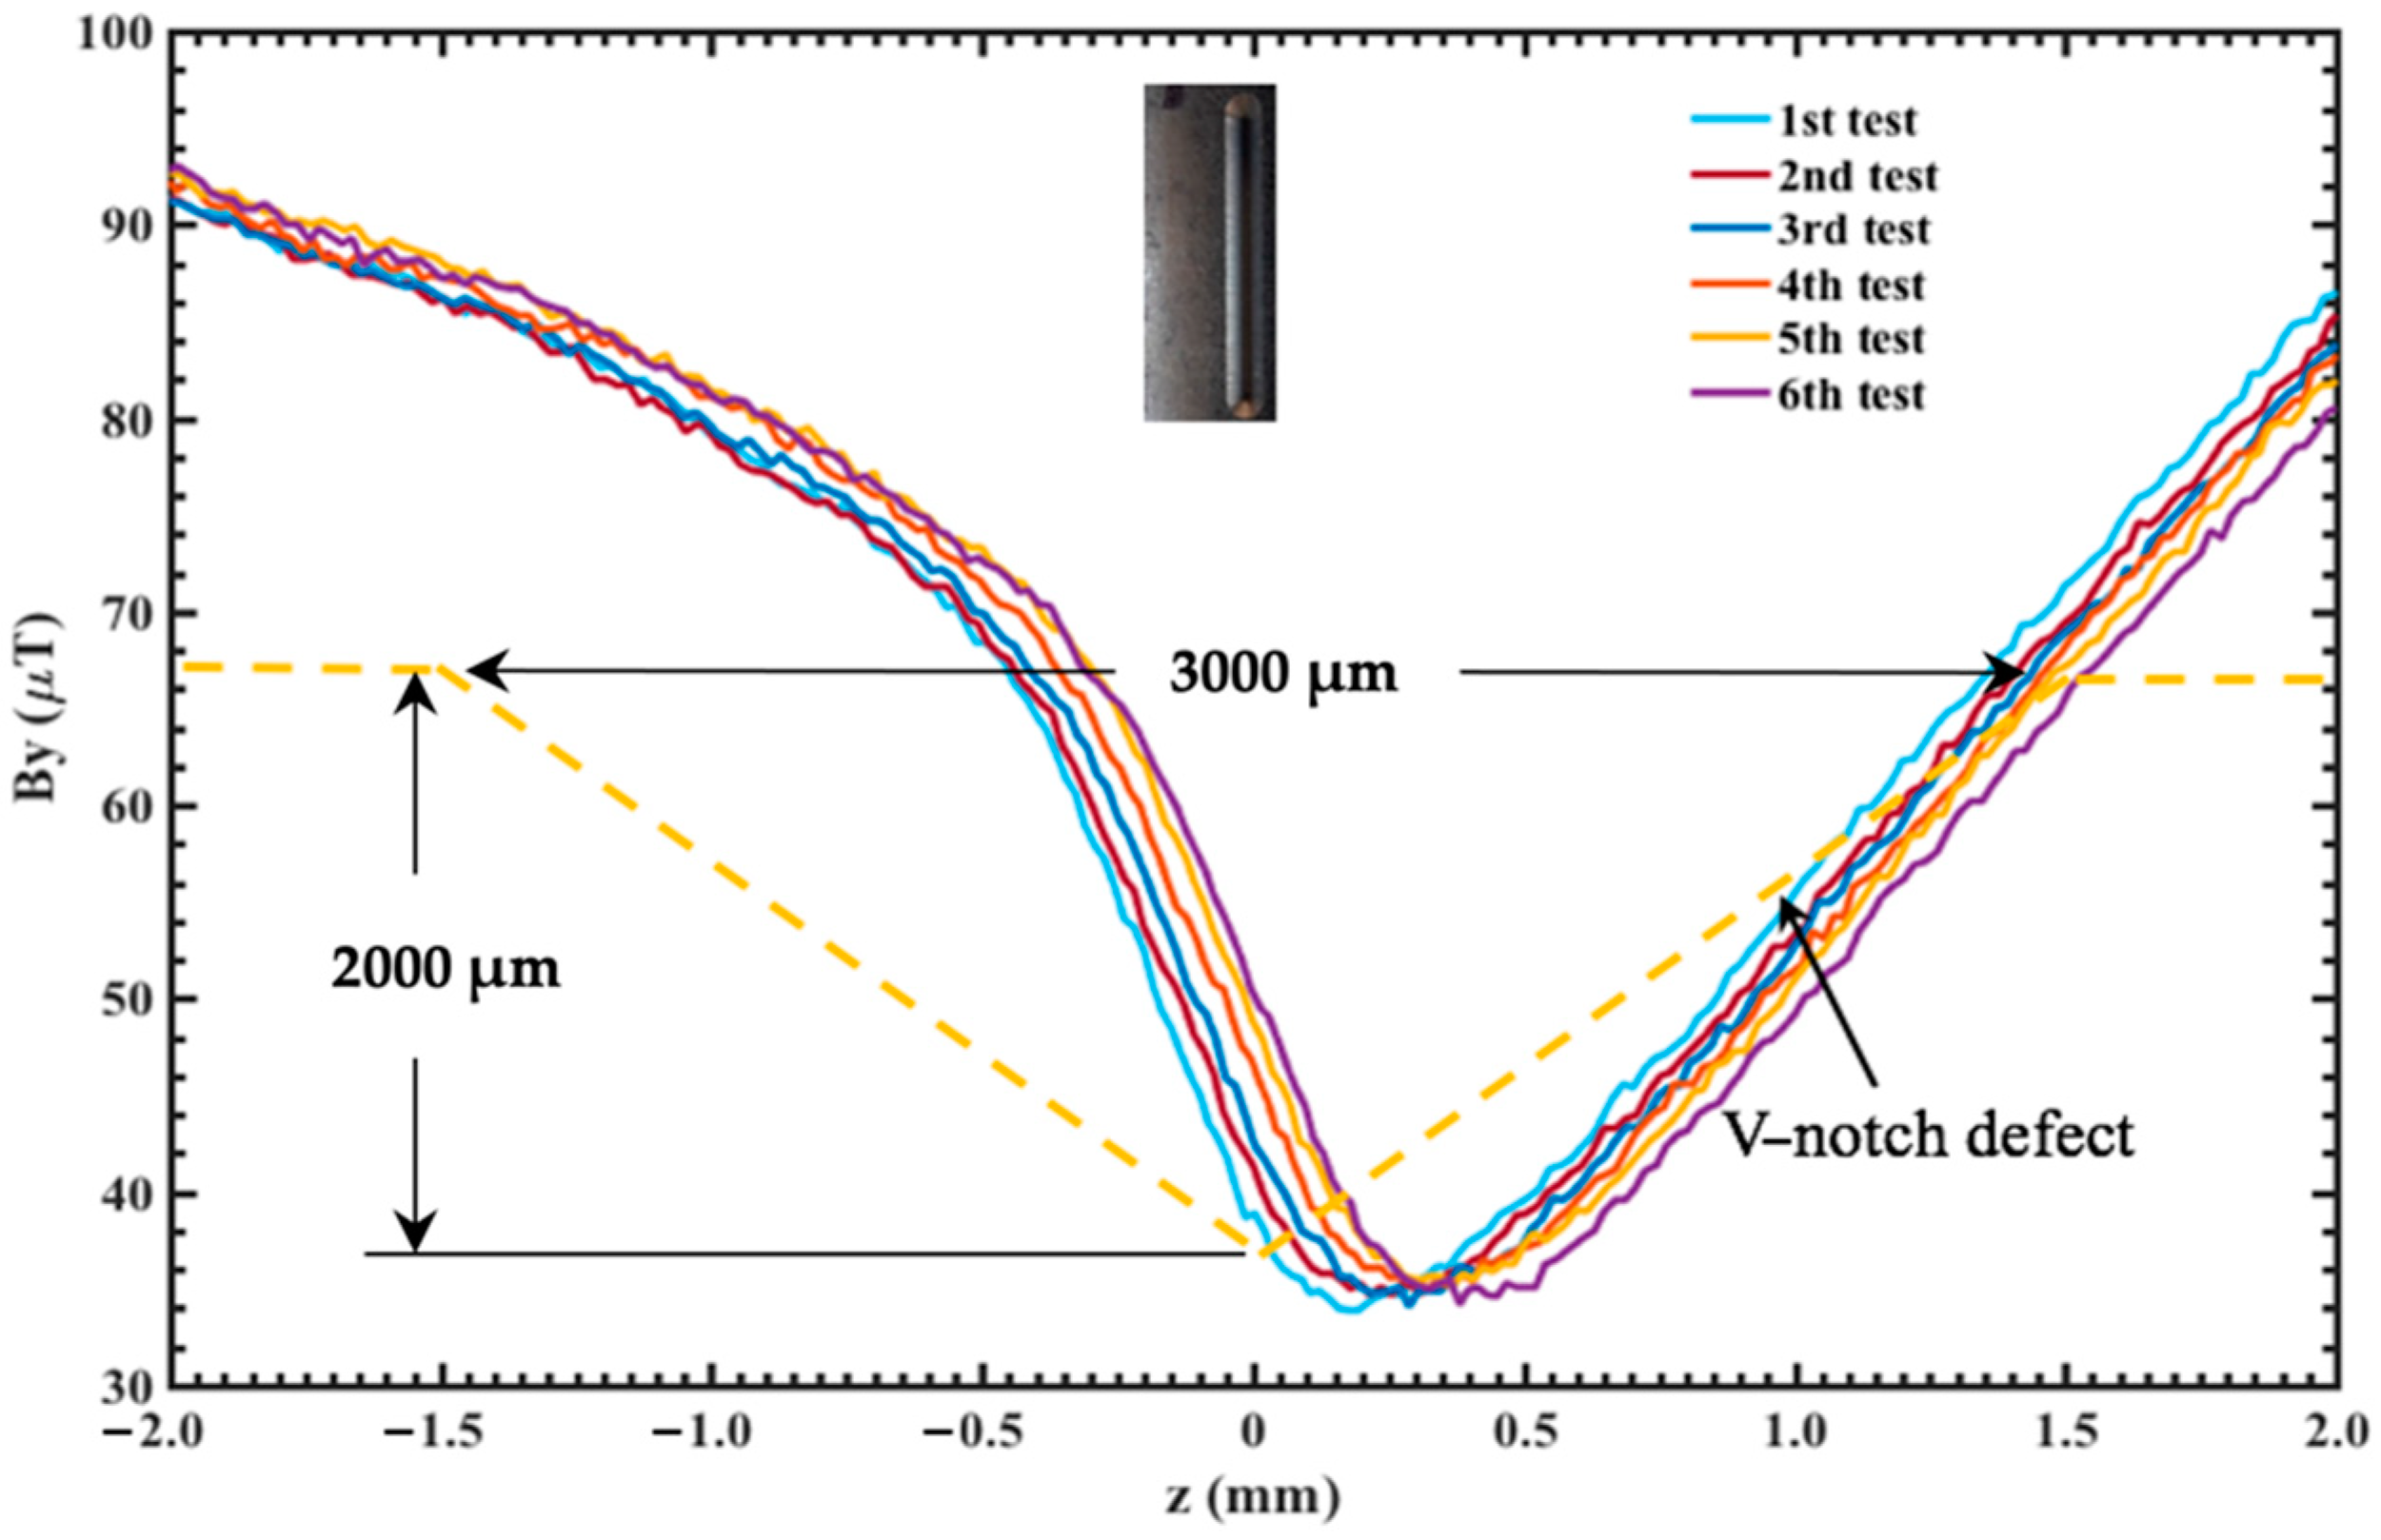
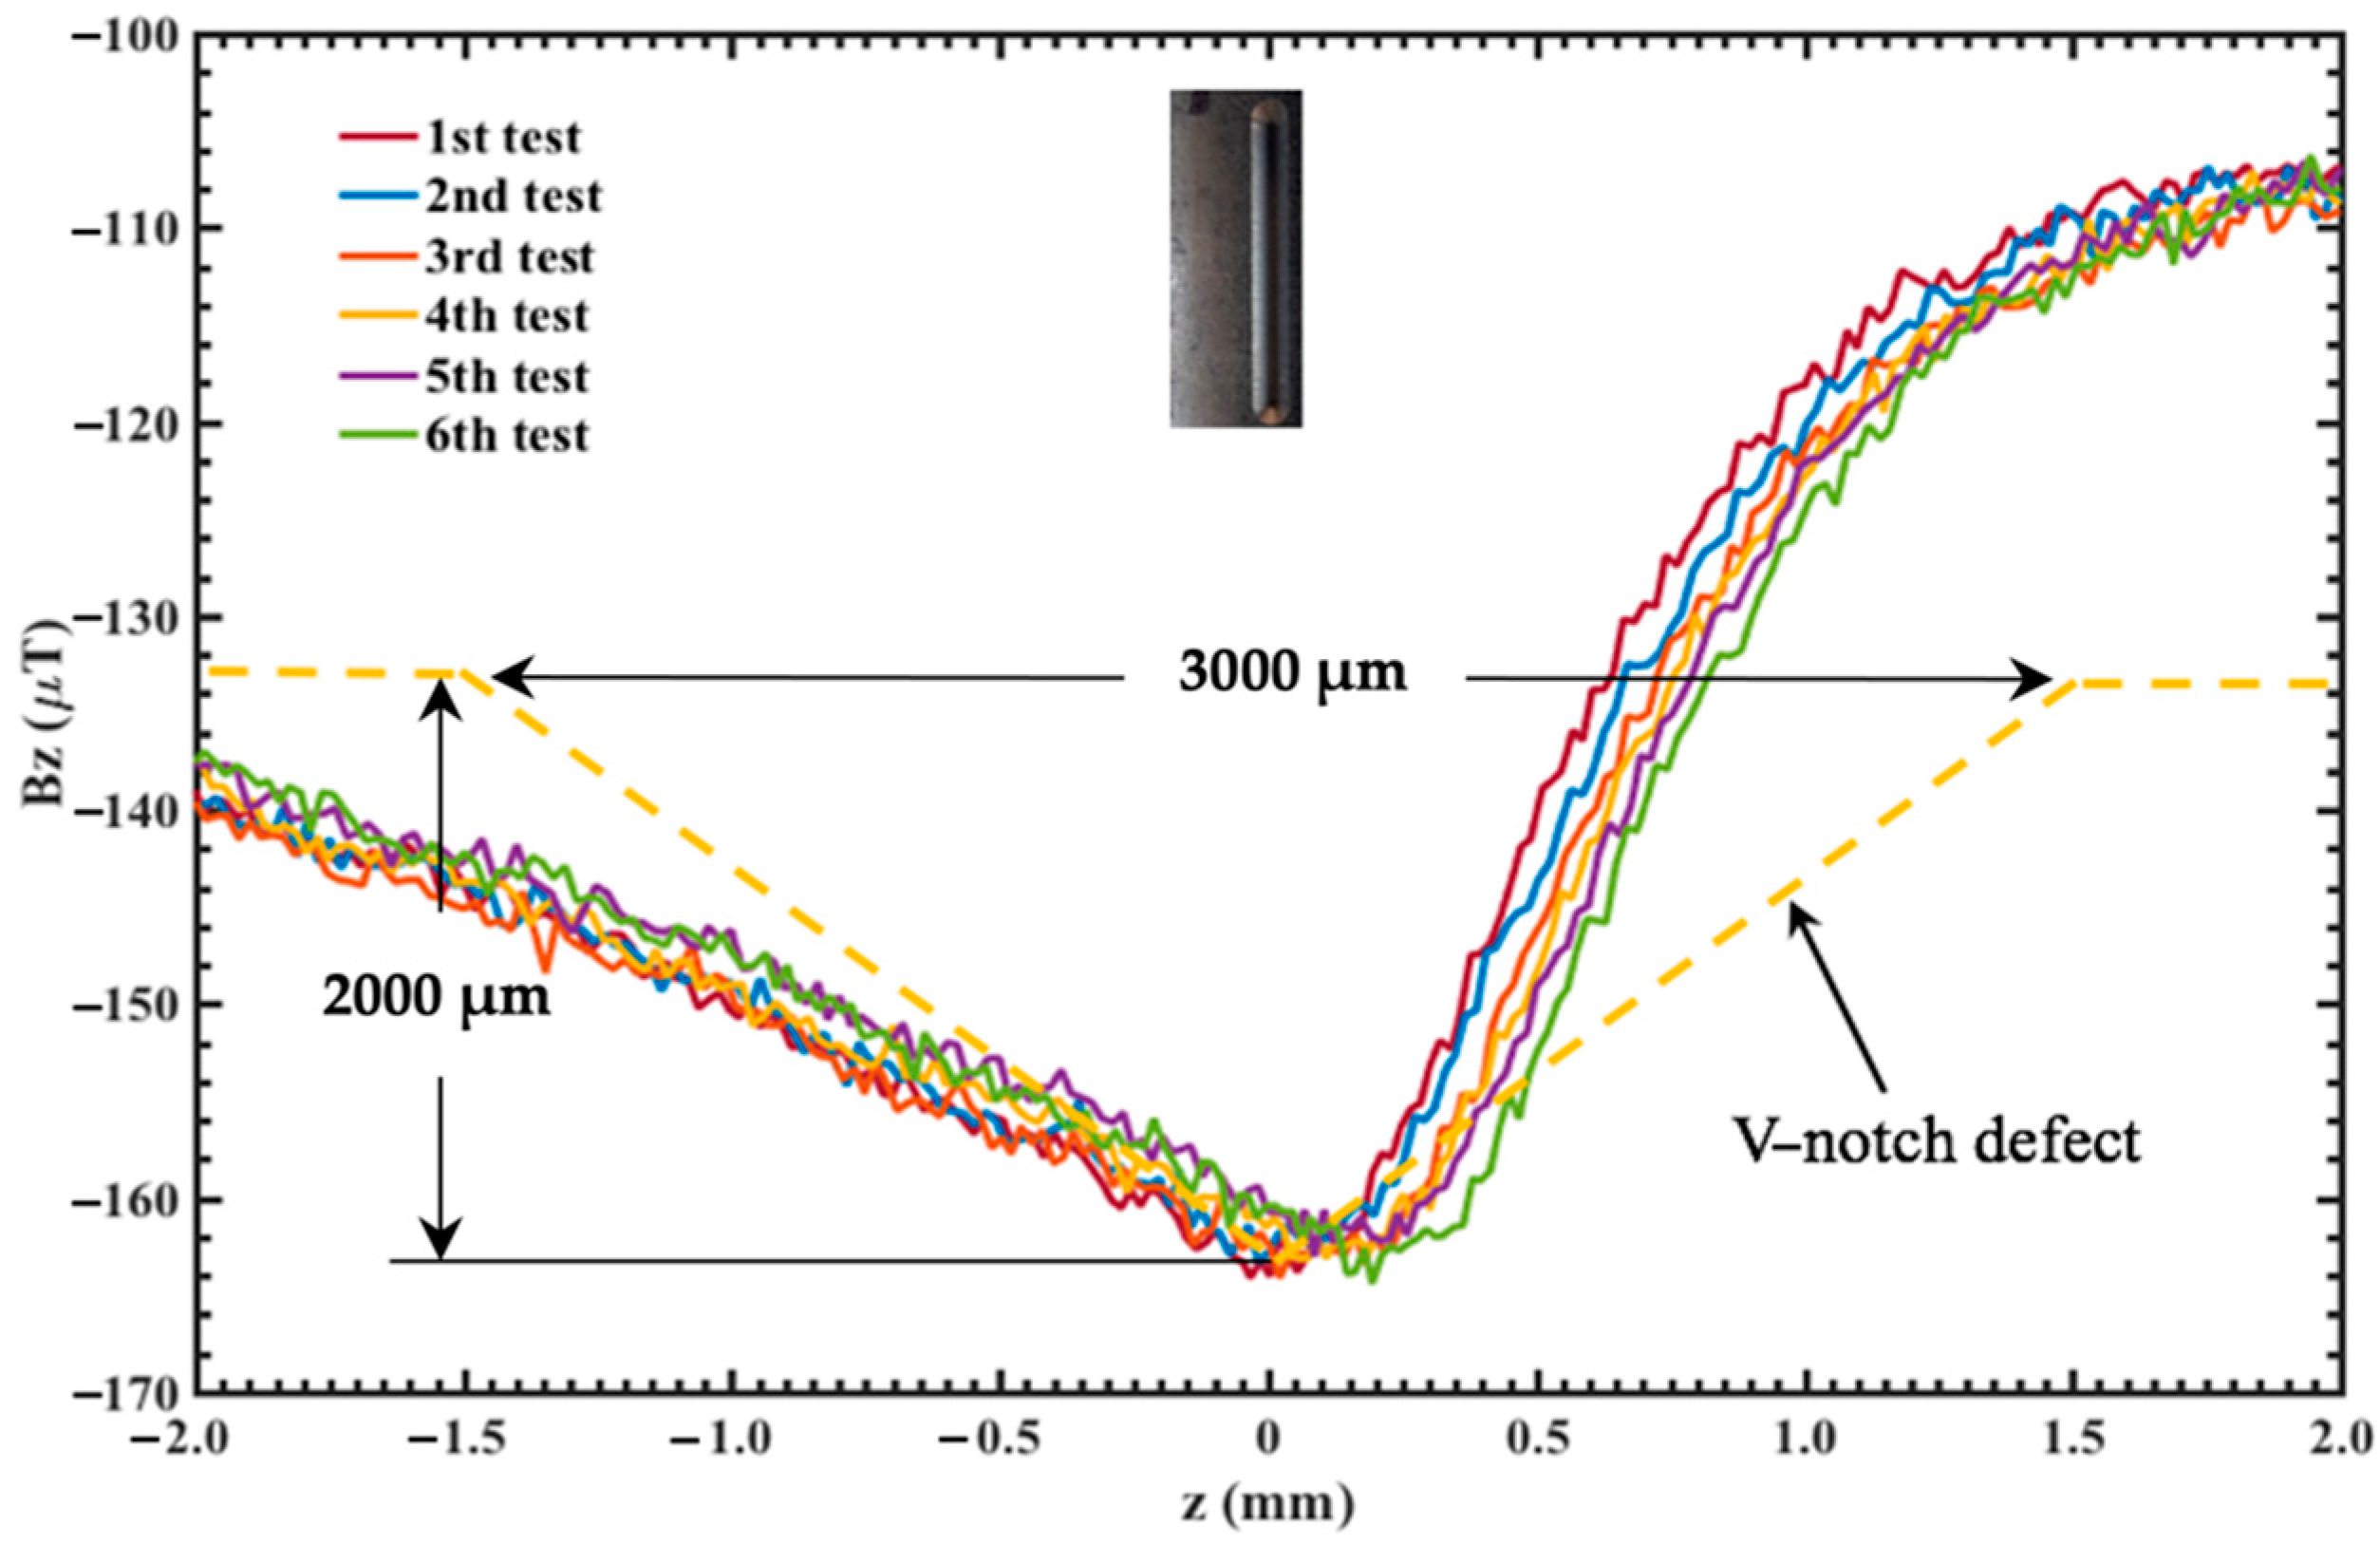
| S4 | 3000.0 | 2000.0 |
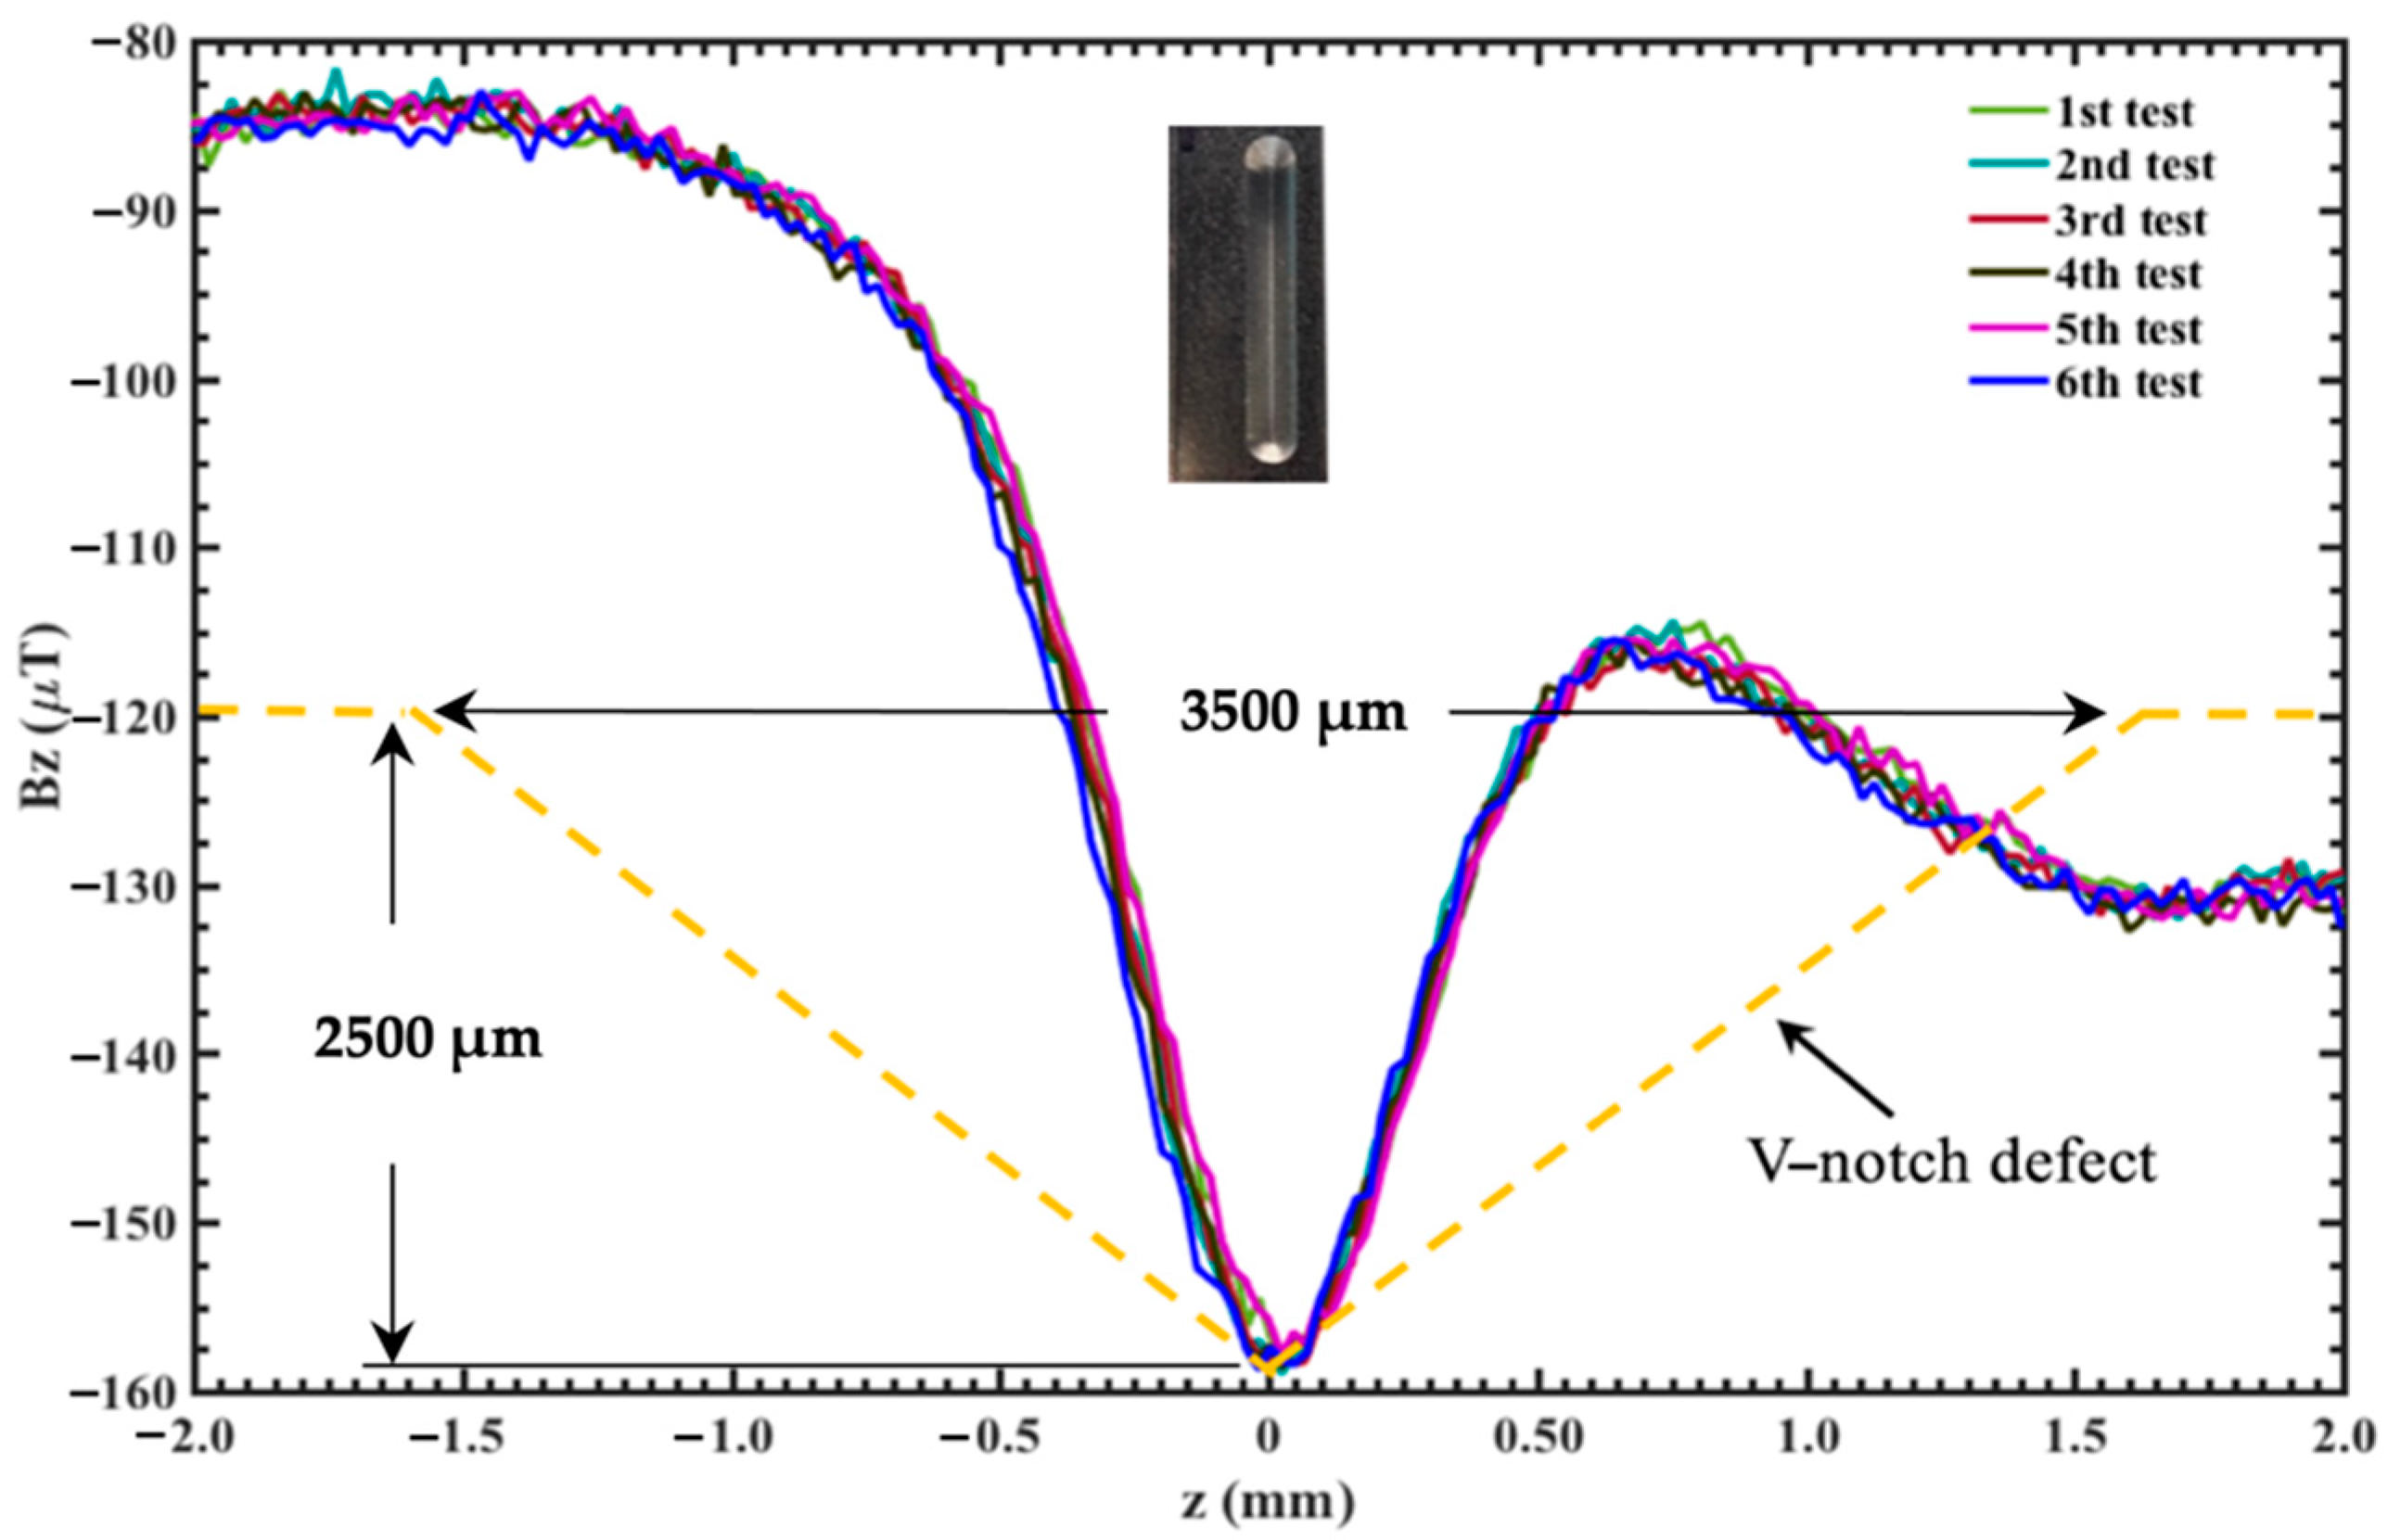
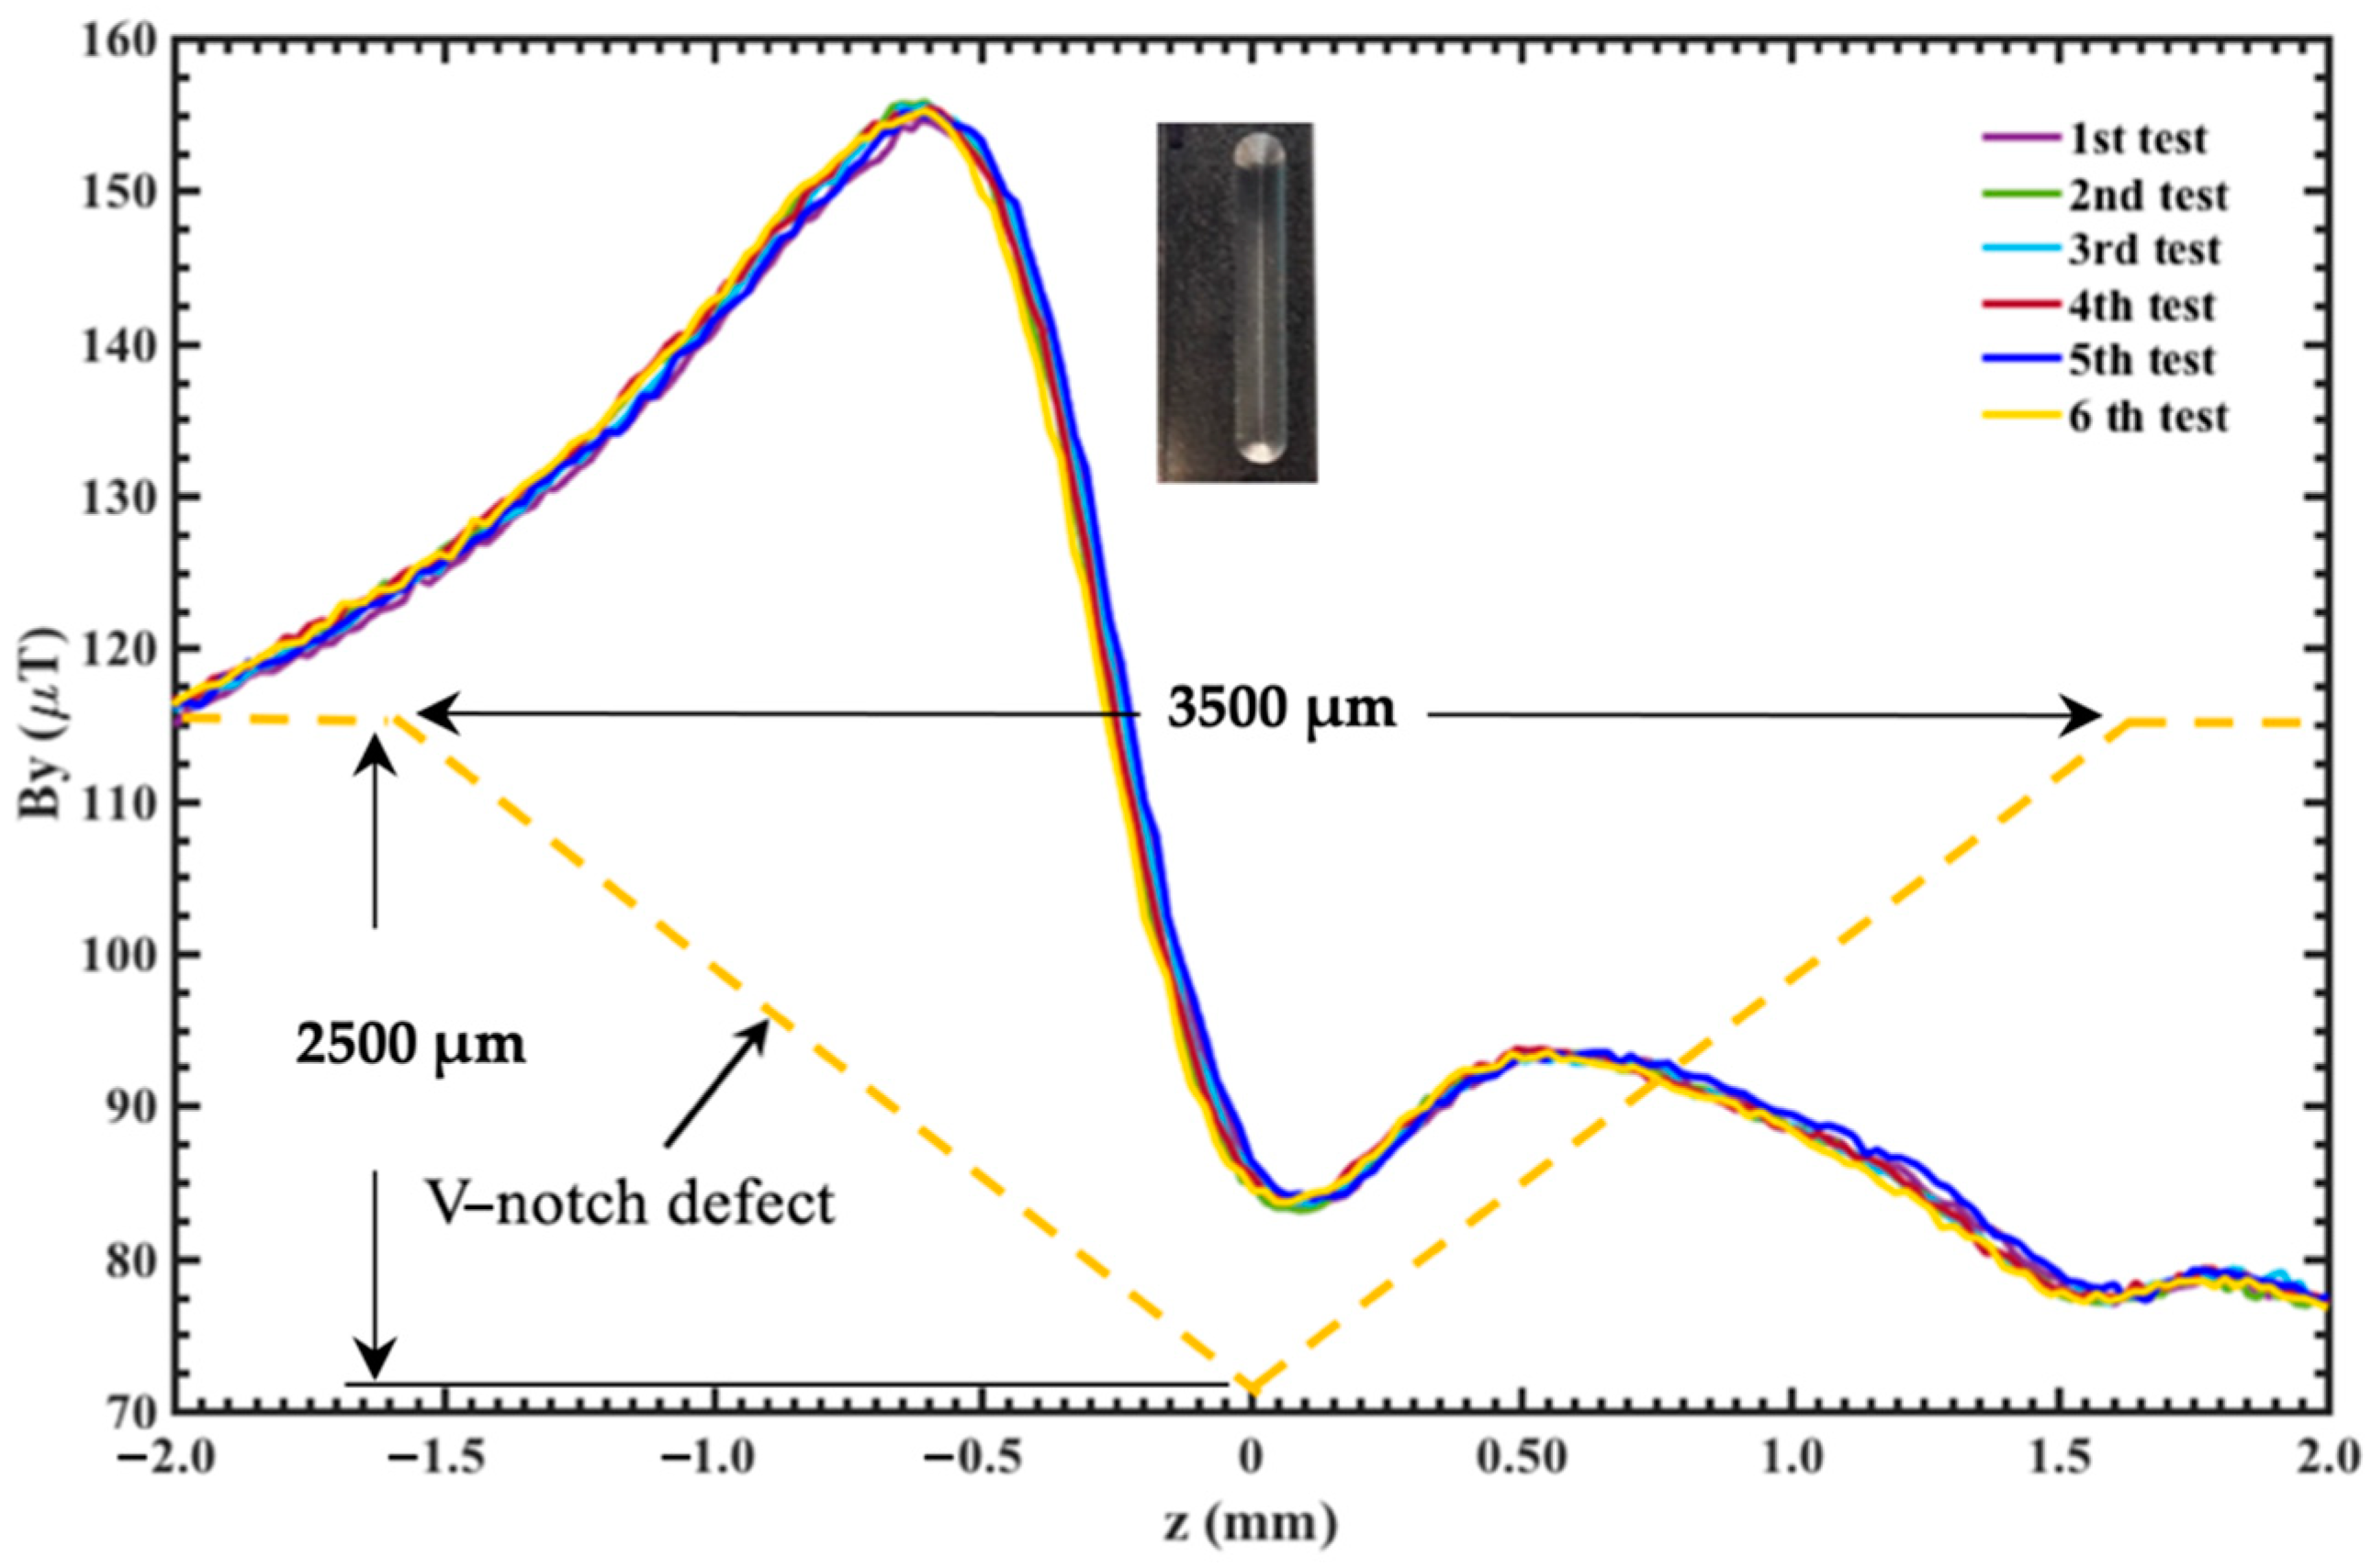
| S5 | 3500.0 | 2500.0 |
| V-Notch Defect | Minimum Tangential (Bz) MMM Signal around Notch Center (μT) | Maximum Normal (By) MMM Signal around Notch Edge (μT) | Minimum Normal (By) MMM Signal around Notch Edge (μT) |
|---|---|---|---|
| S1 | −252.8 ± 1.39 | 71.2 ± 0.66 | 43.3 ± 0.52 |
| S2 | −224.4 ± 1.31 | 113.8 ± 0.28 | 87.4 ± 0.40 |
| S3 | −202.9 ± 0.90 | 159.3 ± 0.48 | 96.7 ± 0.26 |
| S4 | −162.4 ± 1.33 | 87.1 ± 0.86 | 35.1 ± 0.30 |
| S5 | −157.3 ± 0.94 | 155.2 ± 0.43 | 83.8 ± 0.41 |
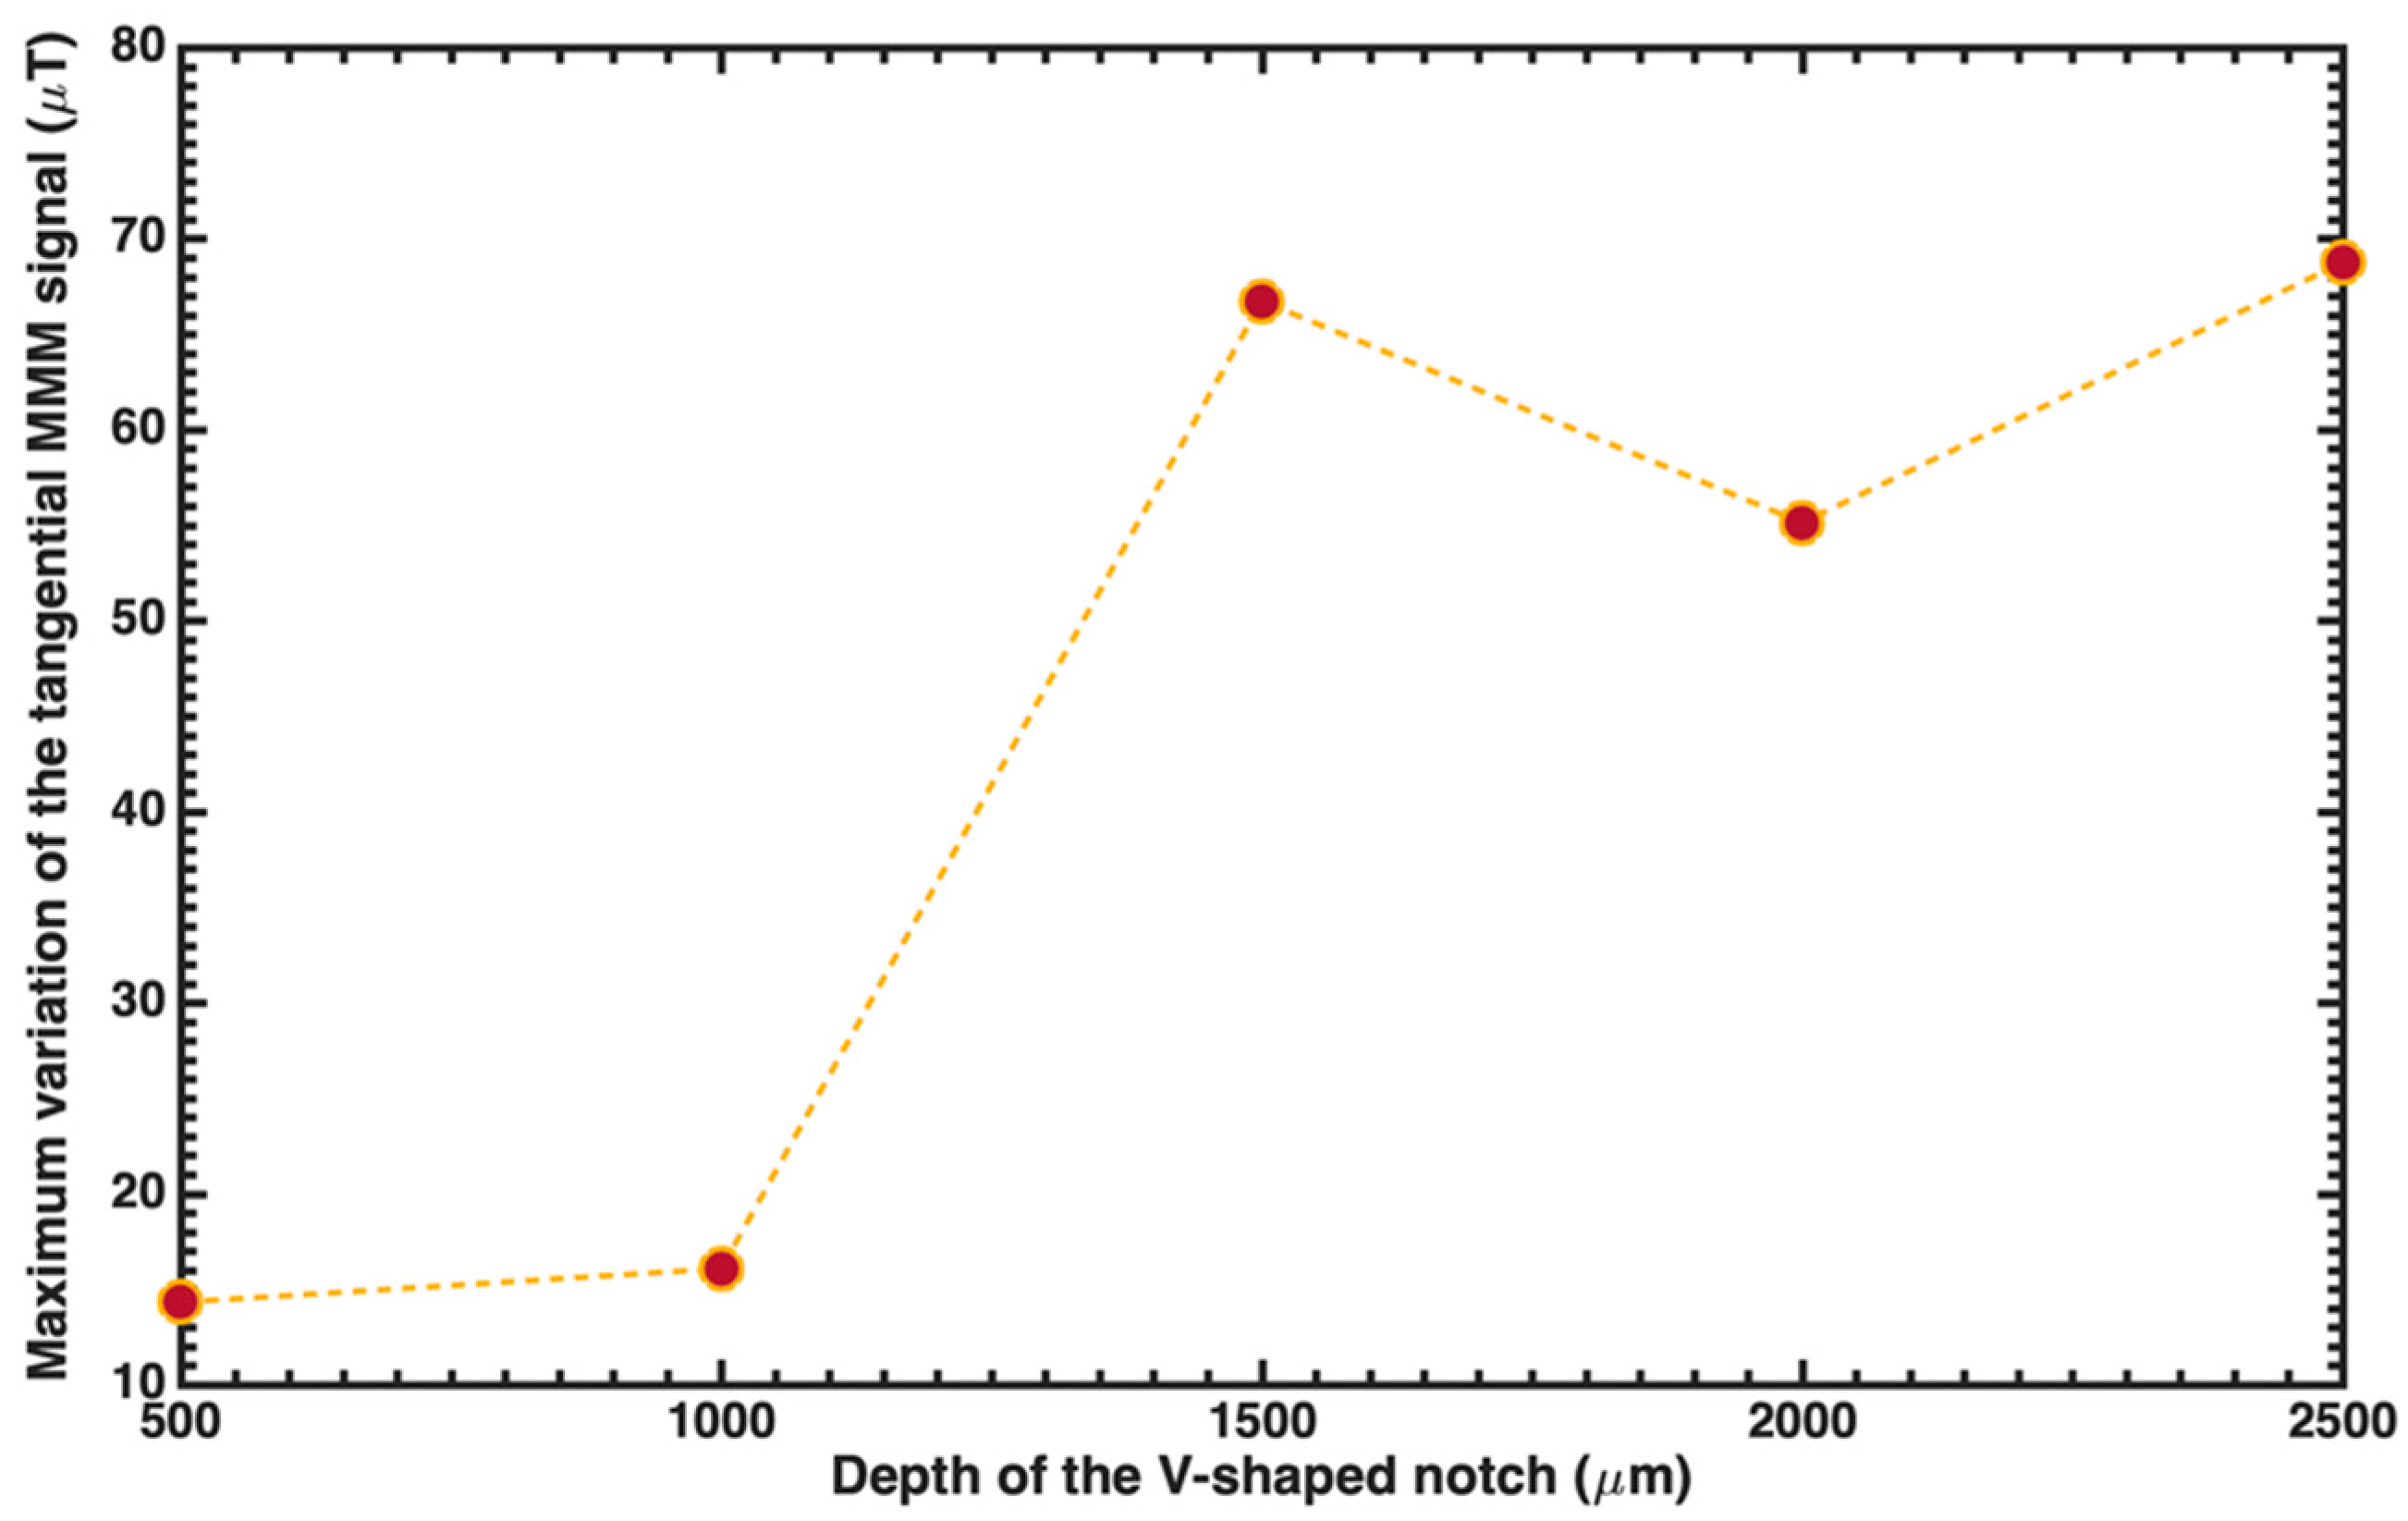
| V-Notch Defect | Maximum Variation (ΔBz) of the Tangential MMM Signal around Notch Center (μT) | Maximum Variation (ΔBy) of the Normal MMM Signal between the Edges of Notch (μT) |
|---|---|---|
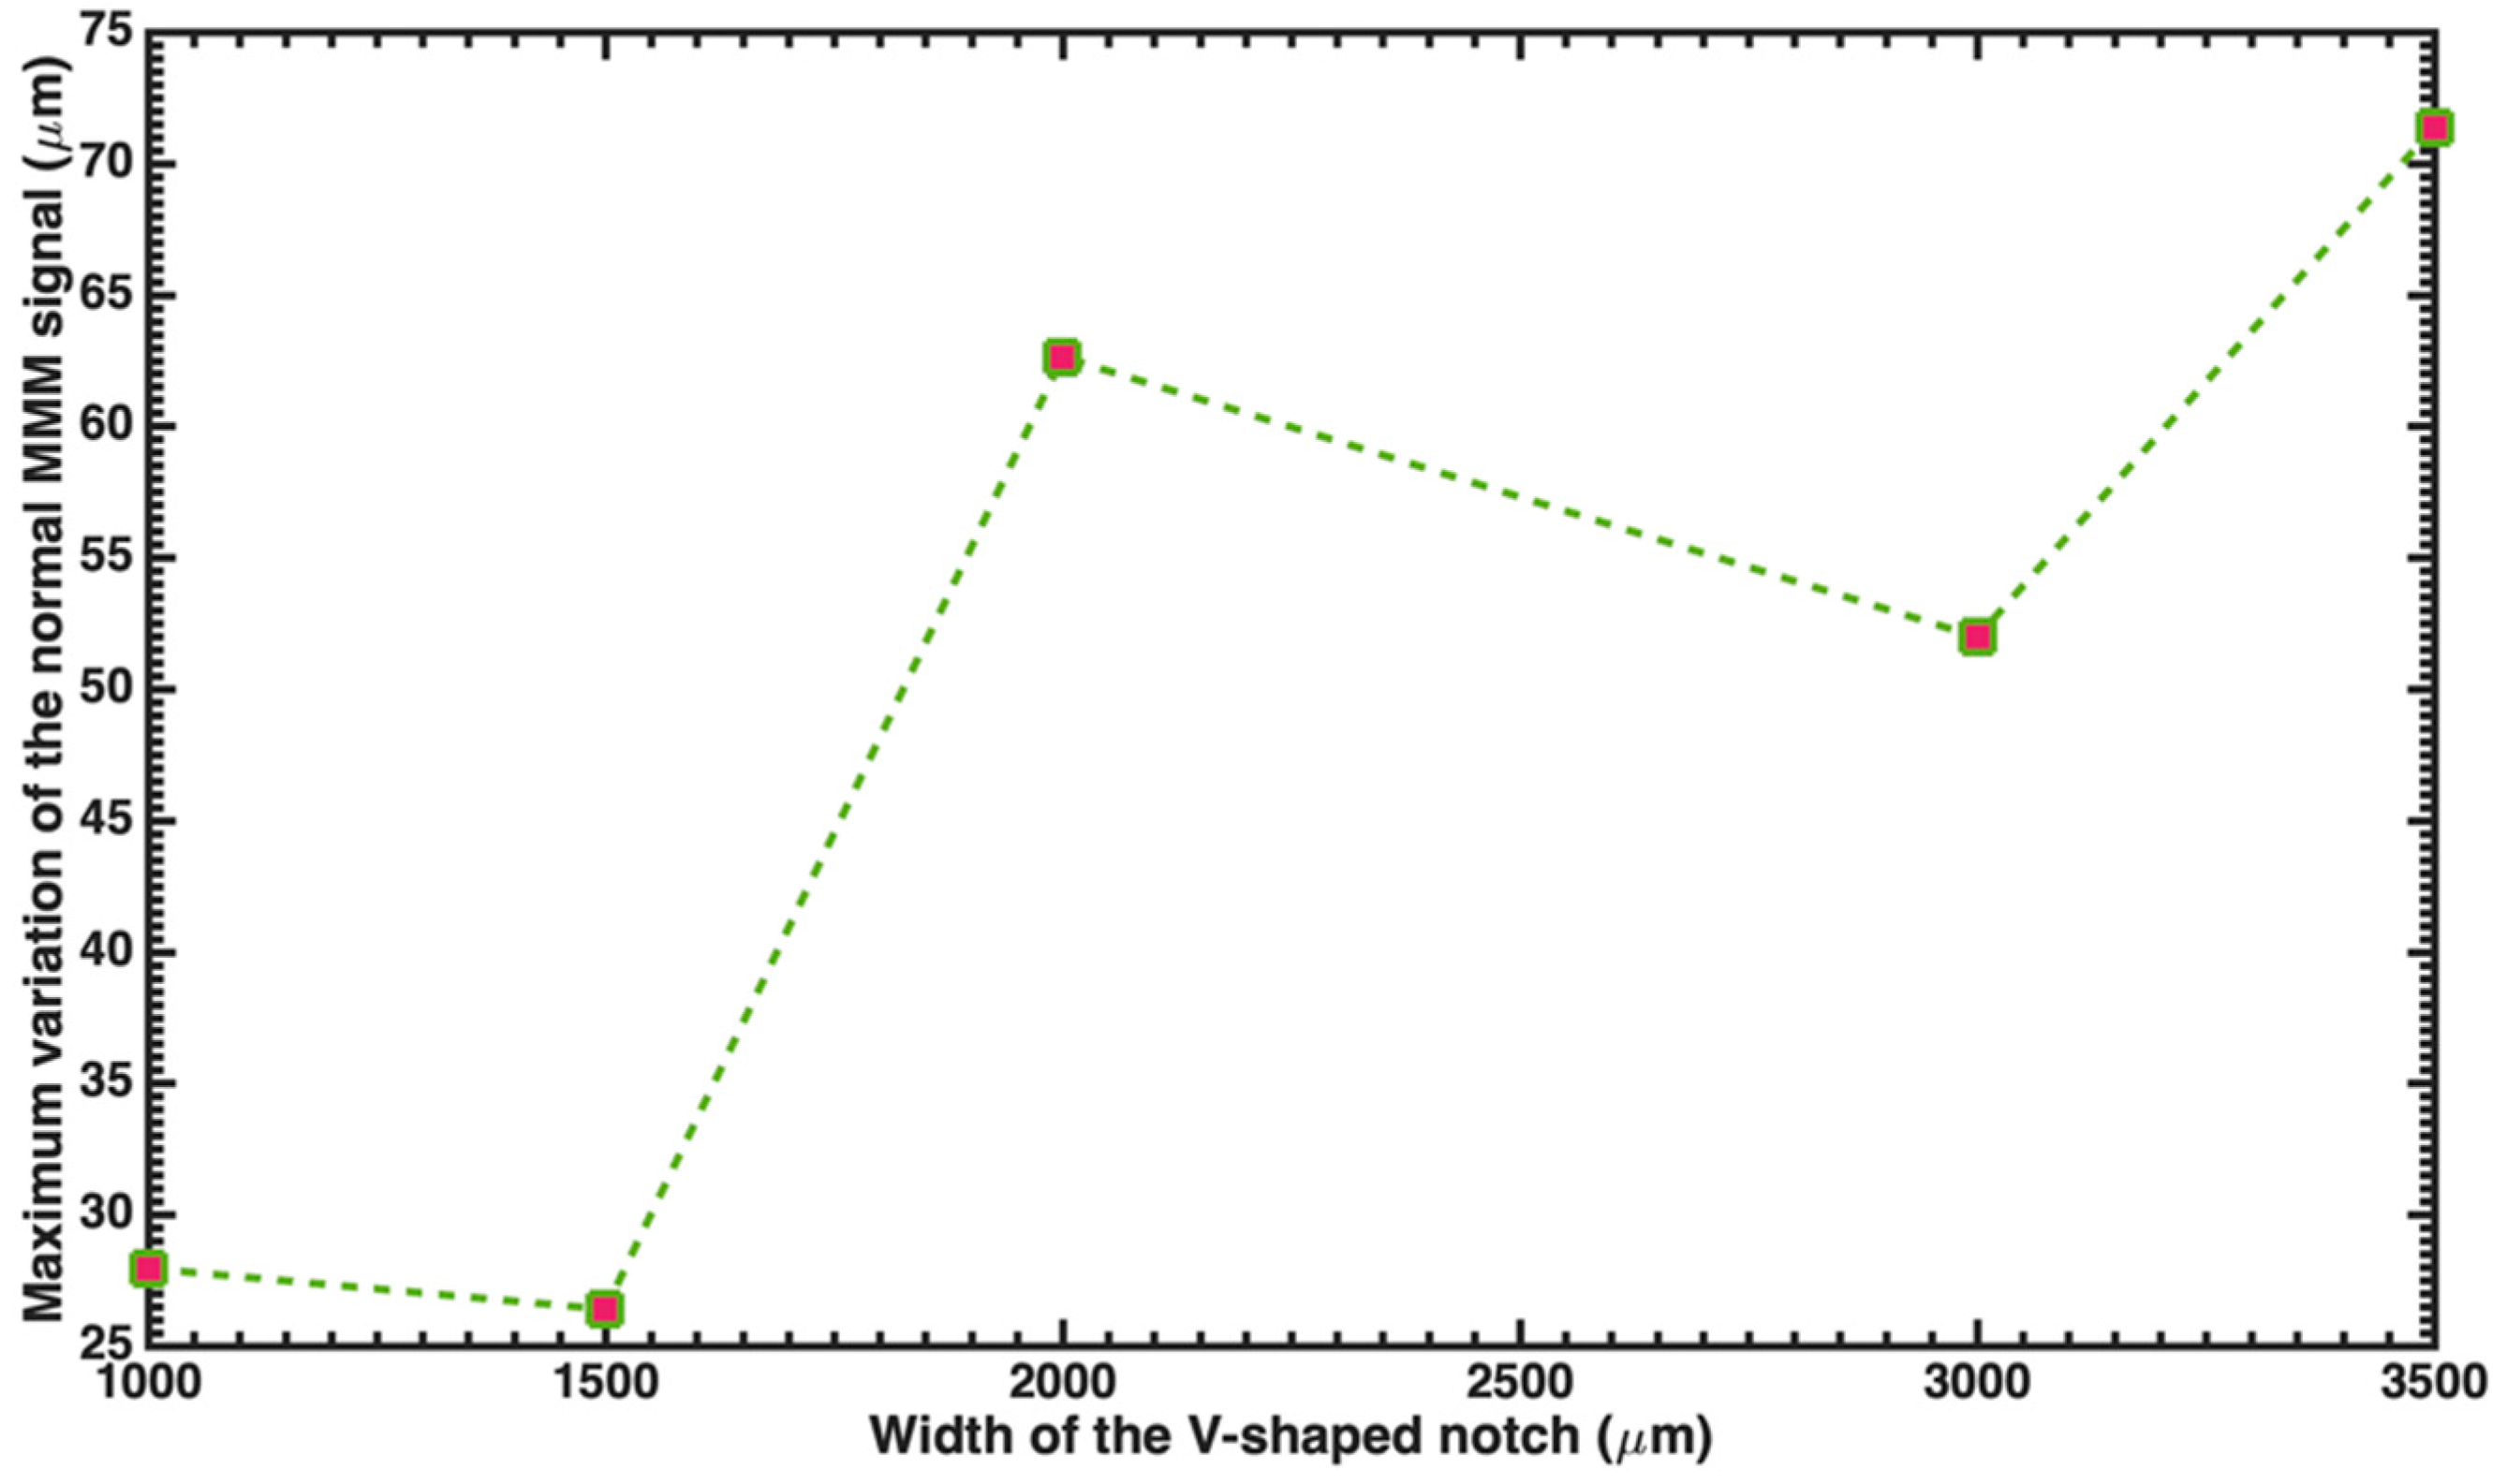
| S1 | 14.32 ± 1.62 | 27.95 ± 1.14 |
| S2 | 16.08 ± 1.86 | 26.4 ± 0.54 |
| S3 | 66.73 ± 1.13 | 62.63 ± 0.50 |
| S4 | 55.13 ± 1.33 | 51.98 ± 0.64 |
| S5 | 68.75 ± 1.10 | 71.37 ± 0.72 |
Publisher’s Note: MDPI stays neutral with regard to jurisdictional claims in published maps and institutional affiliations. |
© 2021 by the authors. Licensee MDPI, Basel, Switzerland. This article is an open access article distributed under the terms and conditions of the Creative Commons Attribution (CC BY) license (https://creativecommons.org/licenses/by/4.0/).
Share and Cite
Villegas-Saucillo, J.J.; Díaz-Carmona, J.J.; Escarola-Rosas, M.A.; Vázquez-Leal, H.; Martínez-Castillo, J.; Herrera-May, A.L. Measurements of the Magnetic Field Variations Related with the Size of V-Shaped Notches in Steel Pipes. Appl. Sci. 2021, 11, 3940. https://doi.org/10.3390/app11093940
Villegas-Saucillo JJ, Díaz-Carmona JJ, Escarola-Rosas MA, Vázquez-Leal H, Martínez-Castillo J, Herrera-May AL. Measurements of the Magnetic Field Variations Related with the Size of V-Shaped Notches in Steel Pipes. Applied Sciences. 2021; 11(9):3940. https://doi.org/10.3390/app11093940
Chicago/Turabian StyleVillegas-Saucillo, J. Jesús, José Javier Díaz-Carmona, Marco A. Escarola-Rosas, Héctor Vázquez-Leal, Jaime Martínez-Castillo, and Agustín L. Herrera-May. 2021. "Measurements of the Magnetic Field Variations Related with the Size of V-Shaped Notches in Steel Pipes" Applied Sciences 11, no. 9: 3940. https://doi.org/10.3390/app11093940
APA StyleVillegas-Saucillo, J. J., Díaz-Carmona, J. J., Escarola-Rosas, M. A., Vázquez-Leal, H., Martínez-Castillo, J., & Herrera-May, A. L. (2021). Measurements of the Magnetic Field Variations Related with the Size of V-Shaped Notches in Steel Pipes. Applied Sciences, 11(9), 3940. https://doi.org/10.3390/app11093940