
Optimization Design of Step Stress Accelerated Degradation Test for Motorized Spindle Based on Ds-Optimality

 ,
,
Abstract
:1. Introduction
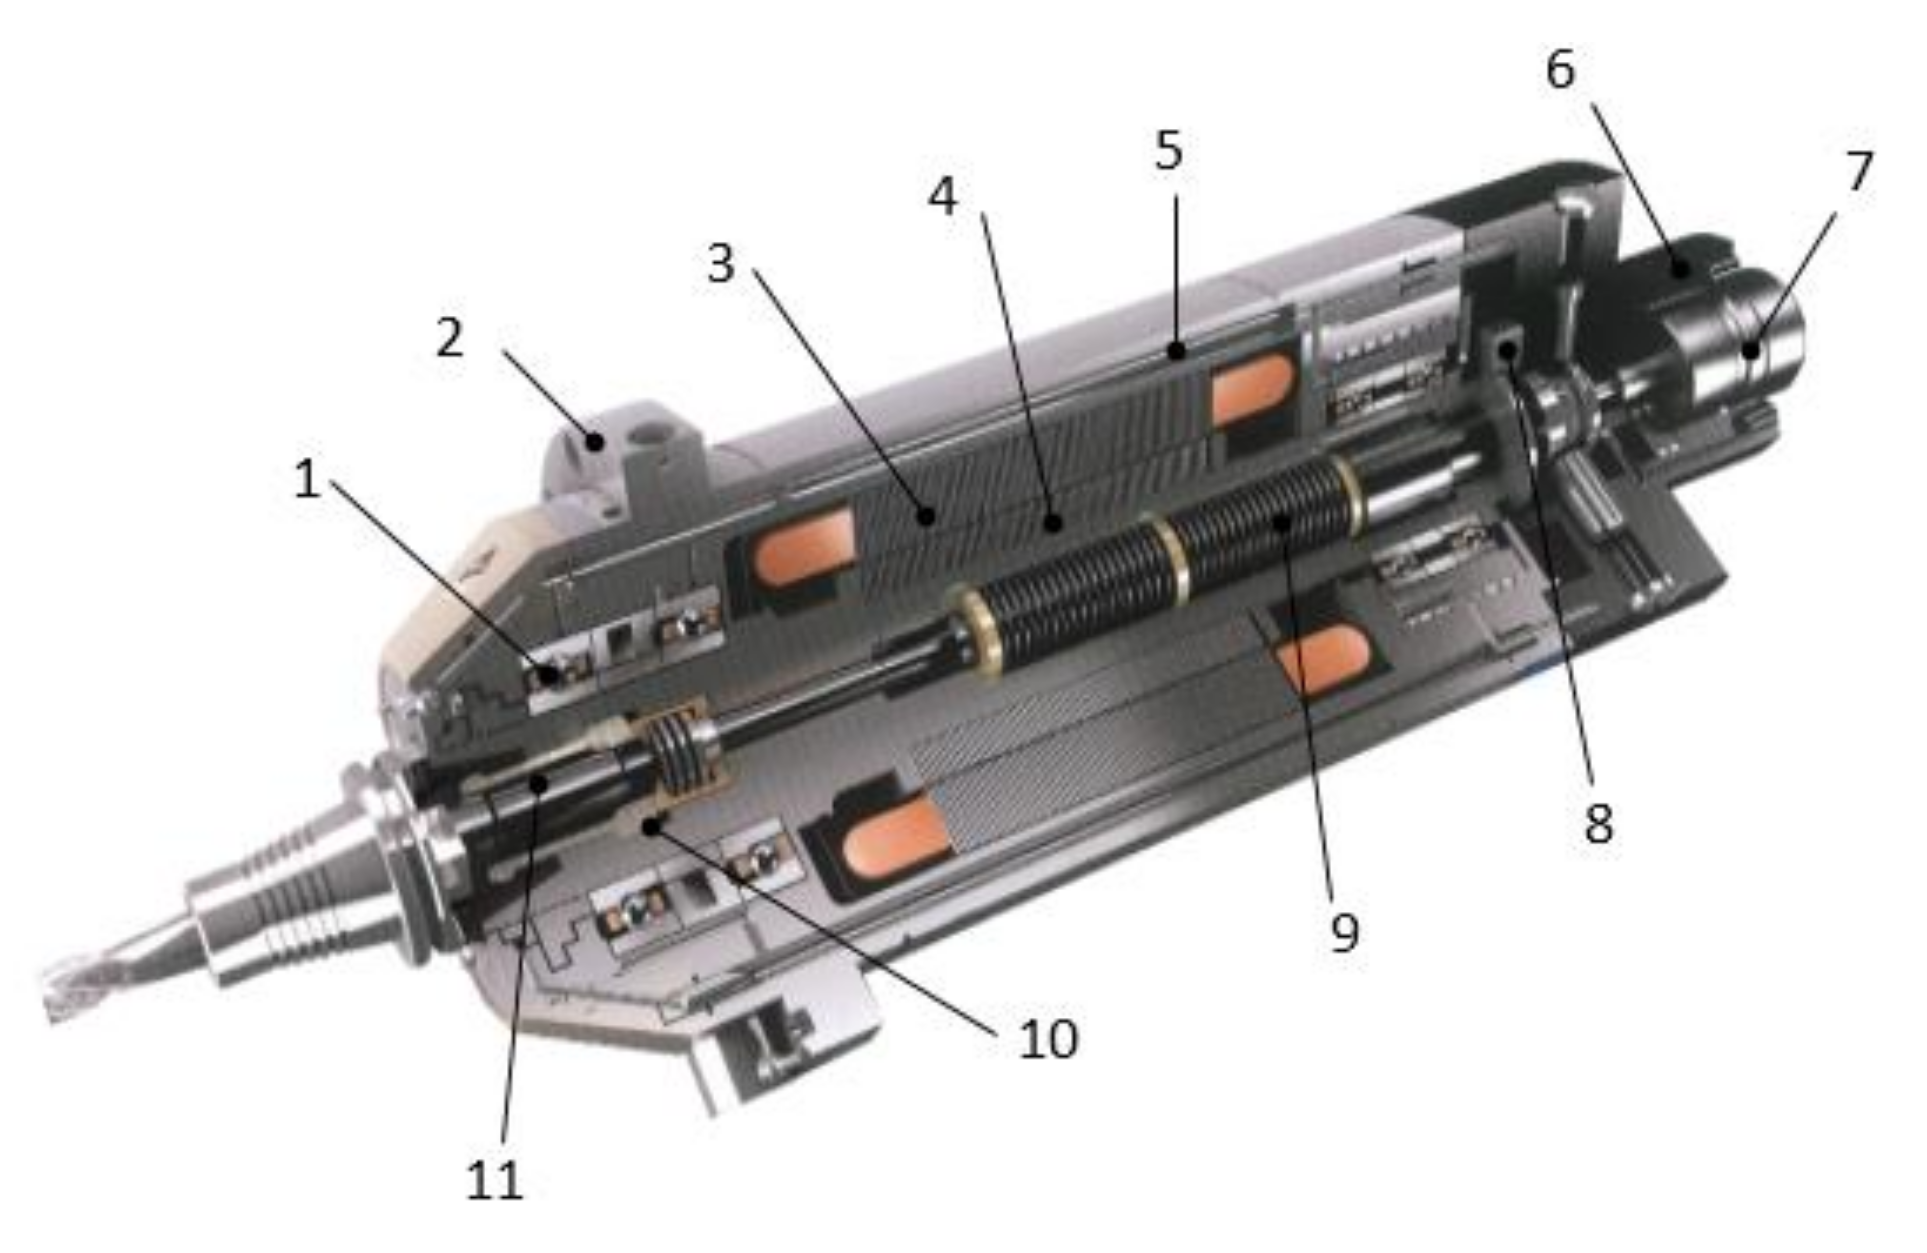
2. SSADT Analysis of Motorized Spindle
2.1. SSADT Profile Analysis
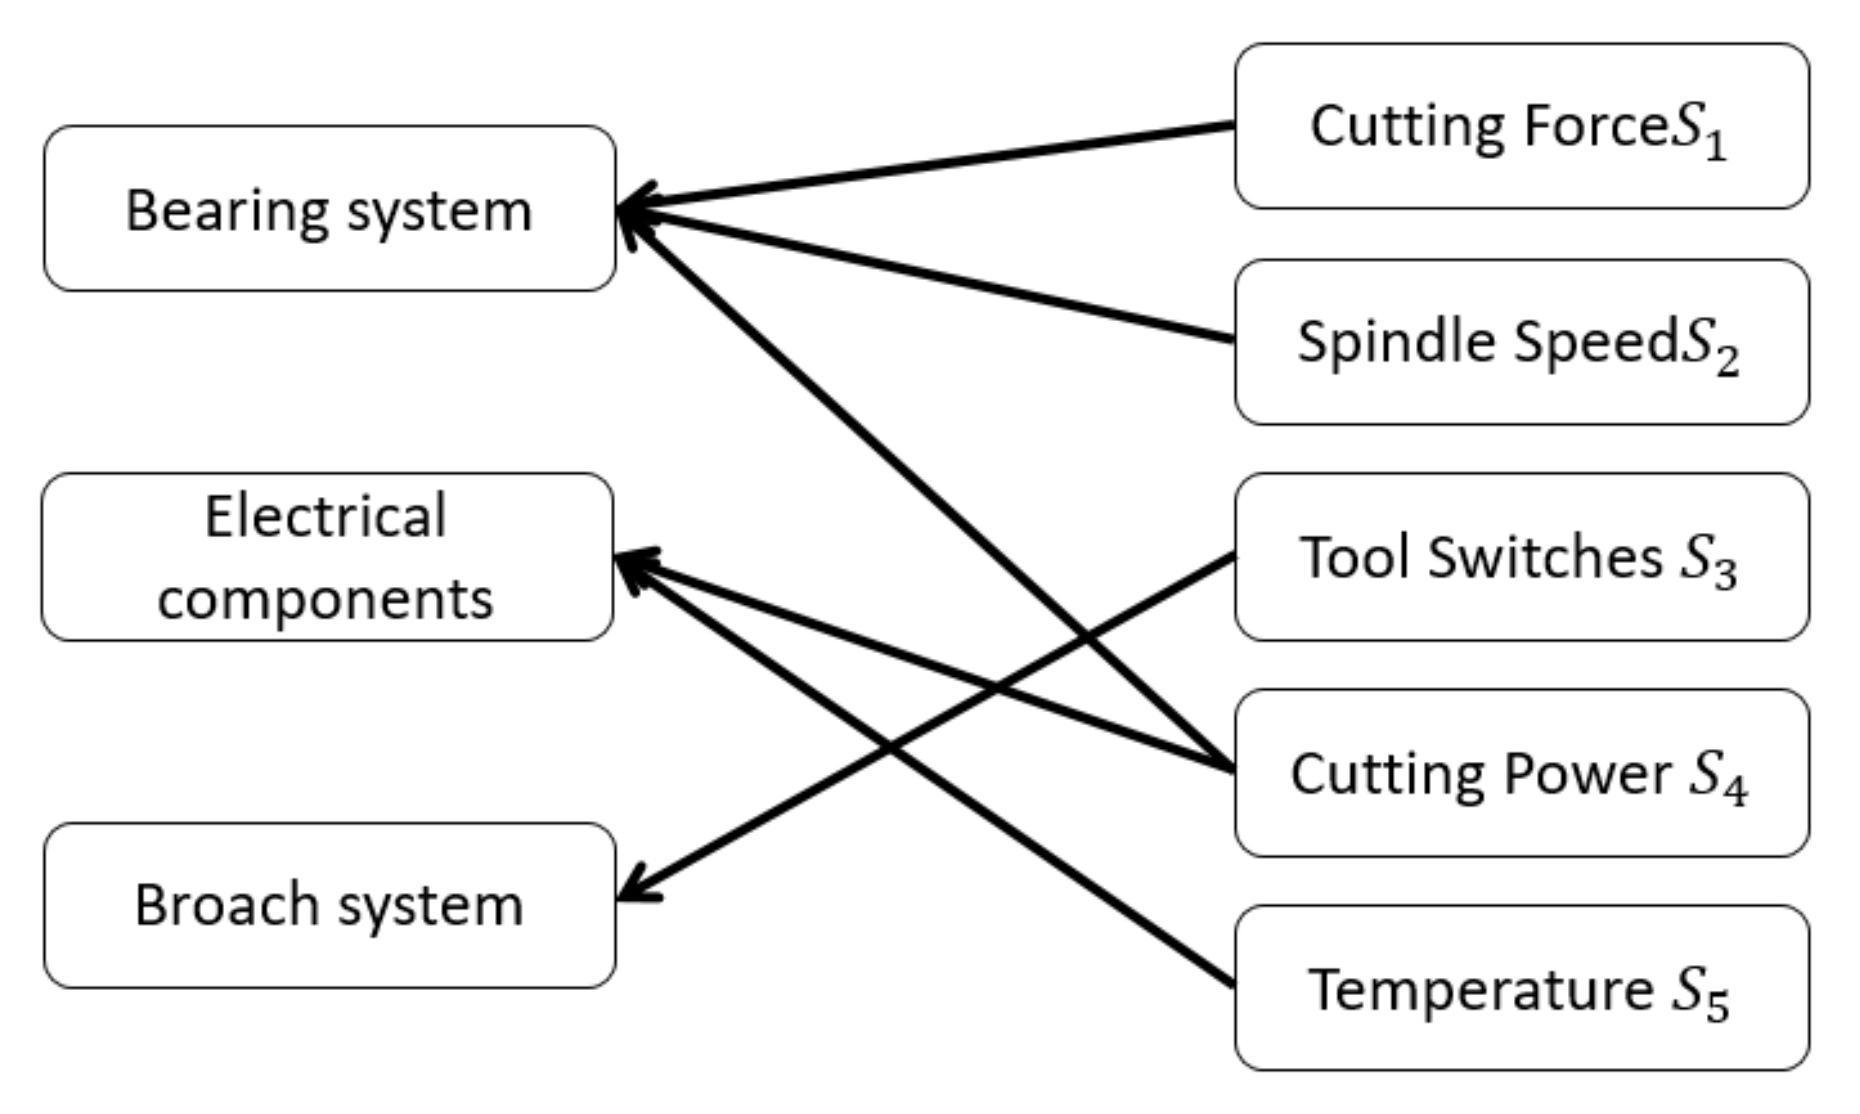
2.2. SSADT Stress Analysis
3. Performance Degradation and Acceleration Model of Motorized Spindle
3.1. Degradation Model
3.2. Acceleration Model
4. Optimal Design
4.1. Optimization Objective
4.2. Optimization Variables and Constraint Conditions
4.2.1. Optimization Variables
- Stress levels and their combinations [(),…, ()];
- Sample size under the stress level ;
- Inspection times under the stress level .
4.2.2. Constraint Conditions
- , is the normal stress when the motorized spindle is working, and is the ultimate stress when the motorized spindle is working. The ultimate stress can be obtained through the technical requirements of the motorized spindle, and then the highest stress is selected according to the ultimate stress so as to ensure that the failure mechanism of the motorized spindle remains unchanged at all stress levels;
- Inspection times , , the degradation of motorized spindle is a slow process. In order to ensure the regression fitting accuracy of degradation, the inspection times under each stress level should not be less than 10; under the premise of unchanged failure mechanism, the degradation rate of motorized spindle will accelerate with the increase of stress. In order to collect enough degradation information under each stress level, the inspection times under low stress level should be more than high Stress level.
- , in order to ensure the statistical significance of the data obtained in the test, the number of test samples under each stress should not be less than 5.
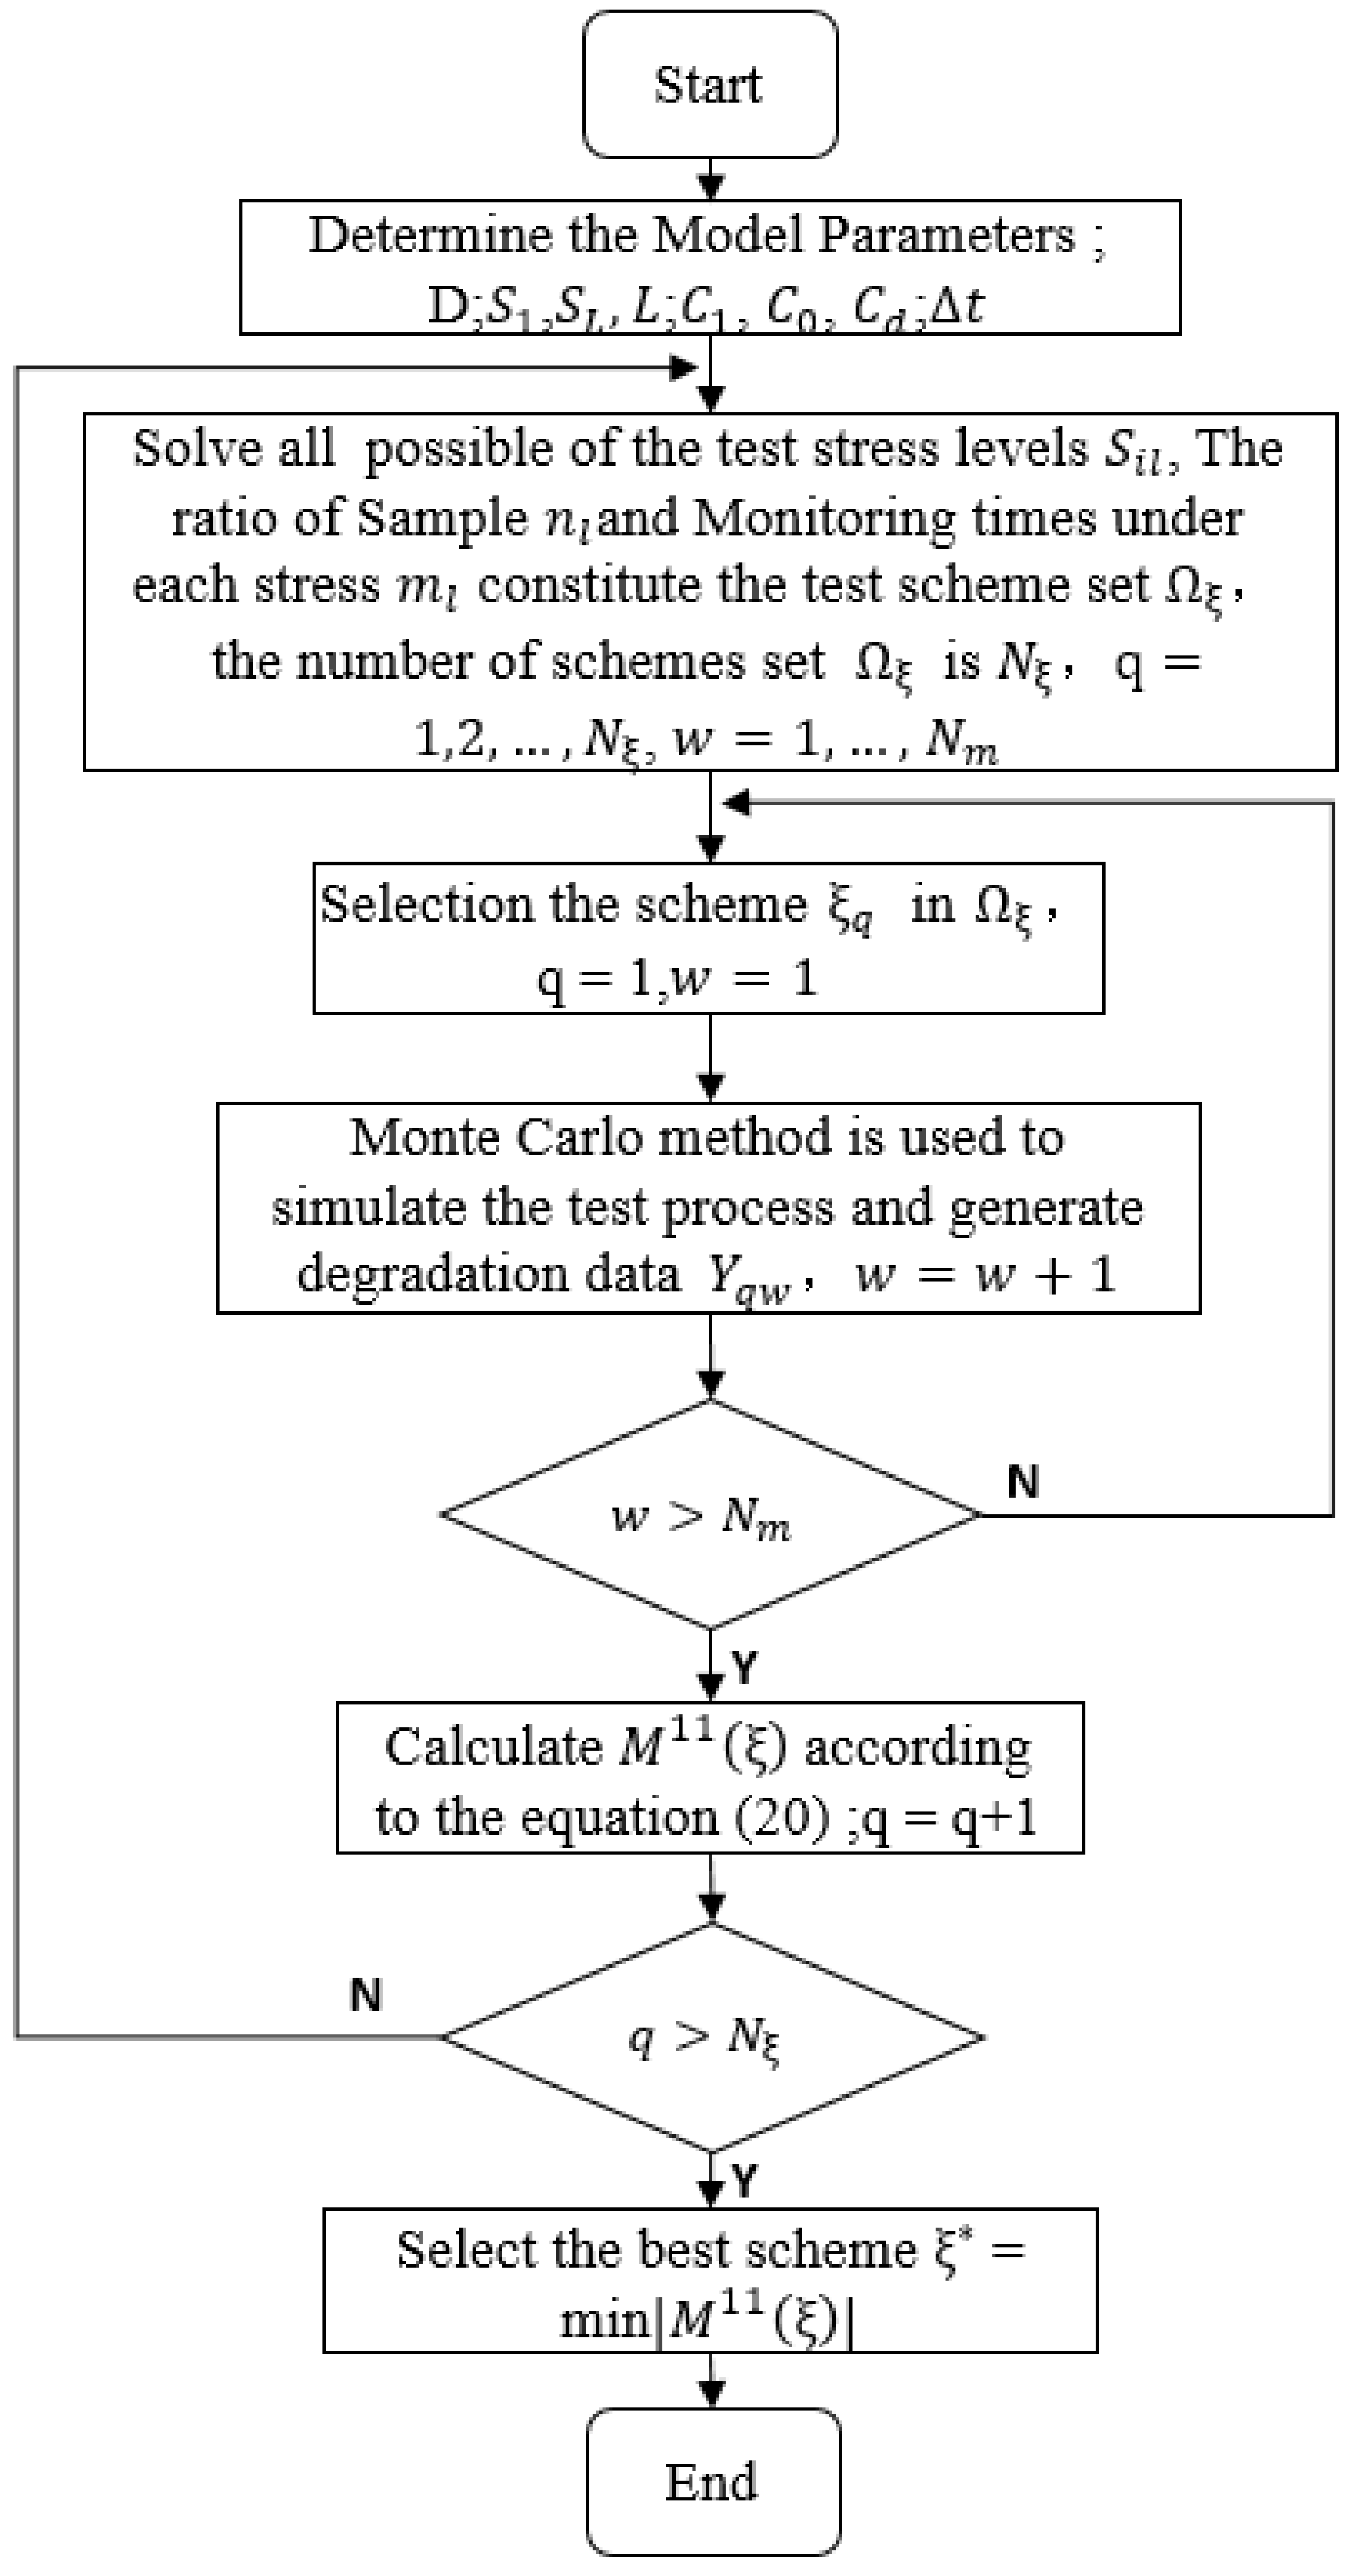
4.3. Optimal Process
- According to the historical data, engineering experience and other information, the parameters of the model, the degradation threshold of the motorized spindle performance [37], the initial stress and the maximum stress of the motorized spindle test, the number of test stress levels , the total test cost , the test cost per unit time , the unit price of motorized spindle sample and the inspection interval are determined;
- The test stress level combination , sample ratio and monitoring times under each stress were solved which satisfied the constraints, then the results of them constitute test scheme set . = , , is the total number of schemes in the scheme set;
- Select a scheme from scheme set ;
- According to Equation (13), the performance degradation data of motorized spindle is simulated using the Monte Carlo method for times;
- The information matrix of degradation data of each simulation is calculated;
- According to Equation (20), the objective function value of the scheme is calculated;
- Repeat steps 3–6 to calculate the objective function for all schemes in the scheme set;
- The scheme with the minimum objective function is selected as the optimal scheme.
5. Case Study
5.1. A Case Study of Motorized Spindle
5.2. An Extended Case Study
6. Sensitivity Analysis
7. Conclusions
- In this paper, under the constraint of the test cost and the actual range of test variables, taking the test stress levels , sample size and inspection times as optimization variables, the optimization design of multi stress step accelerated degradation test scheme for a motorized spindle is carried out. When the objective function is established, the exhaustive method is used to solve the set of alternatives to avoid the wrong optimal solution caused by improper setting of the initial conditions of the optimization algorithm. By solving all possible combinations of stress levels under different sample sizes, it is concluded that the optimal combination of stress levels with different quantities of samples is the same under the constraint conditions.
- The drift Brownian motion is used to model the accelerated degradation process of motorized spindle under multiple stresses. By selecting the main test stress and inspection indexes of the motorized spindle, the minimum estimation variance of main stress affecting the motorized spindle is taken as the optimization objective (i.e., ), the optimization algorithm steps and detailed flow chart are given. Taking the accelerated degradation test of motorized spindle under two stresses as an example, the optimized test scheme is obtained, and compared with the traditional -optimality optimization, the objective function value of the test scheme optimized by -optimality is calculated under -optimality, and the objective function value is only 18.5% lower than that of the optimal scheme optimized by -optimality. Through an extended case study, it is concluded that when the proposed method is used to optimize the test scheme, the determinant value of the variance matrix of the main stress parameters is 0.59 times of that under -optimality. It shows that this method can not only improve the evaluation accuracy of main stress parameters, but also ensure the evaluation accuracy of other stress parameters.
- By analyzing the influence of the initial model parameter deviation on the optimization results, it is concluded that the optimization design method proposed in this paper has good stability. Since this method is based on the optimization criteria of model parameters, the range of main model parameters should be as small as possible before the test, so as to improve the accuracy of reliability evaluation of the optimized accelerated test scheme.
Author Contributions
Funding
Institutional Review Board Statement
Informed Consent Statement
Acknowledgments
Conflicts of Interest
References
- Yang, Z.J.; Chen, C.H.; Chen, F.; Li, G.F. Progress in the Research of Reliability Technology of Machine Tools. J. Mech. Eng. 2013, 49, 130–139. [Google Scholar] [CrossRef]
- Luis, A.E.; William, Q.M. A Review of Accelerated Test Models. Stat. Sci. 2006, 21, 552–577. [Google Scholar]
- Nelson, W. Analysis of performance degradation data from accelerated tests. IEEE Trans. Reliab. 1981, 30, 149–154. [Google Scholar] [CrossRef]
- Nelson, W. Accelerated Testing: Statistical Methods, Test Plans, and Data Analysis, 1st ed.; John Wiley Press: New York, NY, USA, 1990; pp. 79–120. [Google Scholar]
- Yang, G. Optimum degradation tests for comparison of products. IEEE Trans. Reliab. 2012, 61, 220–226. [Google Scholar] [CrossRef]
- Chernoff. Optimal Accelerated Life Designs For Estimation. Technometrics 1962, 4, 381–409. [Google Scholar] [CrossRef]
- Nelson, W.; Kielpinski, T.J. Theory for optimum censored accelerated life testing for normal and lognormal life distributions. Technometrics 1976, 18, 105–114. [Google Scholar] [CrossRef]
- Nelson, W.; Meeker, W.Q. Theory for optimum accelerated censored life testing for Weibull and extreme value life Distributions. Technometrics 1978, 20, 171–177. [Google Scholar] [CrossRef]
- Kielpinski, T.J.; Nelson, W. Optimum censored accelerated lifetesting for normal and lognormal life distributions. IEEE Trans. Reliab. 1975, 24, 310–320. [Google Scholar] [CrossRef]
- Meeker, W.Q.; Nelson, W. Optimum accelerated censored lifetesting for Weibull and extreme value life distributions. IEEE Trans. Reliab. 1975, 24, 321–332. [Google Scholar] [CrossRef]
- Meeker, W.Q. A comparison of accelerated life test plans for Weibull and lognormal distributions and type I censoring. Technometrics 1984, 26, 157–171. [Google Scholar] [CrossRef]
- Park, J.W.; Yum, B.J. Optimal design of accelerated life tests with two stresses. Naval Res. Logist. 1996, 43, 863–884. [Google Scholar] [CrossRef]
- Elsayed, E.A.; Zhang, H. Design of PH-based accelerated life testing plans under multiple-stress-type. Relia. Eng. Syst. Saf. 2007, 92, 286–292. [Google Scholar] [CrossRef]
- Hu, C.H.; Lee, M.Y.; Tang, J. Optimal Step-stress accelerated degradation test for Wiener degradation process under constraints. Eur. J. Oper. Res. 2015, 241, 412–421. [Google Scholar] [CrossRef]
- Lim, H.S.; Yum, B.J. Optimal design of accelerated degradation tests based on Wiener process models. J. Appl. Stat. 2011, 38, 309–325. [Google Scholar] [CrossRef]
- Ge, Z.Z.; Li, X.Y.; Zhang, J.R.; Jiang, T.M. Planning of Step-Stress Accelerated Degradation Test with Stress Optimization. Adv. Mater. Res. 2010, 118–120, 404–408. [Google Scholar] [CrossRef]
- Tsai, T.R.; Sung, W.Y.; Lio, Y.L.; Shing, I.C.; Lu, J.C. Optimal Two-Variable Accelerated Degradation Test Plan for Gamma Degradation Processes. IEEE Trans. Reliab. 2016, 65, 459–468. [Google Scholar] [CrossRef]
- Tung, H.P.; Tseng, S.T. Planning gamma accelerated degradation tests with two accelerating variables. Naval Res. Logist. 2019, 66, 439–447. [Google Scholar] [CrossRef]
- Mosavebi, O.E.; Shemehsavar, S. Optimal Design for Accelerated Degradation Test Based on D-Optimality. Iran. J. Sci. Technol. Trans. A Sci. 2018, 43, 1811–1818. [Google Scholar]
- Sung, S.I.; Yum, B.J. Optimal design of step-stress accelerated degradation tests based on the Wiener degradation process. Qual. Technol. Quant. Manag. 2016, 13, 367–393. [Google Scholar] [CrossRef]
- Li, X.Y.; Hu, H.Y.; Li, R.Q.; Liu, L. Bayesian optimal design of sequential stress accelerated degradation testing. In Proceedings of the 2016 Prognostics and System Health Management Conference (PHM-Chengdu), Chengdu, China, 19–21 October 2016; pp. 1–6. [Google Scholar]
- Wang, Y.S.; Zhang, C.H.; Zhang, S.F.; Chen, X.; Tan, Y.Y. Optimal design of constant stress accelerated degradation test plan with multiple stresses and multiple degradation measures. Proc. IMechE Part O J. Risk Reliab. 2015, 229, 83–93. [Google Scholar] [CrossRef]
- Wang, Y.; Zhang, C.; Chen, X. Study of simulationbased optimal design for degradation test. Astronaut 2008, 29, 380–384. [Google Scholar]
- Li, X.Y.; Hu, H.Q.; Sun, F.Q.; Kang, R. A Bayesian optimal design for sequential accelerated degradation testing. Entropy 2017, 19, 325. [Google Scholar] [CrossRef]
- Wang, H.; Zhao, Y.; Ma, X.B.; Wang, H.Y. Optimal design of constant-stress accelerated degradation tests using the M-optimality criterion. Relia. Eng. Syst. Saf. 2017, 164, 45–54. [Google Scholar] [CrossRef]
- Zhao, X.J.; Xu, J.Y.; Liu, B. Accelerated Degradation Tests Planning With Competing Failure Modes. IEEE Trans. Reliab. 2018, 67, 142–155. [Google Scholar] [CrossRef]
- Yu, Y.; Hu, C.H.; Si, X.S.; Zhang, J.X. Modified Bayesian D-Optimality for Accelerated Degradation Test Design With Model Uncertainty. IEEE Access 2019, 7, 42181–42189. [Google Scholar] [CrossRef]
- Jiang, P.H.; Wang, B.X.; Wang, X.F.; Qin, S.D. Optimal plan for Wiener constant-stress accelerated degradation model. Appl. Math. Modell. 2020, 84, 191–201. [Google Scholar] [CrossRef]
- Ma, Z.H.; Liao, H.T.; Ji, H.; Wang, S.P.; Yin, F.L.; Nie, S.L. Optimal design of hybrid accelerated test based on the Inverse Gaussian process model. Relia. Eng. Syst. Saf. 2021, 210, 107509–107519. [Google Scholar] [CrossRef]
- Wang, Y.S.; Chen, X.; Tan, Y.Y. Optimal Design of Step-stress Accelerated Degradation Test with Multiple Stresses and Multiple Degradation Measures. Qual. Reliab. Eng. Int. 2017, 33, 1655–1668. [Google Scholar] [CrossRef]
- Chen, W.H.; Liu, J.; Gao, L.; Pan, J.; Lu, X.B. Step-stress accelerated degradation test modeling and statistical analysis methods. Chin. J. Mech. Eng. 2013, 26, 1154–1159. [Google Scholar] [CrossRef]
- Liu, R.Y.; Mao, S.S. Optimum Step-stress Plans for Accelerated Life Testing. Chin. J. Appl. Probab. 2002, 18, 34–42. [Google Scholar]
- Wei, Z.J. Probability Theory and Mathematical Statistics, 2nd ed.; China Statistics Press: Beijing, China, 2013; pp. 230–261. [Google Scholar]
- Li, X.X. Research on Multiple-Stress Reliability Accelerated Model of Spindle System in Machining Center. Ph.D. Thesis, Jilin University, Jilin, China, 2018. [Google Scholar]
- Mao, S.S. Accelerated model of accelerated life test. Qual. Reliab. 2003, 2, 15–18. [Google Scholar]
- Fang, B.R.; Zhou, J.M.; Li, Y.M. Matrix Theory, 2nd ed.; Tsinghua University Press: Beijing, China, 2013; pp. 112–158. [Google Scholar]
- Zhao, H.X.; Yang, Z.J.; Chen, C.H.; Tian, H.L.; Chen, L.; Ying, J.; Jia, X. Development of Reliability Test System Based on Working Principle and Fault Analysis of Motorized Spindle. In Proceedings of the 2018 3rd International Conference on System Reliability and Safety (ICSRS), Barcelona, Spain, 22–25 November 2018; pp. 299–307. [Google Scholar]
- Cai, Z.Y.; Chen, Y.X.; Zhang, Z.M.; Xiang, H.C. Reliability assessment method of nonlinear step-stress accelerated degradation data. J. Beijing Univ. Aeronaut. Astronaut. 2016, 42, 576–582. [Google Scholar]
- Ge, Z.Z.; Jiang, T.M.; Han, S.H.; Li, X.Y. Design of accelerated degradation testing with multiple stresses based on D optimality. Syst. Eng. Electron. Technol. 2012, 34, 846–853. [Google Scholar]


| Fault Location | Fault Phenomenon | Fault Cause | Number of Times | Percentage |
|---|---|---|---|---|
| Bearing | Spindle swing big, spindle abnormal noise, workpiece with tool marks, locked, not tight tool, the cutting tool will not stick | Bearing fatigue and damage | 27 | 67.5% |
| Positioning block | The cutting tool dropping | Loose and poor preload | 3 | 7.5% |
| Servo amplifier | sequence error, abnormal bus connection | Servo amplifier failure | 3 | 7.5% |
| Motor | Large speed deviation, servo system alarm | Motor damage | 2 | 5% |
| Braking resistance | Brake circuit failure | Brake resistor burned | 2 | 5% |
| Claw | The spindle cannot hold the cutting tool | Claw damage | 1 | 2.5% |
| Cone | Abnormal noise of motorized spindle | Cone wear | 1 | 2.5% |
| Cooling system | Spindle overheat alarm | Water in cooling system | 1 | 2.5% |
| Event | Code | Event | Code |
|---|---|---|---|
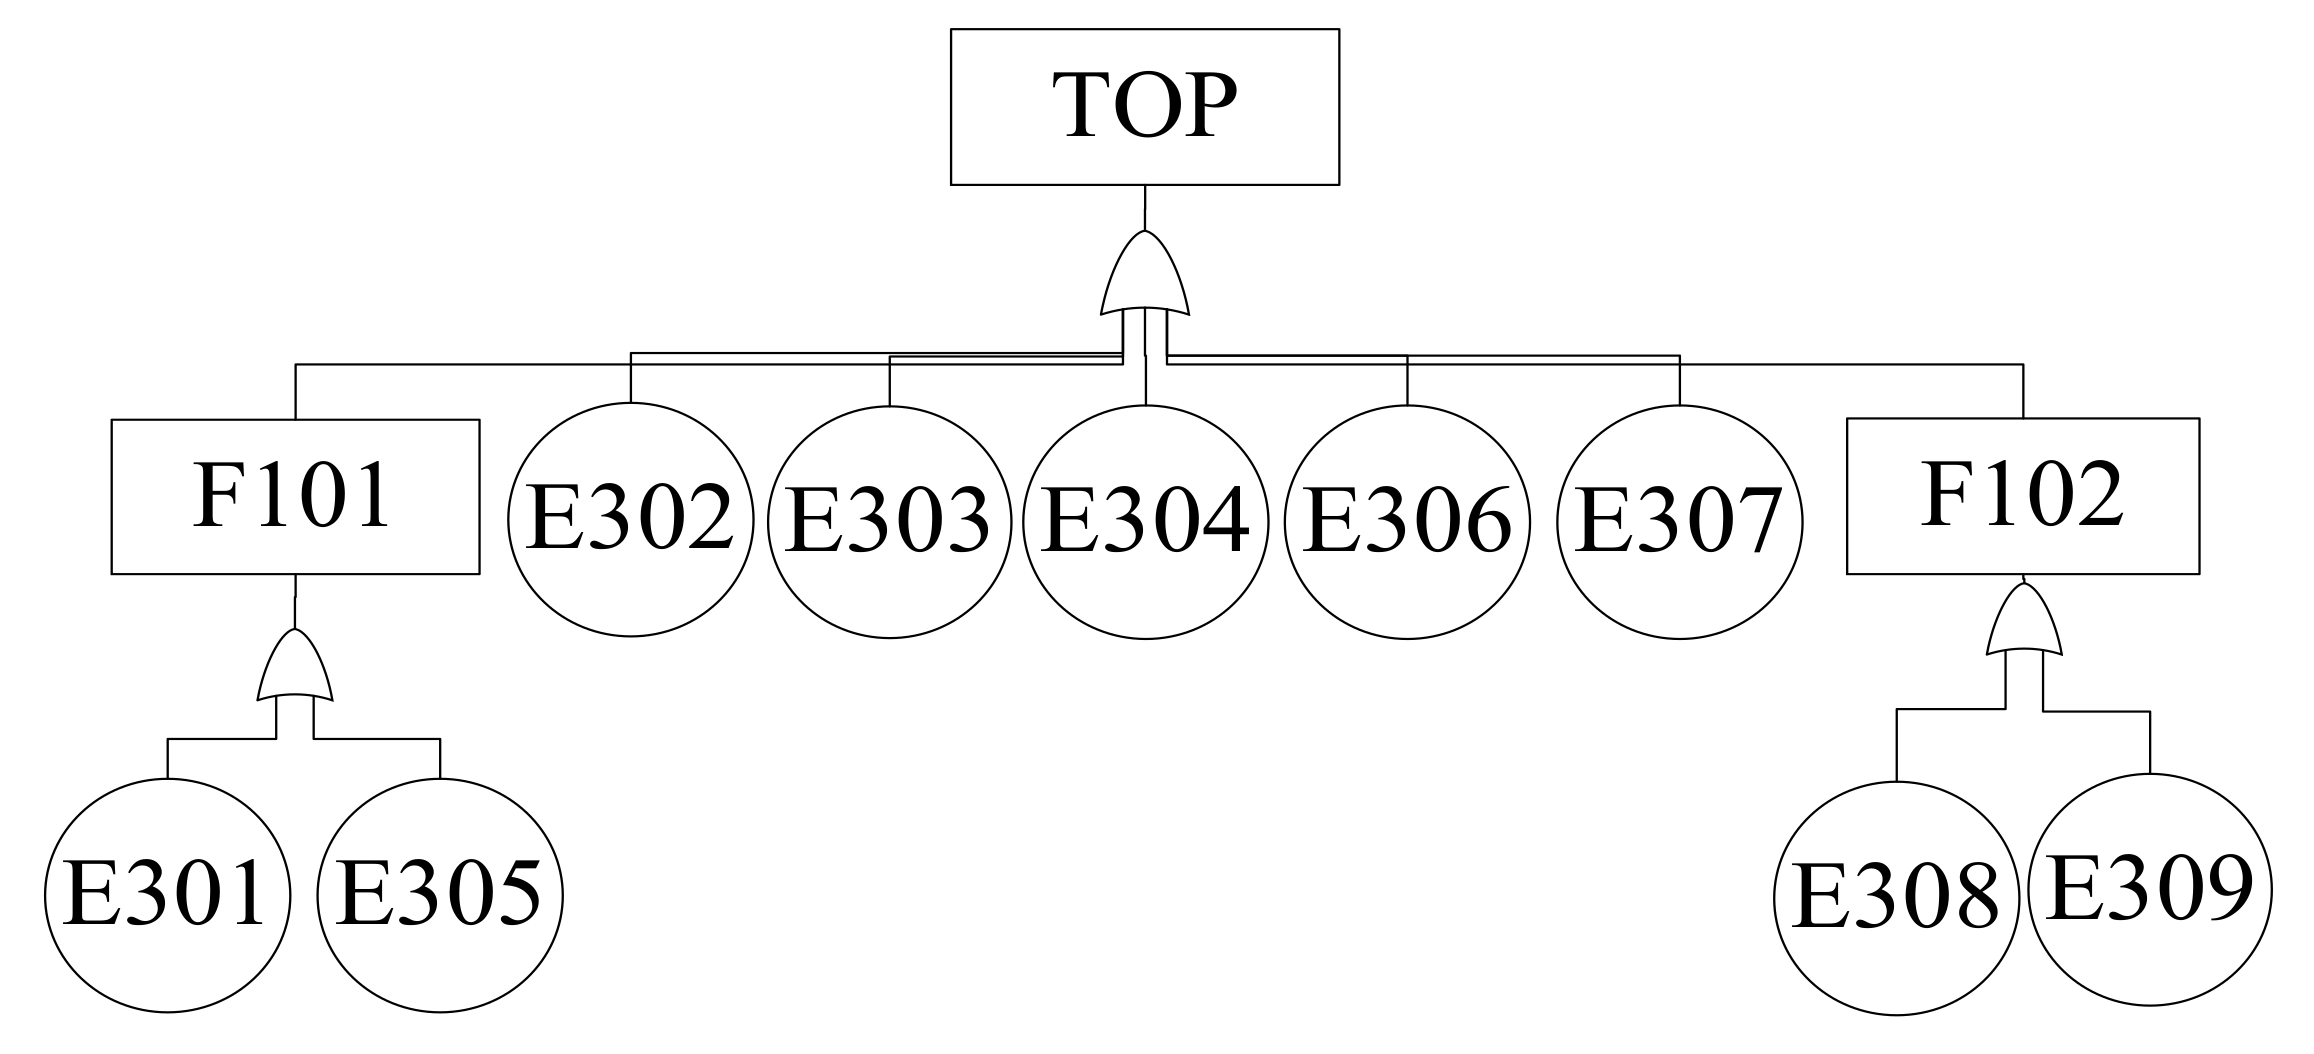
| Abnormal noise of motorized spindle | F101 | Wear of inner cone of spindle | E305 |
| The spindle cannot hold the cutting tool normally | F102 | Fault of servo amplifier | E306 |
| Fatigue damage of bearing | E301 | Burn out of brake resistor | E307 |
| Failure of cooling system | E302 | Looseness of positioning block | E308 |
| Abnormal of the motor | E303 | The preload of positioning block is not enough | E309 |
| Claws broken | E304 |
| Code | Event | Probability | Code | Event | Probability |
|---|---|---|---|---|---|
| E301 | Fatigue damage of bearing | 1.293 | E306 | Fault of servo amplifier | 0.144 |
| E302 | Failure of cooling system | 0.048 | E307 | Burn out of brake resistor | 0.096 |
| E303 | Abnormality of the motor | 0.096 | E308 | Looseness of positioning block | 0.048 |
| E304 | Claws broken | 0.048 | E309 | The preload of positioning block is not enough | 0.096 |
| E305 | Wear of inner cone of spindle | 0.048 |
| Bottom Events | E301 | E302 | E303 | E304 | E305 | E306 | E307 | E308 | E309 |
|---|---|---|---|---|---|---|---|---|---|
| 0.0128 | 0.0005 | 0.0009 | 0.0005 | 0.0005 | 0.0014 | 0.0009 | 0.0005 | 0.0005 |
| Event | Event | ||||
|---|---|---|---|---|---|
| E301 | 84.41 | 0.6753 | E306 | 83.3 | 0.6664 |
| E302 | 65 | 1 | E307 | 34.5 | 0.276 |
| E303 | 76.5 | 0.612 | E308 | 68.3 | 0.5464 |
| E304 | 115 | 0.92 | E309 | 68.3 | 0.5464 |
| E305 | 80 | 0.64 |
| Event | (∗10−2) | Event | (∗10−2) |
|---|---|---|---|
| E301 | 0.9425 | E306 | 0.1021 |
| E302 | 0.0266 | E307 | 0.0282 |
| E303 | 0.0625 | E308 | 0.0279 |
| E304 | 0.0469 | E309 | 0.0558 |
| E305 | 0.0327 |
| Stress | Stress Effect | (∗10−2) | |
|---|---|---|---|
| Main Influence Scope | Stress Action | ||
| Cutting force | Bearing | 3 | 0.9425 |
| Spindle speed | Bearing | 1 | 0.9425 |
| Tool change times | Parts of broach system | , ( is material constant, ) | 0.096 |
| Cutting power | All parts in the spindle, among which the electronic components and bearings are most affected | 1 | 0.0133 |
| Temperature | All parts in the spindle, among which the electronic components are most affected | 1 | 0.0133 |
| Stress | ||||
|---|---|---|---|---|
| Cutting force | 1 | 0.2 | 3 | 1 |
| Spindle speed | 1 | 0.2 | 1 | 1/3 |
| Tool change times | 2 | 0.4 | 1/9 | 1/27 |
| Cutting power | 5 | 1 | 1 | 1/3 |
| Temperature | 4 | 0.8 | 1 | 1/3 |
| Stress | |
|---|---|
| Cutting force | 0.189 |
| Spindle speed | 0.063 |
| Tool change times | 0.001 |
| Cutting power | 0.004 |
| Temperature | 0.003 |
| Type | Rated Power | Rated Voltage | Rated Current | Rated Torque | Rated Speed | Frequency |
|---|---|---|---|---|---|---|
| SPS1530-18Z | 7.3 | 350 | 15 | 5.9 | 12000 | 300 |
| 0.0875 | 0.3423 | −11.6428 | 0.006339 |
| Item | Cost (Ten Thousand Yuan) |
|---|---|
| ) | 75 |
| 2.5 | |
| 0.01/h |
| Number | m | ||||
|---|---|---|---|---|---|
| 1 | [5 5 5 5] | [800 850 900 950] | [6000 6500 7000 7500] | [66 62 61 61] | 1651636.372 |
| 2 | [6 6 6 6] | [800 850 900 950] | [6000 6500 7000 7500] | [40 38 36 36] | 455879.2074 |
| 3 | [7 7 7 7] | [800 850 900 950] | [6000 6500 7000 7500] | [16 12 11 11] | 31610.36 |
| Number | m | ||||
|---|---|---|---|---|---|
| 1 | [5 5 5 5] | [800 850 900 950] | [6000 6500 7000 7500] | [66 62 61 61] | 4.29 ∗ 1024 |
| 2 | [5 5 5 5] | [600 800 850 900] | [5000 5500 6000 7000] | [117 113 10 10] | 5.26 ∗ 1024 |
| −8704 | 0.5 | 10 | 0.002 |
| (h) | (K) | (V) | |||
|---|---|---|---|---|---|
| 150,000 | 3000 | 200 | 1 | 313.15–383.15 | 5–15 |
| [6 6 6 6] | [368.15 373.15 378.15 383.15] | [11 12 13 14] | [99 97 97 97] | 742411.69 | 6.54 ∗ 1013 |
| T | V | ||||
|---|---|---|---|---|---|
| [6 6 6 6] | [353.15 358.15 378.15 383.15] | [10 13 14 15] | [113 112 75 75] | 439902.93 | 8.02 ∗ 1013 |
| 10% | 10% | 10% | 10% | [5 5 5 5] | [800 850 900 950] | [6000 6500 7000 7500] | 10 | [66 62 61 61] | 80.6% |
| 10% | 0 | 0 | 0 | [5 5 5 5] | [800 850 900 950] | [6000 6500 7000 7500] | 10 | [66 62 61 61] | 46.9% |
| 10% | −10% | −10% | −10% | [5 5 5 5] | [800 850 900 950] | [6000 6500 7000 7500] | 10 | [66 62 61 61] | 93.6% |
| 0 | 10% | 0 | −10% | [5 5 5 5] | [800 850 900 950] | [6000 6500 7000 7500] | 10 | [66 62 61 61] | 11.1% |
| 0 | 0 | −10% | 10% | [5 5 5 5] | [800 850 900 950] | [6000 6500 7000 7500] | 10 | [66 62 61 61] | 47.0% |
| 0 | −10% | 10% | 0 | [5 5 5 5] | [800 850 900 950] | [6000 6500 7000 7500] | 10 | [66 62 61 61] | 59.3% |
| −10% | 10% | −10% | 0 | [5 5 5 5] | [800 850 900 950] | [6000 6500 7000 7500] | 10 | [66 62 61 61] | 32.2% |
| −10% | 0 | −10% | −10% | [5 5 5 5] | [800 850 900 950] | [6000 6500 7000 7500] | 10 | [66 62 61 61] | 25.3% |
| −10% | −10% | 0 | 10% | [5 5 5 5] | [800 850 900 950] | [6000 6500 7000 7500] | 10 | [66 62 61 61] | 37.0% |
Publisher’s Note: MDPI stays neutral with regard to jurisdictional claims in published maps and institutional affiliations. |
© 2021 by the authors. Licensee MDPI, Basel, Switzerland. This article is an open access article distributed under the terms and conditions of the Creative Commons Attribution (CC BY) license (https://creativecommons.org/licenses/by/4.0/).
Share and Cite
Zhao, H.; Yang, Z.; Chen, C.; Tian, H.; Li, X.; Li, S. Optimization Design of Step Stress Accelerated Degradation Test for Motorized Spindle Based on Ds-Optimality. Appl. Sci. 2021, 11, 3832. https://doi.org/10.3390/app11093832
Zhao H, Yang Z, Chen C, Tian H, Li X, Li S. Optimization Design of Step Stress Accelerated Degradation Test for Motorized Spindle Based on Ds-Optimality. Applied Sciences. 2021; 11(9):3832. https://doi.org/10.3390/app11093832
Chicago/Turabian StyleZhao, Hongxun, Zhaojun Yang, Chuanhai Chen, Hailong Tian, Xiaoxu Li, and Shizheng Li. 2021. "Optimization Design of Step Stress Accelerated Degradation Test for Motorized Spindle Based on Ds-Optimality" Applied Sciences 11, no. 9: 3832. https://doi.org/10.3390/app11093832
APA StyleZhao, H., Yang, Z., Chen, C., Tian, H., Li, X., & Li, S. (2021). Optimization Design of Step Stress Accelerated Degradation Test for Motorized Spindle Based on Ds-Optimality. Applied Sciences, 11(9), 3832. https://doi.org/10.3390/app11093832