Article

Characteristics of Warm Mix Asphalt Incorporating Coarse Steel Slag Aggregates

by
Adham Mohammed Alnadish
1,*,
Mohamad Yusri Aman
1,
Herda Yati Binti Katman
2,* and
Mohd Rasdan Ibrahim
3
1
Department of Civil Engineering and Built Environment, University Tun Hussein Onn Malaysia, Parit Raja 86400, Malaysia
2
Department of Civil Engineering, University Tenaga Nasional, Kajang 43000, Malaysia
3
Department of Civil Engineering, University Malaya, Kuala Lumpur 50603, Malaysia
*
Authors to whom correspondence should be addressed.
Appl. Sci. 2021, 11(8), 3708; https://doi.org/10.3390/app11083708
Submission received: 3 March 2021 / Revised: 30 March 2021 / Accepted: 31 March 2021 / Published: 20 April 2021
(This article belongs to the Special Issue Advances in Asphalt Pavement Technologies and Practices)

Abstract

:
The major goal of sustainable practices is to preserve raw resources through the utilization of waste materials as an alternative to natural resources. Decreasing the temperature required to produce asphalt mixes contributes to environmental sustainability by reducing energy consumption and toxic emissions. In this study, warm mix asphalt incorporating coarse steel slag aggregates was investigated. Warm mix asphalt was produced at different temperatures lower than the control asphalt mixes (hot mix asphalt) by 10, 20, and 30 °C. The performances of the control and warm mix asphalt were assessed through laboratory tests examining stiffness modulus, dynamic creep, and moisture sensitivity. Furthermore, a response surface methodology (RSM) was conducted by means of DESIGN EXPERT 11 to develop prediction models for the performance of warm mix asphalt. The findings of this study illustrate that producing warm mix asphalt at a temperature 10 °C lower than that of hot mix asphalt exhibited the best results, compared to the other mixes. Additionally, the warm mix asphalt produced at 30 °C lower than the hot mix asphalt exhibited comparable performance to the hot mix asphalt. However, as the production temperature increases, the performance of the warm mix asphalt improves.

1. Introduction

In most cases, hot mix asphalt (HMA) is manufactured at a temperature ranging from 150 °C to 180 °C. A high production temperature is necessary to dry the aggregates, coat them with bitumen, and achieve the desired workability. However, carbon dioxide emissions associated with the production of HMA have become a serious concern due to the negative effects of these emissions on the environment. Accordingly, warm mix asphalt (WMA) has recently acquired salability because of its effective ability to reduce toxic emissions and contribute to the preservation of the environment. The main function of WMA is to produce asphalt mixes at temperatures ranging from 20 °C to 40 °C lower than HMA, at which time the materials are blended, compacted, and placed on roads. The decreased production temperature is attributed to warm-mix asphalt technologies such as chemical additives, organic additives, and foaming that reduces binder viscosity [1,2]. Also, WMA decreases the energy required to produce asphalt mixes and provides a less harmful environment for workers and the areas surrounding asphalt mixing plants because its production process features reduced carcinogenic polycyclic aromatic hydrocarbon (PAH) emissions [3]. The production of WMA may decrease greenhouse emissions and energy consumption up to 40%, compared to the conventional asphalt mix [4]. Young [5] concluded that the fuel consumption is decreased by 2–3% for every 6 °C reduction to the production temperature. Similarly, Olard et al. [6] reported that for every 10 °C decrease in mixing temperature, energy and CO2 are reduced by 5.5%. Furthermore, WMA technologies have minimized the influence of short- and long-term aging on the performance of the asphalt mix in comparison to HMA, due to the reduced oxidation of binders modified by WMA technologies [7,8].
Industrial waste and by-product materials are utilized in pavement applications as an alternative for natural aggregates to contribute toward environmental sustainability. One of the common by-products used in pavement applications is electric arc furnace steel slag aggregate. The common use of steel slag aggregate is attributed to its superior mechanical properties. Many studies have investigated the suitability of utilizing steel slag aggregate in asphalt mixes. Behnood and Ameri [9] assessed the performance of the stone mastic asphalt (SMA) containing steel slag aggregate as a coarse portion. The findings of the study illustrated that utilizing steel slag aggregates in stone mastic asphalt improved the resilient modulus, Marshal stability, and tensile strength. Ziari et al. [10] noted that hot mix asphalt containing steel slag aggregate as a coarse portion showed higher Marshal stability, indirect tensile strength, and higher fatigue life in comparison to the control mix. These enhancements were attributed to the angularity, toughness, and roughness of the steel slag aggregate [11]. Similarly, Ahmedzade and Sengoz [12] conducted a study assessing hot mix asphalt performance incorporated coarse steel slag aggregates. The study concluded that the characteristics of asphalt mixes consisting of coarse steel slag aggregates exhibited higher cracking resistance, stiffness modulus, and moisture sensitivity than the control mixes. Chen and Wei [13] investigated the characteristics of hot mix asphalt incorporating basic oxygen furnace steel slag as a coarse aggregate. The outputs of the laboratory tests indicated that utilizing steel slag aggregate improved the rutting resistance and moisture damage resistance of the asphalt. Alnadish et al. [14,15] carried out several investigations on the performance of hot mix asphalt incorporating coarse steel slag aggregate. The findings of the studies showed that asphalt mixtures composed of steel slag aggregate as a coarse portion enhanced the stiffness modulus, rutting resistance, and cracking resistance, as well as it displayed slightly lower tensile strength ratio as compared to the control mix. Furthermore, limited studies have investigated WMA containing steel slag aggregates. Ameri et al. [16] observed that the WMA produced by Sasobit additive and composed of steel slag aggregates as a coarse portion has improved Marshal stability, resilient modulus, permanent deformation, and moisture sensitivity. Goli et al. [17] investigated the performance of WMA incorporating steel slag aggregates. The incorporation of additives Sasobit and Rediset at a dosage of 2% by weight of the bitumen was used to produce WMA. The findings of the study showed that the WMA composed coarse steel aggregate exhibited better performance than HMA and steel slag aggregate replacements in terms of permanent deformation, fatigue life, and moisture susceptibility. Similarly, Amelian et al. [18] concluded that utilizing coarse basic oxygen furnace steel slag aggregate in warm mix asphalt manifested better performance than asphalt mixtures incorporating conventional aggregates. Ziaee and Behnia [19] assessed WMA modified with 1.5% of Sasobit and coarse steel slag aggregates. The laboratory experiments of the study showed that WMA incorporating coarse steel slag aggregate was significantly improved in stiffness modulus, permanent deformation, and tensile strength, in comparison to HMA.
Permanent deformation and moisture damage are among the main drawbacks of warm mix asphalt, due to the fact that reducing the production temperature may cause inchoate drying of the aggregates, insufficient film thickness, and reduced hardening of the binder [20].
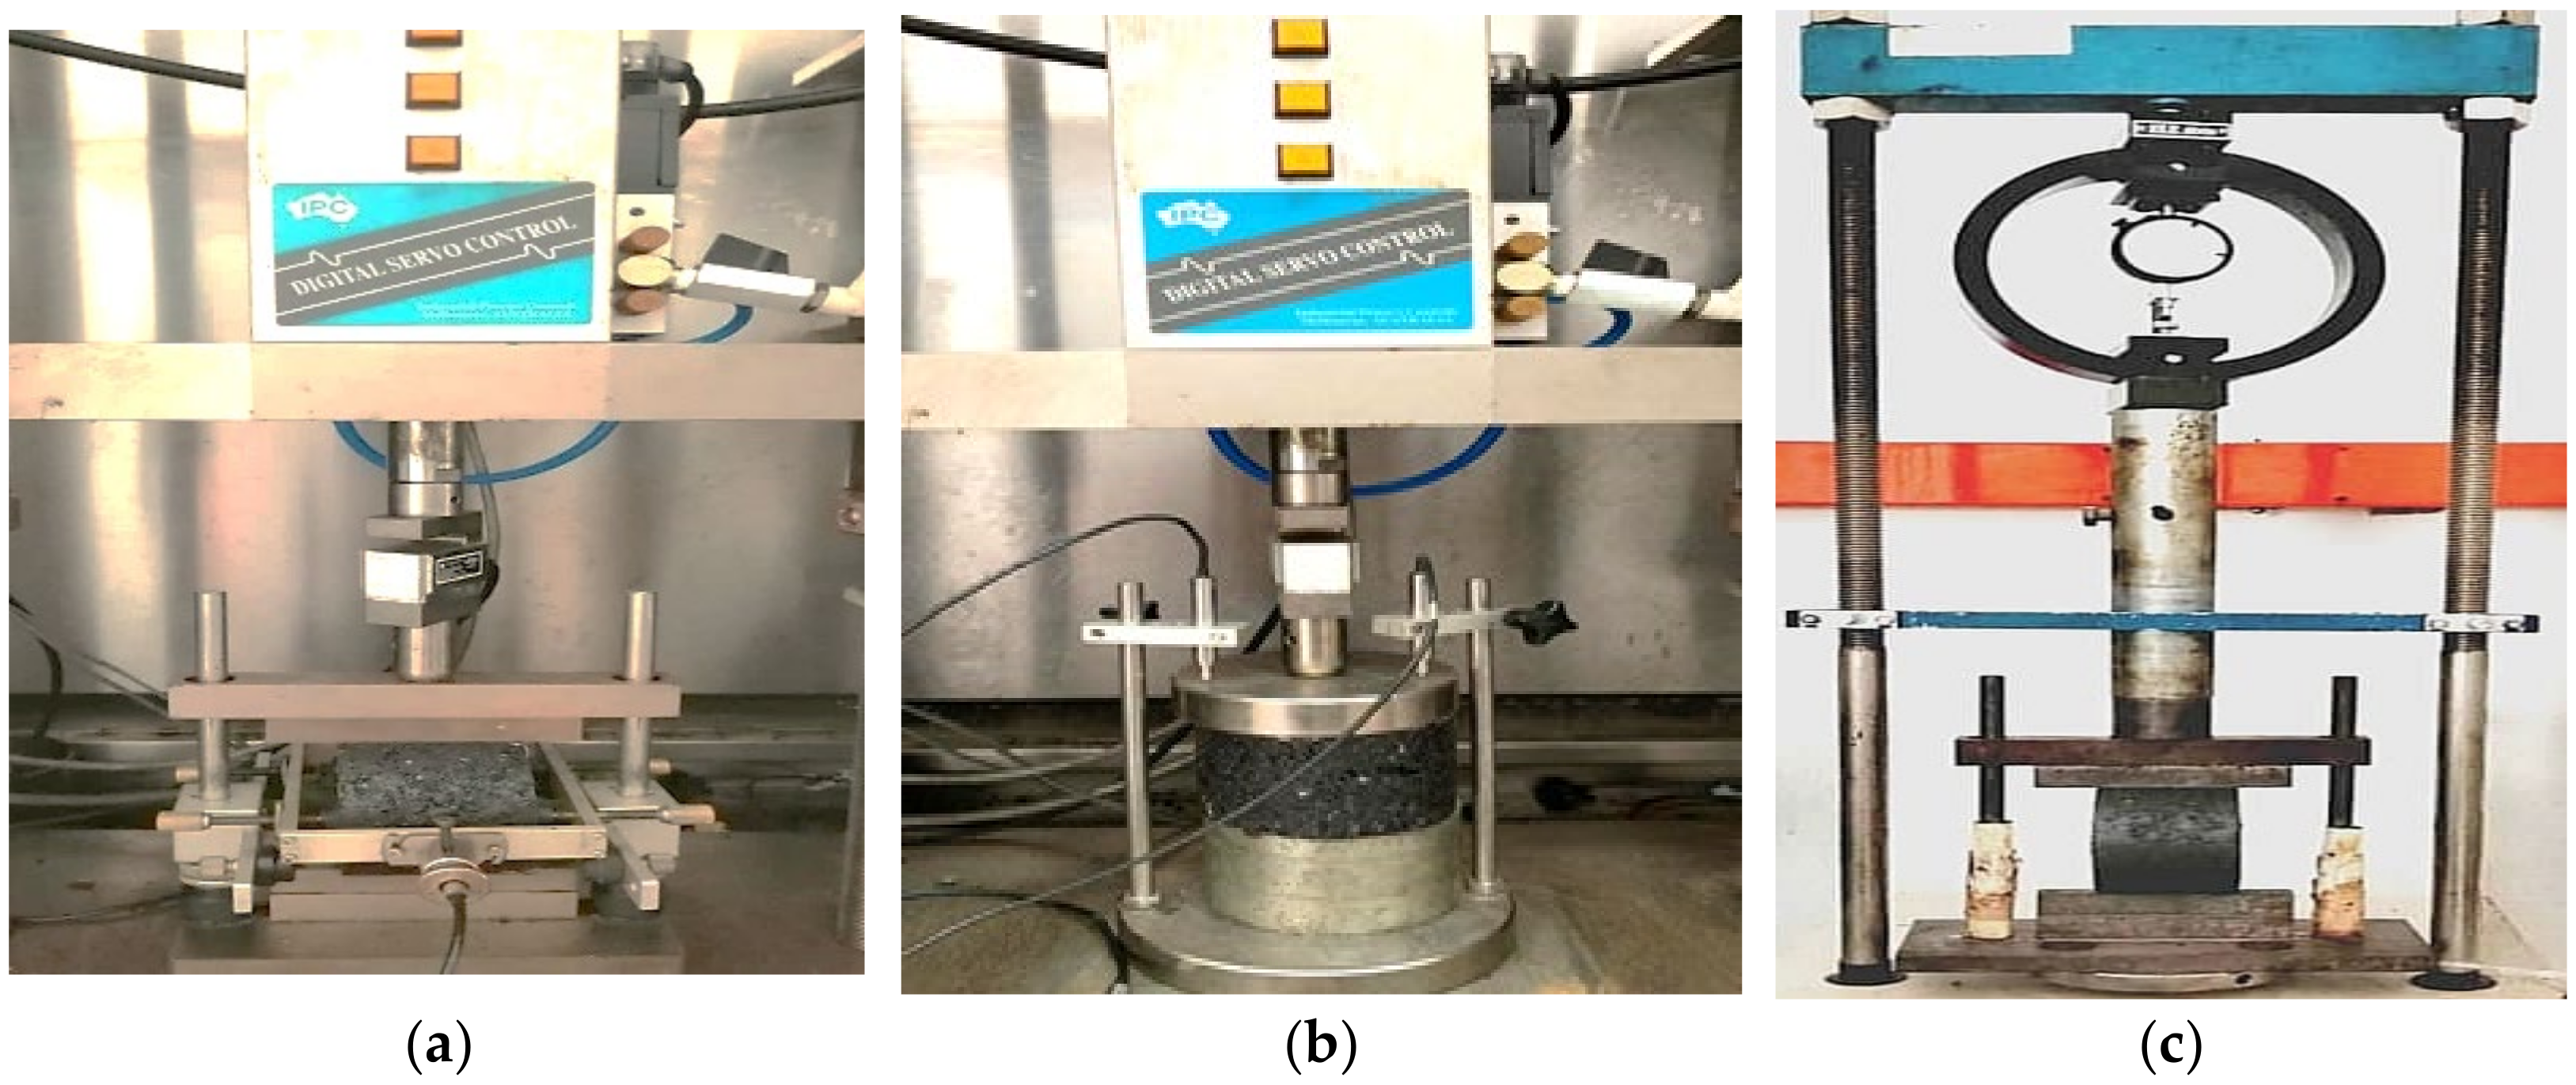
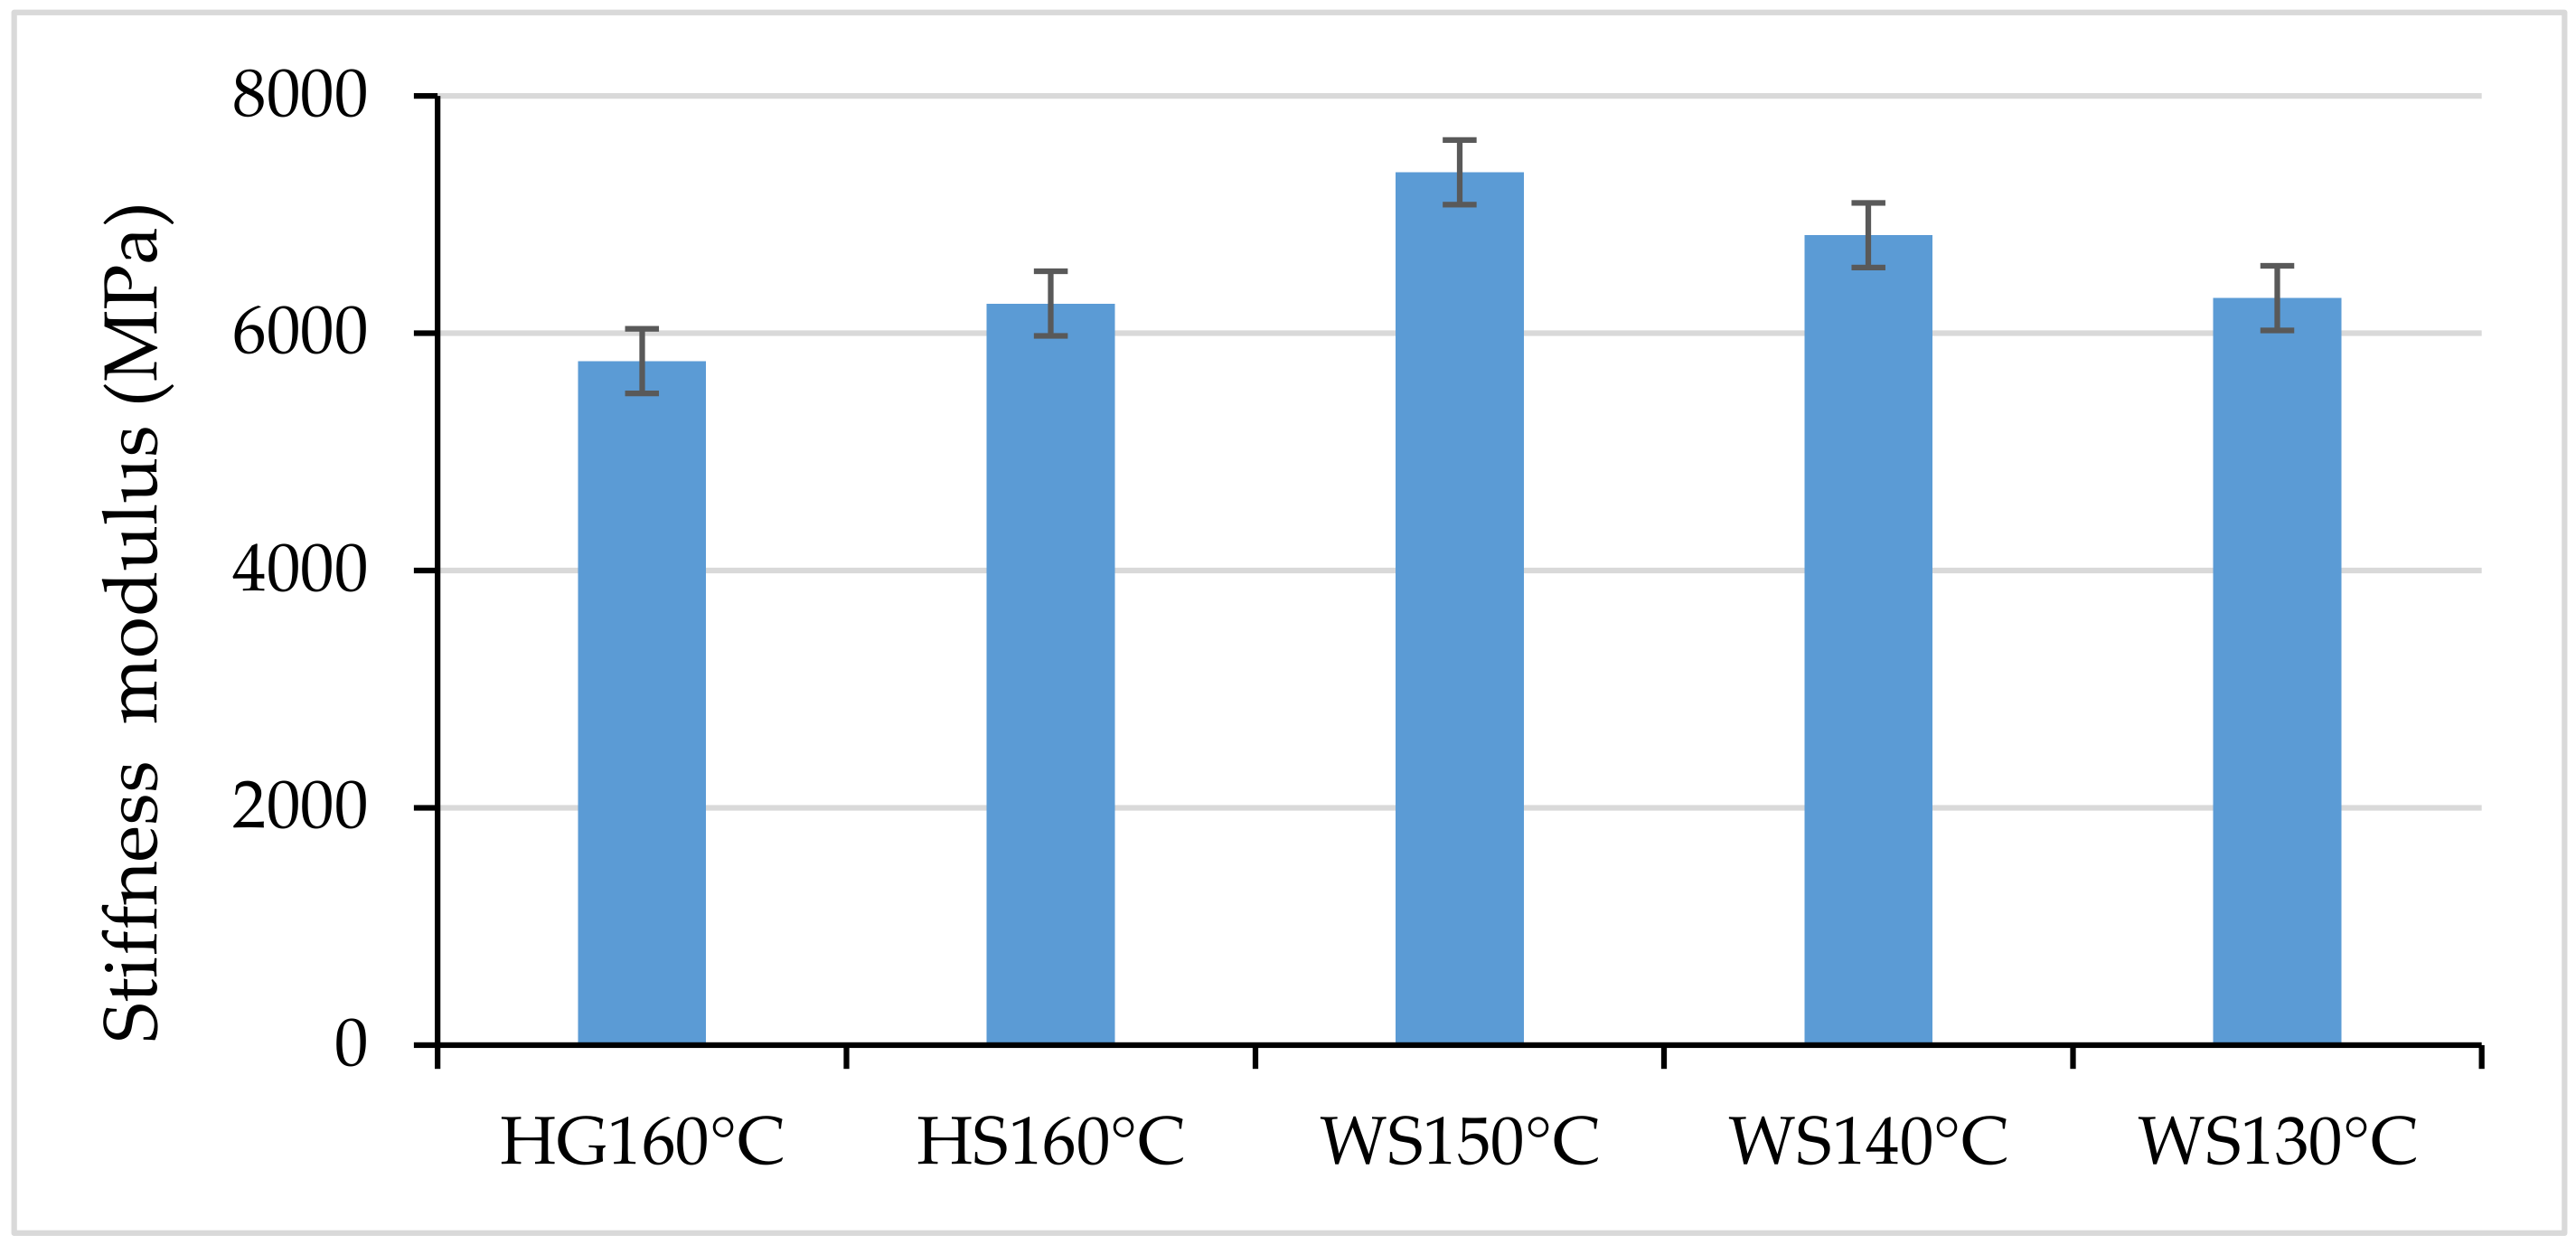
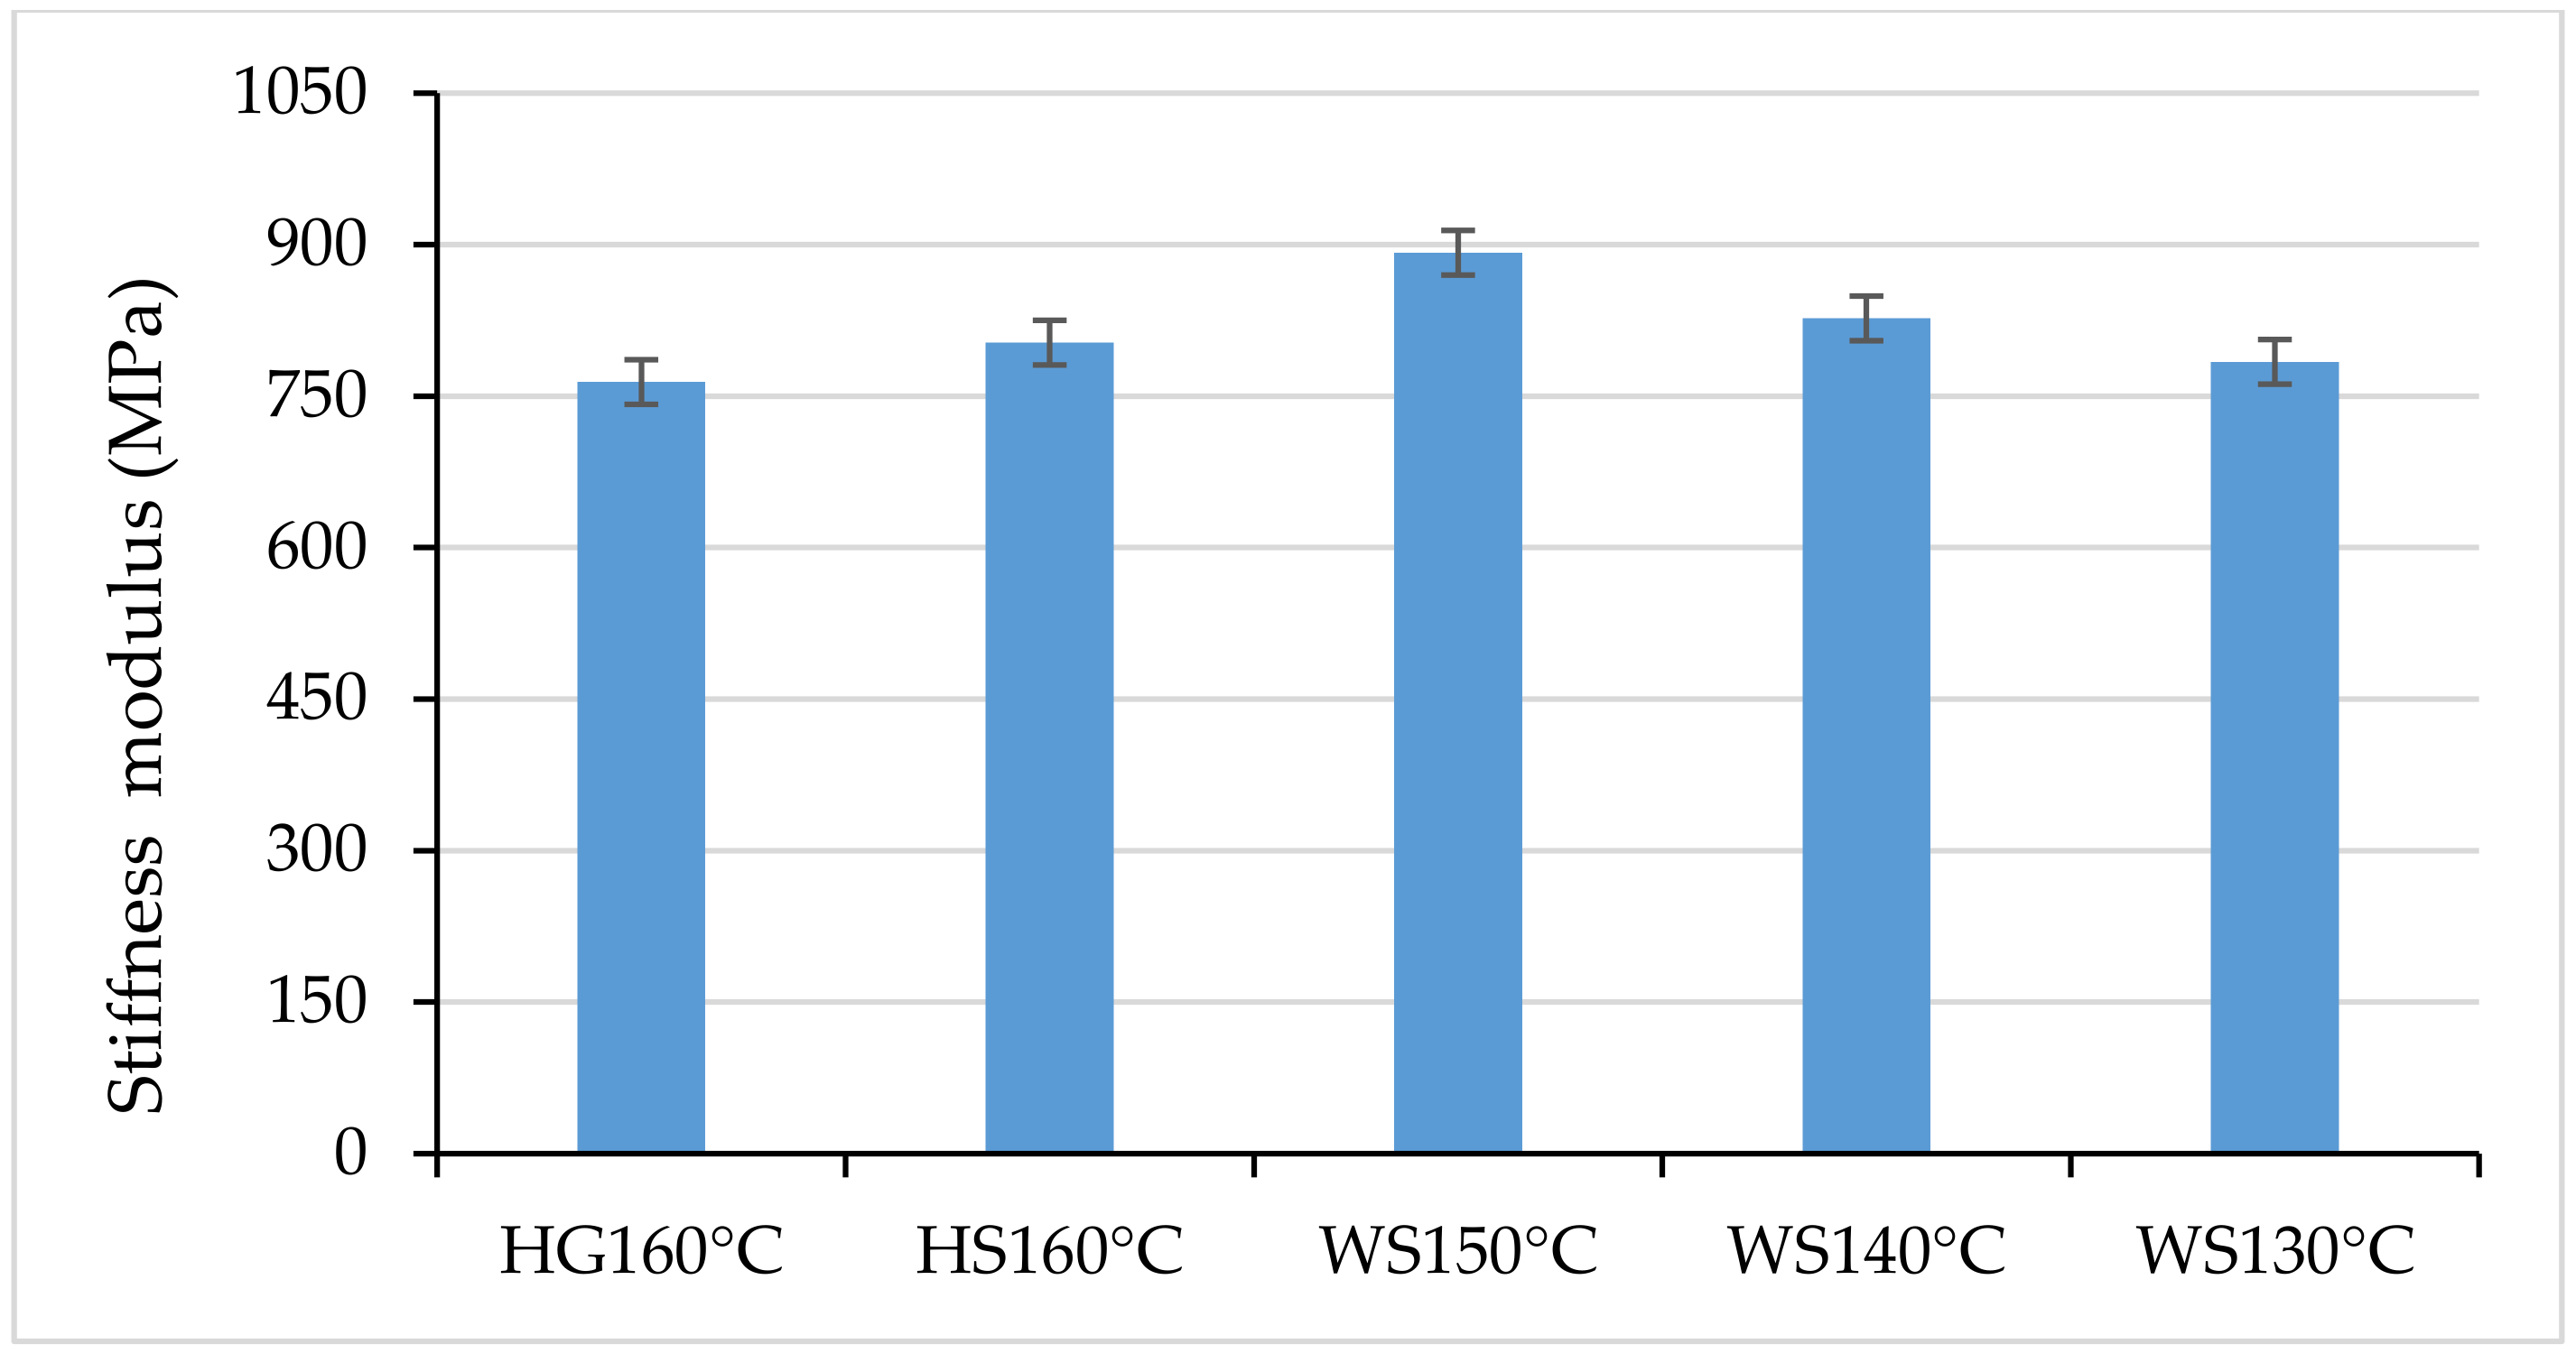
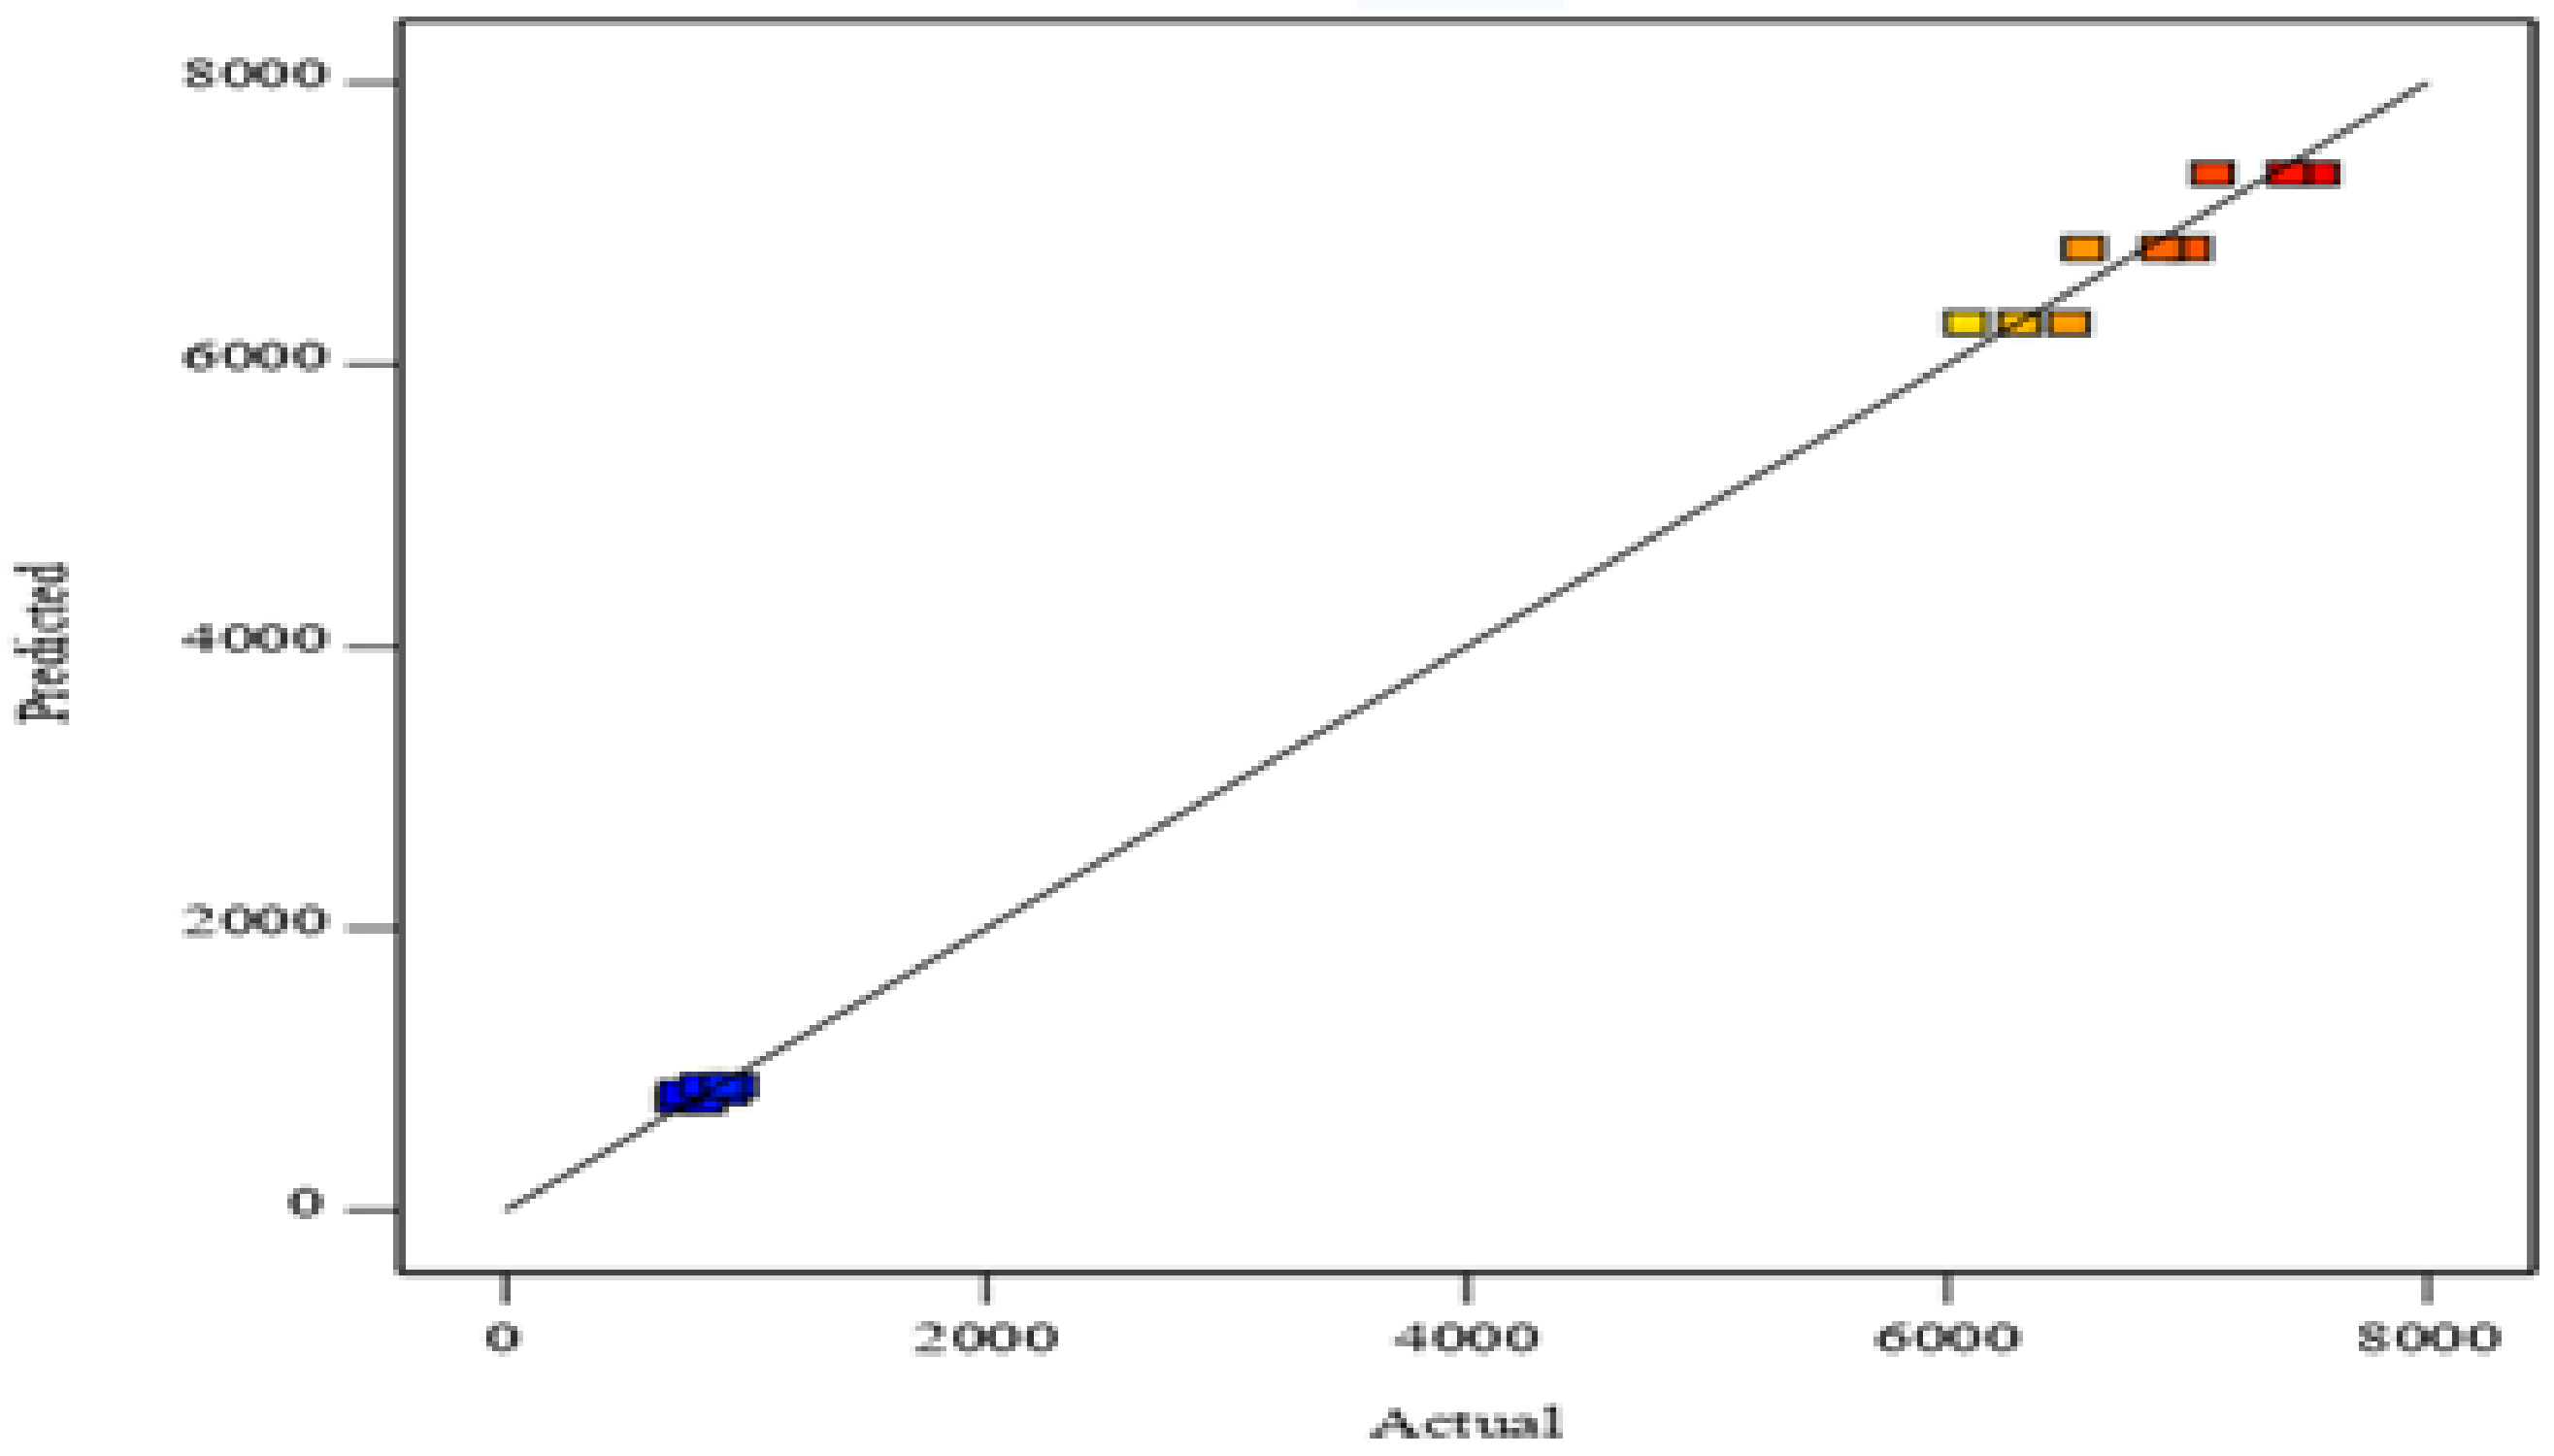
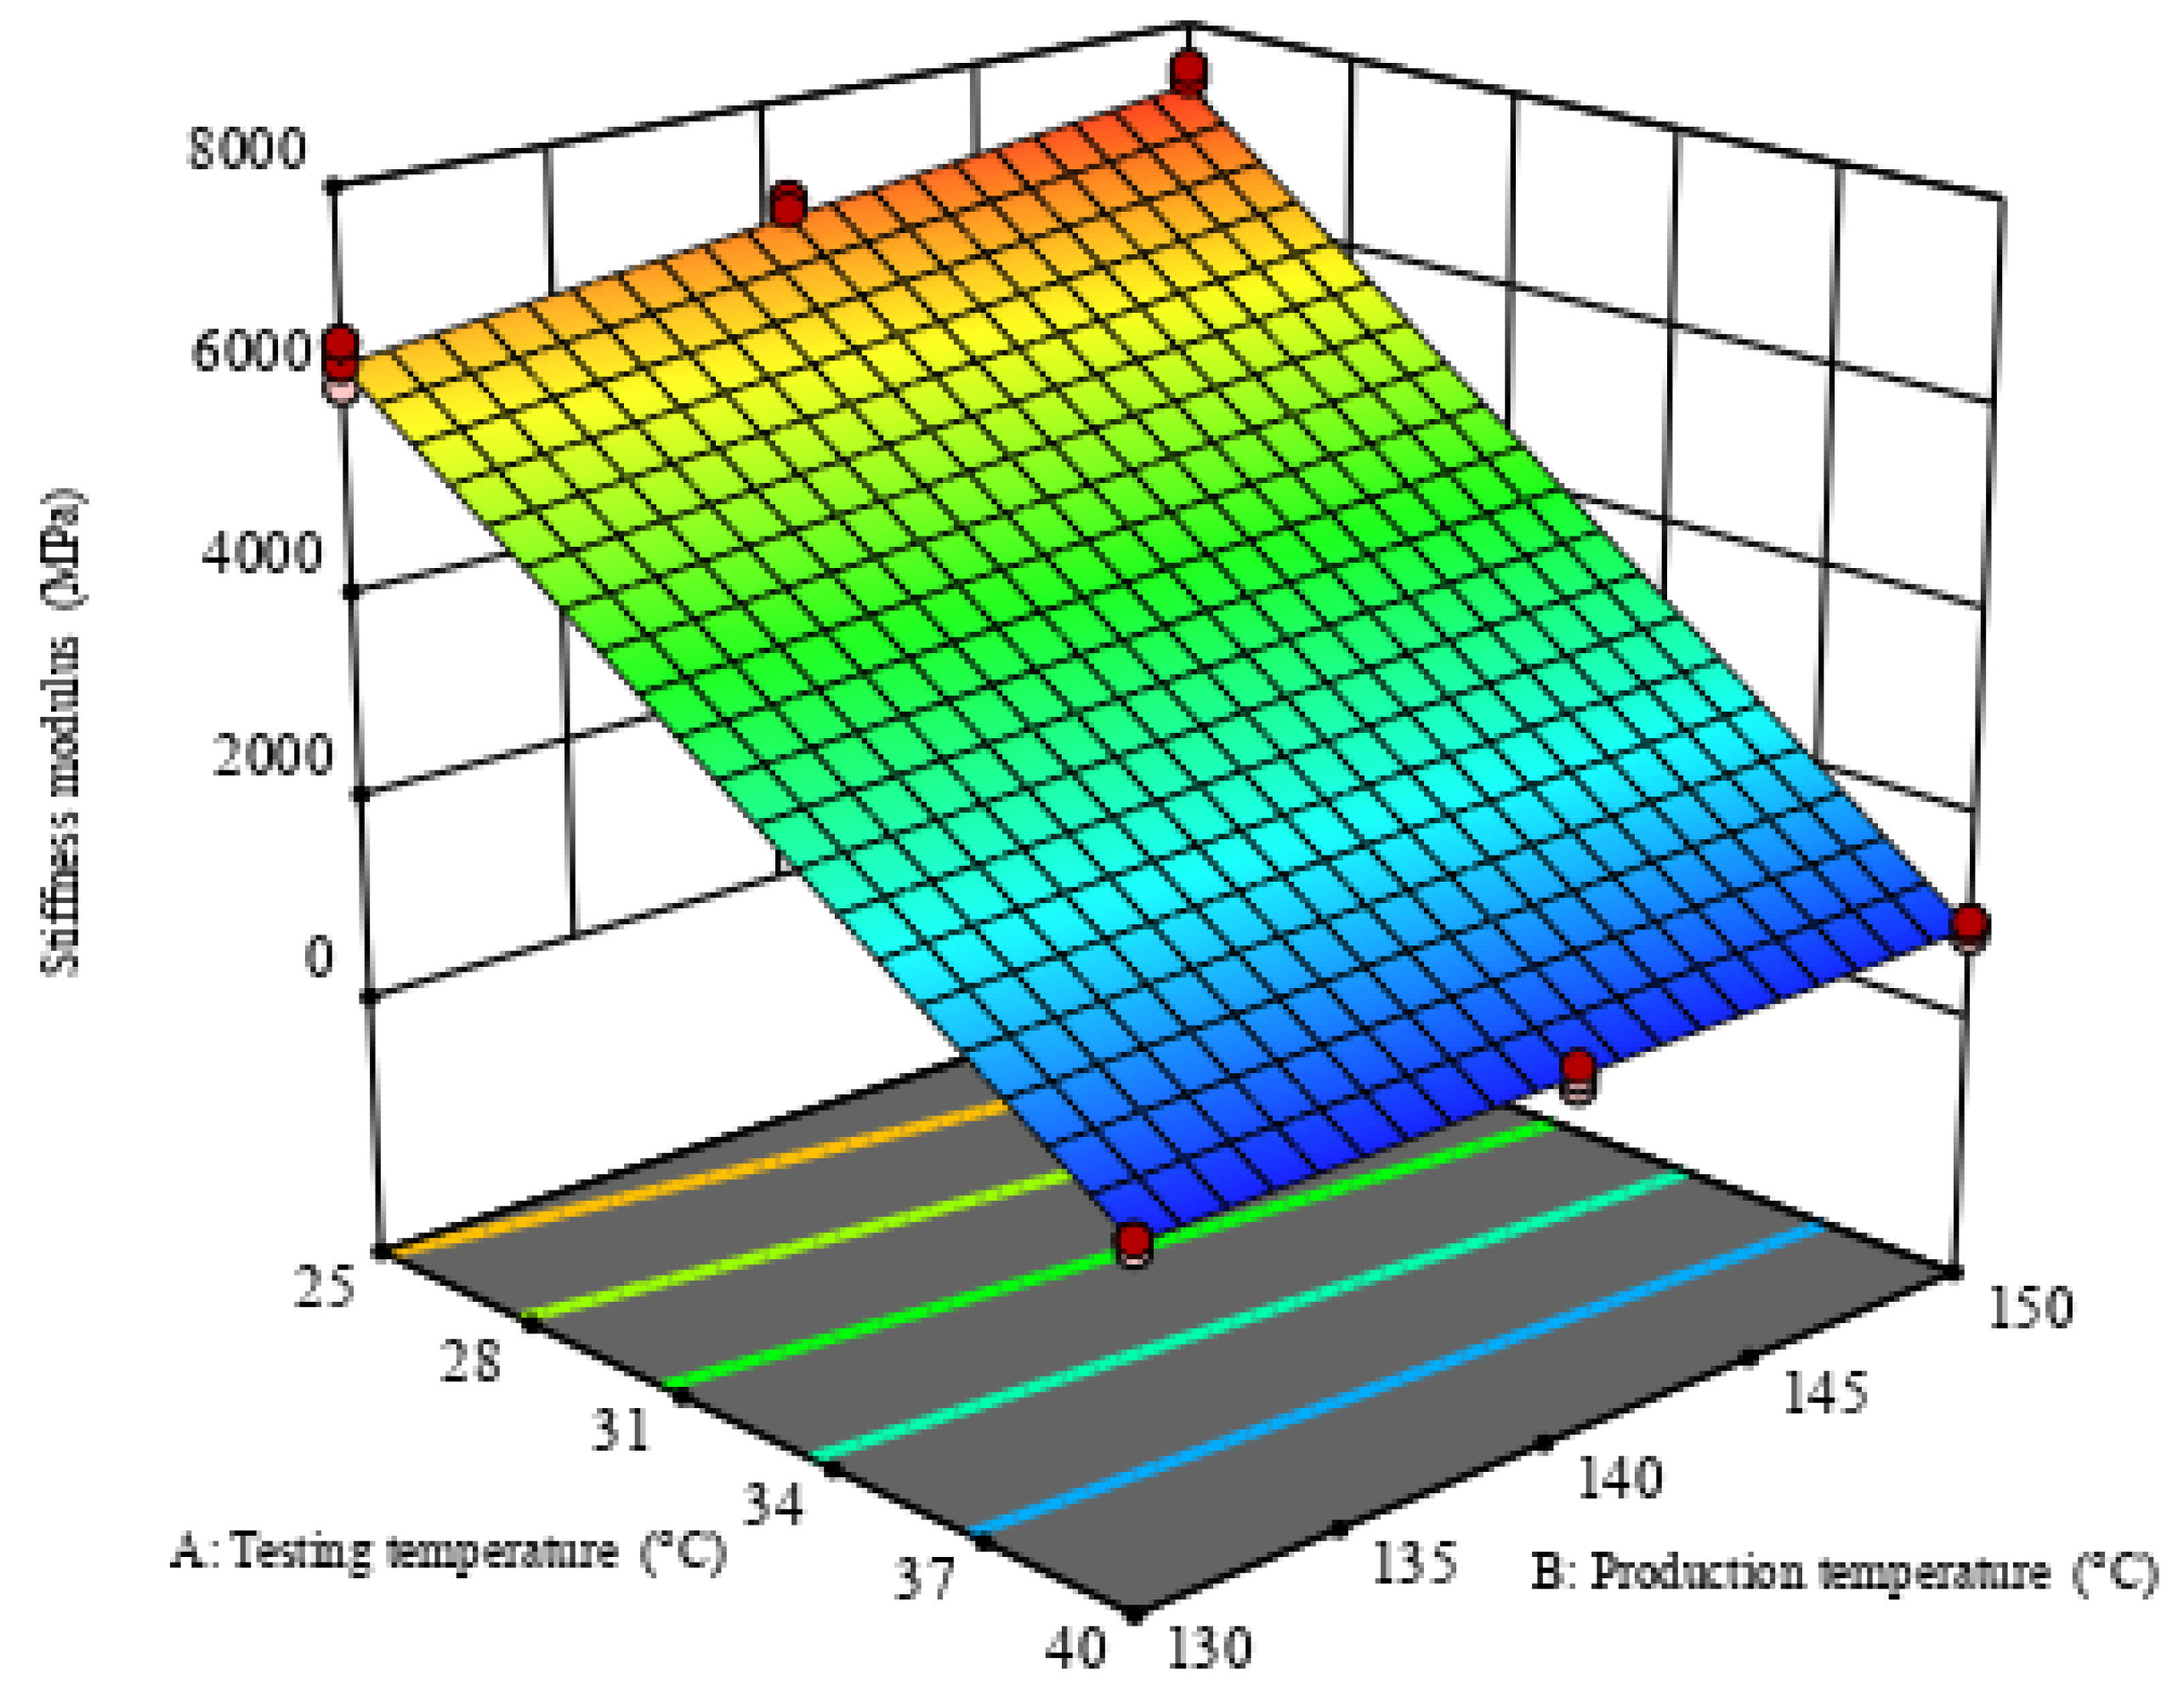
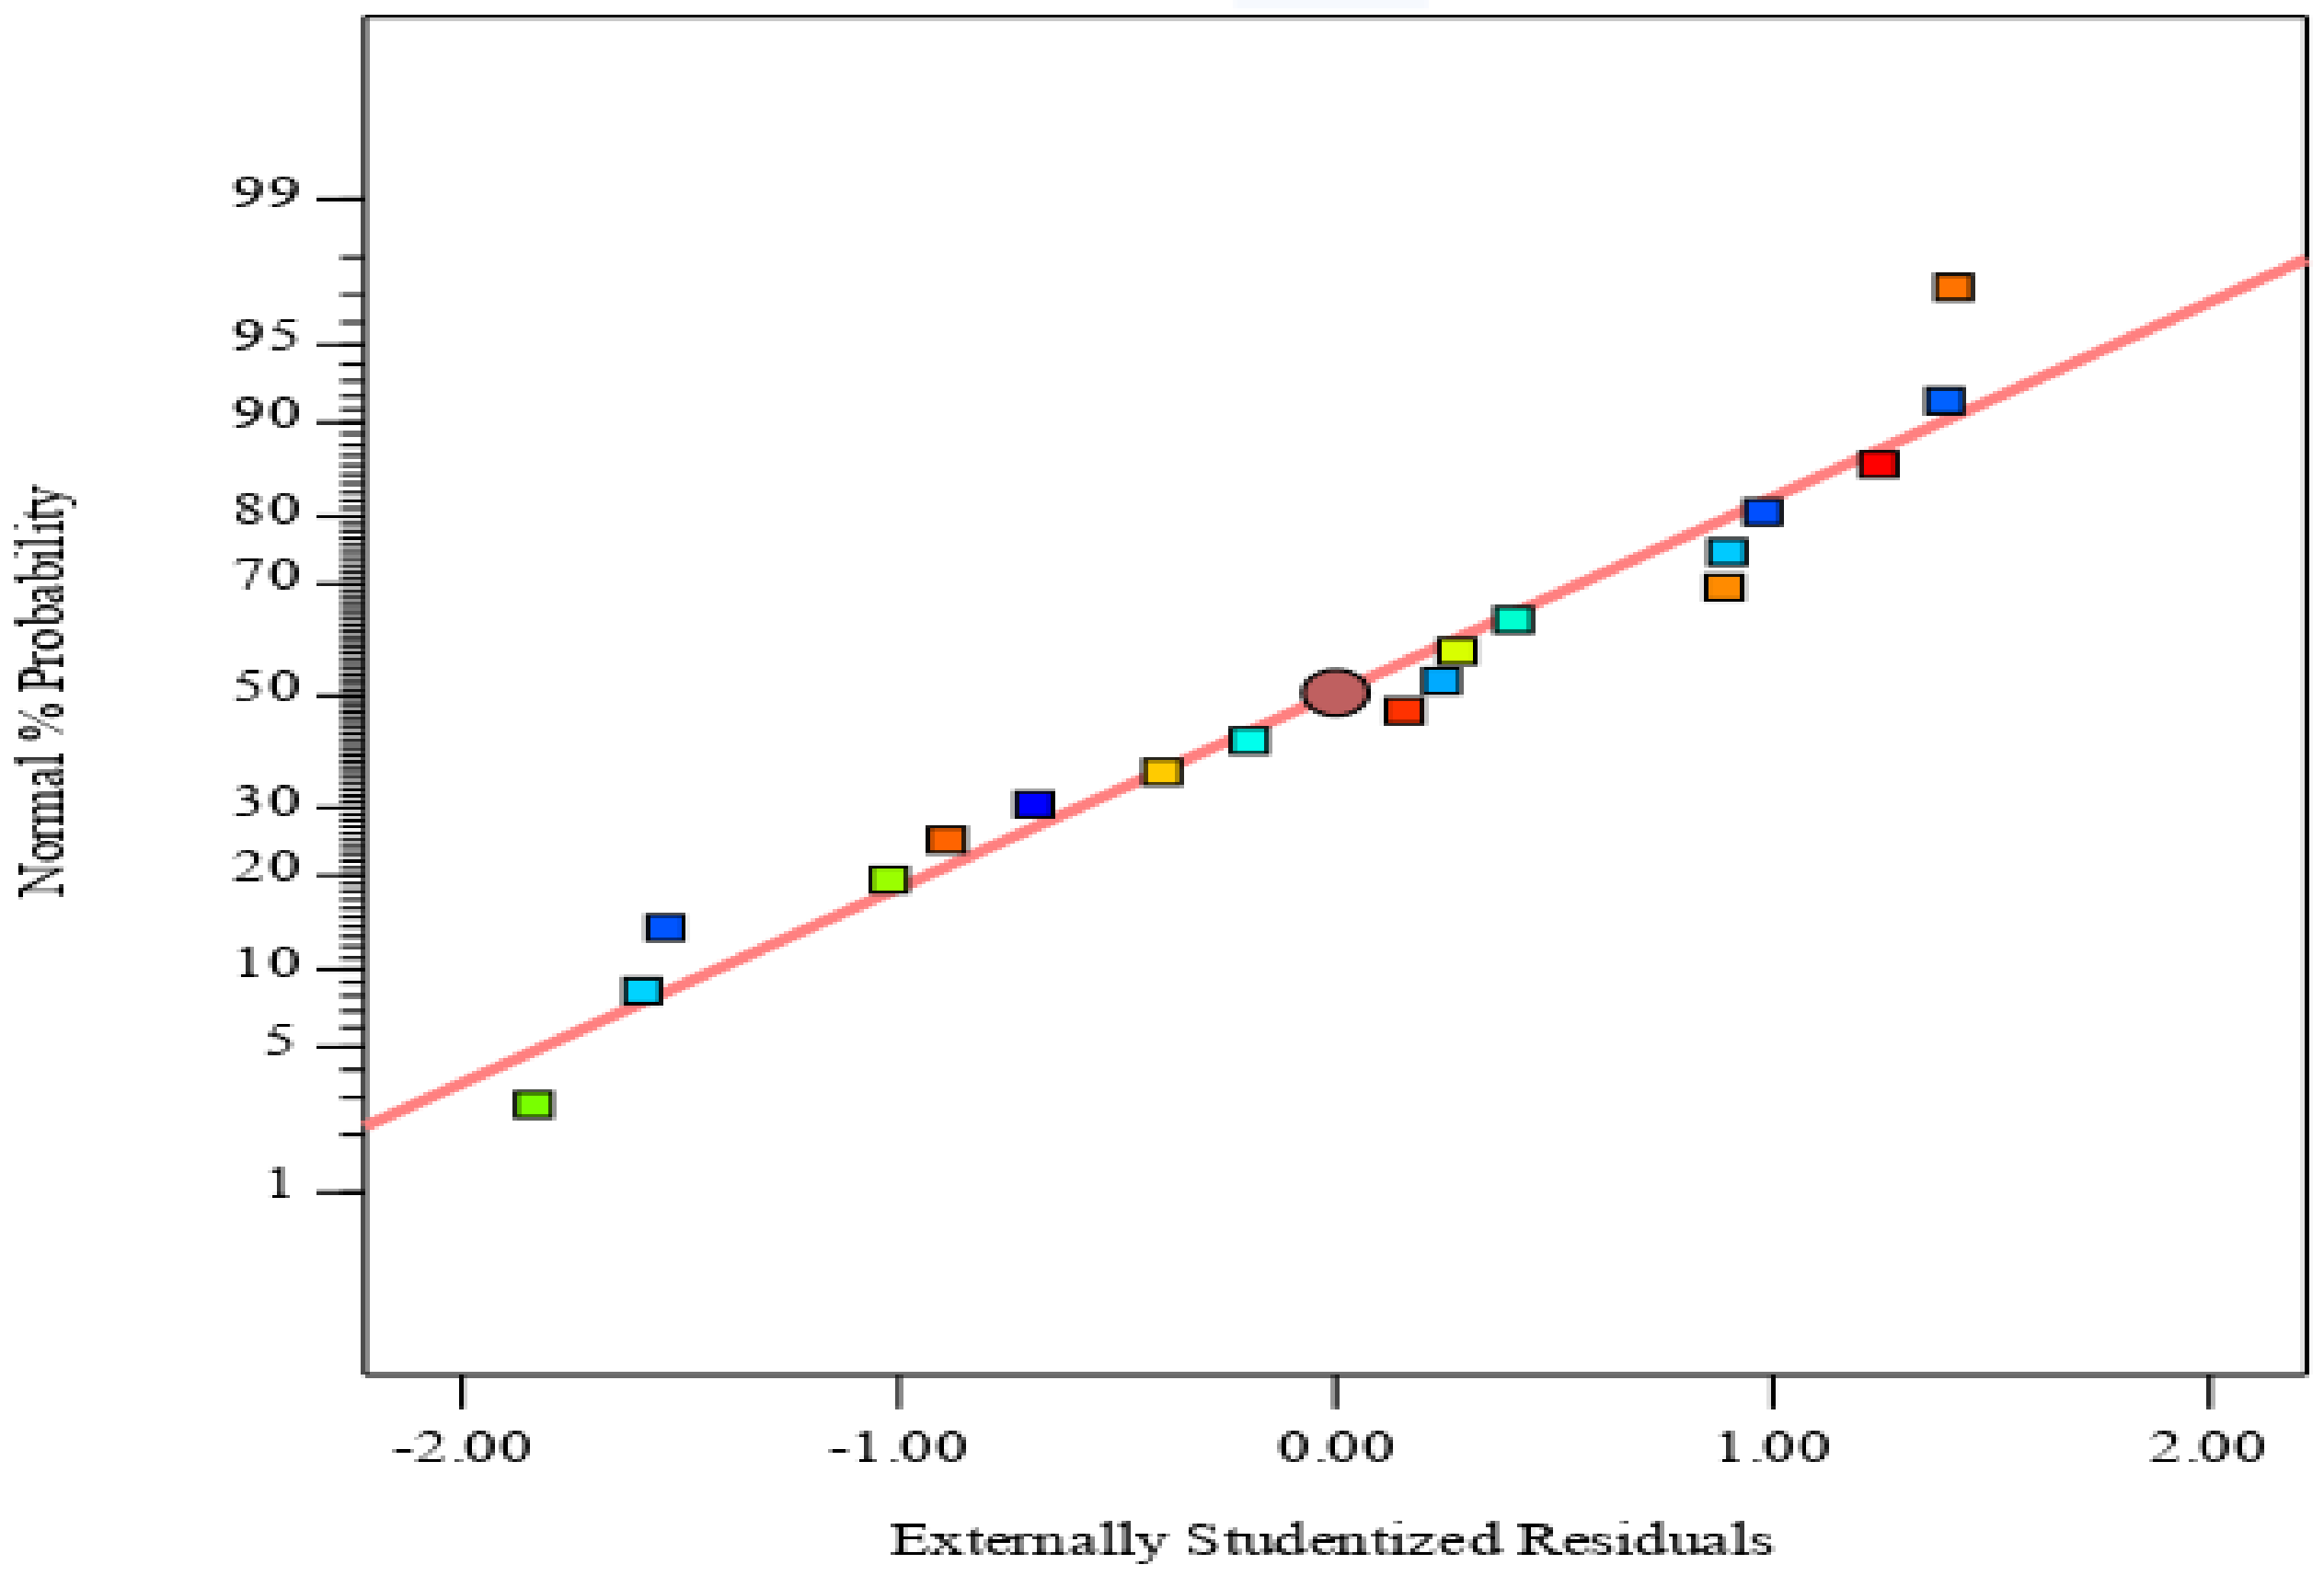
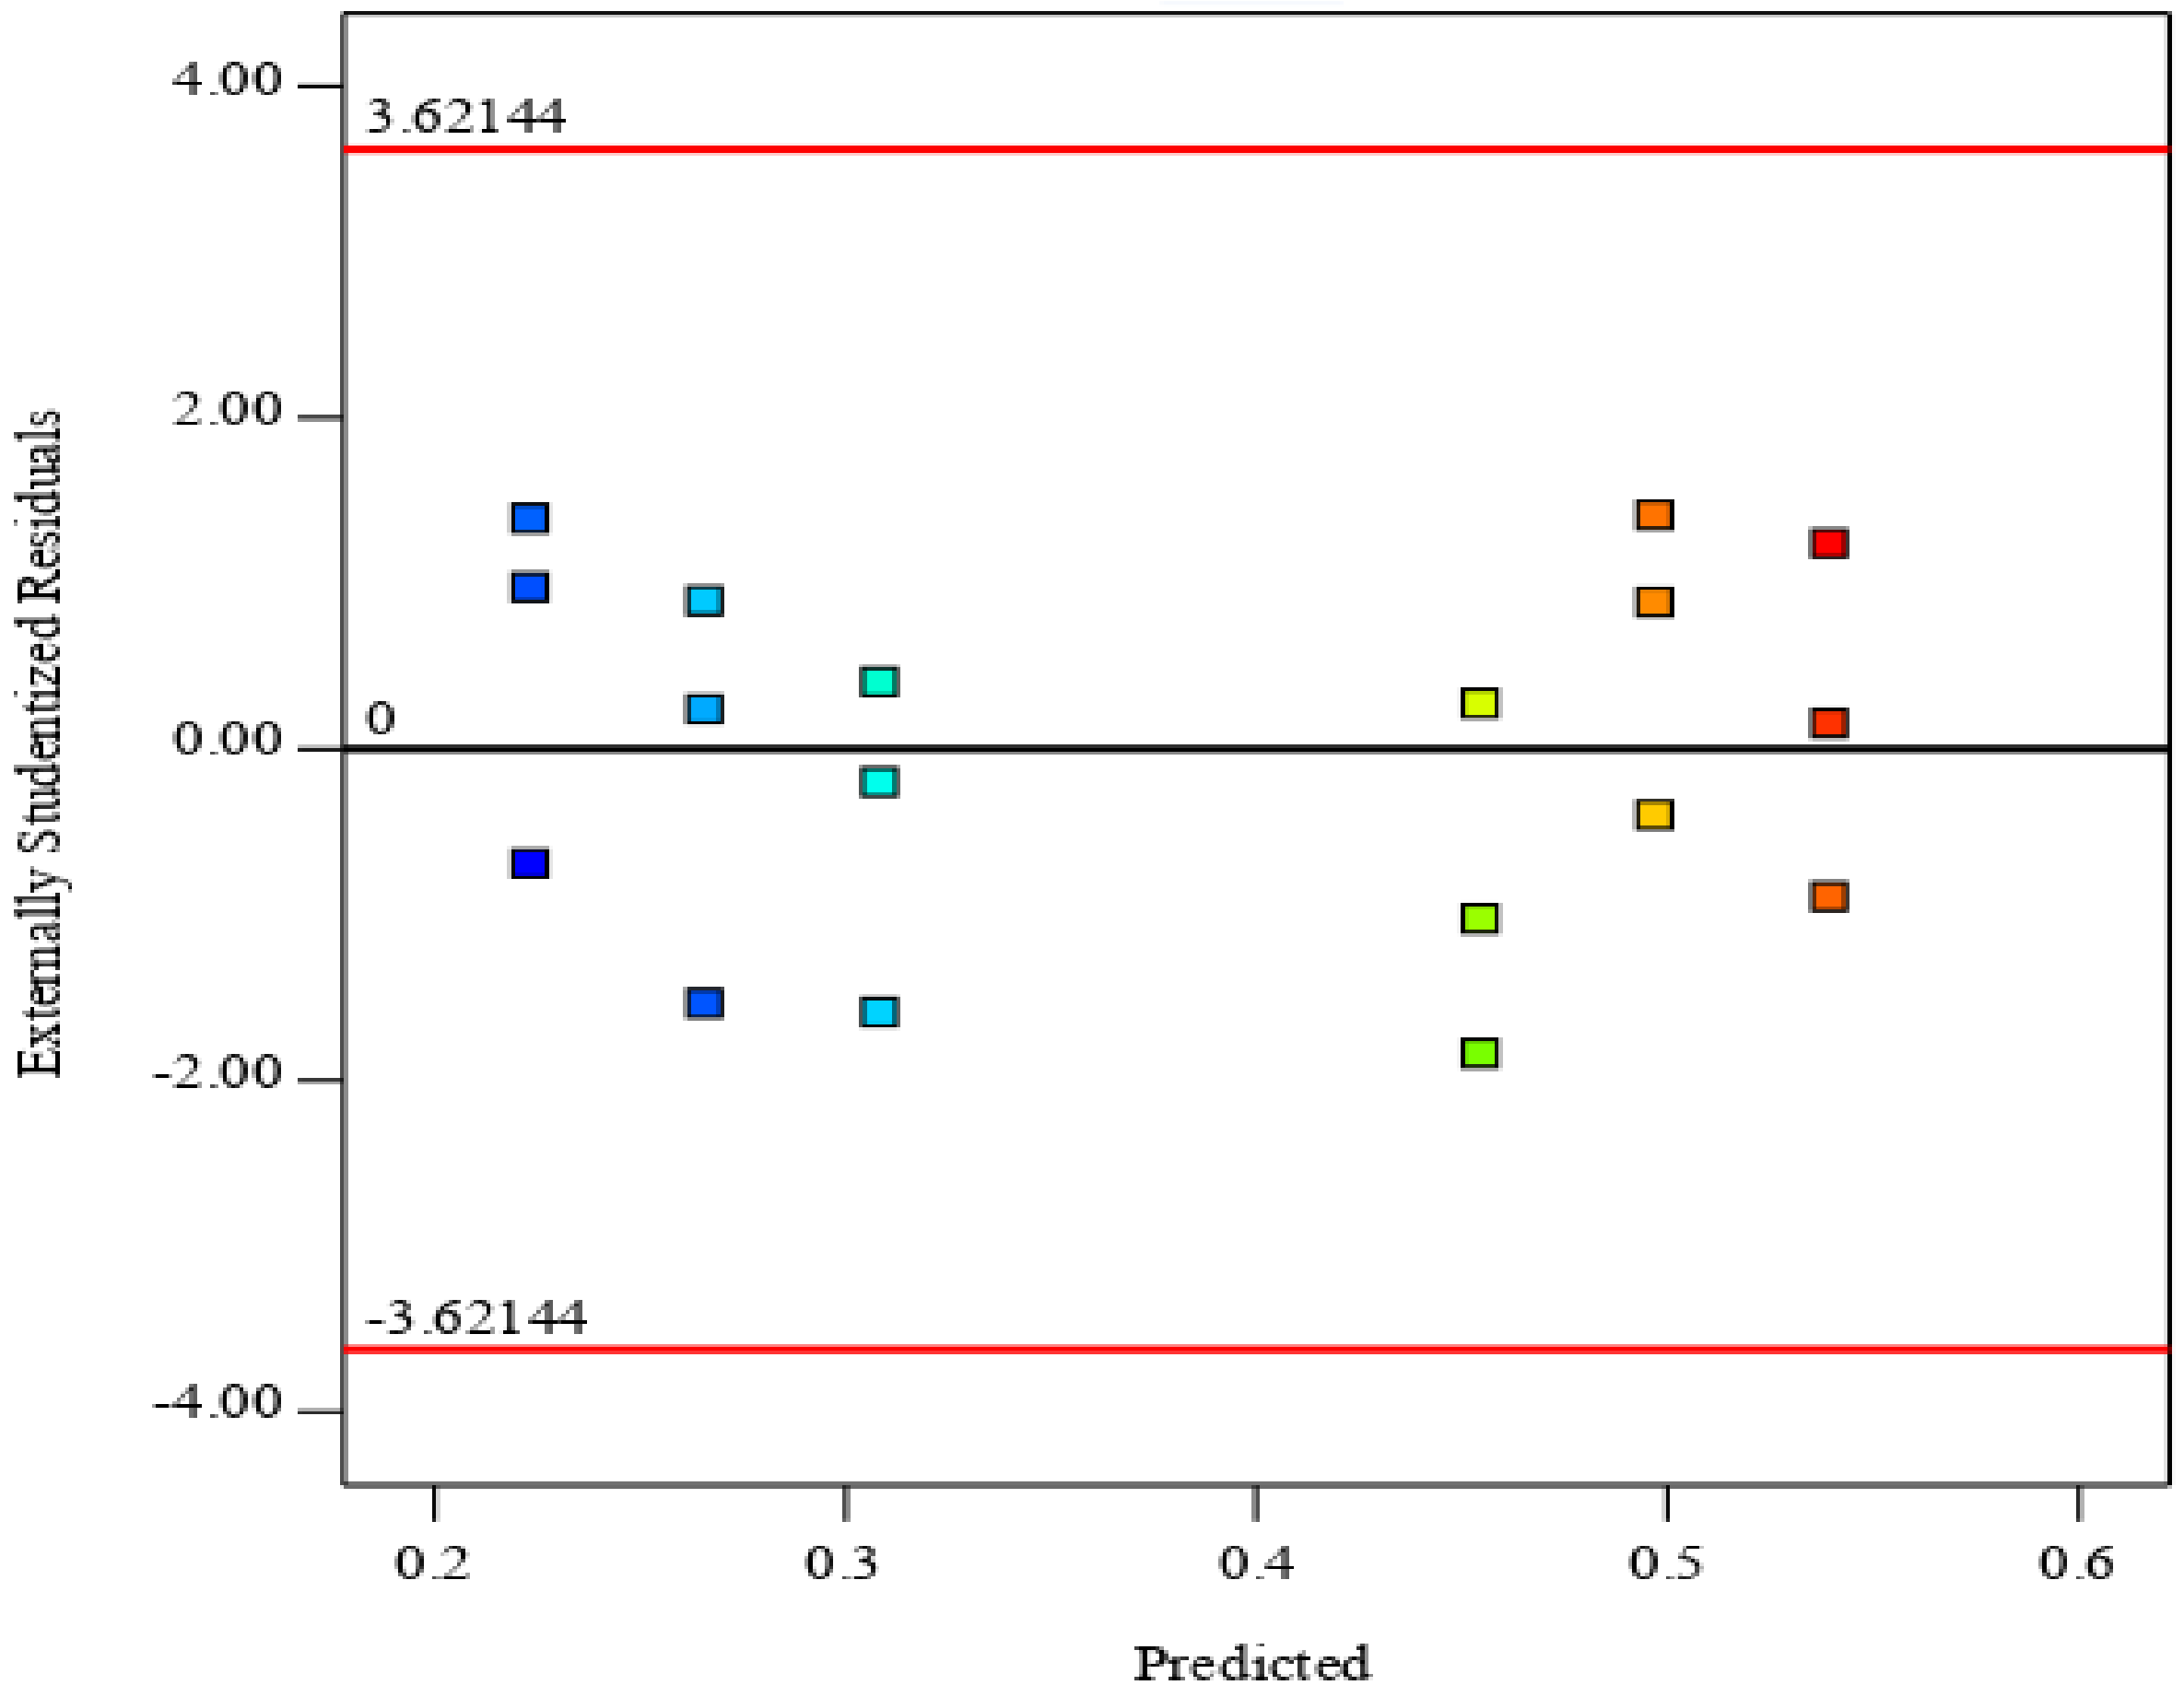
Few studies have evaluated warm mix asphalt at various production temperatures. Furthermore, all the previous studies have assessed the performance of warm mix asphalt incorporating steel slag aggregates using the additive Sasobit. Therefore, the objectives of this study are to investigate the characteristics of warm mix asphalt containing coarse steel slag aggregates, modified with LEADCAP. The warm mix asphalt was investigated at different mixing temperatures of, 150, 140, and 130 °C to introduce a better understanding and evaluation of the behavior of warm mix asphalt at different production temperatures. A response surface methodology by means of DESIGN EXPERT 11 [21] was conducted to develop prediction models for the performance of the warm mix asphalt as a contribution in terms of identifying the performances of the asphalt mixes at various production temperatures. The laboratory performance tests were stiffness modulus at the temperatures of 25 °C and 40 °C, dynamic stability, and moisture sensitivity. This study focused on the tests for permanent deformation and moisture sensitivity because warm mix asphalt is highly susceptible to permanent deformation and moisture damage.

2. Materials and Methods

2.1. Materials

The grade of the bitumen utilized to produce the asphalt mixes was 80/100, which is suitable for the wearing course. The characteristics of the base and modified bitumen are listed in Table 1. Also, an organic additive called LEADCAP was utilized to produce warm mix asphalt. LEADCAP is a wax-based component that consists of a crystal controller and an adhesion promoter to control the crystallization of the wax components at low temperatures and to improve the bonding between the aggregates and the binder [22]. LEADCAP is produced by KUMHO petrochemical (Seoul, South Korea). Figure 1 shows the LEADCAP additive. Electric arc furnace (EAF) steel slag was used as the coarse aggregate, while granite aggregates were utilized as the fine aggregates in the preparation of the asphalt mixes. The EAF steel slag was supplied by NCL chemicals Ltd. chemical products, Singapore. Table 2 displays the characteristics of the electric arc furnace steel slag and granite aggregates. The gradations of the aggregates are listed in Table 3.

2.2. Preparation of the Samples

In this study, the base binder (80/100) was modified with the warm mix asphalt additive LEADCAP with the wet process, using a high-shear mixer at 1000 RPM until homogeneity was achieved (i.e., 10 min). LEADCAP was introduced to the base binder at the dosage recommended by the supplier (2% by weight of the bitumen). The hot mix asphalt (HMA) was produced at a mixing temperature of 160 °C and compacted at a temperature of 150 °C. The warm mix asphalt was manufactured at different mixing temperatures (i.e., 150, 140, and 130 °C), and compacted at the compaction temperatures of 140, 130, and 120 °C, respectively. The control asphalt mixes incorporating the granite and steel slag aggregates were labeled as HG160°C and HS160°C, while the produced WMA containing steel slag aggregate at the temperatures of 150, 140, and 130 °C were coded as WS150°C, WS140°C, and WS130°C, respectively. The asphalt mixtures were produced in accordance with the specifications stated in Superpave mix design (SHRP-A-407) [32]. The aggregates were conditioned at the production temperature for at least four hours. Thereafter, the aggregates were blended with a binder using a 20 L auto mixer with a mixing speed of 75 RPM. The loose asphalt mixes were kept in the oven for at least two hours at the compaction temperature to simulate the short-term aging. Then, the conditioned asphalt mixes were compacted using a Superpave gyratory compactor (SGC, Controls Group, Milan, Italy) at 100 revolutions. The diameter and height of manufactured specimens were 100 ± 1 mm and 63 ± 2.5 mm, respectively. The optimum bitumen contents of the hot mix asphalt incorporating the granite and the coarse steel slag aggregate asphalt were 4.78% and 4.9%, respectively, while the optimum bitumen content of the warm mix asphalt was 4.8%. The slight decrease in the optimum bitumen content of the warm mix asphalt was caused by the LEADCAP additive, which decreased the viscosity of the bitumen due to the wax component. The densities of the asphalt mixes containing granite, steel slag aggregate, and LEADCAP were 2.343, 2.56, 2.564 g/cm3, respectively.

2.3. Laboratory Tests

The stiffness modulus (resilient modulus) test was carried out to investigate the stiffness of the asphalt mixes. The stiffness modulus of the asphalt mixes was used to describe the characteristics of the asphalt mixes. A universal testing machine (UTM-5P) (Inopave Group, Singapore) was utilized to conduct the stiffness modulus test. The stiffness modulus test was carried out in accordance with ASTM D7369 [33]. The test was conducted at two testing temperatures, i.e., 25 °C and 40 °C. However, a total of 15 samples with air void contents of 4 ± 1% were manufactured for this test. The specimens were conditioned in the environmental chamber for four hours at every testing temperature prior to the test. Thereafter, a load of 1000 N was applied to the specimens. The duration of the applied load with the haversine wave pulse was 0.1 s, while the rest period was 0.9 s.
To assess the permanent deformation of the asphalt mixes, the dynamic creep test was performed. The test was conducted using a universal testing machine (UTM-5P). The procedures of the dynamic stability test were conducted in accordance with BS DD 226 [34]. To accomplish this test, a total of 30 specimens with air void contents of 4 ± 1% were produced. The specimens were kept in the environmental chamber for four hours at the testing temperature of 40 °C. Thereafter, a stress of 10 kPa was applied for 120 s as a pre-load. Then, the specimens were subjected to different compressive stress i.e., 100 kPa and 200 kPa, for 1 h. The stress was applied with a square wave pulse consisting of 1 s for loading and 1 s for the rest period. The total number of load applications was 1800 cycles.
The test of moisture sensitivity was carried out to investigate the resistance to moisture damage of the asphalt mixes. The moisture sensitivity test was conducted according to the procedures stated in AASHTO T 283 [35]. To perform this test, 30 samples were produced. The air void content of the produced specimens was targeted at 7 ± 0.5%. Six specimens were manufactured for every mix. Three represented the dry condition, while the rest corresponded to the wet condition. In the dry condition, the specimens were kept in the environmental chamber for at least two hours at a temperature of 25 °C. Then, the specimens were subjected to an indirect tensile strength. For the wet condition, the samples were exposed to a water saturation of 70–80%. Thereafter, the specimens were conditioned in a water bath for 24 h at a temperature of 60 °C. Then, the specimens were immersed in the water bath for at least 2 h at a temperature of 25 °C. Thereafter, every sample was subjected to the applied indirect tensile strength at a constant rate of 50 mm/minute. The tensile strength of the asphalt mix should be higher than 80%. Figure 2 shows the tests setup of the stiffness modulus, dynamic creep, and moisture sensitivity.

3. Results and Discussion

3.1. The Stiffness Modulus of the Asphalt Mixes

The stiffness modulus of the asphalt mixes at 25 °C and 40 °C are shown in Figure 3 and Figure 4. As it is seen in the figures, the asphalt mixes composed of steel slag aggregate as the coarse portion exhibited better stiffness modulus results than the reference asphalt mix incorporating conventional aggregates. The higher stiffness modulus of HS160°C was caused by the superior toughness and angularity of the EAF steel slag aggregates. Furthermore, warm mix asphalt produced at 150 °C exhibited the highest stiffness modulus at 25 °C and 40 °C as compared to the other mixtures. The stiffness modulus of WS150°C at 25 °C was higher than that of the HS160°C by 18.6%, while at the 40 °C WS150°C showed a higher stiffness modulus than that of the HS160°C by about 11%. Also, the stiffness modulus of WS140°C at 25 °C and 40 °C were higher than that of the HS160°C by about 10% and 3%, respectively. The warm asphalt mix produced at the mixing temperature of 130 °C, which was lower than the control mix by 30 °C, showed similar stiffness modulus results to the HS160°C at the temperatures of 25 °C and 40 °C. Moreover, WMA produced at 150, 140, and 130 °C revealed better stiffness modulus than HG160°C. The higher stiffness modulus of the warm mix asphalt produced at the temperatures of 150 °C and 140 °C was attributed to the hardening and crystallization of the wax competent in the modified binder during the conditioning of the specimens to simulate short-term aging. As the production temperature of the warm mix asphalt increased, the bitumen hardening increased, and this, in turn, improved the stiffness of the asphalt mixes.

3.2. Permanent Deformation of the Asphalt Mixes

Figure 5 presents the results of the permanent deformation test at the applied stresses of 100 kPa and 200 kPa. It is clearly seen in Figure 5 that the higher accumulated strain indicates the lower resistance to permanent deformation of the asphalt mixes. As shown in Figure 5, HG160°C exhibited a slight decrease in permanent deformation resistance in comparison to HS160°C. On the other hand, the produced asphalt mix at the mixing temperature of 150 °C incorporated 2% of LEADCAP exhibited the lowest accumulated strain in comparison to the other mixes. The accumulated strain was lower than the HS160°C by about 25% and 20% for the applied stresses of 100 kPa and 200 kPa, respectively. Additionally, WS140°C exhibited better permanent deformation resistance than the HS160°C by about 15% and 9% for compressive stresses of 100 kPa and 200 kPa, respectively. The permanent deformation of the mixtures produced at the mixing temperature of 130 °C (WS130°C) was approximately comparable to that of the HS160°C mix. Furthermore, the warm mix asphalt produced at 150, 140, and 130 °C displayed lower accumulated strain than the reference mix incorporating natural aggregates (HG160°C). The better resistance to permanent deformation of the mixes incorporating the LEADCAP additive was caused by the crystallization of the wax component in the additive, which stiffened the binder [22].

3.3. Resisitance of the Aspahlt Mixes to Moisture Damage

Moisture susceptibility is the most serious concern associated with producing warm mix asphalt. The damage of moisture sensitivity in WMA is attributed to the incomplete drying of the aggregates and the coating of the aggregate with bitumen due to the lowering of the production temperature. Modifying the binder with WMA additive may decrease the efficacy of the bonding between the binder and the surface of the aggregates. In this study, the efficiency of using LEADCAP in producing WMA was investigated through a test of moisture susceptibility. The conditioned and unconditioned indirect tensile strengths, as well as the ratio of the tensile strength of the asphalt mixes, are demonstrated in Figure 6 and Figure 7. It is shown in Figure 7 that HG160°C demonstrated slightly higher resistance to moisture damage, compared to HS160°C. This was caused by the high porosity of the EAF steel slag aggregates. Additionally, it is seen in the figures that WS150°C displayed a higher tensile strength ratio (TSR) and indirect tensile strength (ITS) than the reference asphalt mixes. Production of the warm mix asphalt at 140 °C exhibited higher ITS and TSR than that of the HS160°C. This is because the LEADCAP additive contained an adhesion promoter. Decreasing the production temperature by 30 °C slightly decreased the indirect tensile strength and tensile strength ratios in comparison to the control mixes produced at 160 °C. As the manufacturing temperature of the warm mix asphalt increased, the tensile strength and ratio of tensile strength improved.

4. Developing Prediction Models for the Performance of the Warm Mix Asphalt

Response surface methodology (RSM) was utilized, by means of DESIGN EXPERT 11, to develop prediction models for the stiffness modulus and accumulated strain of the warm mix asphalt incorporating LEADCAP and the coarse steel slag aggregate. The response surface methodology (RSM) approach is used to illustrate the relationship and correlations between different factors (variables) and responses through the development of a mathematical model. Hence, the responses are predicted based on the relationship and correlation between the factors and the responses. The response surface methodology approach offers different mathematical equations i.e., linear, 2FI, quadratic, cubic, fifth-, and sixth-order, to introduce the best equation to most accurately describe the correlations between the factors and the responses.
The prediction models were developed to study the effect of the production temperatures on the performance of WMA. This is because the WMA was produced at different production temperatures i.e., 150, 140, and 130 °C. The prediction models were developed for the stiffness modulus and accumulated strain because the results of these tests are based on the factors of the tests, such as the testing and production temperatures for the stiffness modulus test, while the factors of the dynamic creep test are the applied stress and the production temperature. However, the results of the moisture sensitivity test were not considered in developing the prediction model. This is because the tensile strength ratio (TSR) is determined through the dry indirect tensile strength and the wet indirect tensile strength. Therefore, the factors of the moisture sensitivity are the results of the test, and in this case, the model cannot be considered as a prediction model since the factors are the obtained results. Moreover, developing a prediction model for the moisture susceptibility test based on the factor of production temperature and the response of TSR may introduce an inappropriate model. This is because that the main factors that affect the TSR, the dry and wet indirect tensile strength, are not included.

4.1. Developing a Prediction Model for the Stiffness Modulus of Warm Mix Asphalt

Table 4 summarizes the input data of the response surface methodology to develop a prediction model for the stiffness modulus of the warm mix asphalt. Table 4 consists of two factors: the testing temperatures and the production temperatures, while the response is the results obtained from the stiffness modulus test. Table 5 presents the fit summary of the models. As reported in Table 5, the two-factor interaction model (2FI) adequately fits the data, since the lack of fit is insignificant and the coefficient of determination (R2) is very strong. Lack of fit is used to describe the adequacy of the model based on the functional relationship between the independent and the dependent variables. The insignificant lack of fit (p-value > 0.05) indicates that the model fits the data well, while the significant lack of fit implies that the model does not accurately fit the data, which in turn requires the addition of new terms or a transformation of the data. Furthermore, the difference between the adjusted and predicted coefficient of determination (R2) of the 2FI model was less than 0.2, which implies that the model fits the data. Table 6 shows the outputs of the ANOVA for the 2FI model. It can be seen that the model is significant since the p-value is less than 0.05. Also, the significant p-value of the factors indicates that the testing temperatures and production temperatures have a significant influence on the stiffness modulus. This reveals that there is a very strong agreement between the factors and the response. The 2FI model is described in Equation (1).
Figure 8 displays the error distributions of the relationships between the testing temperatures, production temperatures, and stiffness modulus at 25 °C and 40 °C. The error distribution refers to normality. As seen in Figure 8, the residuals are close to the straight line, which indicates that the residuals are distributed normally. Also, the Anderson–Darling test was conducted to check the residual distribution. The outputs of the Anderson–Darling displayed test that the p-value was insignificant (p-value = 0.255 > 0.05), which indicates that the residuals are distributed normally. Figure 9 shows the correlation between the actual and predicted values. The correlation between the actual and predicted values was used to check the ability of the model to predict the dependent variables. It is seen in Figure 9 that the actual and predicted values were close to the 1:1 line, which indicates that the model is capable of predicting the stiffness modulus at 25 °C and 40 °C. Figure 10 illustrates the interaction between the factors and the responses. The function of this figure is to introduce a better understanding of the relationship between the testing temperatures, production temperatures, and stiffness modulus. As can be observed from Figure 10, there was a significant influence of the testing temperatures and production temperatures on the stiffness modulus. The higher the production temperature, the better the stiffness modulus was, while the higher the testing temperature, the lower the stiffness modulus.

4.2. Developing a Prediction Model for the Accumlated Strain of the Warm Mix Asphalt

Table 7 displays the data input to DESIGN EXPERT. In Table 7, the factors represent the compressive stress and the production temperatures applied, while the response was the observed values of the accumulated strain at the applied loads of 100 kPa and 200 kPa. The fit summary of the models is summarized in Table 8. As reported in Table 8, a linear model is suggested to predict the accumulated strain of the warm mix asphalt. This is because the sequential p-value is significant, while the sequential p-value of the other models was not significant. Also, the lack of fit of the linear model is insignificant because the p-value is greater than 0.05. This, in turn, suggests that the model suits the data. The high coefficient of determination of the linear model implies that there is a very strong relationship between the compressive stress, production temperatures, and accumulated strain applied. In addition, the less difference between the adjusted R2 and predicted R2, which was less than 0.2, refers to the high agreement between the factors and the response.
Table 9 shows the ANOVA for the linear model. As seen in Table 9, the significant p-value of the factors implies that the applied compressive stress and production temperatures had a considerable effect on the accumulated strain of the warm mix asphalt. The linear model is expressed in Equation (2).
The assumptions of the linear model should be investigated to examine its adequacy. Figure 11 illustrates the assumptions of the normality of the linear regression. The plot of normal probability displays the shape of the error distribution. The straight distribution of the errors indicates that linear regression fits the data well, whereas the other shapes such as right skew, left skew, S, or long and short tails, imply that the error distribution is not normal, and thus that linear regression is not suitable. As seen in Figure 11, the residuals are distributed normally, since the points are close to the line of the theoretical residual. In addition, the Anderson–Darling test was carried out to check the assumption of normality. The p-value of the Anderson–Darling test was insignificant (p-value = 0.3505 > 0.05), which indicates that the errors were normally distributed.
A plot of the externally studentized residuals versus the predicted values was used to assess the assumption of homoscedasticity (equal variance). In other words, linear regression assumes that the variance in the residual versus predicted value plot is constant, with a symmetric shape. Therefore, a symmetrically shaped distribution of errors around the zero in the scatter plot indicates homoscedasticity, while asymmetric shapes in the scatter plot are heteroscedastic. The asymmetric shapes in the scatter plot indicate that the linear model is not suitable. Figure 12 shows that the predicted values versus residual values are distributed around zero in a symmetric shape. Thus, the linear model was suitable to predict the accumulated strain of the warm mix asphalt.
To check the assumption of independence in the linear regression, a plot of the externally studentized residuals versus the run number is worthwhile. The residuals versus run number plot is used to detect autocorrelation between disturbances. Autocorrelation occurs when the residuals have a pattern where they remain positive or negative. As shown in Figure 13, there was no autocorrelation among the disturbances, since the residuals randomly transitioned between positive and negative values, which indicates that the dependent variable of accumulated strain was not independent.
The plot of the actual versus predicted values is influential to understand the linear relationship between the actual and the predicted values. Also, the assumption of linearity was checked through a plot of the relationship between the actual and the predicted values. As observed in Figure 14, there is a strong agreement between the actual and predicted values, since the data of the actual values and predicted values are close to the 1:1 line. The strong agreement indicates the capability of the linear model to predict the accumulated strain. The regression coefficient of the variance inflation factor (VIF) was utilized to check the assumption of multicollinearity in the models. The VIF is determined based on the variance of the predicted model divided by the variance of every factor. Multicollinearity occurs when the independent variables are highly correlated to each other, and thus a large change may occur in the model if one of the factors is removed or changed. To ensure that the multicollinearity assumption is met, the VIF value should not exceed 5. The variance inflation factor for the factors of the linear model was 1, which implies that the multicollinearity assumption is met. To introduce a better understanding of the effect of the applied compressive stress and production temperatures on the accumulated strain of the warm mix asphalt, Figure 15 is worthwhile. As indicated in Figure 15, the applied compressive stress and production temperatures have a great influence on the accumulated strain of the warm mix asphalt. As the applied load increases, the accumulated strain significantly increase. Also, the higher the production temperature, the better the permanent deformation resistance.

5. Conclusions

This study aimed to investigate the characteristics of warm mix asphalt incorporating coarse steel slag aggregate. The findings of the study illustrate that asphalt mixes incorporating EAF steel slag exhibited better characteristics than the asphalt mixes made with conventional mixes. The stiffness modulus of the produced warm mix asphalt at 150 °C was the best performing, as compared to the other production temperatures. The warm mix asphalt produced at 30 °C lower than the reference mix (HMA) exhibited a comparable stiffness modulus to the stiffness modulus of the reference mix incorporated steel slag. Also, the warm mix asphalt produced at a mixing temperature of 10 °C lower than the hot mix asphalt exhibited superior permanent deformation resistance than the other mixes. Moreover, decreasing the production temperature up to 30 °C less than the control mix resulted in a similar permanent deformation resistance to that of the control asphalt mix (HMA). The results of the moisture susceptibility experiment demonstrated that the resistance of the produced warm mix asphalt at 130 °C to moisture damage was slightly lower than that of the reference mixes, while the moisture damage resistance of the produced warm mix asphalt at 150 °C was the best. Furthermore, the produced warm mix asphalt at 150, 140, and 130 °C revealed higher stiffness modulus and permanent deformation resistance in comparison to the HMA incorporated natural aggregates. In general, as the mixing temperatures increased, the performance of the warm mix asphalt improved. However, producing the warm mix asphalt mixtures incorporating EAF coarse steel slag aggregate at a temperature of 130 °C is recommended since the results of the performance tests showed performance comparable to that of hot mix asphalt.

Author Contributions

Conceptualization, A.M.A.; methodology, A.M.A. and M.Y.A.; software, A.M.A.; validation, A.M.A., M.Y.A., H.Y.B.K., and M.R.I.; formal analysis, A.M.A.; investigation, A.M.A.; resources, A.M.A.; data curation, A.M.A., M.Y.A., H.Y.B.K., and M.R.I.; writing—original draft preparation, A.M.A., M.Y.A., H.Y.B.K., and M.R.I.; writing—review and editing, A.M.A., M.Y.A., H.Y.B.K., and M.R.I.; visualization, A.M.A.; supervision, M.Y.A.; funding acquisition, H.Y.B.K. All authors have read and agreed to the published version of the manuscript.

Funding

This research is supported by Universiti Tenaga Nasional Malaysia (BOLD 2020 RJO10517844/046).

Institutional Review Board Statement

Not applicable.

Informed Consent Statement

Not applicable.

Data Availability Statement

The presented data are available in the article.

Acknowledgments

The authors would like to express their gratitude for the provided support by Universiti Tun Hussien Onn Malaysia and Universiti Tenaga Nasional.

Conflicts of Interest

The authors declare no conflict of interest.

References

  1. D’Angelo, J.A.; Harm, E.E.; Bartoszek, J.C.; Baumgardner, G.L.; Corrigan, M.R.; Cowsert, J.E.; Prowell, B.D. Warmmix Asphalt: European Practice (No. FHWA-PL-08-007); Federal Highway Administration: Washington, DC, USA, 2008.
  2. Prowell, B.D.; Hurley, G.C.; Frank, B. Warm-Mix Asphalt: Best practices; National Asphalt Pavement Association: Lanham, MD, USA, 2011. [Google Scholar]
  3. Song, M.; Lee, K.; Oh, S.H.; Bae, M.S. Impact of Polycyclic Aromatic Hydrocarbons (PAHs) from an Asphalt Mix Plant in a Suburban Residential Area. Appl. Sci. 2020, 10, 4632. [Google Scholar] [CrossRef]
  4. Cheraghian, G.; Falchetto, A.C.; You, Z.; Chen, S.; Kim, Y.S.; Westerhoff, J.; Wistuba, M.P. Warm mix asphalt technology: An up to date review. J. Clean. Prod. 2020, 268, 122128. [Google Scholar] [CrossRef]
  5. Young, T.J. Energy Conservation in Hot-Mix Asphalt Production; National Asphalt Pavement Association: Lanham, MD, USA, 2007. [Google Scholar]
  6. Olard, F.; Le Noan, C.; Beduneau, E.; Romier, A. Low energy asphalts for sustainable road construction. In Proceedings of the 4th Eurasphalt and Eurobitume Congress, Copenhagen, Denmark, 21–23 May 2008. [Google Scholar]
  7. Li, B.; Wang, Y.; Ren, X.; Teng, X.; Su, X. Influence of ultraviolet aging on adhesion performance of warm mix asphalt based on the surface free energy theory. Appl. Sci. 2019, 9, 2046. [Google Scholar] [CrossRef] [Green Version]
  8. Cheraghian, G.; Wistuba, M.P. Ultraviolet aging study on bitumen modified by a composite of clay and fumed silica nanoparticles. Sci. Rep. 2020, 10, 1–17. [Google Scholar] [CrossRef] [PubMed]
  9. Behnood, A.; Ameri, M. Experimental investigation of stone matrix asphalt mixtures containing steel slag. Sci. Iranica 2012, 19, 1214–1219. [Google Scholar] [CrossRef] [Green Version]
  10. Ziari, H.; Nowbakht, S.; Rezaei, S.; Mahboob, A. Laboratory investigation of fatigue characteristics of asphalt mixtures with steel slag aggregates. Adv. Mater. Sci. Eng. 2015, 2015. [Google Scholar] [CrossRef] [Green Version]
  11. Alnadish, A.; Aman, Y. A study on the economic using of steel slag aggregate in asphalt mixtures reinforced by aramid fiber. ARPN J. Eng. Appl. Sci. 2018, 13, 276–292. [Google Scholar]
  12. Ahmedzade, P.; Sengoz, B. Evaluation of steel slag coarse aggregate in hot mix asphalt concrete. J. Hazard. Mater. 2009, 165, 300–305. [Google Scholar] [CrossRef] [PubMed]
  13. Chen, J.S.; Wei, S.H. Engineering properties and performance of asphalt mixtures incorporating steel slag. Constr. Build. Mater. 2016, 128, 148–153. [Google Scholar] [CrossRef]
  14. Alnadish, A.M.; Aman, M.Y.; Katman, H.Y.B.; Ibrahim, M.R. Influence of the Long-Term Oven Aging on the Performance of the Reinforced Asphalt Mixtures. Coatings 2020, 10, 953. [Google Scholar] [CrossRef]
  15. Alnadish, A.M.; Aman, M.Y.; Katman, H.Y.B.; Ibrahim, M.R. Laboratory assessment of the performance and elastic behavior of asphalt mixtures containing steel slag aggregate and synthetic fibers. Int. J. Pavement Res. Technol. 2021, 14, 473–481. [Google Scholar] [CrossRef]
  16. Ameri, M.; Hesami, S.; Goli, H. Laboratory evaluation of warm mix asphalt mixtures containing electric arc furnace (EAF) steel slag. Constr. Build. Mater. 2013, 49, 611–617. [Google Scholar] [CrossRef]
  17. Goli, H.; Hesami, S.; Ameri, M. Laboratory evaluation of damage behavior of warm mix asphalt containing steel slag aggregates. J. Mater. Civil Eng. 2017, 29, 04017009. [Google Scholar] [CrossRef]
  18. Amelian, S.; Manian, M.; Abtahi, S.M.; Goli, A. Moisture sensitivity and mechanical performance assessment of warm mix asphalt containing by-product steel slag. J. Cleaner Prod. 2018, 176, 329–337. [Google Scholar] [CrossRef]
  19. Ziaee, S.A.; Behnia, K. Evaluating the effect of electric arc furnace steel slag on dynamic and static mechanical behavior of warm mix asphalt mixtures. J. Cleaner Prod. 2020, 274, 123092. [Google Scholar] [CrossRef]
  20. Rubio, M.C.; Martínez, G.; Baena, L.; Moreno, F. Warm mix asphalt: An overview. J. Cleaner Prod. 2012, 24, 76–84. [Google Scholar] [CrossRef]
  21. Design-Expert. Available online: https://www.statease.com/docs/v11/ (accessed on 31 March 2021).
  22. Kim, Y.; Lee, J.; Baek, C.; Yang, S.; Kwon, S.; Suh, Y. Performance evaluation of warm-and hot-mix asphalt mixtures based on laboratory and accelerated pavement tests. Adv. Mater. Sci. Eng. 2012, 2012. [Google Scholar] [CrossRef] [Green Version]
  23. ASTM. Standard Test Method for Penetration of Bituminous Materials; American Society for Testing and Materials: West Conshohocken, PA, USA, 2013. [Google Scholar]
  24. ASTM. Standard Test Method for Softening Point of Bitumen (Ring-and-Ball Apparatus); American Society for Testing and Materials: West Conshohocken, PA, USA, 2014. [Google Scholar]
  25. ASTM. Standard Test Method for Viscosity Determination of Asphalt at Elevated Temperatures Using a Rotational Viscometer; American Society for Testing and Materials: West Conshohocken, PA, USA, 2015. [Google Scholar]
  26. ASTM. Standard Test Method for Standard Test Method for Ductility of Bituminous Materials; American Society for Testing and Materials: West Conshohocken, PA, USA, 2007. [Google Scholar]
  27. ASTM. Resistance to Abrasion of Small-Size Coarse Aggregate by Use of the Los Angeles Machine; American Society for Testing and Materials: West Conshohocken, PA, USA, 1989. [Google Scholar]
  28. IS. Methods of Test for Aggregates; Bureau of Indian Standards: Manek Bhawan, India, 1963.
  29. ASTM. Standard Test Method for Relative Density (Specific Gravity) and Absorption of Coarse Aggregate; American Society for Testing and Materials: West Conshohocken, PA, USA, 2015. [Google Scholar]
  30. ASTM. Standard Test Method for Flat Particles, Elongated Particles, or Flat and Elongated Particles in Coarse Aggregate; American Society for Testing and Materials: West Conshohocken, PA, USA, 2010. [Google Scholar]
  31. ASTM. Standard Test Method for Determining the Percentage of Fractured Particles in Coarse Aggregate; American Society for Testing and Materials: West Conshohocken, PA, USA, 2013. [Google Scholar]
  32. Cominsky, R.J.; Huber, G.A.; Kennedy, T.W.; Anderson, M. The Superpave Mix Design Manual for New Construction and Overlays; No. SHRP-A-407; Strategic Highway Research Program: Washington, DC, USA, 1994. [Google Scholar]
  33. ASTM. Standard Test Method for Determining the Resilient Modulus of Bituminous Mixtures by Indirect Tension Test; American Society for Testing and Materials: West Conshohocken, PA, USA, 2011. [Google Scholar]
  34. Standard, B. Method for Determining Resistance to Permanent Deformation of Bituminous Mixtures Subject to Unconfined Dynamic Loading; Draft for Development; British Standards Institution: London, UK, 1996; Volume 226. [Google Scholar]
  35. Aashto, T. Standard Method of Test for Resistance of Compacted Asphalt Mixtures to Moisture-Induced Damage; American Association of State and Highway Transportation Officials: Washington, DC, USA, 2007. [Google Scholar]
Figure 1. LEADCAP additive.
Applsci 11 03708 g001
Figure 2. Laboratory tests: (a) stiffness modulus (b) dynamic creep; (c) Indirect tensile strength.
Applsci 11 03708 g002
Figure 3. Stiffness modulus and the standard error bars of the mixes at 25 °C.
Applsci 11 03708 g003
Figure 4. Stiffness modulus and the standard error bars of the mixes at 40 °C.
Applsci 11 03708 g004
Figure 5. Accumulated strain and the standard error bars of the asphalt mixtures.
Applsci 11 03708 g005
Figure 6. Indirect tensile strength and the standard error bars of the asphalt mixes.
Applsci 11 03708 g006
Figure 7. Tensile strength ratio and the standard error bars of the mixes.
Applsci 11 03708 g007
Figure 8. Plot of normality of 2FI model.
Applsci 11 03708 g008
Figure 9. Plot of actual versus predicted values of the 2FI model.
Applsci 11 03708 g009
Figure 10. Plot of the interaction between the factors and the response of the 2FI model.
Applsci 11 03708 g010
Figure 11. Plot of the normal probability of the linear model.
Applsci 11 03708 g011
Figure 12. Plot of the externally residuals versus predicted values of the linear model.
Applsci 11 03708 g012
Figure 13. Plot of the externally residuals versus run number of the linear model.
Applsci 11 03708 g013
Figure 14. Plot of the actual versus predicted values of the linear model.
Applsci 11 03708 g014
Figure 15. Plot of the interaction between the factors and the response of the linear model.
Applsci 11 03708 g015
Table 1. Characteristics of the base and modified binders.
PropertiesBase BinderModified BinderTest Basis
Grade of binder80/10080/100-
Penetration grade (0.1 mm)9384ASTM D5 [23]
Softening Point (°C)4547ASTM D36 [24]
Viscosity @ 135 °C (cP)487398-
Viscosity @ 165 °C (cP)144123ASTM D4402 [25]
Ductility @ 25 °C (cm)˃100˃100ASTM D113 [26]
Table 2. Characteristics of the aggregates.
PropertiesGraniteEAF Steel SlagLimitsTest Basis
Loss Angeles Abrasion (%)2217.80≤25%ASTM C131 [27]
Aggregate Crushing Value (%)2522.60≤25%IS: 2386 (Part IV) [28]
Density (g/cm3)2.633.22N/AASTM C127 [29]
Absorption (%)0.842.75≤3%ASTM C127
Elongated and Flat Particles (%)8.403.90≤10%ASTM D4791 [30]
Coarse angularity (%)8495≥80%ASTM D5821 [31]
Content of free CaO (%)-1.17≤4%-
Table 3. Gradation of the EAF steel slag and granite aggregates.
Sieve Size (mm)Passing (%)Retained (%)
19100-
12.5955
9.58510
4.756025
2.364317
1.183310
0.6267
0.3206
0.075515
Pan-5
Table 4. Input data of the stiffness modulus model.
Testing Temperature (°C)Production Temperature (°C)Stiffness Modulus (MPa)
25.00130.006079
25.00130.006301
25.00130.006507
40.00130.00825
40.00130.00811
40.00130.00715
25.00140.006570
25.00140.007010
25.00140.006897
40.00140.00925
40.00140.00725
40.00140.00832
25.00150.007105
25.00150.007422
25.00150.007542
40.00150.00905
40.00150.00815
40.00150.00955
Table 5. Fit summary of the models.
SourceSequential p-ValueLack of Fit p-ValueR2Adjusted R2Predicted R2Performance
Linear<0.00010.00320.99380.99300.9906
2FI0.00010.99620.99790.99750.9966Suggested
Quadratic0.94810.95330.99790.99730.9961Aliased
Table 6. ANOVA for the 2FI model.
SourceSum of SquaresdfMean SquareF-Valuep-ValuePerformance
Model1.633 × 10835.442 × 1072270.79<0.0001Significant
A-Testing temperature (°C)5.475 × 10715.475 × 1072284.79<0.0001Significant
B-Production temperature (°C)1.024 × 10611.024 × 10642.74<0.0001Significant
AB6.807 × 10516.807 × 10528.400.0001Significant
Residual3.355 × 1051423,964.56
Lack of Fit213.782106.890.00380.9962Not significant
Pure Error3.353 × 1051227,940.83
Cor Total1.636 × 10817
Stiffness Modulus (MPa) = −1727.11 + 45.13 × testing temperature (°C) + 132.42 × production temperature (°C) − 3.176 × testing temperature (°C) × production temperature °C (1).
Table 7. Input data of the accumulated strain model.
Compressive Stress (kPa)Production Temperature (°C)Accumulated Strain (%)
100.00130.000.284
100.00130.000.315
100.00130.000.305
200.00130.000.559
200.00130.000.542
200.00130.000.525
100.00140.000.270
100.00140.000.241
100.00140.000.281
200.00140.000.520
200.00140.000.512
200.00140.000.490
100.00150.000.239
100.00150.000.245
100.00150.000.212
200.00150.000.459
200.00150.000.427
200.00150.000.438
Table 8. Fit summary of the models.
SourceSequential p-ValueLack of Fit p-ValueR2Adjusted R2Predicted R2Performance
Linear<0.00010.29230.98200.97960.9740Suggested
2FI0.13370.45130.98480.98150.9749
Quadratic0.46620.30820.98540.98090.9722Aliased
Table 9. ANOVA for the linear model.
SourceSum of SquaresdfMean SquareF-Valuep-ValuePerformance
Model0.262020.1310409.13<0.0001Significant
A-Compressive stress (kPa)0.240410.2404750.57<0.0001Significant
B-Production temperature (°C)0.021710.021767.69<0.0001Significant
Residual0.0048150.0003
Lack of Fit0.001230.00041.390.2923Insignificant
Pure Error0.0036120.0003
Cor Total0.266817
Accumulated strain (%) = 0.629667 + 0.002311 × compressive stress (kPa) − 0.004250 × production temperature °C (2).
Publisher’s Note: MDPI stays neutral with regard to jurisdictional claims in published maps and institutional affiliations.

