Abstract
The Brazilian Test is the most used test to determine the indirect tensile strength for brittle materials like concrete. It has been observed that the success of the test depends on the cracks initiation point position and therefore the arch loading angle; a crack appears in the center of the disk when the test is valid. To this effect, using Fast Lagrangian of Continua code FLAC2D; numerical analyses were performed to study the impact of the arch loading angle on the initial crack’s position in a 70 mm diameter Brazilian disk of concrete and mortar under loading arch 2α which varies from 5–45°. The distribution of stresses and the tensile strength at the center of the Brazilian disk obtained numerically was closely similar to analytical and experimental existing solutions. The results showed that to obtain a meaningful and validated test with the most accurate indirect tensile strength, it is recommended to take a loading arch 2α ≥ 20° for the concrete and 2α ≥ 10° for the mortar.
1. Introduction
As two typical concrete-like materials; concrete and mortar are the most used brittle materials in civil engineering structures [1]. The brittle materials are characterized by a strong compression, but they are much weaker in tension. Conceptually, to describe the mechanical failure of brittle materials, it is appropriate to evaluate the tensile strength rather than to evaluate the compressive strength [2,3]. Nevertheless, the determination of direct tensile strength is so difficult to perform [4]. Therefore, indirect tensile tests have been developed, including the diametrical compression on a disk to calculate the tensile strength of brittle materials [2].
The so-called ”Brazilian Test” is the most used test to determine the indirect tensile strength for brittle materials like concrete [2,5]. It is a simple indirect testing method for determining the tensile strength. For reasons of economy and simplicity, this test has been widely used to measure the tensile strength of concrete [3]. The indirect tensile strength is calculated assuming that failure initiates at the point of maximum tensile stress, i.e., at the center of the disk [5,6,7,8].
Several experimental and numerical studies in the mechanic of rocks have been interested by the observation of crack initiation point positions in the Brazilian disk [6,7,8,9,10,11,12,13,14,15], underlined out that to obtain a valid tensile test; the failure must initiate at the center of the disk. However, under certain conditions, a failure can be initiated at the loading points along with the compressed diameter of the disk resulting from an invalid test that gives a maximum tensile stress away from the center of the disk. Yu et al. [16] demonstrated that if the contact angle exceeds 20°, the crack initiates in the center of the disk and the dispersion of the final tensile strength is small. It has been observed by Erarslan et al. [6] that the central failure of the disk is guaranteed for the used loading archs 20° ≤ 2α ≤ 30°. Accordingly, the position of the crack’s initiation point is highly related to the contact arch loading angle between the jaws and the disk specimen, so the contact angle plays a significant role in the validity of the test [6,17]. An experimental study was conducted by Jin et al. [8] to investigate the influence of the specimen size on the tensile strength for concrete and mortar disks in Brazilian tests with a loading arch of 20°. It has been concluded by Carmona [18] that the values of indirect tensile strength is independent from the size of the specimen. In their studies, Jin et al. [8] did not give any recommendation regarding the optimum values of the arch loading angles leading to a successful test. Therefore, the crack’s initiation position of concrete-like materials is one of the main problems of the Brazilian test. The application of numerical simulation methods such as Finite Element Method or Discretize Element Method has been extended to study the crack initiation and propagation by several researches [5,6,19,20]; it has been concluded that such tools are suitable to analyze the crack initiation process.
By conducting the test in the laboratory, the main question is: What are the optimal loading arch under which the Brazilian Test can become meaningful and guaranteed?
To this effect, this numerical analysis using FLAC2D [21] focuses on the determination of the impact of arch loading angle and initial cracks position point on the success of the disks of concrete and mortar tested by Jin et al. [8] under loading arch 2α which varies from 5–45°. The ratio between the tensile and compressive stress at the specimen center () was calculated for all simulated loading cases. Furthermore, the tensile strength, stress distribution, and crack initiation point position of concrete and mortar were studied under Brazilian test conditions.
2. Brazilian Test Analytical Solution
The Brazilian test is a standardized laboratory method measuring the tensile strength of brittle solids including brittle materials [22]. The Brazilian test was carried out for the first time at the School of Civil and Architectural Engineering, Wuhan University, China [23]. Officially proposed by the International Society of Rock Mechanics (ISRM) in 1978 as a test to measure the tensile strength of rock materials [24]. Also referred to as Splitting Tension Test, it consists of subjecting the specimen to diametrical compression by applying the load uniformly across the diameter of a disk specimen [6], until failure is reached [3].
The normal stress component to the loading diameter, , and the component along the loading diameter, , are given by the analytical complete solution by Hondros (1959) [25], by the following expressions:
where:
R: The radius of the disk.
r: Distance from the center of the disk.
t: The disk thickness.
P: The applied load.
2α: The angular distance over which P is assumed.
According to the Griffith criterion, experimental and numerical studies confirm that the cracks should occur at the center of the Brazilian disk [26,27]. The value of maximum and minimum principal stresses (at the center) are respectively [25]:
: The maximum principal stress (at the center).
: The mimum principal stress (at the center).
3. Numerical Modeling
The effectiveness of the numerical simulation methods has been proved so far by several research studies. They can simulate the indirect test in its different configurations [5,6,7,28]. In this study, the software FLAC2D [21] was used to simulate the Brazilian test assuming a specimen with a radius R. This code is based on the finite difference method with Lagrangian calculation method [29]. In plane strain condition, it is assumed that failure is independent of stress that develops normal to the disk face [21]. Taking into account the symmetry of the Brazilian test as indicated in Figure 1, only the top half of the specimen is modeled. The material is assumed to be homogeneous, isotropic, and linear elastic until the crack initiation occurs. The simulations were carried out considering the strain-softening material model. To control the variation in friction, cohesion, and dilation as a function of plastic shear strain, and tension limit as a function of plastic tensile strain, the strain-hardening/softening behavior is used [21]. With a total loss of cohesion and tensile strength, the material is assumed brittle.
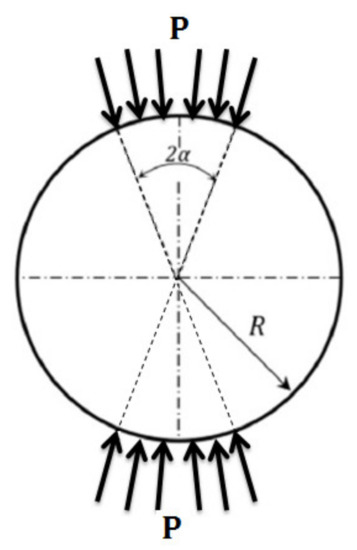
Figure 1.
The Brazilian test configuration (loading arch).
3.1. Effectiveness of the Proposed Numerical Model
Assessment of the predictions of the built material numerical model is carried out through comparison with available experimental results and analytical solutions of the indirect tensile strength. Consequently, the numerical results were compared with the experimental one obtained by Erarslan et al. [6], Jin et al. (2017) [8], and the numerical results obtained by Gutiérrez et al. [7].
As indicated in Table 1, the experimental indirect tensile strength of Brisbane tuff disk with a diameter of 52 mm (R = 26 mm) with different contact angles of 15°, 20°, and 30° has been obtained by Erarslan et al. [6]. Gutiérrez et al. [7], in their work, also compared their numerical results with Erarslan et al. (2012) [6].

Table 1.
Predicted indirect tensile strength (MPa) compared to [6,7].
Table 1 compares the predicted tensile strength by FLAC2D code with those suggested by [6,7] and the analytical solution obtained using Equation (3). Based on the stress state in the center, the tensile strength is evaluated (Equation (3)) [5,23]. The elastic modulus and the Poisson ratio of the Brisbane tuff tested by [6] were 26GPa and 0.25, respectively.
According to the results inTable 1, we can conclude that the present analysis provides an acceptable estimation of the indirect tensile strength with a maximum absolute relative difference of 1.65% comparatively with the experimental results of Erarslan et al. [6]. Likewise, the maximum absolute relative difference between the results of Erarslan et al. [6] and those obtained by Gutiérrez et al. [7] is 1.95%.
As shown in Table 1, the analytical indirect tensile strength obtained by Equation (3) is overestimated with an absolute relative difference of 9.39% if compared with the experimental results of Erarslan et al. [6].
To confirm the good agreement of our numerical model, a comparison was made between stresses estimated numerically and those obtained by analytical equations (Equations (1) and (2)). Thus, before few steps prior to initiation failure, the numerical values for and through the specimen of Brisbane tuff tested by Erarslan et al. [6] in the case of arch loading angle 2α = 15°, obtained numerically and analytically [25] (Equations (1) and (2)), are shown in Figure 2 for comparison purposes.
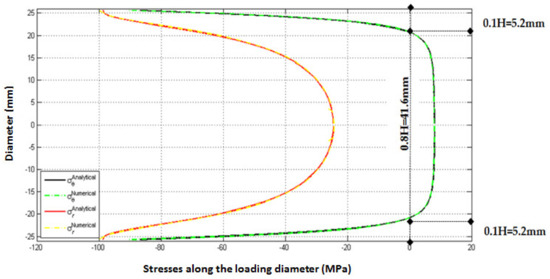
Figure 2.
Distribution of vertical and horizontal stresses through the loading diameter in the disk tested by [6] in the case 2α = 15° (compression−, tension+).
From Figure 2, it is clear that the proposed numerical and analytical methods lead to the same values of the stresses around the loading diameter. For the normal stress , a maximum relative difference between analytical and numerical solutions is 6.37%. However, a maximum deviation equal to 3.63% is marked between analytical and numerical stress along the loading diameter, .
As indicated in [30], the Splitting Tension Test (or Brazilian test) makes it possible to impose a practically homogeneous tensile stress field in the central zone of the disk in 0.8H and a compression in 0.1H on both sides (Figure 3).
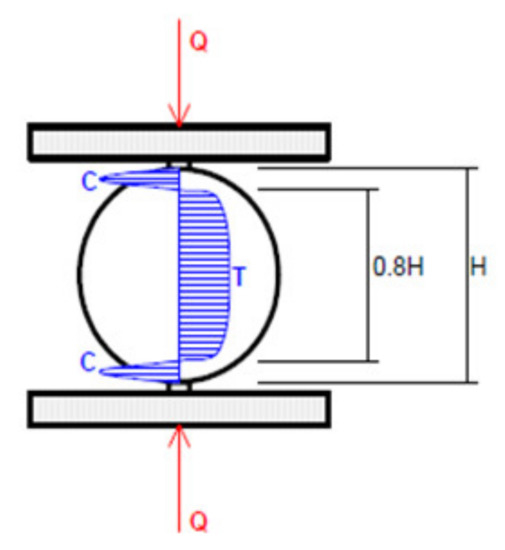
Figure 3.
Brazilian Test [30].
The results of Figure 2 show clearly that the analytical and numerical stresses along the loading diameter provide an acceptable estimation with analytical solutions. For the case of disks tested by Erarslan et al. [6] with a diameter equal to 52 mm (R = 26 mm) simulated by our model, a tension in 0.8 H (0.8 52 = 41.6 mm) is obtained along the loading diameter with a compression in 0.1 H on both sides (0.1 52 = 5.2 mm) (Figure 2), which confirms our simulation procedure.
Figure 4 shows the variation of the load in the center of the disk through the loading diameter as a function of step calculation obtained numerically in the case of Brisbane tuff tested by Erarslan et al. [6] with an arch loading angle 2α equal to 15°.
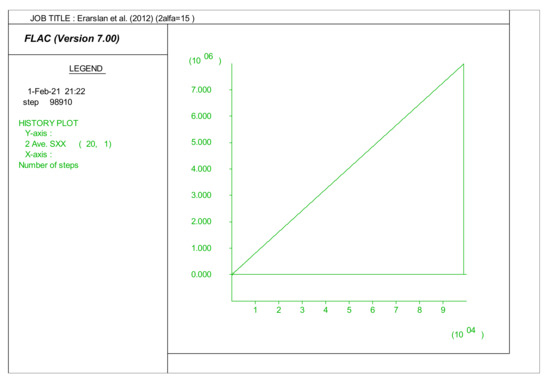
Figure 4.
Evolution of the horizontal stress in the center of the disk tested by [6] versus the number of iterations.
After a few steps of the elastic phase, the plastic phase is initiated (after the first crack initiation). The failure is brutal and qualified a brittle failure. As indicated by Erarslan et al. [6], a crack initiation from the center of the disk for the different cases of arch loading angles 15°, 20°, and 30°, respectively (Figure 5), has been observed. The obtained numerical result is in good agreement with the observation made by Erarslan et al. [6], proving that the suggested numerical method, herein, effectively simulates the indirect test in its different configurations.
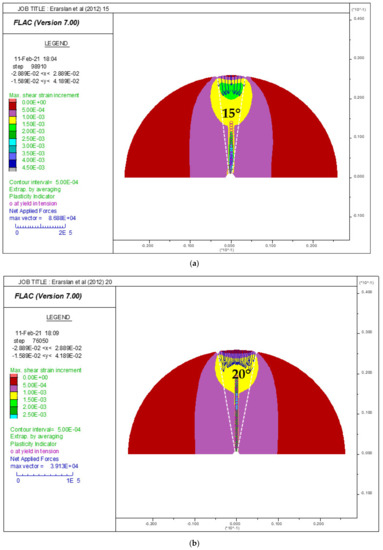
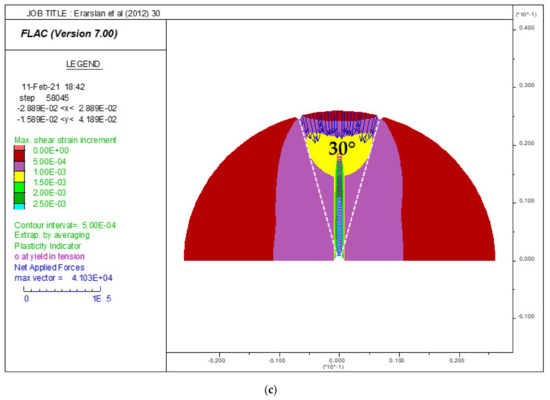
Figure 5.
(a) Arch loading angle 2α = 15°. (b) Arch loading angle 2α = 20°(c) Arch loading angle 2α = 30°. Numerical Distribution of maximum shear strains, crack initiation point positions, and applied pressure in the disk tested by [6].
The effect of the specimen size on the tensile strength has been studied by Jin et al. [8] for concrete and mortar disks with a diameter of 70 mm (R = 35 mm), a thickness t = (30–50 mm), and a loading arch of 20°. Table 2 gives the predicted indirect tensile strength compared to those obtained by [7,8].

Table 2.
Predicted indirect tensile strength (MPa) compared to [7,8] (2α = 20°).
The results shown in Table 2 are in good agreement compared with those obtained by [7,8]. The maximum absolute relative difference between the present numerical results and results obtained by [8] is 0.56%.
As indicated previously, the results of the analytically indirect tensile strength proposed by [25] is overestimated with an absolute relative difference equal to 4.19% compared with the experimental results of [8].
3.2. Optimal Test Conditions
Jin et al. [8] in their work did not study the impact of the arch loading on the indirect tensile strength of the concrete and mortar disks and their study was limited to an arch loading 2α = 20°. As indicated by Erarslan et al. [6], the first failure and/or crack initiation occurred at the center of the disk in all loading arch simulations (Figure 5). Moreover, the good agreement of the numerical results in comparison with [6,7,8] allows us to confirm the capacity of our model to analyze and to determine the indirect tensile stress in the Brazilian disk under various loading arch.
Valuable studies showed that the arch loading angle has a great effect on the validity of the Brazilian test. Furthermore, the purpose of this work is to determine the values of loading arch under which the test is successful for concrete and mortar disks.
In order to recommend the best loading configuration which gives a successful test with a correct estimation of the indirect tensile strength of concrete and mortar, the influence of arch loading angle and initial cracks position point on the success of the disks of concrete and mortar tested by Jin et al. [8] under loading arch 2α, which varies from 5–45°, was investigated using numerical software FLAC2D [21]. The ratio is calculated for all simulated loading cases.
Consequently, numerical simulations of the Brazilian test were conducted of a concrete and mortar disk with a diameter of 70 mm [8], varying the loading angle from 5–45° in order to see its influence on the position of the initiation of the cracks and consequently on the validity of the test. The numerical input of the simulated disks are shown in Table 3.

Table 3.
Numerical input parameters.
3.2.1. Concrete
The disks of concrete tested by Jin et al. [8] have an elastic modulus 30.32 GPa and Poisson coefficient ratio 0.18, respectively (Table 3). Table 4 summarizes for each loading case the initial position of the cracks for all simulated disks. The horizontal () and vertical () stresses at the center of the disk estimated numerically have been presented in Table 4.

Table 4.
Predicted stresses at the center of the disk and the initial position of the crack of Concrete tested by [8].
3.2.2. Mortar
The elastic modulus and the Poisson coefficient ratio of the mortar tested by Jin et al. [8] were 27.45 GPa and 0.18, respectively (Table 3). Table 5 presents for each loading case the stresses at the center obtained numerically for all arch loading angles and the initial position of the crack for simulated mortar disk.

Table 5.
Predicted stresses at the center of disk of mortar tested by [8] and the initial position of the crack.
4. Results and Discussion
As indicated previously, according to the Griffith criterion, the value of maximum and minimum principal stresses (at the center) are respectively obtained using Equations (3) and (4). The numerical ratio between the tensile and compressive stress at the specimen center was presented for all simulated concretes and mortars in Table 3 and Table 5, respectively. It should be pointed out that the ratio calculated numerically for concretes and mortars respects the Griffith failure criterion confirming for another time the validity of our numerical model.
The initial crack location observed numerically was presented for each case studied in Table 4 and Table 5. For some samples, the fractures are not at the center [23]. This last remark was indeed approved by the results obtained for the different concretes and mortars.
Figure 6 and Figure 7 respectively give the crack initiation positions for all simulated concretes and mortars under different arch loading angles studied as indicated in Table 4 and Table 5, respectively.
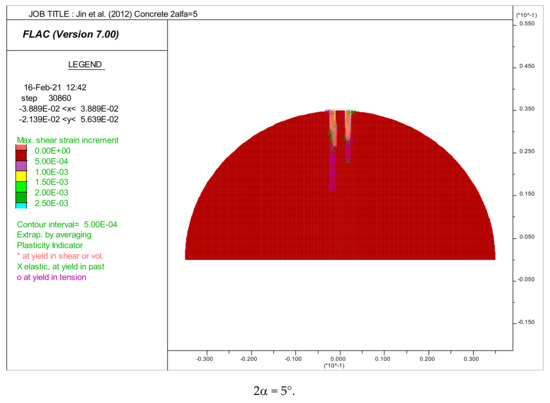
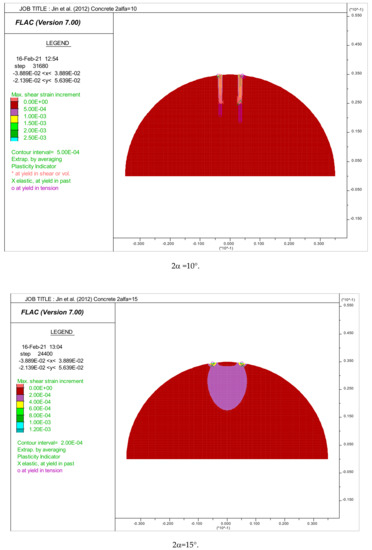
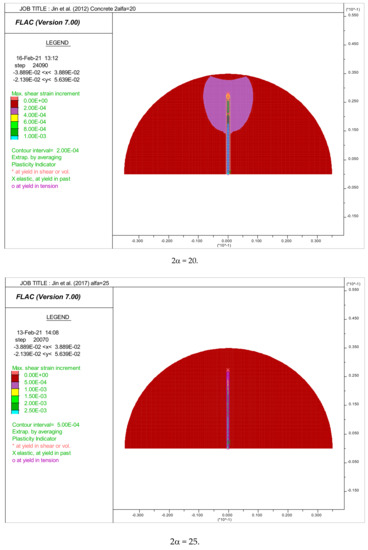
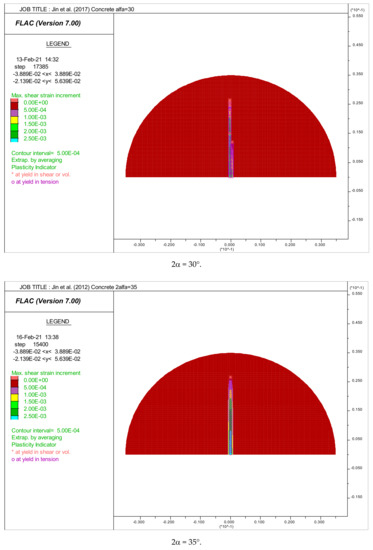
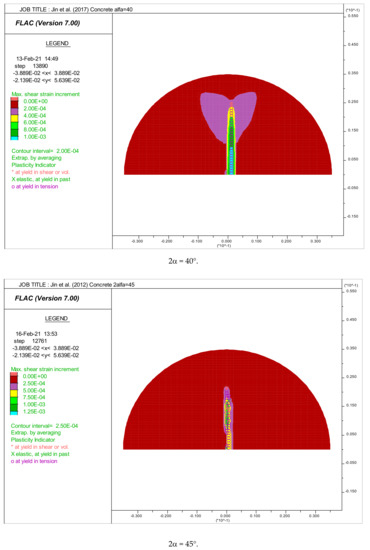
Figure 6.
Distribution of maximum shear strains. Crack initiation point positions in the disk of concretes tested by [8].
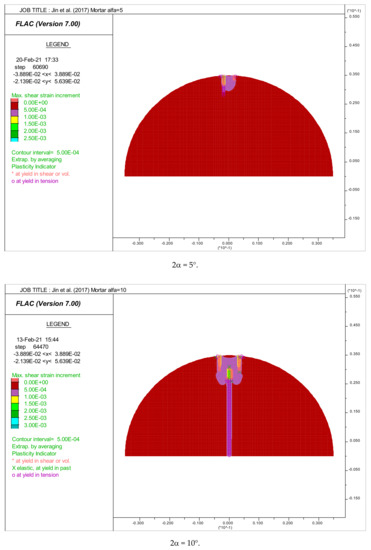
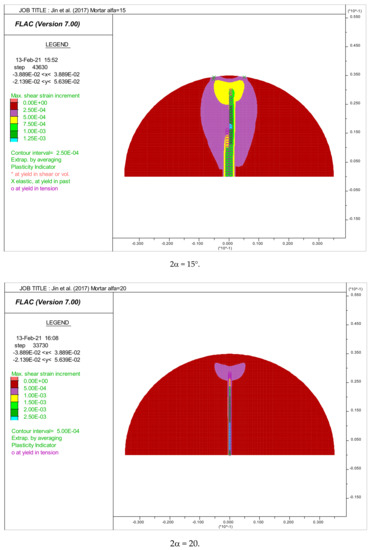
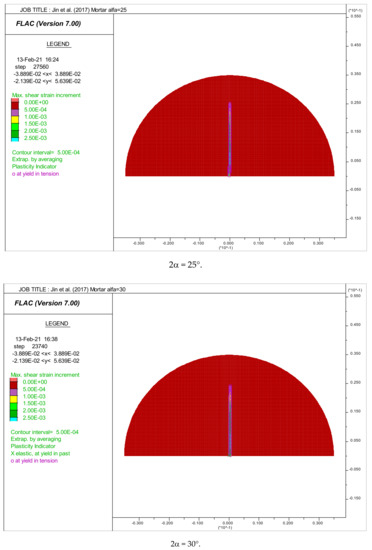
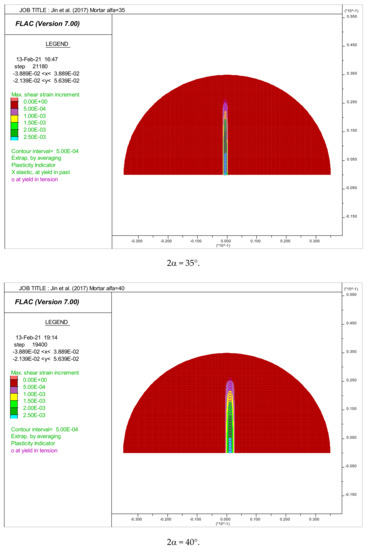
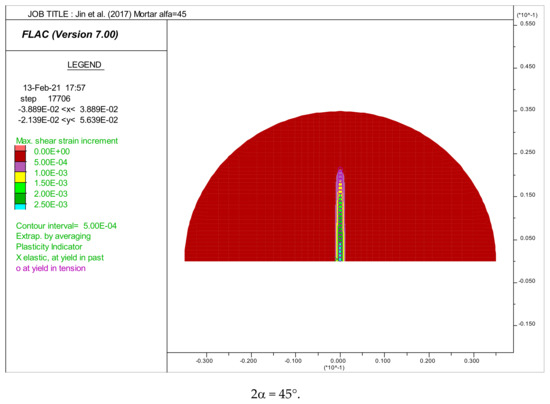
Figure 7.
Distribution of maximum shear strains. Crack initiation point positions in the disk of mortar tested by [8].
In the case of concrete, it is clear that the initiation of cracks starts from the center of the disks if the loading angle is between 20–45°, thus allowing the validity of the test (Figure 6). From Figure 6, angles that equal to 5° and 10°, the shear failure is recorded at the loaded points. For 2α = 15°, a tension failure near the loaded points is recorded. So, we can say that the tensile strength values for 2α, which varies from 5–15°, were insignificant (unsuccessful test).
Figure 7 shows the initiation of crack point positions in the case of mortar disks under a various arch loading angle. In contrast with concrete, it was observed that the initiation of cracks starts in the center of the mortar disks if the loading angle 2α is higher than 10°.
In the case of 2α = 10°, the crack initiation starts from the loading points (tension failure), but spreads rapidly towards the center, thus giving significant tensile strength value.
The distribution of horizontal and vertical stress along the loaded vertical diameter for the concrete disks tested by Jin et al. [8] in two cases of arch loading angles 15° and 40°, respectively, is shown in Figure 8. Numerical and analytical predictions are in good agreement with a maximum relative difference of 8.54%.
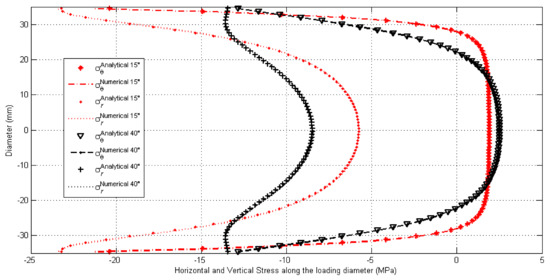
Figure 8.
Distribution of horizontal and vertical stress through the loading diameter in the disk tested by [8] in the case of 2α = 15–40° (compression−, tension +).
A maximum horizontal tensile stress σx along the loaded vertical diameter is localized at the center of the disk, which decreases when moving away from the center, becoming horizontal compressive stress at the loaded disk ends [30].
It is noted that the compressive stresses and the stress concentration degree near the loaded points of the disk can be dramatically decreased with increasing the loading angle. Therefore, we can say that the possibility of compressive failure near the specimens loaded points is reduced considerably if the loading angle is increased. Consequently, the possibility of a central crack initiating will increase, thus giving a validated and a successful response [31].
5. Conclusions
This paper aims at the numerical analysis of the influence of arch loading angle (which varies from 5–45°) on the success of the Brazilian Test for the concrete and mortar specimens tested by Jin et al. [8]. The position of initial cracks of the Brazilian disk has been thoroughly investigated since different numerical results have been acquired.
The main findings from the numerical analysis conducted by the FLAC2D code are the following:
- It has been confirmed that the Splitting Tension Test (or Brazilian test) makes it possible to impose a practically homogeneous tensile stress field in the central zone of the disk in 0.8H and a compression in 0.1H on both sides.
- The numerical ratio between the tensile and compressive stress at the specimen center for all simulated concretes and mortars respects the Griffith failure criterion if the test is successful.
- The initiation of cracks starts from the center of the disks of concrete if the loading angle is between 20–45°, thus allowing the validity of the test. Nevertheless, the tensile strength values for 2α, which varies from 5–15°, were insignificant (unsuccessful test).
- For the mortar disks, the crack initiation starts from the loading points (tension failure) but spreads rapidly towards the center, thus giving significant tensile strength value in the case of 2α = 10° loading angle. The validity of the test is guaranteed if the angle 10° ≤ 2α ≤ 45°.
- It is confirmed that the possibility of compressive failure near the specimen’s loaded points is reduced considerably if the loading angle is increased. Consequently, the possibility of a central crack initiating will increase, thus giving a validated and a successful test [31].
Author Contributions
Conceptualization, M.F.B.; methodology, M.F.B and M.B.; software, M.F.B.; validation, M.F.B.; formal analysis, M.F.B.; investigation, M.F.B. and M.B.; resources, M.F.B.; data curation, M.F.B.; writing-original draft, M.F.B.; preparation, M.F.B.; writing-review and editing, M.F.B. and M.B.; visualization, M.F.B.; supervision, M.F.B.; project administration, M.F.B.; funding acquisition, M.F.B. All authors have read and agreed to the published version of the manuscript.
Funding
This research received no external funding.
Institutional Review Board Statement
Not applicable.
Informed Consent Statement
Informed consent was obtained from all subjects involved in the study.
Data Availability Statement
the study did not report any data.
Acknowledgments
Special thanks from the first author goes to Hima Abdelkader from the University of Hamma Lakhdar El Oued Algeria for his help and continuous encouragement. Thanks extended to the General Directory of Scientific Research and Technological Development (DGRSDT); Ministry of Higher Education and Scientific Research/Algeria for support publishing this work.
Conflicts of Interest
The authors declare no conflict of interest.
References
- Lambert, D.E.; Ross, C.A. Strain rate effects on dynamic fracture and strength. Int. J. Impact Eng. 2000, 24, 985–998. [Google Scholar] [CrossRef]
- Wei, X.X.; Chau, K.T. Three dimensional analytical solution for finite circular cylinders subjected to indirect tensile test. Int. J. Solids Struct. 2013, 50, 2395–2406. [Google Scholar] [CrossRef]
- Carmona, S.; Aguado, A. New model for the indirect determination of the tensile stress–strain curve of concrete by means of the Brazilian test. Mater. Struct. 2012, 45, 1473–1485. [Google Scholar] [CrossRef]
- Van Mier, J.G.M.; Van Vliet, M.R.A. Uniaxial tension test for the determination of fracture parameters of concrete: State of the art. Eng. Fract. Mech. 2002, 69, 235–247. [Google Scholar] [CrossRef]
- Li, D.; Wong, L.N.Y. The Brazilian disc test for rock mechanics applications: Review and new insights. Rock Mech. Rock Eng. 2013, 46, 269–287. [Google Scholar] [CrossRef]
- Erarslan, N.; Liang, Z.Z.; Williams, D.J. Experimental and numerical studies on determination of indirect tensile strength of rocks. Rock Mech. Rock Eng. 2012, 45, 739–751. [Google Scholar] [CrossRef]
- Gutiérrez-Moizant, R.; Ramiez-Berasategui, M.; Sánchez-Sanz, S.; Santos-Cuadros, S. Experimental verification of the boundary conditions in the success of the Brazilian test with loading arch. An uncertainty approach using concrete disks. Int. J. Rock Mech. Min. Sci. 2020, 132, 104380. [Google Scholar] [CrossRef]
- Jin, X.; Hou, C.; Fan, X.; Lu, C.; Yang, H.; Shu, X.; Wang, Z. Quasi-static and dynamic experimental studies on the tensile strength and failure pattern of concrete and mortar discs. Sci. Rep. 2017, 7, 1–15. [Google Scholar] [CrossRef]
- Khosravani, M.R.; Weinberg, K. Experimental fracture studies of ultrahigh performance concrete using Brazilian test by splithopkinson pressure bar. In Proceedings of the 14th International Conference of Fracture 2017 (ICF-14) on Volume 1, Rhodes, Greece, 18–23 June 2017; pp. 55–56. [Google Scholar]
- Fairhurst, C. On the validity of the ‘Brazilian’test for brittle materials. Int. J. Rock Mech. Min. Sci. Geomech. Abstr. 1964, 1, 535–546. [Google Scholar] [CrossRef]
- Colback, P.S.B. An analysis of brittle fracture initiation and propagation in the Brazilian test. In 1st ISRM Congress; International Society for Rock Mechanics and Rock Engineering: Lisbon, Portugal, 1966. [Google Scholar]
- Lanaro, F.; Sato, T.; Stephansson, O. Microcrack modelling of Brazilian tensile tests with the boundary element method. Int. J. Rock Mech. Min. Sci. 2009, 46, 450–461. [Google Scholar] [CrossRef]
- Markides, C.F.; Pazis, D.N.; Kourkoulis, S.K. Closed full-field solutions for stresses and displacements in the Brazilian disk under distributed radial load. Int. J. Rock Mech. Min. Sci. 2010, 47, 227–237. [Google Scholar] [CrossRef]
- Markides, C.F.; Pazis, D.N.; Kourkoulis, S.K. Influence of friction on the stress field of the Brazilian tensile test. Rock Mech. Rock Eng. 2011, 44, 113–119. [Google Scholar] [CrossRef]
- Yu, Y.; Meng, C.-Y. 3-D distribution of tensile stress in rock specimens for the Brazilian test. Int. J. Min. Metall. Mater. 2005, 12, 495–499. [Google Scholar] [CrossRef]
- Yu, Y.; Zhang, J.; Zhang, J. A modified Brazilian disk tension test. Int. J. Rock Mech. Min. Sci. 2009, 46, 421–425. [Google Scholar] [CrossRef]
- Satoh, Y. Position and load of failure in Brazilian test, a numerical analysis by Griffith criterion. J. Soc. Mater. Sci. Jpn. 1987, 36, 1219–1224. [Google Scholar] [CrossRef]
- Carmona, S. Effect of specimen size and loading conditions on indirect tensile test results. Mater. Constr. 2009, 59, 7–18. [Google Scholar] [CrossRef]
- Olesen, J.F.; Østergaard, L.; Stang, H. Nonlinear fracture mechanics and plasticity of the split cylinder test. Mater. Struct. 2006, 39, 421–432. [Google Scholar] [CrossRef]
- Mahabadi, O.K.; Cottrell, B.E.; Grasselli, G. An example of realistic modelling of rock dynamics problems: FEM/DEM simulation of dynamic Brazilian test on Barre granite. Rock Mech. Rock Eng. 2010, 43, 707–716. [Google Scholar] [CrossRef]
- FLAC-Fast Lagrangian Analysis of Continua, version 7.0. Itasca Consulting Group, Inc.: Minneapolis, MN, USA, 2007.
- Mehrabian, A.; Abousleiman, Y.N. Poroelastic solution to the Brazilian test. Int. J. Rock Mech. Min. Sci. 2020, 126, 104201. [Google Scholar] [CrossRef]
- Feng, G.; Kang, Y.; Wang, X.; Hu, Y.; Li, X. Investigation on the failure characteristics and fracture classification of shale under brazilian test conditions. Rock Mech. Rock Eng. 2020, 53, 3325–3340. [Google Scholar] [CrossRef]
- García, V.J.; Márquez, C.O.; Zuñiga-Torres, A.R. Brazilian test of concrete specimens subjected to different loading geometries: Review and new insights. Int. J. Concr. Struct. Mater. 2017, 11, 343–363. [Google Scholar] [CrossRef]
- Hondros, G. The evaluation of Poisson’s ratio and the modulus of materials of low tensile resistance by the Brazilian (indirect tensile) test with particular reference to concrete. Aust. J. Appl. Sci. 1959, 10, 243–268. [Google Scholar]
- Yanagidani, T.; Sano, O.; Terada, M.; Ito, I. The observation of cracks propagating in diametrically-compressed rock discs. Int. J. Rock Mech. Min. Sci. Geomech. Abstr. 1978, 15, 225–235. [Google Scholar] [CrossRef]
- Chen, S.; Yue, Z.Q.; Tham, L.G. Digital image-based numerical modeling method for prediction of inhomogeneous rock failure. Int. J. Rock Mech. Min. Sci. 2004, 41, 939–957. [Google Scholar] [CrossRef]
- Komurlu, E.; Kesimal, A.; Demir, S. Experimental and numerical study on determination of indirect (splitting) tensile strength of rocks under various load apparatus. Can Geotech. J. 2015, 53, 360–372. [Google Scholar] [CrossRef]
- Saeedi, G.; Shahriar, K.; Rezai, B.; Karpuz, C. Numerical modelling of out-of-seam dilution in longwall retreat mining. Int. J. Rock Mech. Min. Sci. 2010, 47, 533–543. [Google Scholar] [CrossRef]
- Boresi, A.P.; Chong, K.P.; Lee, J.D. Elasticity in engineering mechanics; John Wiley & Sons: Hoboken, NJ, USA, 2010; p. 492. [Google Scholar]
- Huang, Y.G.; Wang, L.G.; Lu, Y.L.; Chen, J.R.; Zhang, J.H. Semi-analytical and numerical studies on the flattened Brazilian splitting test used for measuring the indirect tensile strength of rocks. Rock Mech. Rock Eng. 2015, 48, 1849–1866. [Google Scholar] [CrossRef]
Publisher’s Note: MDPI stays neutral with regard to jurisdictional claims in published maps and institutional affiliations. |
© 2021 by the authors. Licensee MDPI, Basel, Switzerland. This article is an open access article distributed under the terms and conditions of the Creative Commons Attribution (CC BY) license (https://creativecommons.org/licenses/by/4.0/).