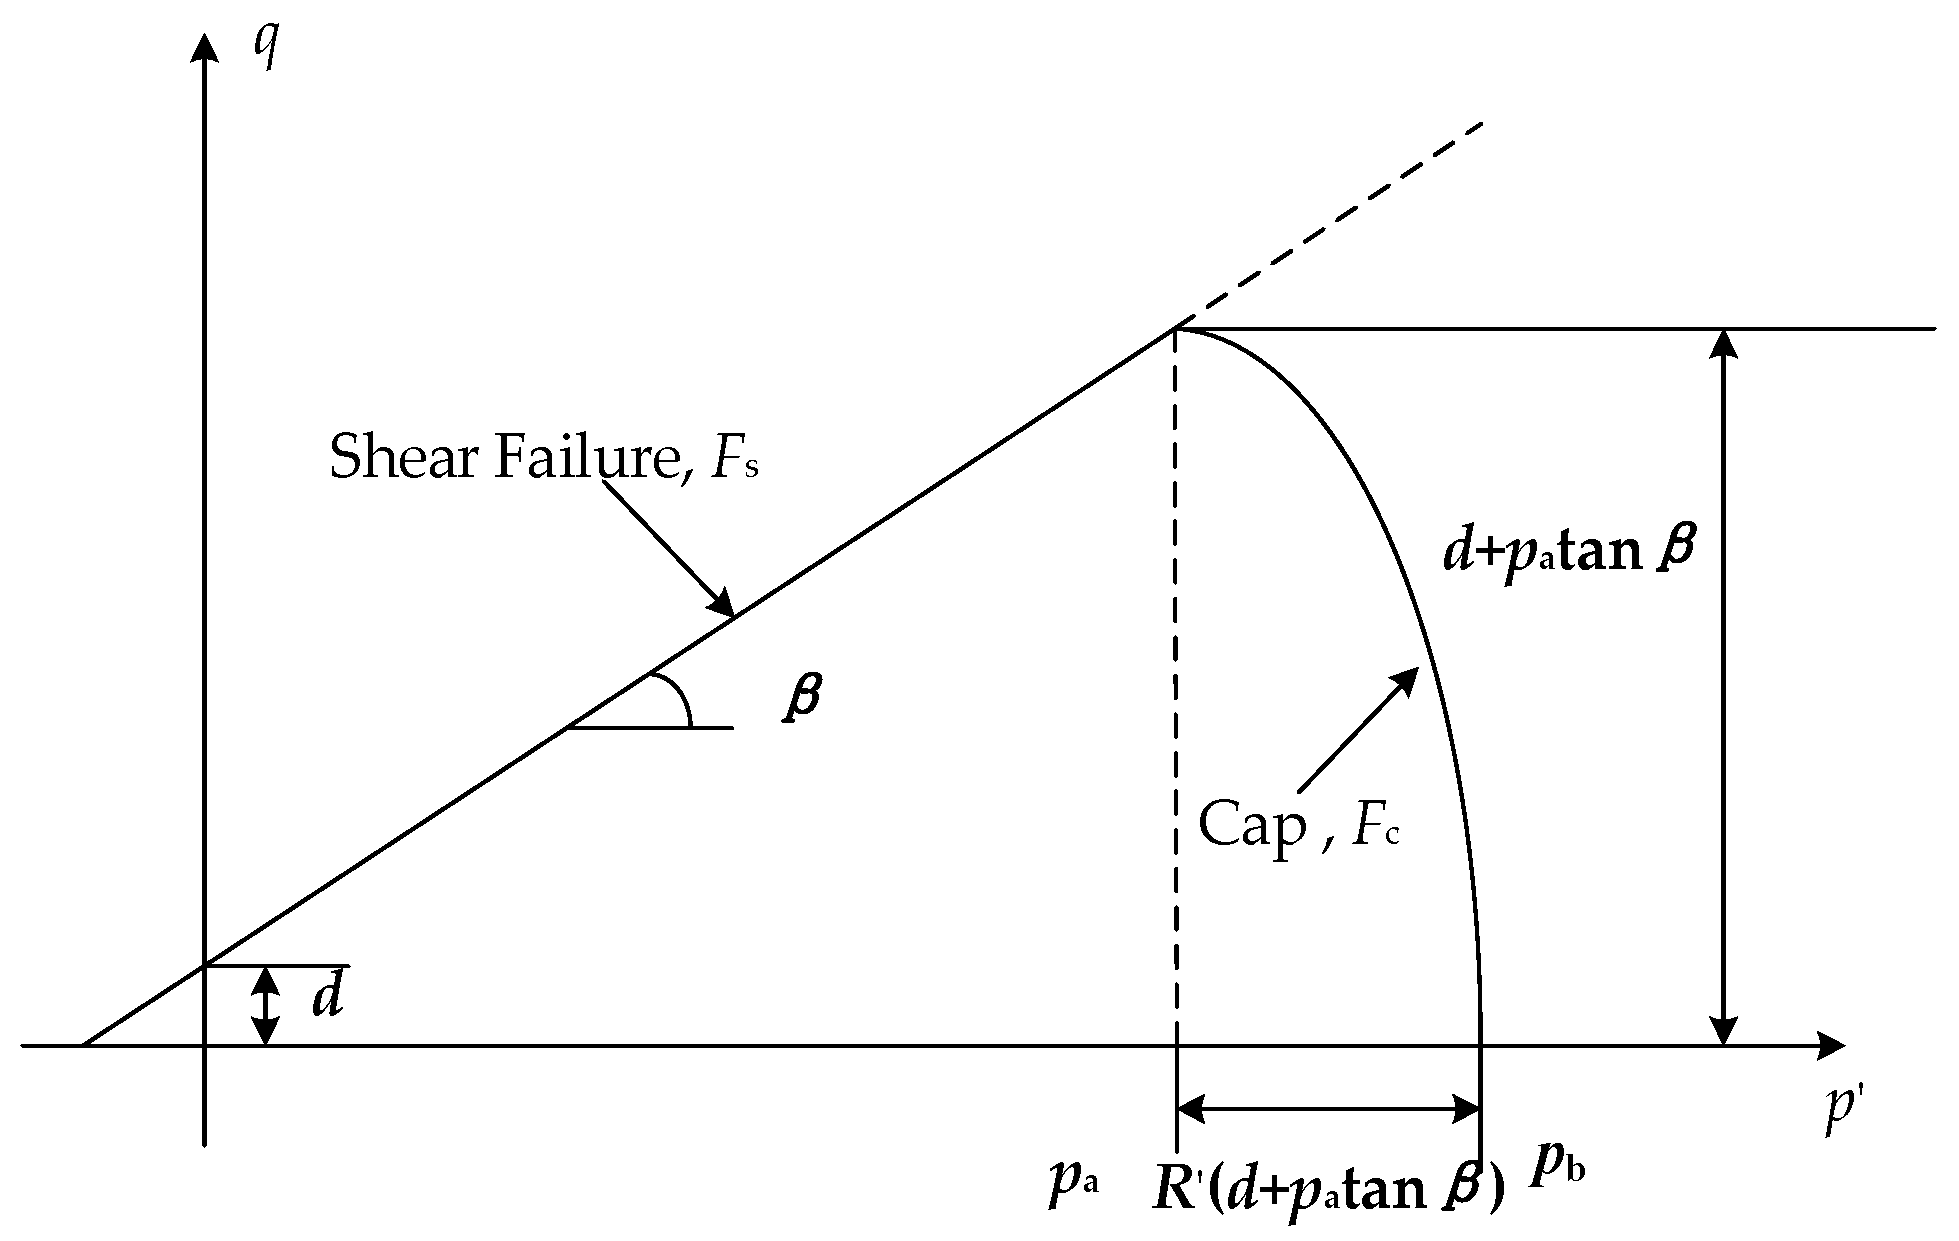
Figure 1.
Yield surface of cap model in
p′ −
q plane [
27].
Figure 1.
Yield surface of cap model in
p′ −
q plane [
27].
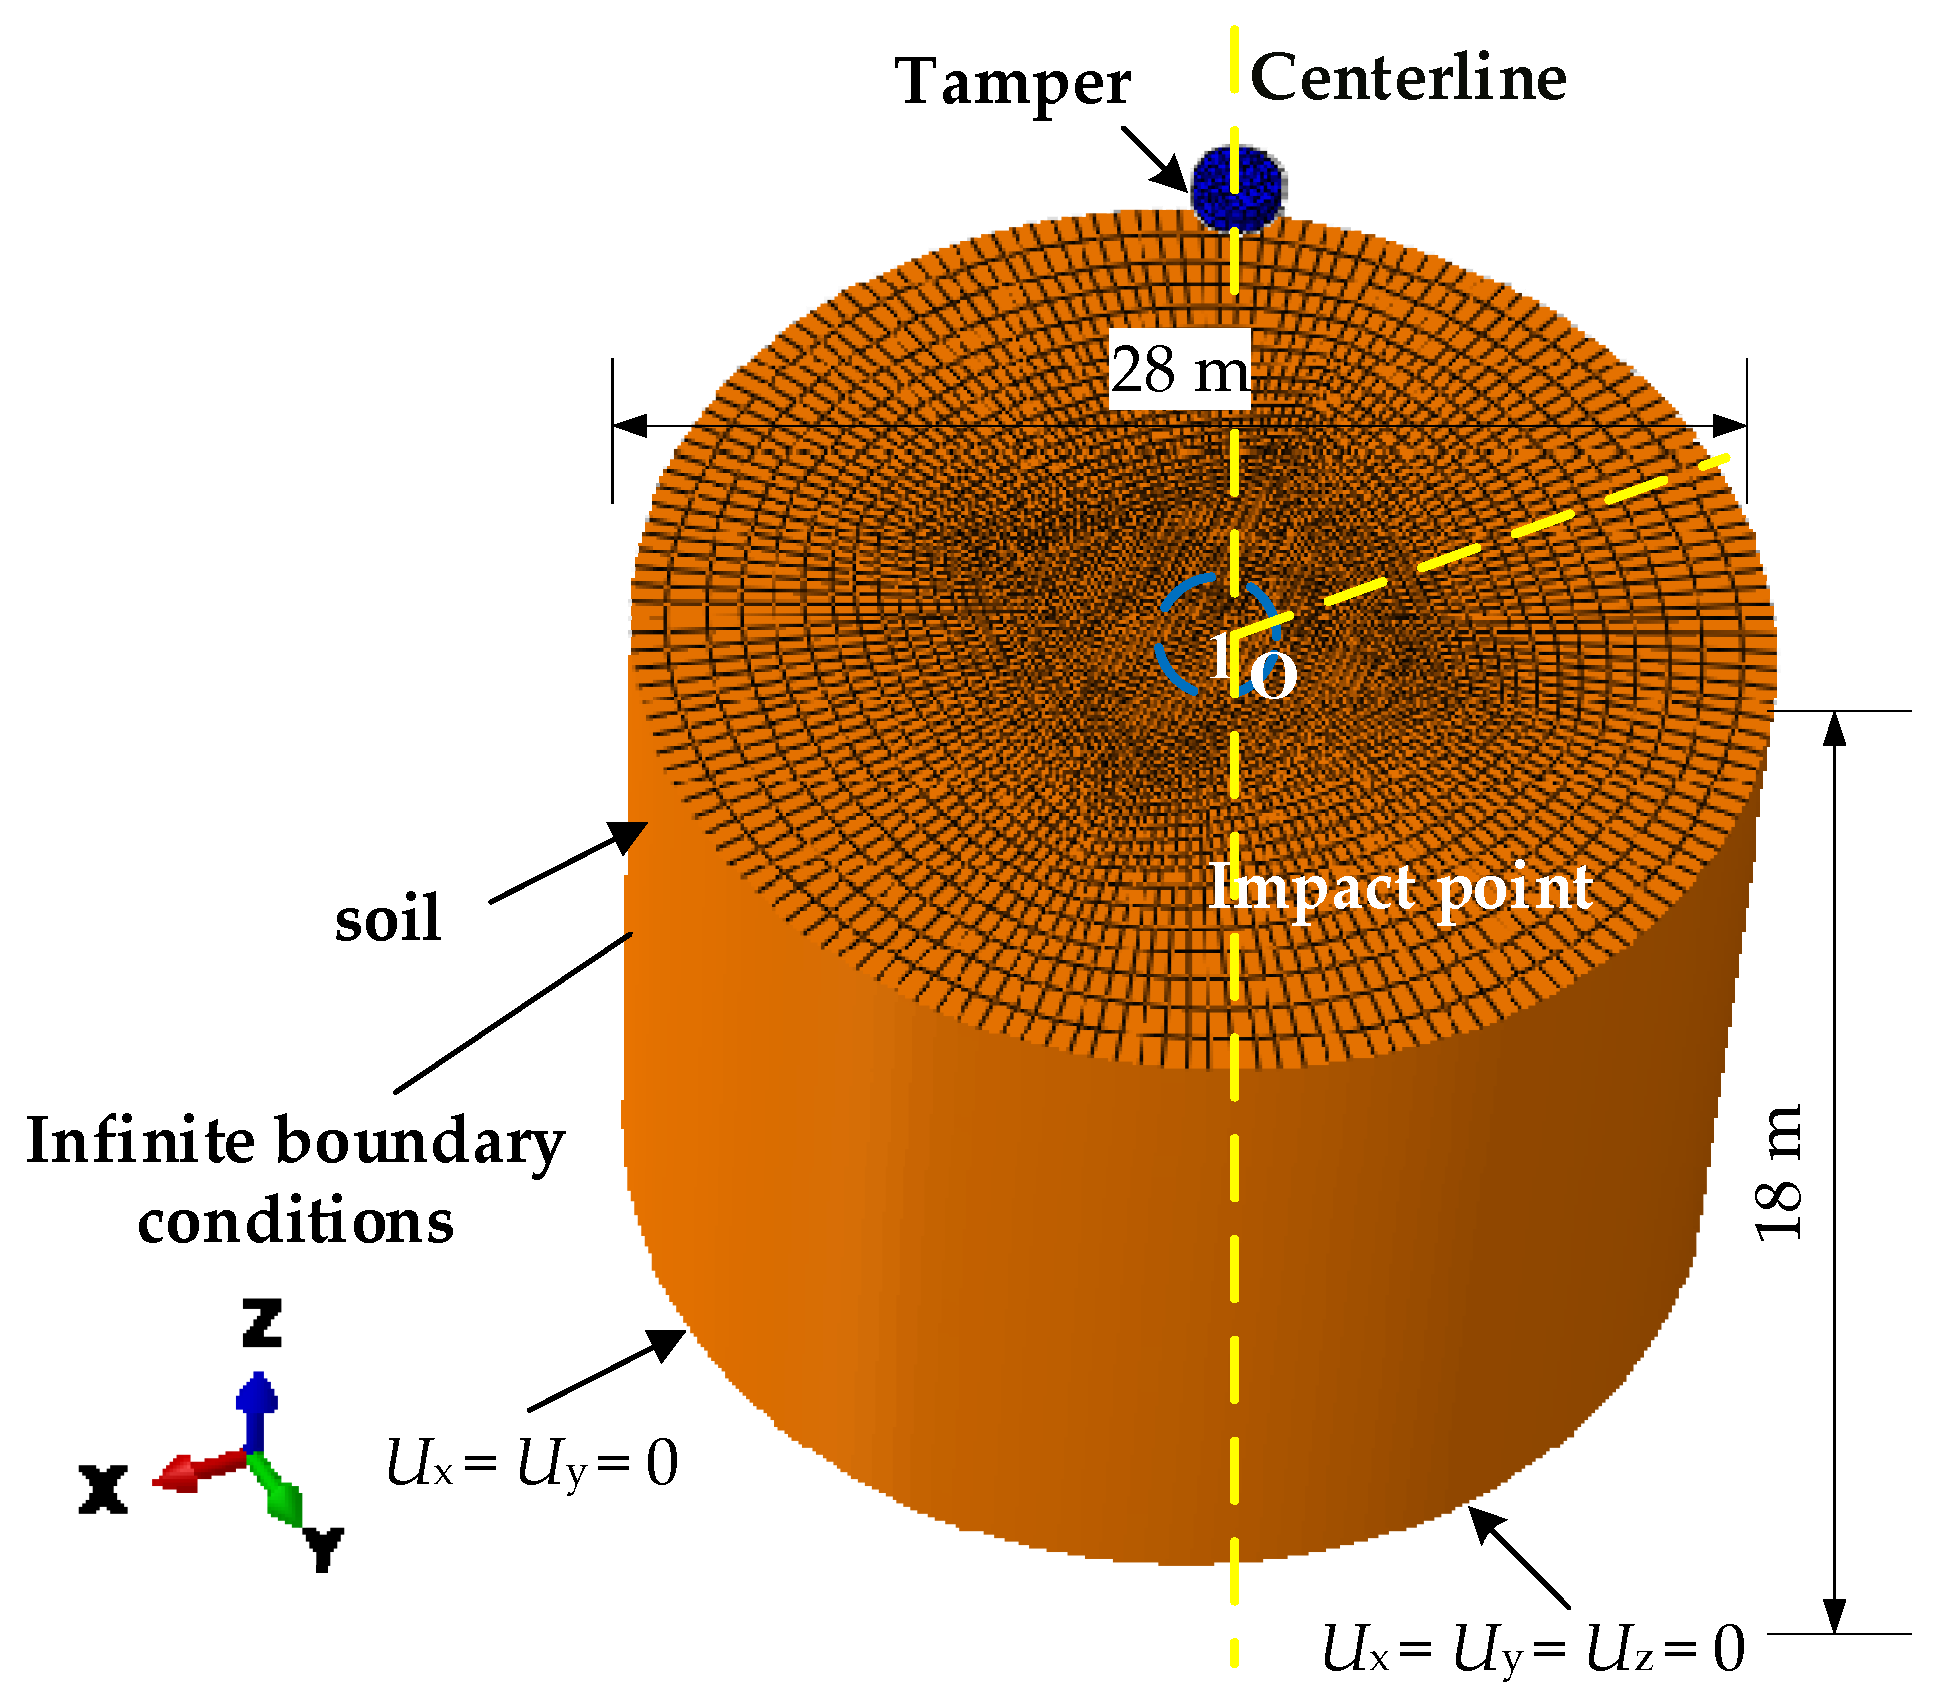
Figure 2.
The numerical simulation model and finite element mesh.
Figure 2.
The numerical simulation model and finite element mesh.
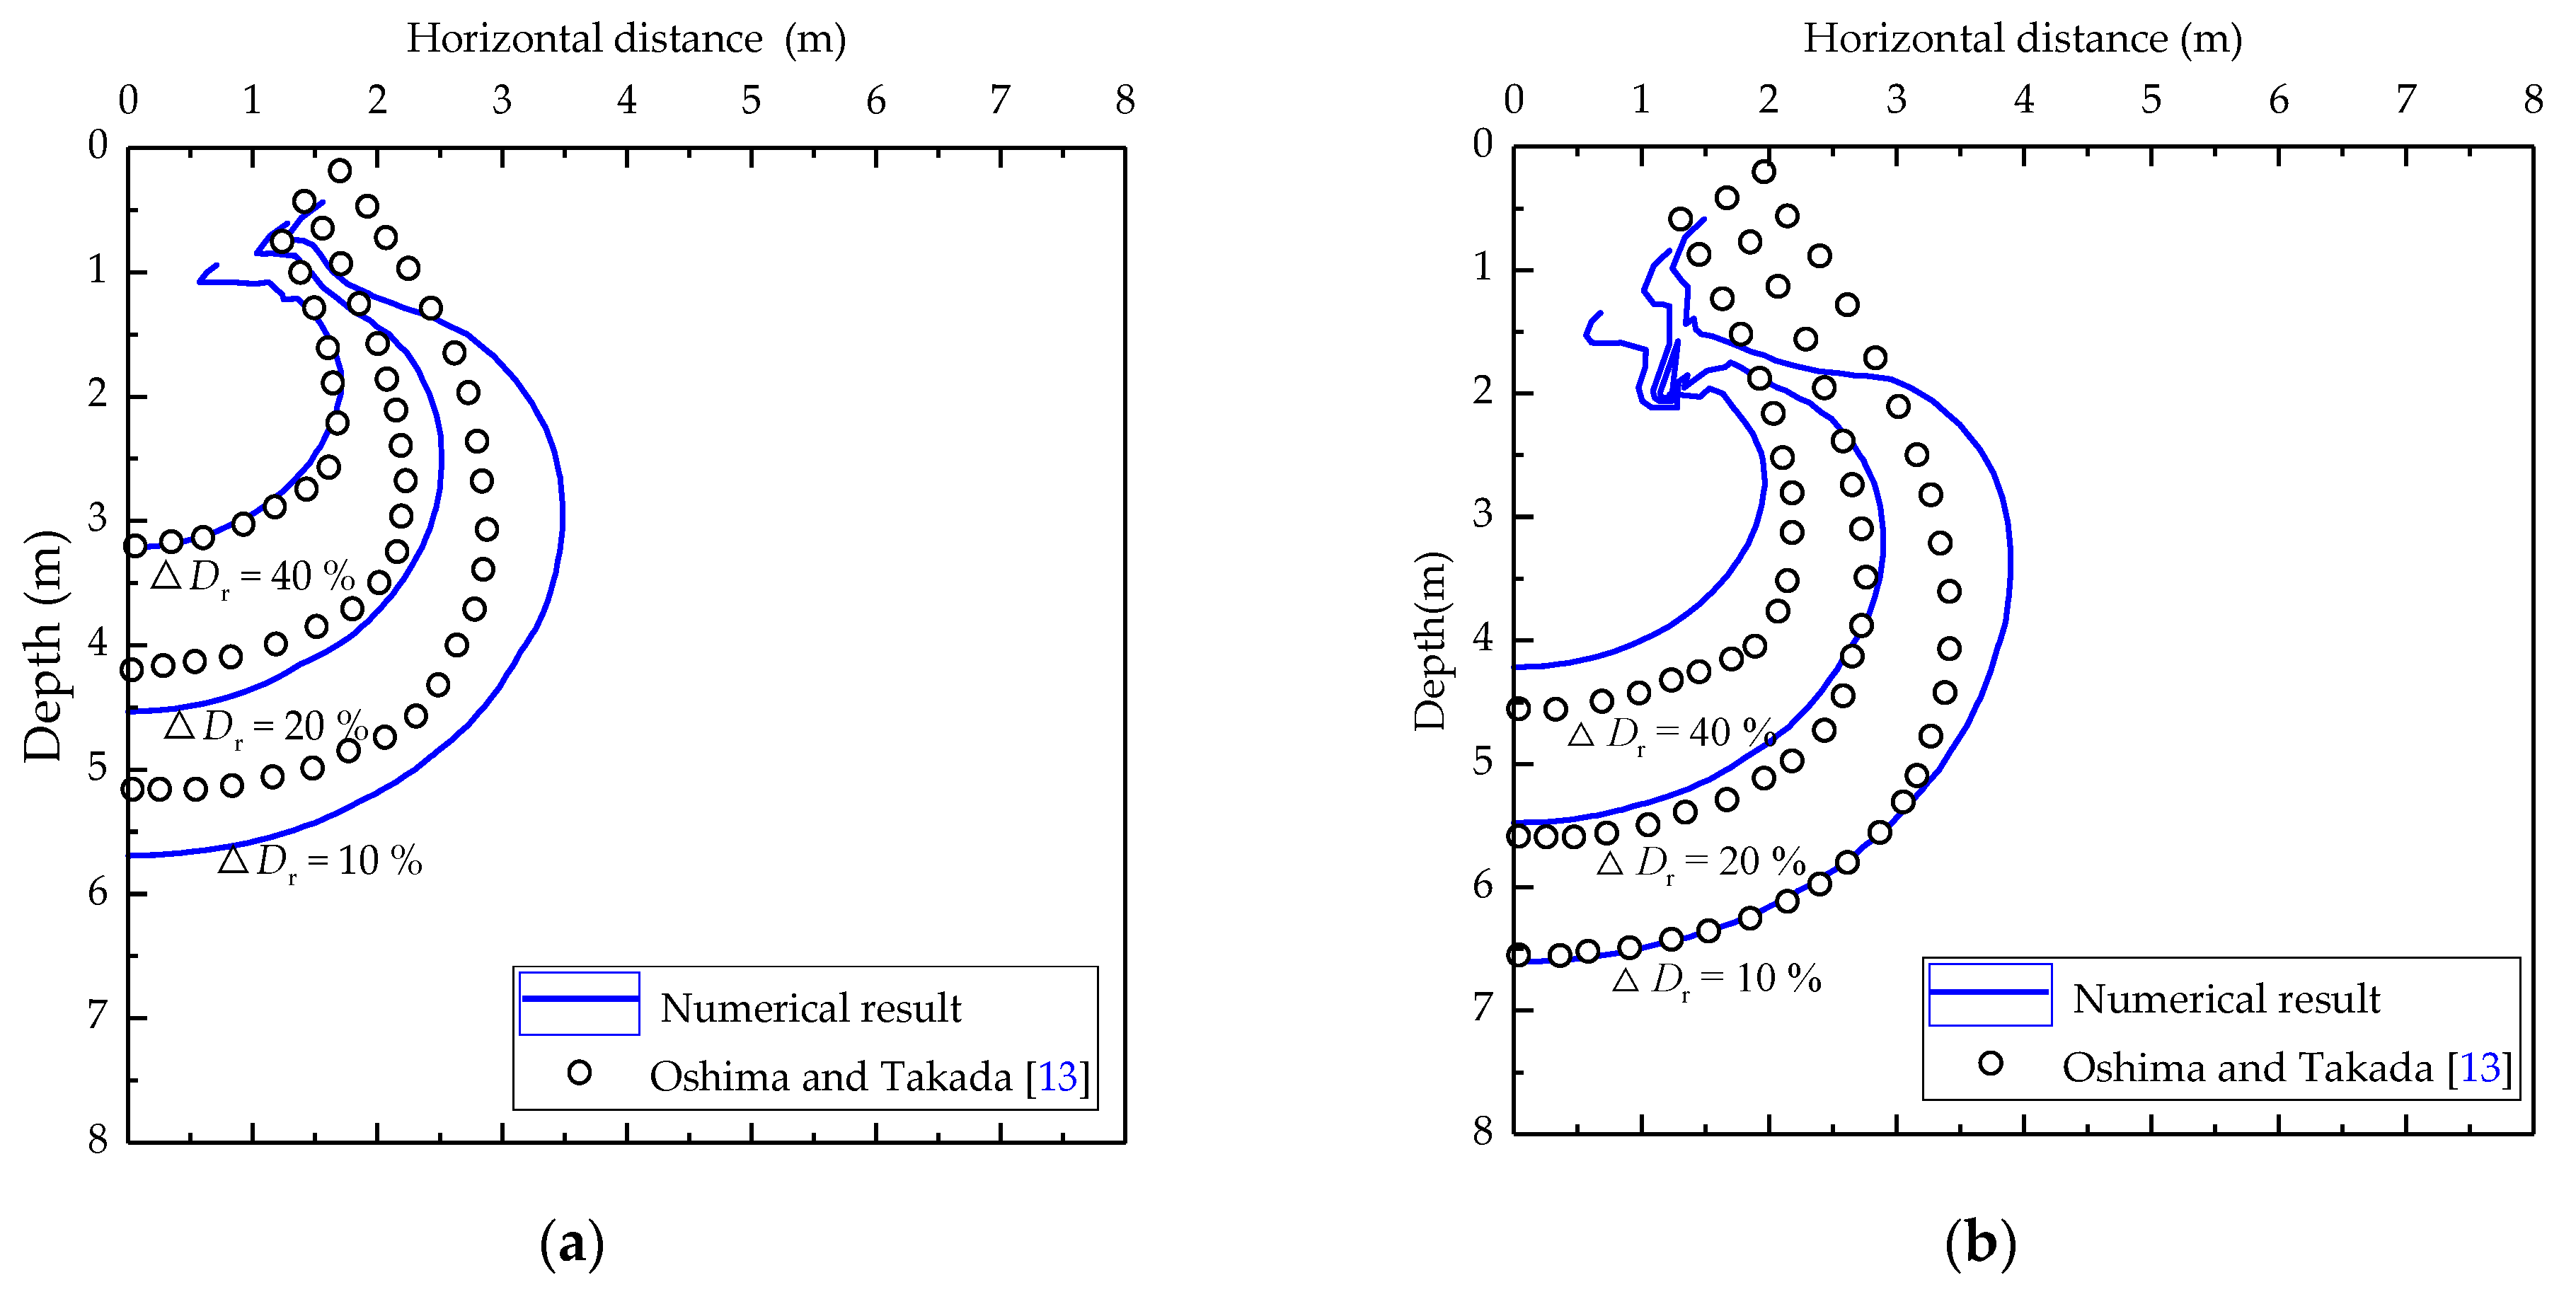
Figure 3.
Comparison of increment in relative density: (a) after 5 blows; (b) after 10 blows.
Figure 3.
Comparison of increment in relative density: (a) after 5 blows; (b) after 10 blows.
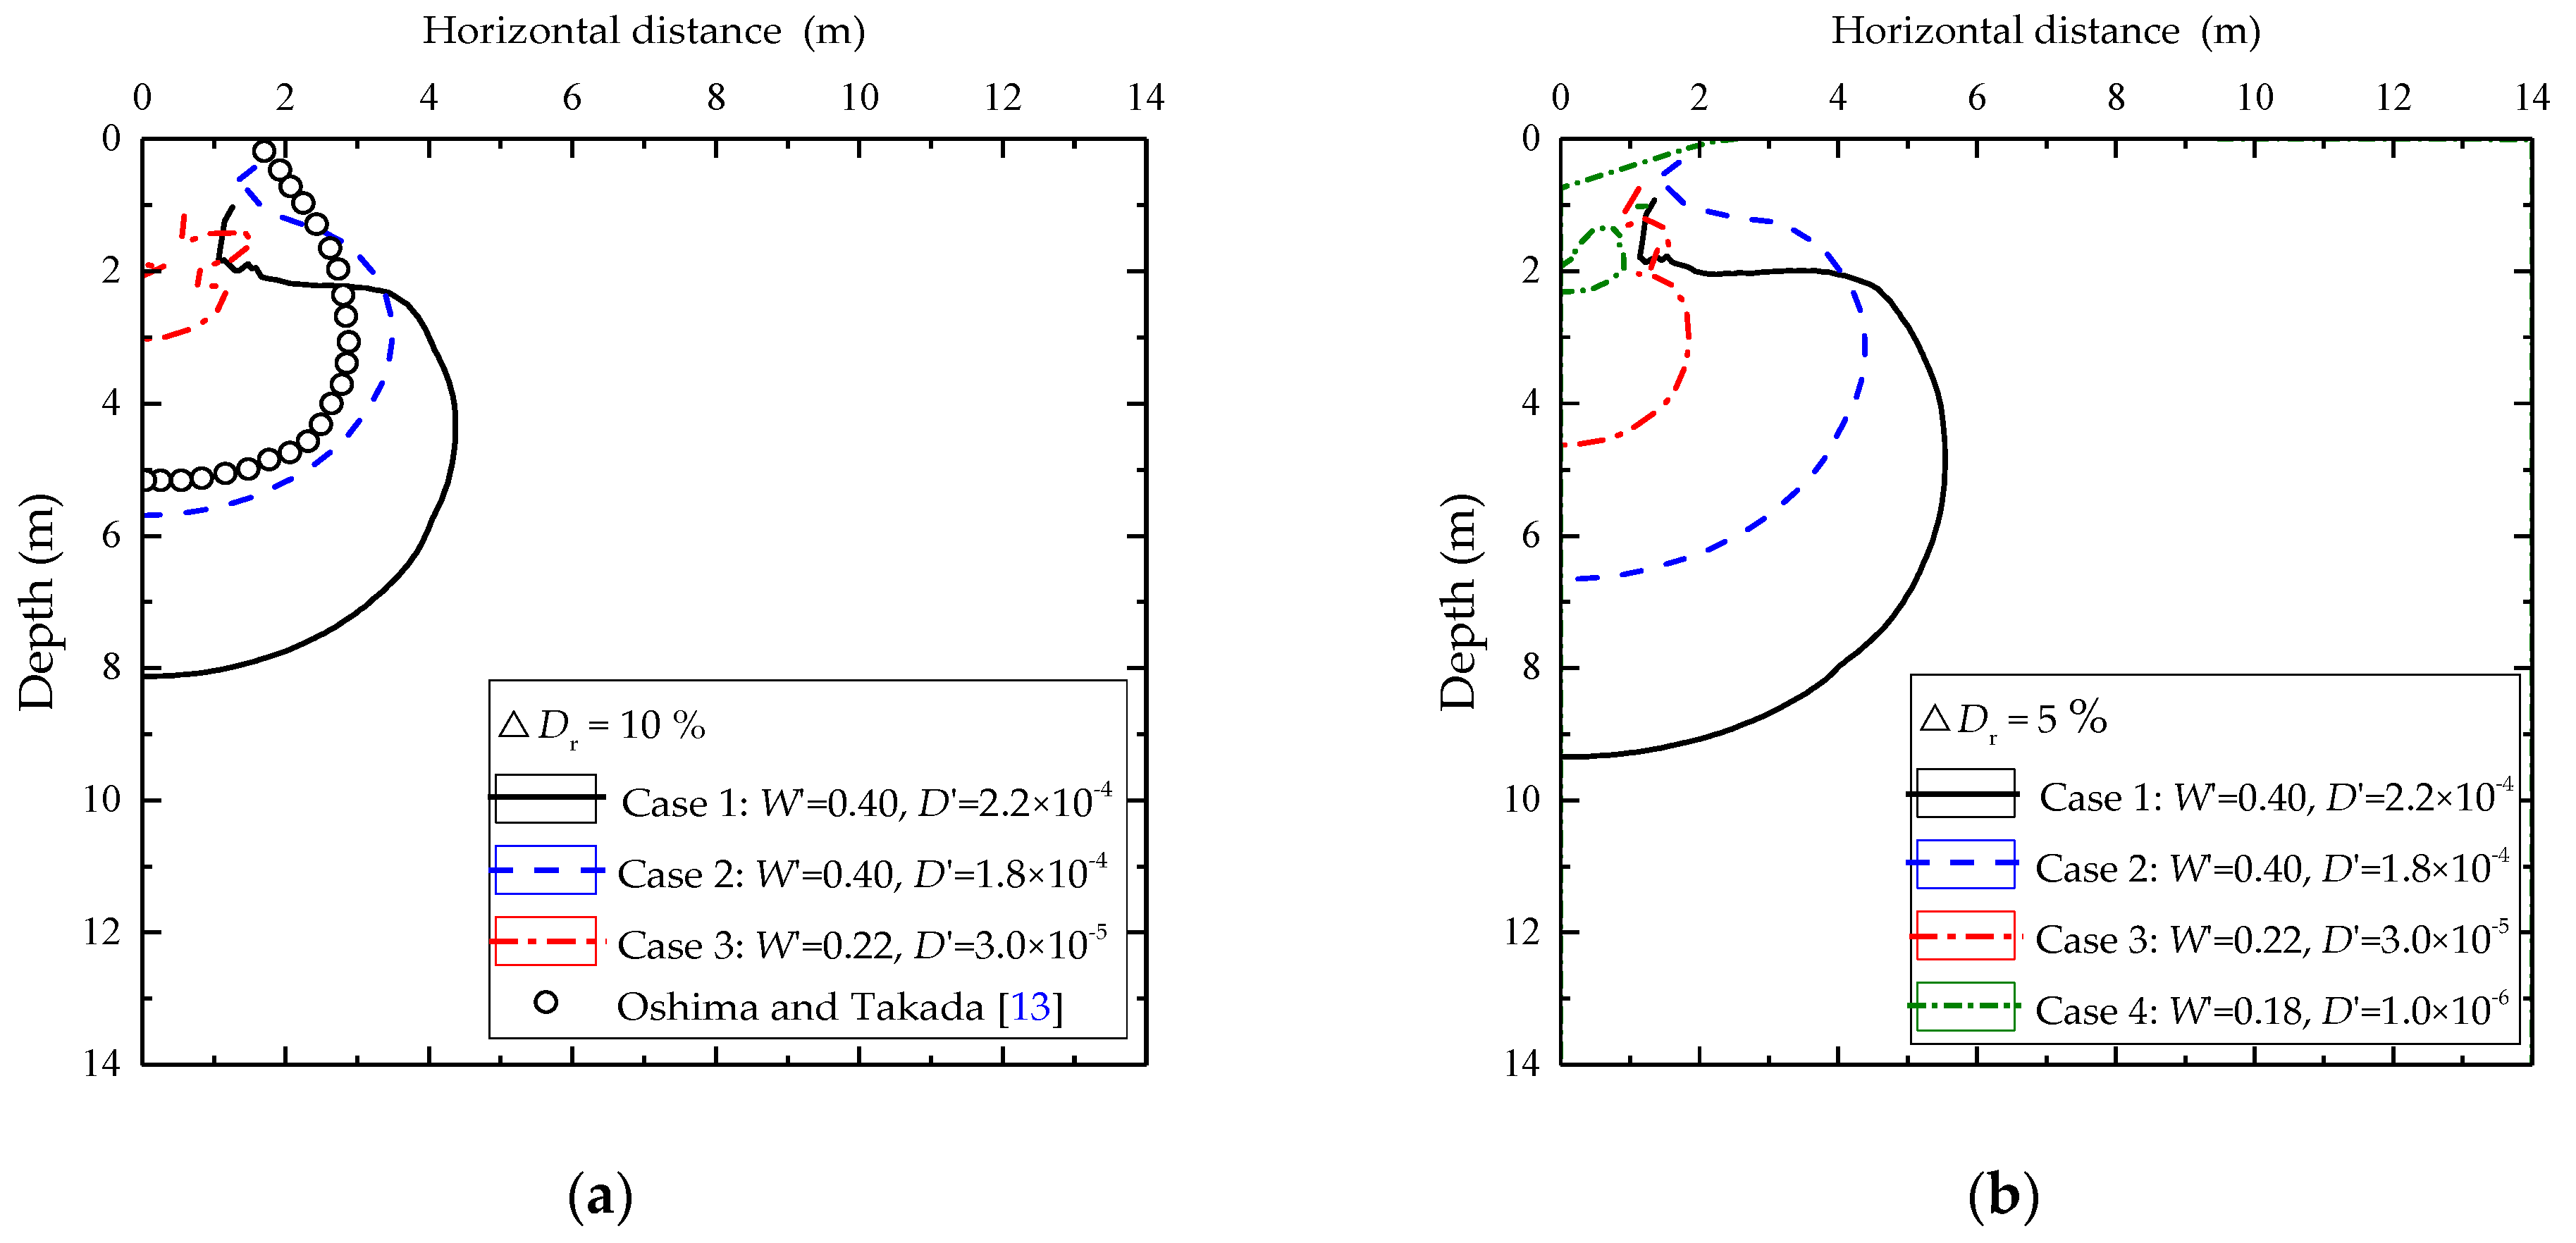
Figure 4.
The effect of the hardening parameters on △Dr after 10 blows: (a) △Dr = 10%; (b) △Dr = 5%.
Figure 4.
The effect of the hardening parameters on △Dr after 10 blows: (a) △Dr = 10%; (b) △Dr = 5%.
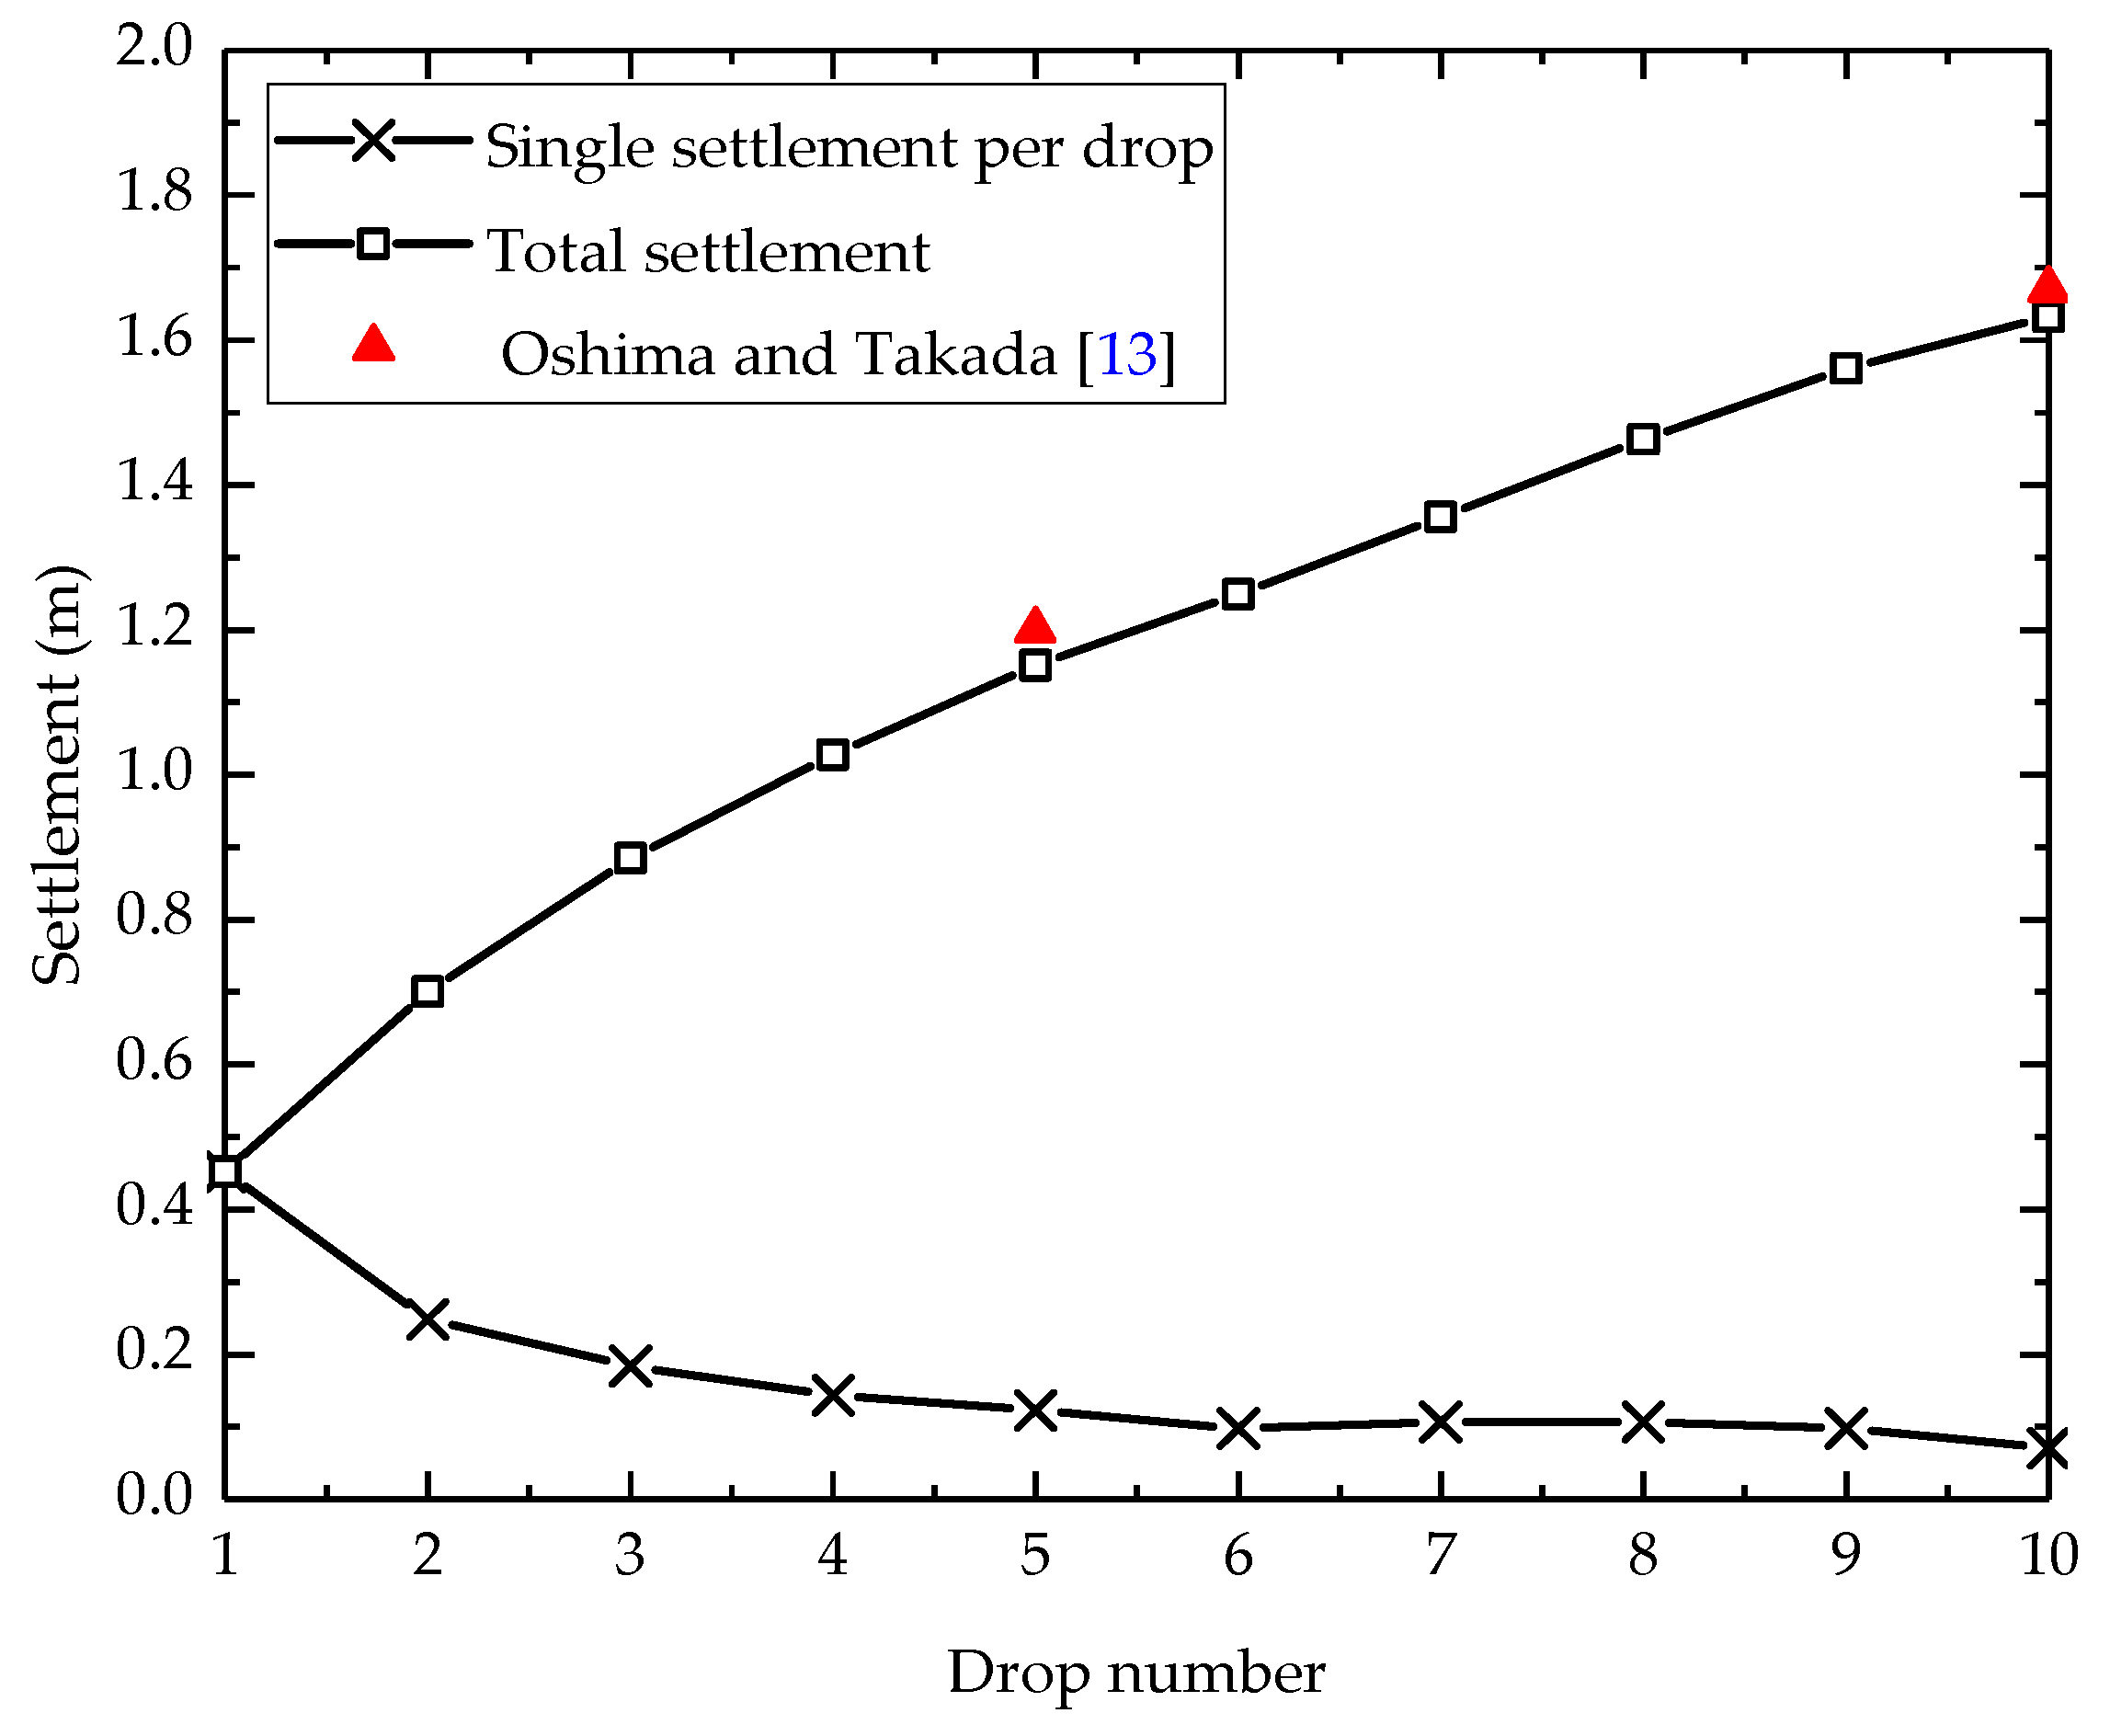
Figure 5.
Comparison of settlement.
Figure 5.
Comparison of settlement.
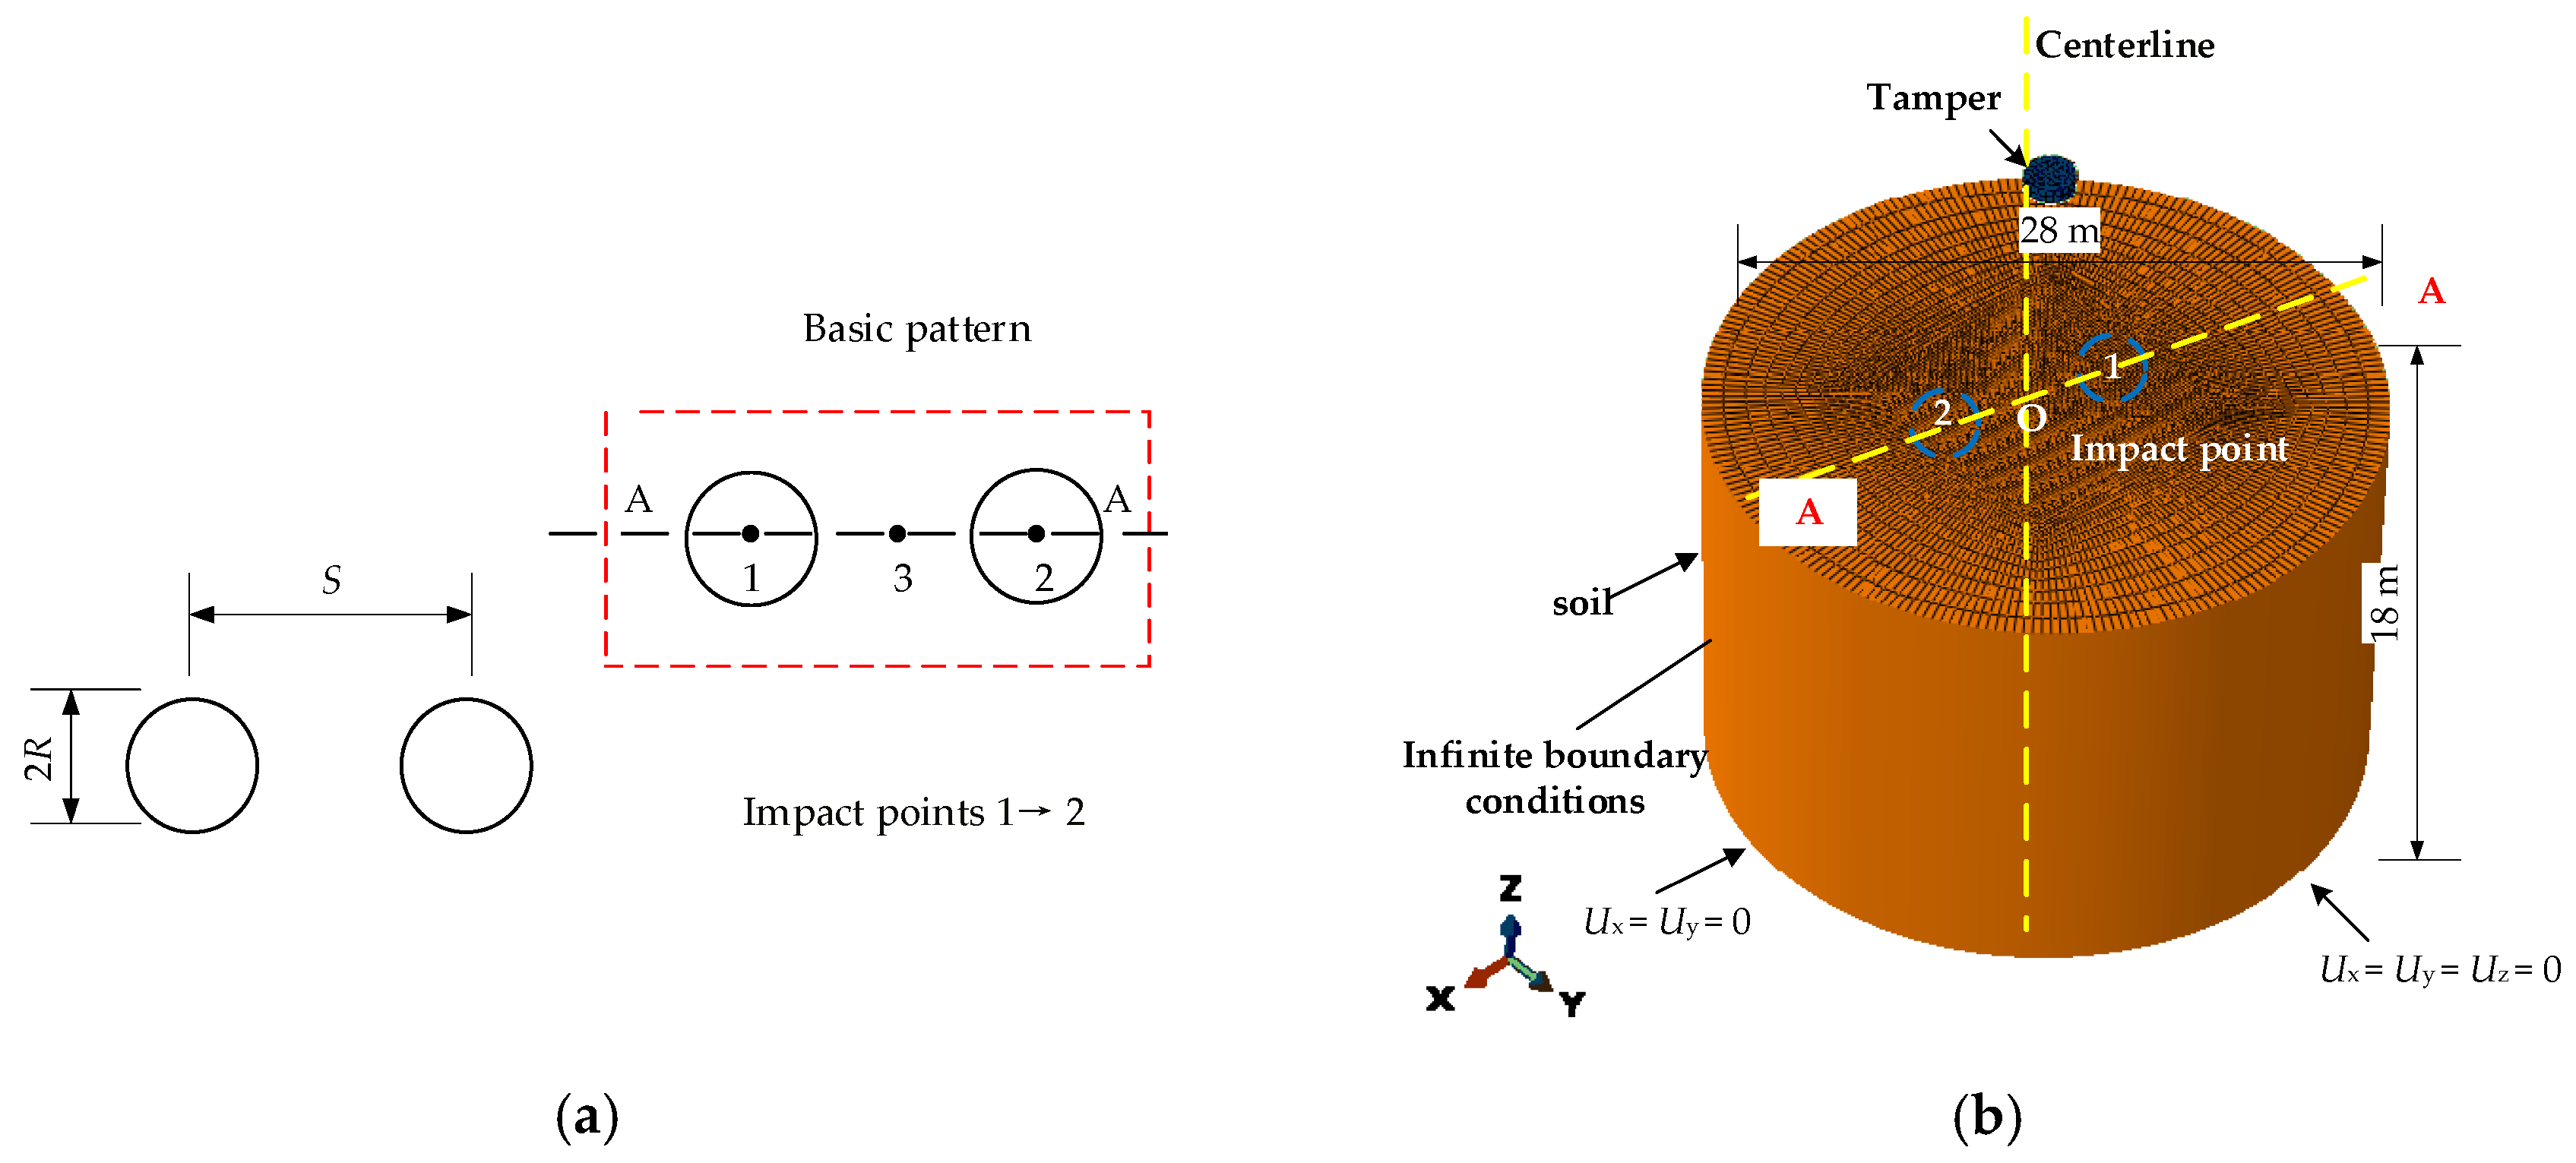
Figure 6.
The layout of the multipoint tamping and 3D FE mesh: (a) the layout; (b) 3D FE mesh.
Figure 6.
The layout of the multipoint tamping and 3D FE mesh: (a) the layout; (b) 3D FE mesh.
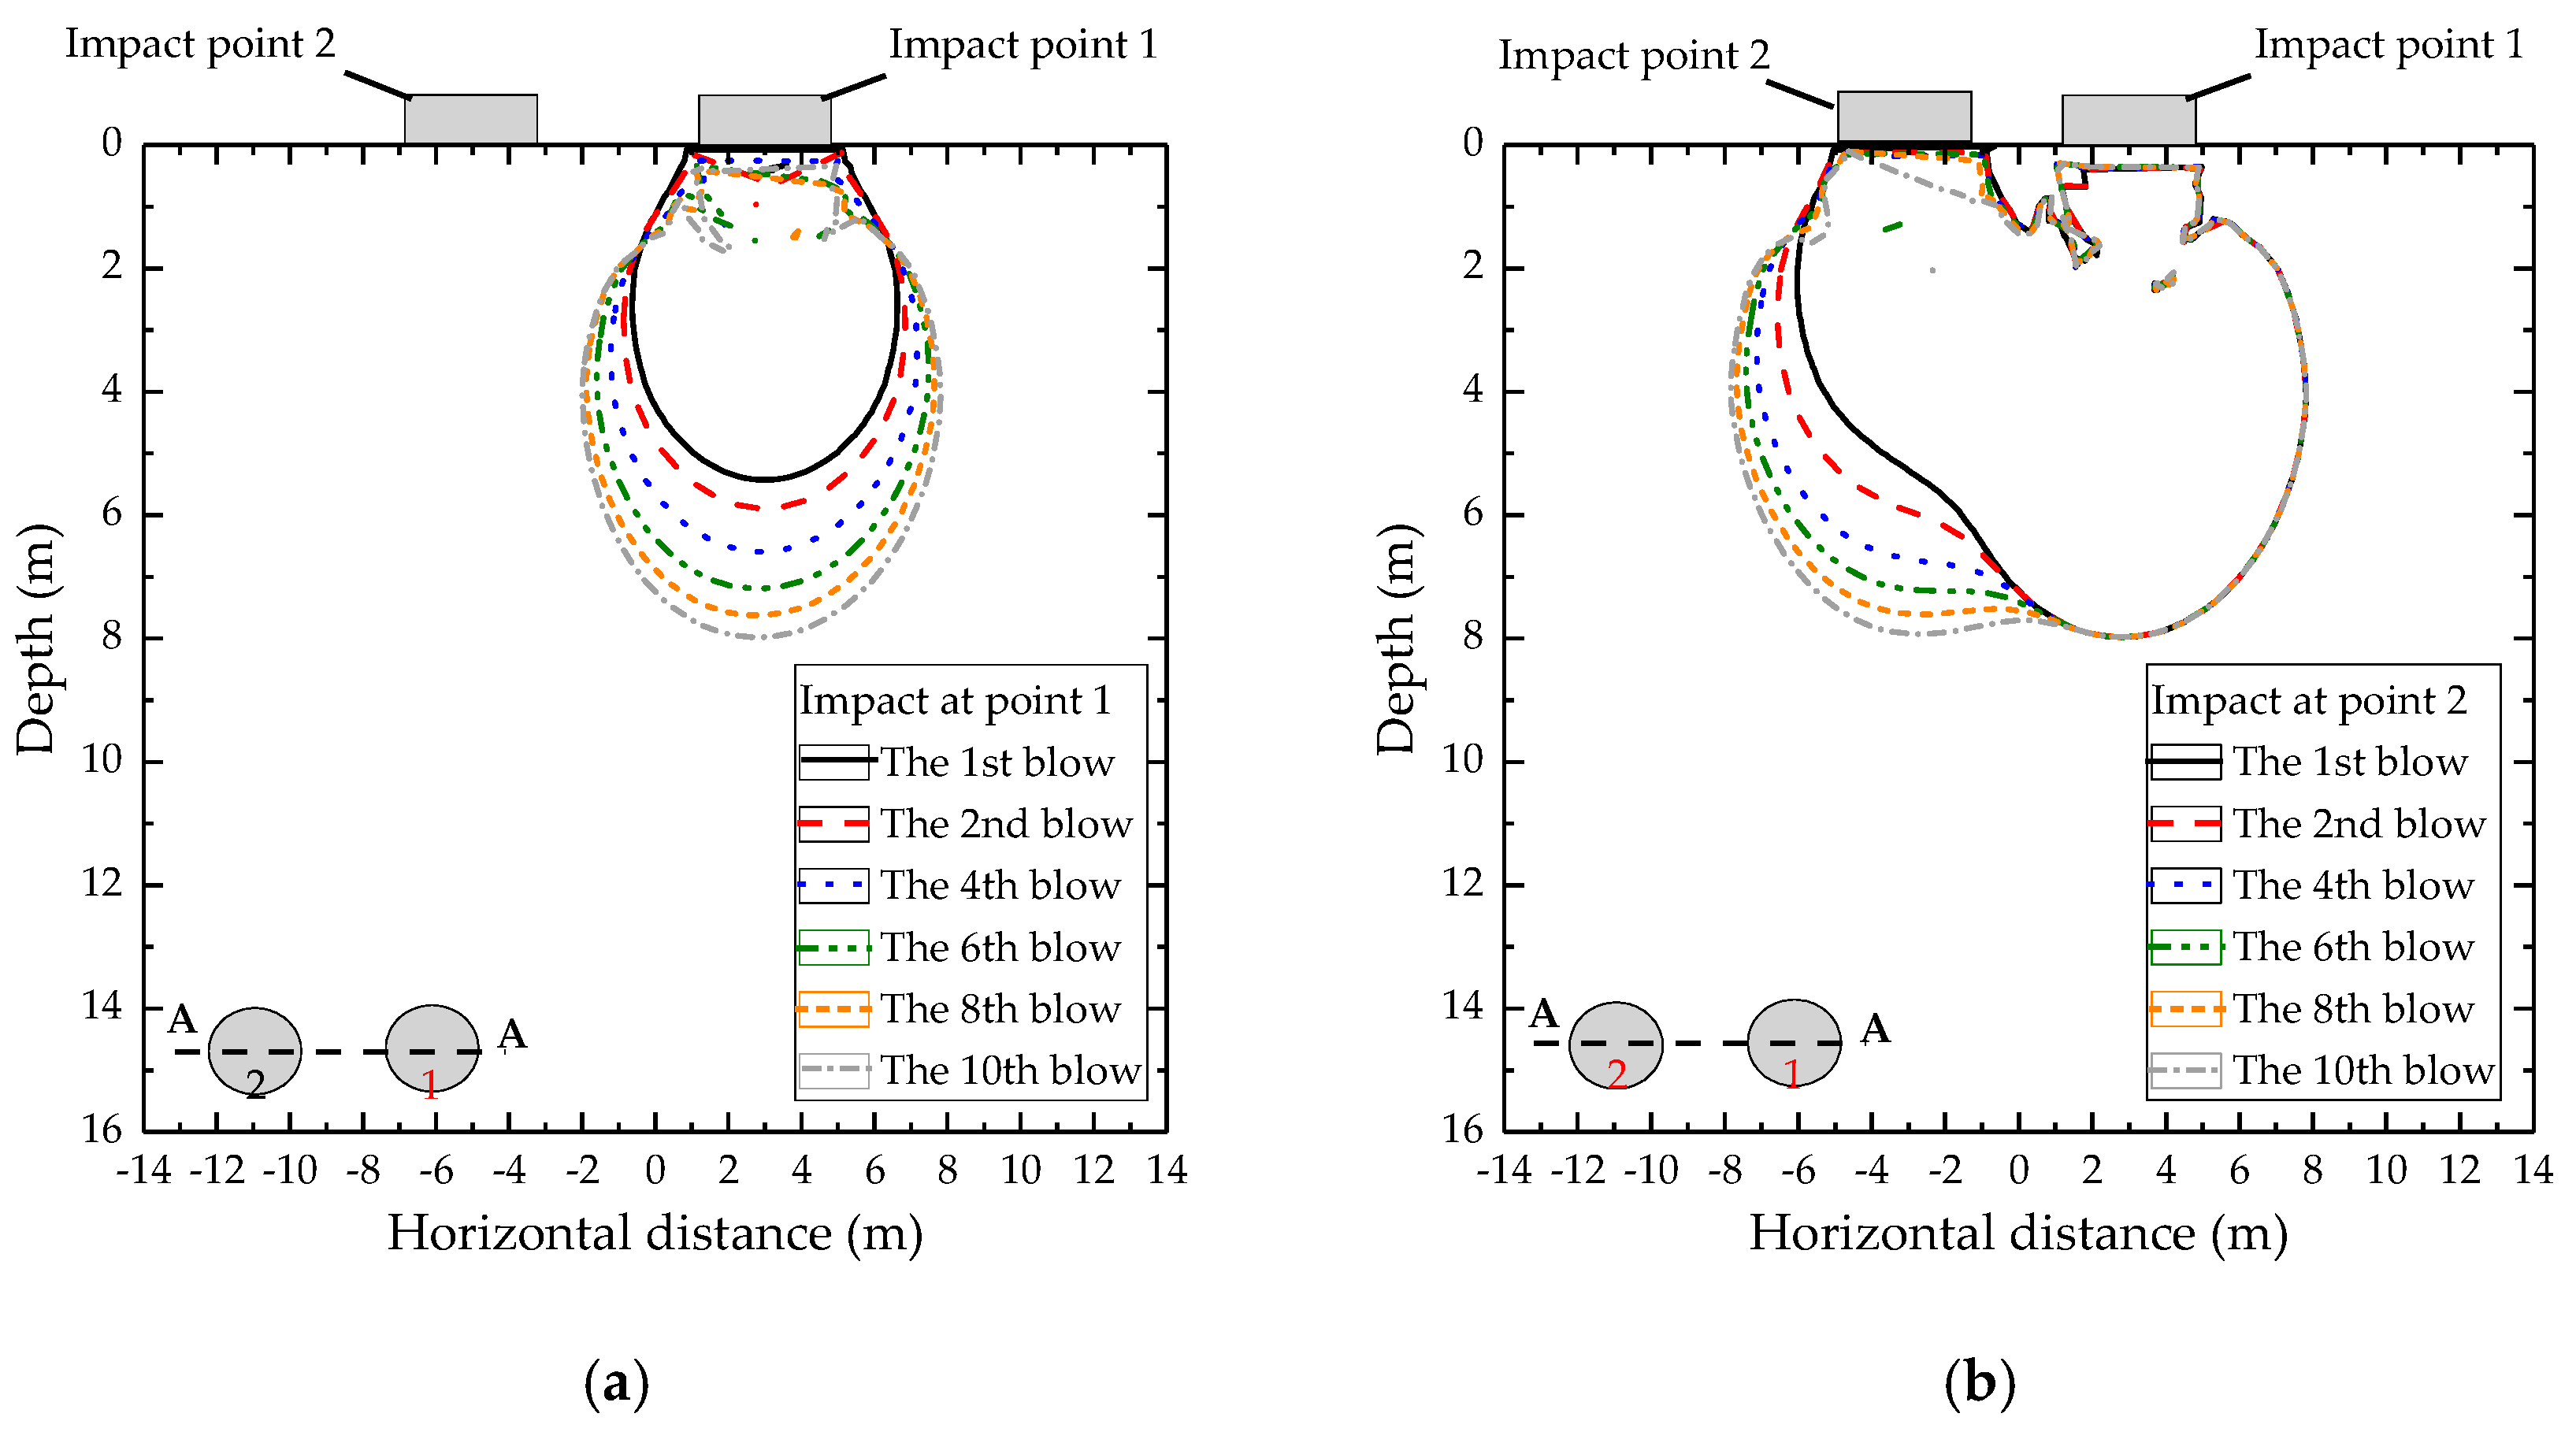
Figure 7.
The zone of Ir = 7.7% for drop number: (a) impact at point 1; (b) impact at point 2.
Figure 7.
The zone of Ir = 7.7% for drop number: (a) impact at point 1; (b) impact at point 2.
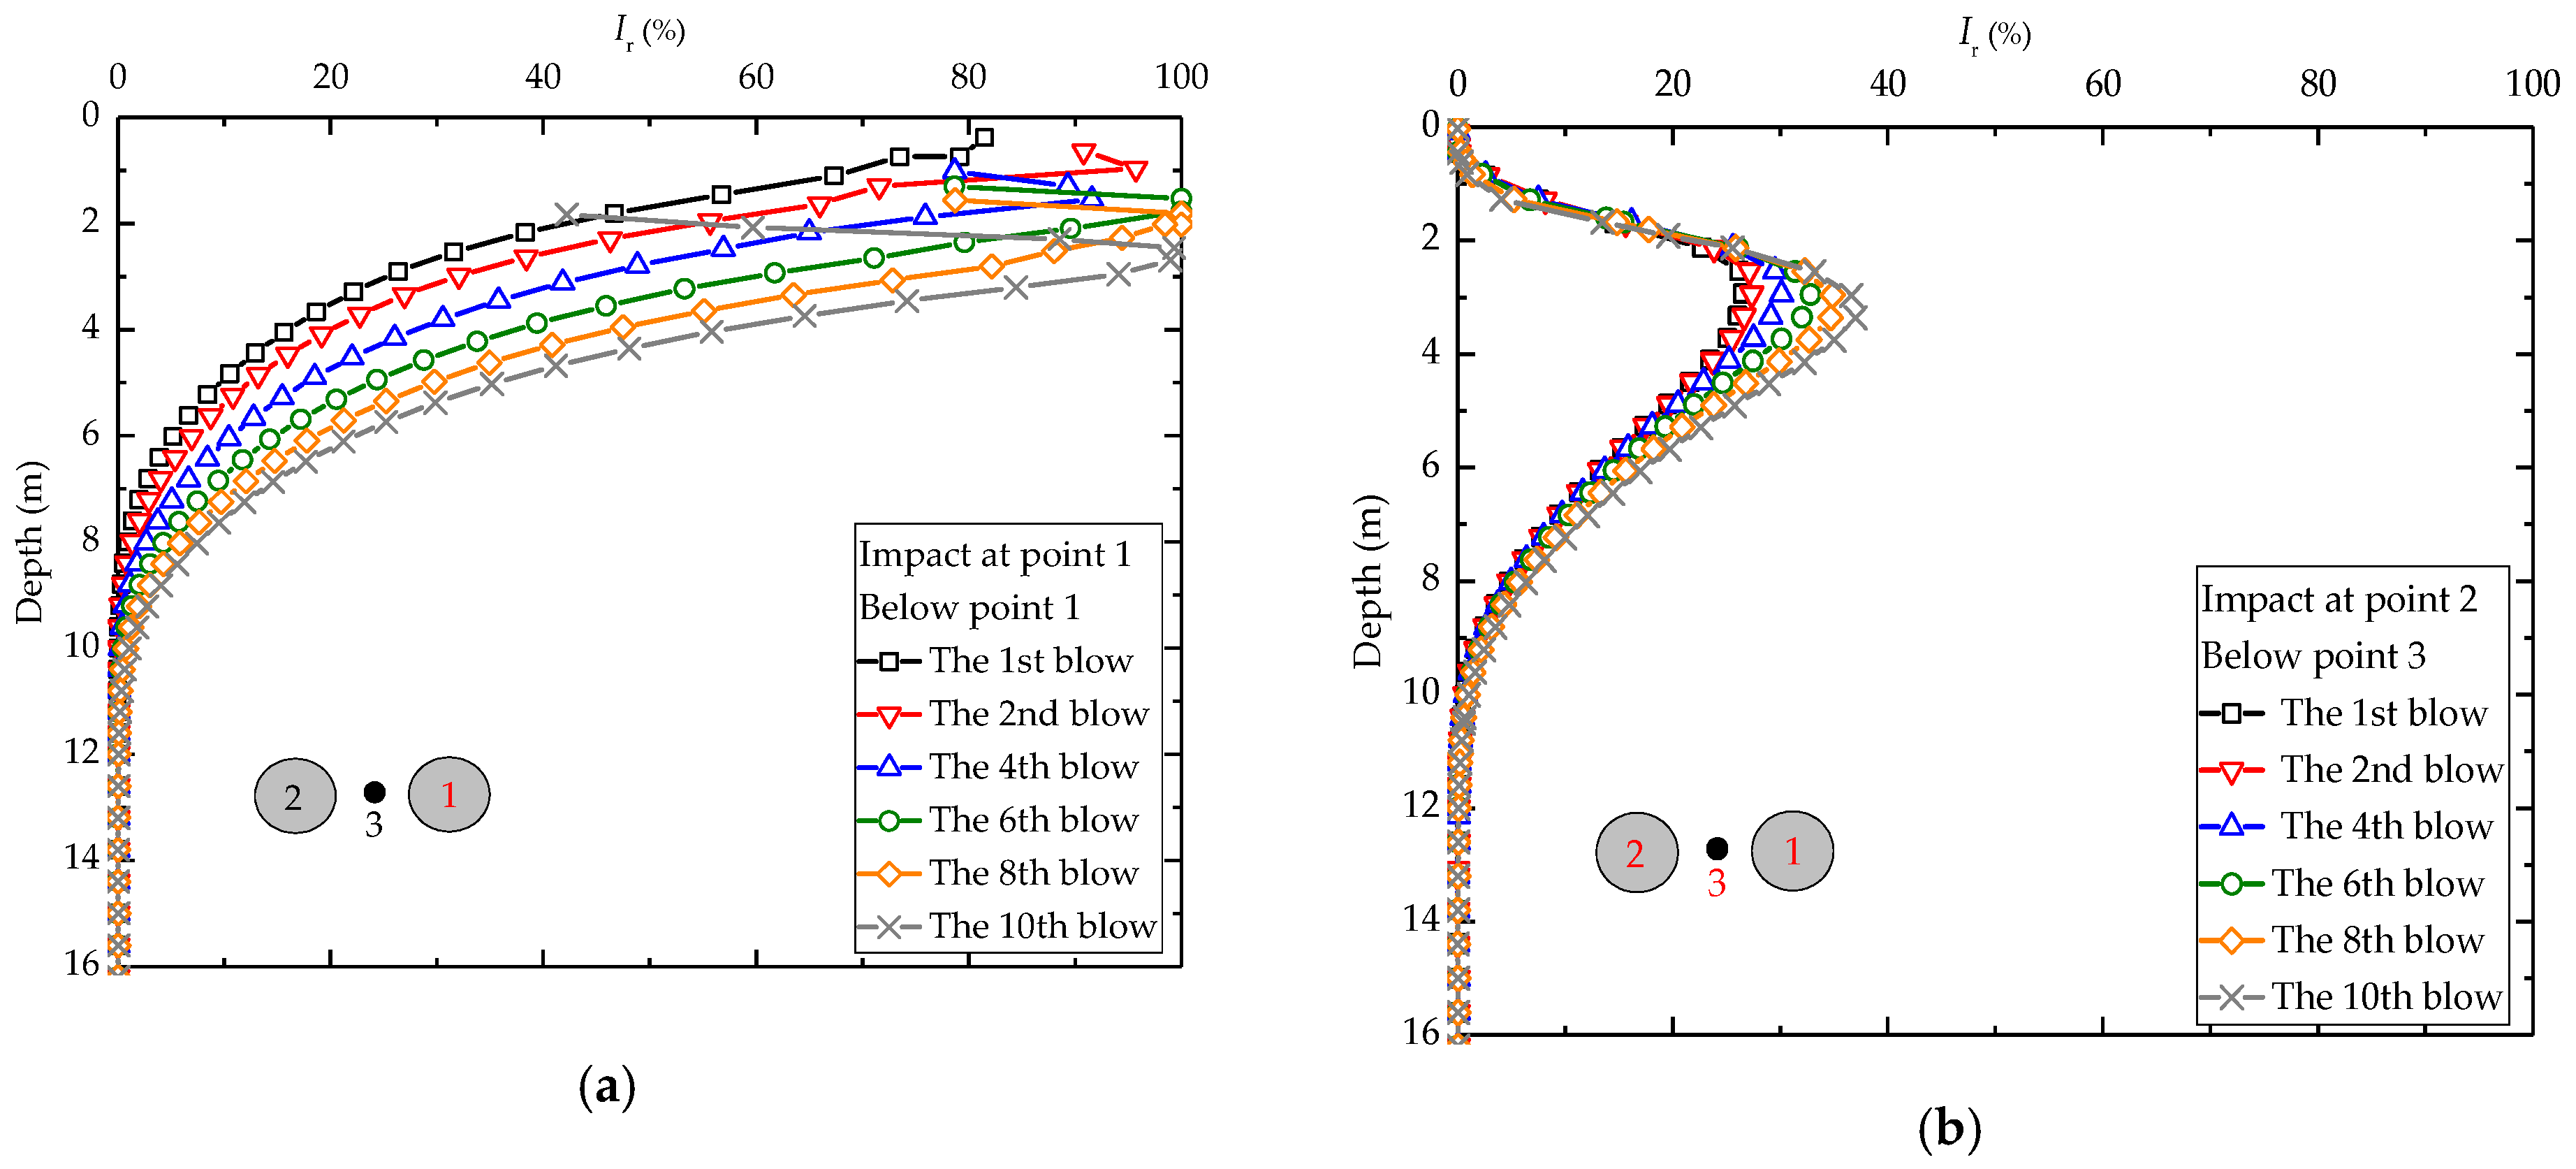
Figure 8.
Ir of soil versus depth for drop number: (a) below impact point 1; (b) below impact point 3.
Figure 8.
Ir of soil versus depth for drop number: (a) below impact point 1; (b) below impact point 3.
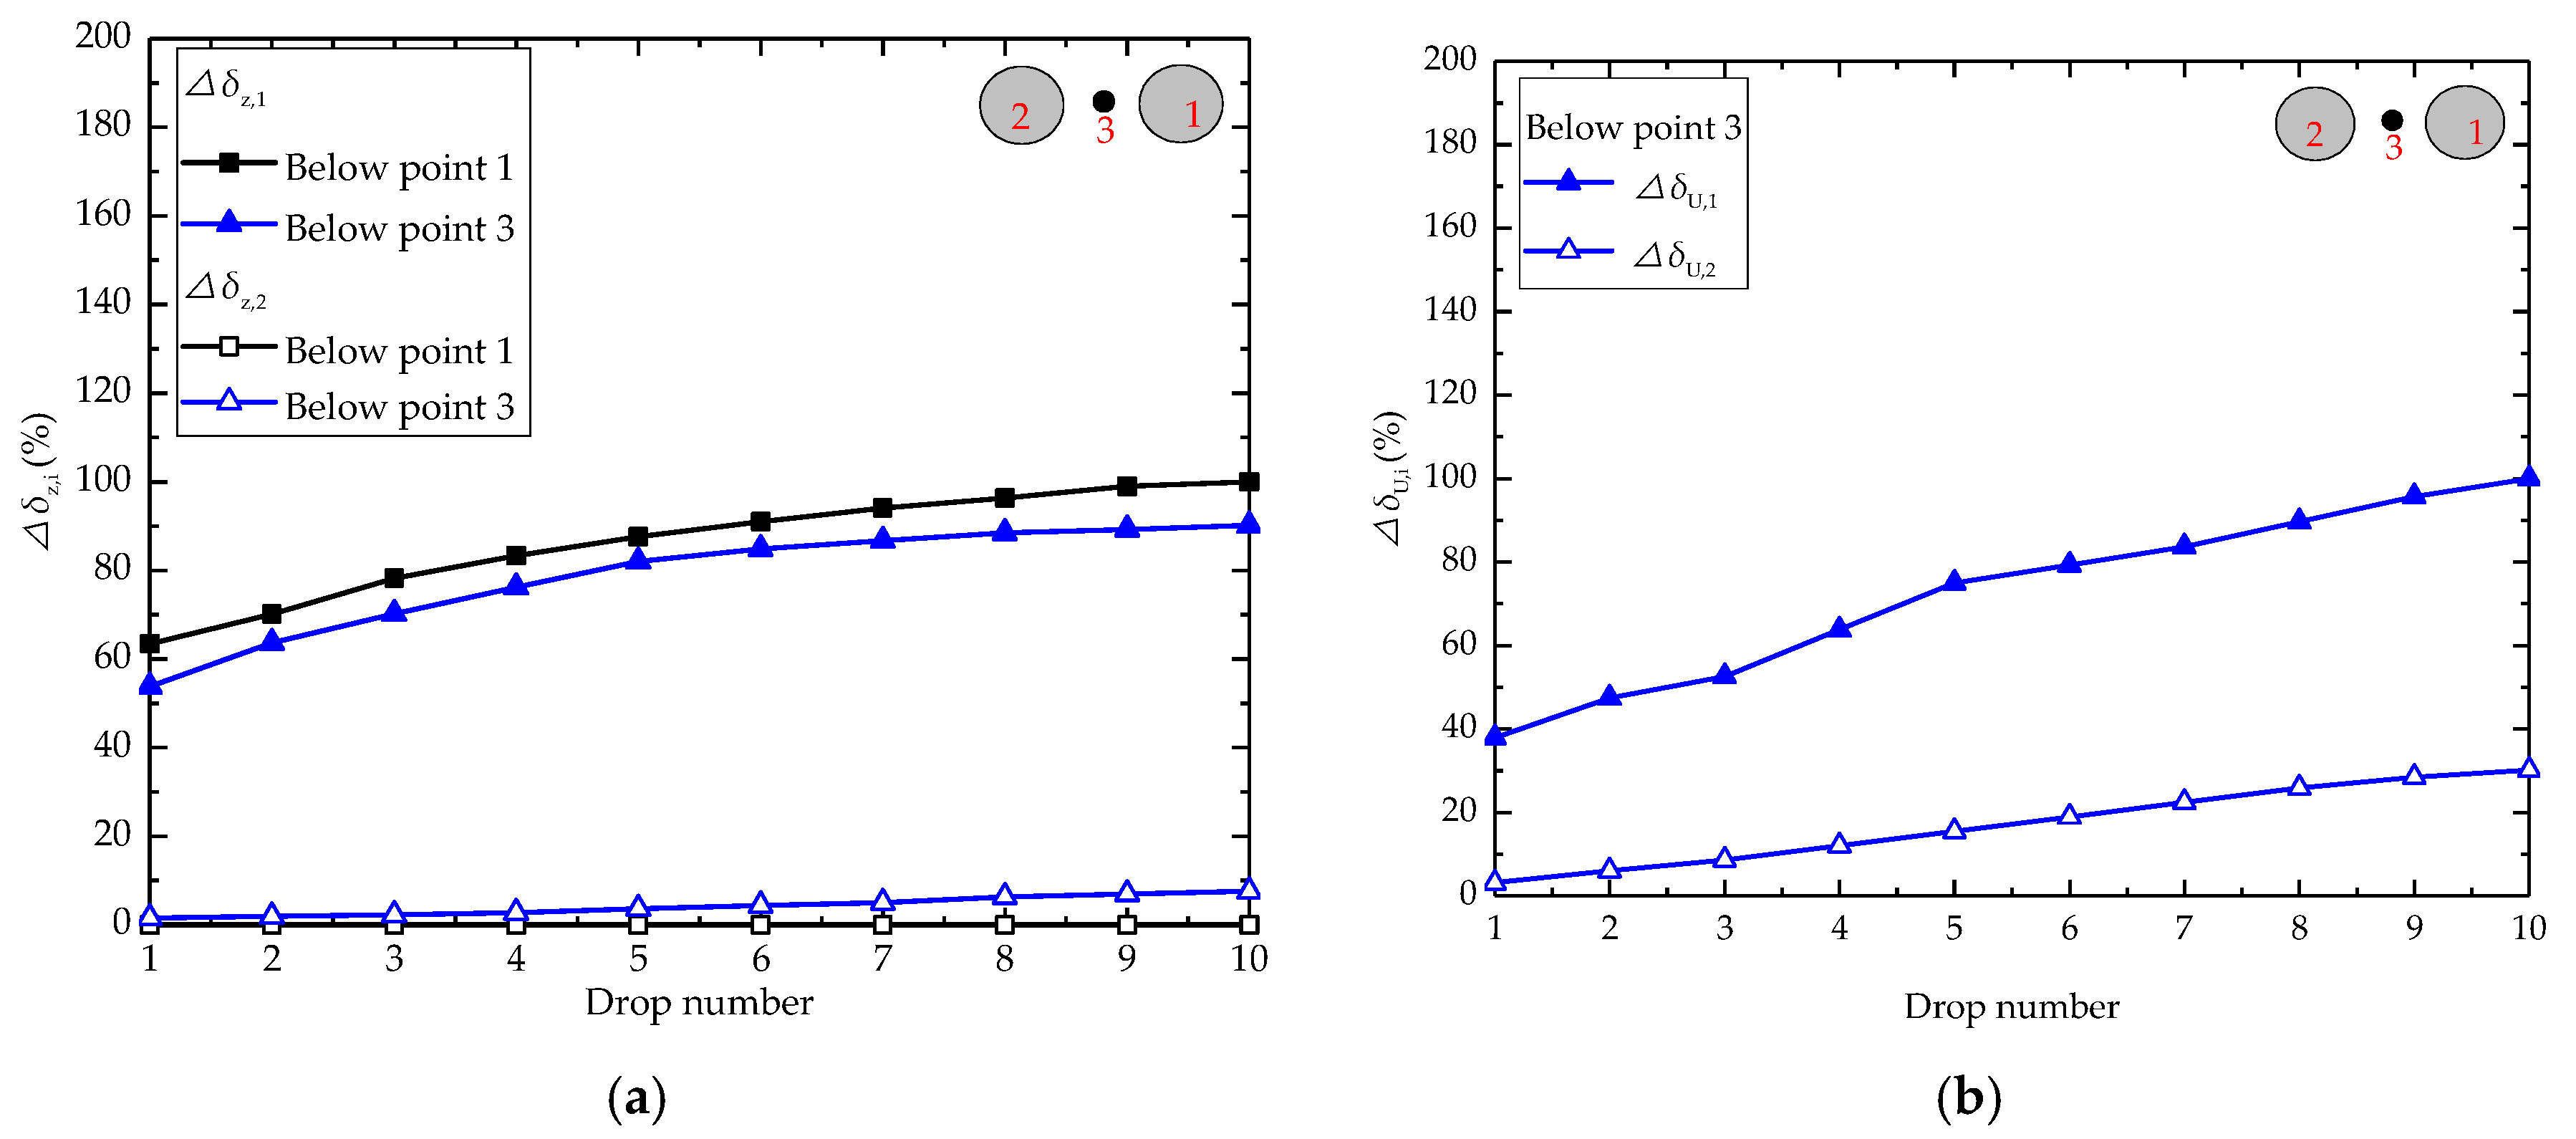
Figure 9.
Normalized indicators versus drop number: (a) △δz,i; (b) △δU,i.
Figure 9.
Normalized indicators versus drop number: (a) △δz,i; (b) △δU,i.
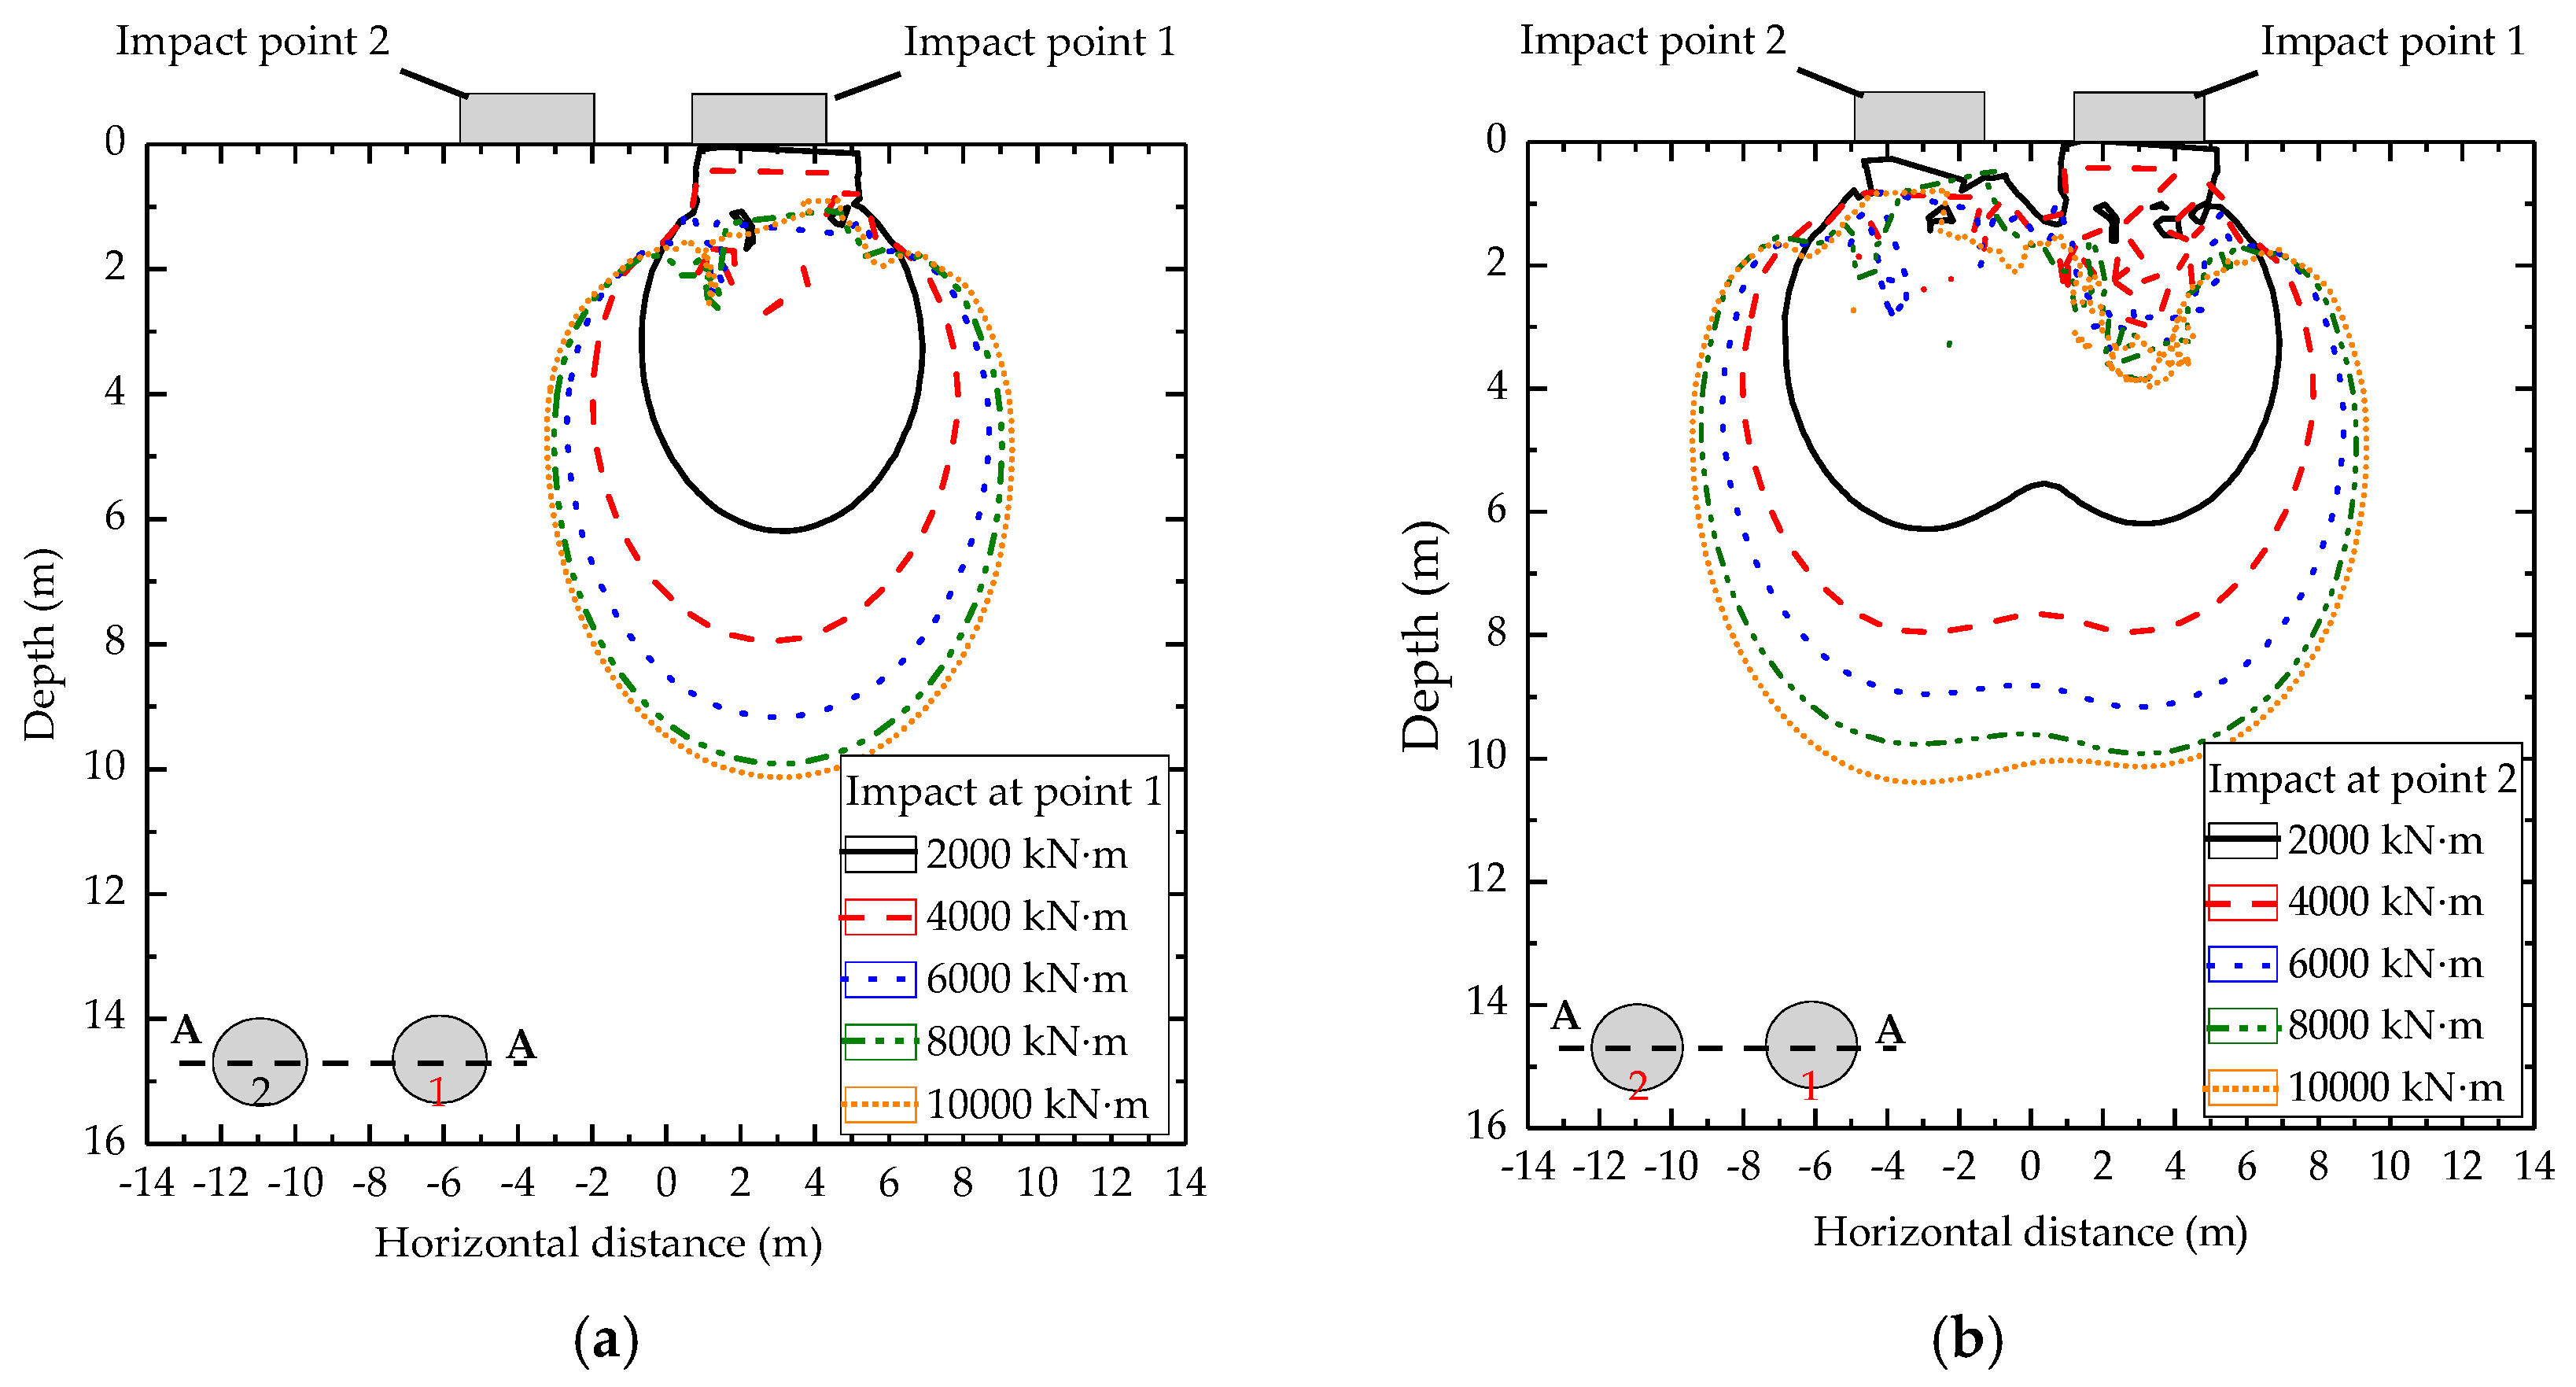
Figure 10.
The zone of Ir = 7.7% for drop energy: (a) impact at point 1; (b) impact at point 2.
Figure 10.
The zone of Ir = 7.7% for drop energy: (a) impact at point 1; (b) impact at point 2.
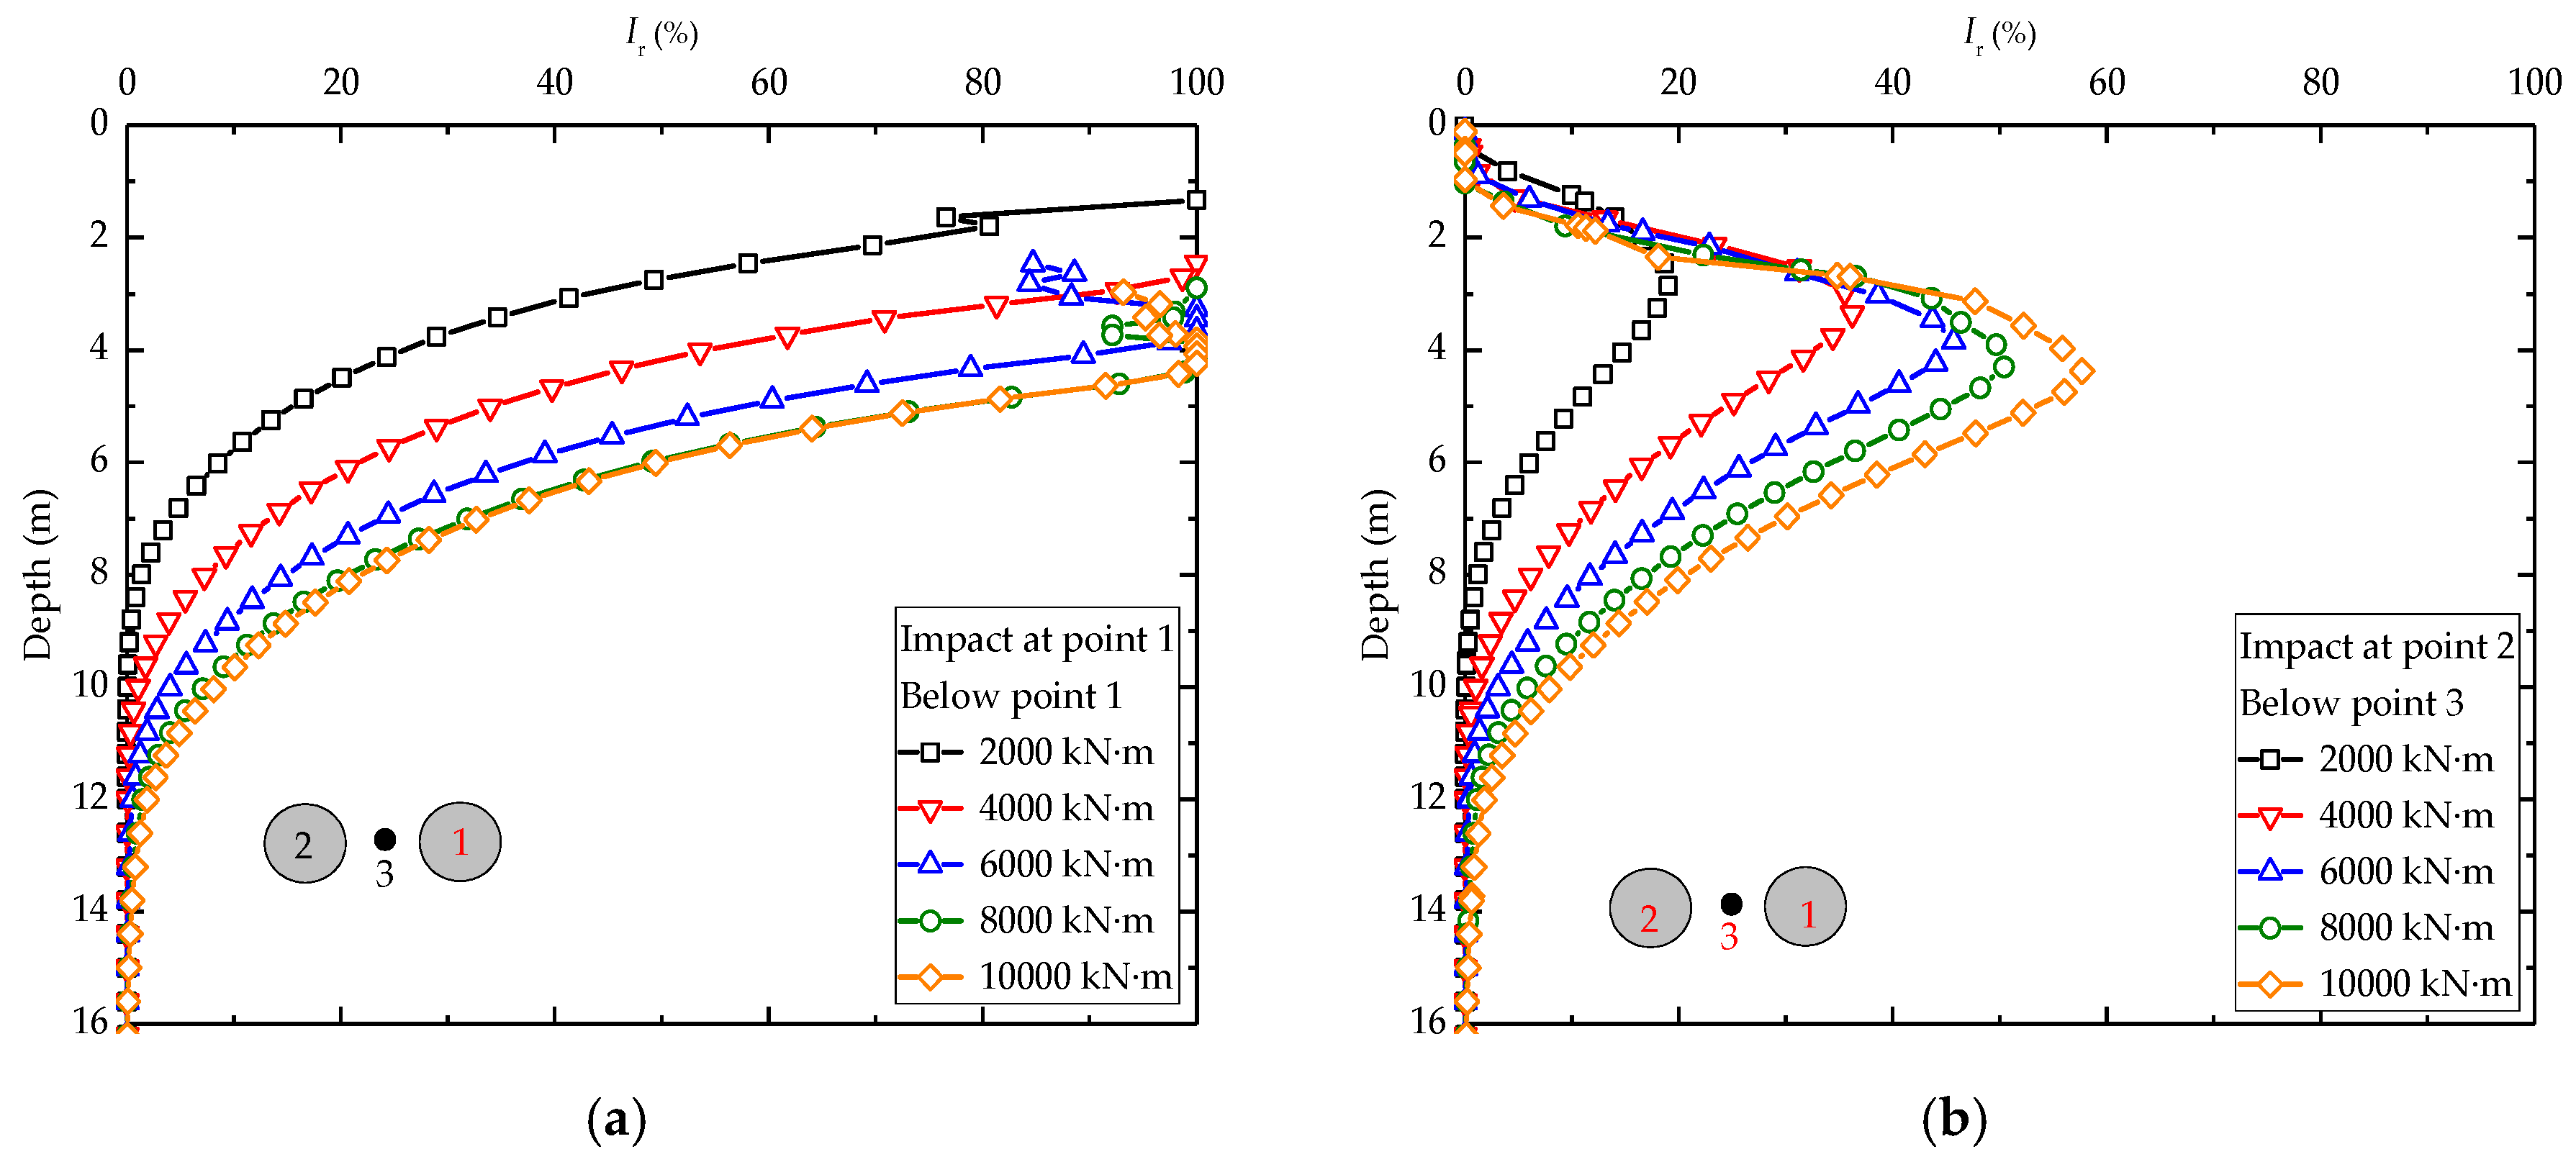
Figure 11.
Ir of soil versus depth for drop energy: (a) below impact point 1; (b) below point 3.
Figure 11.
Ir of soil versus depth for drop energy: (a) below impact point 1; (b) below point 3.
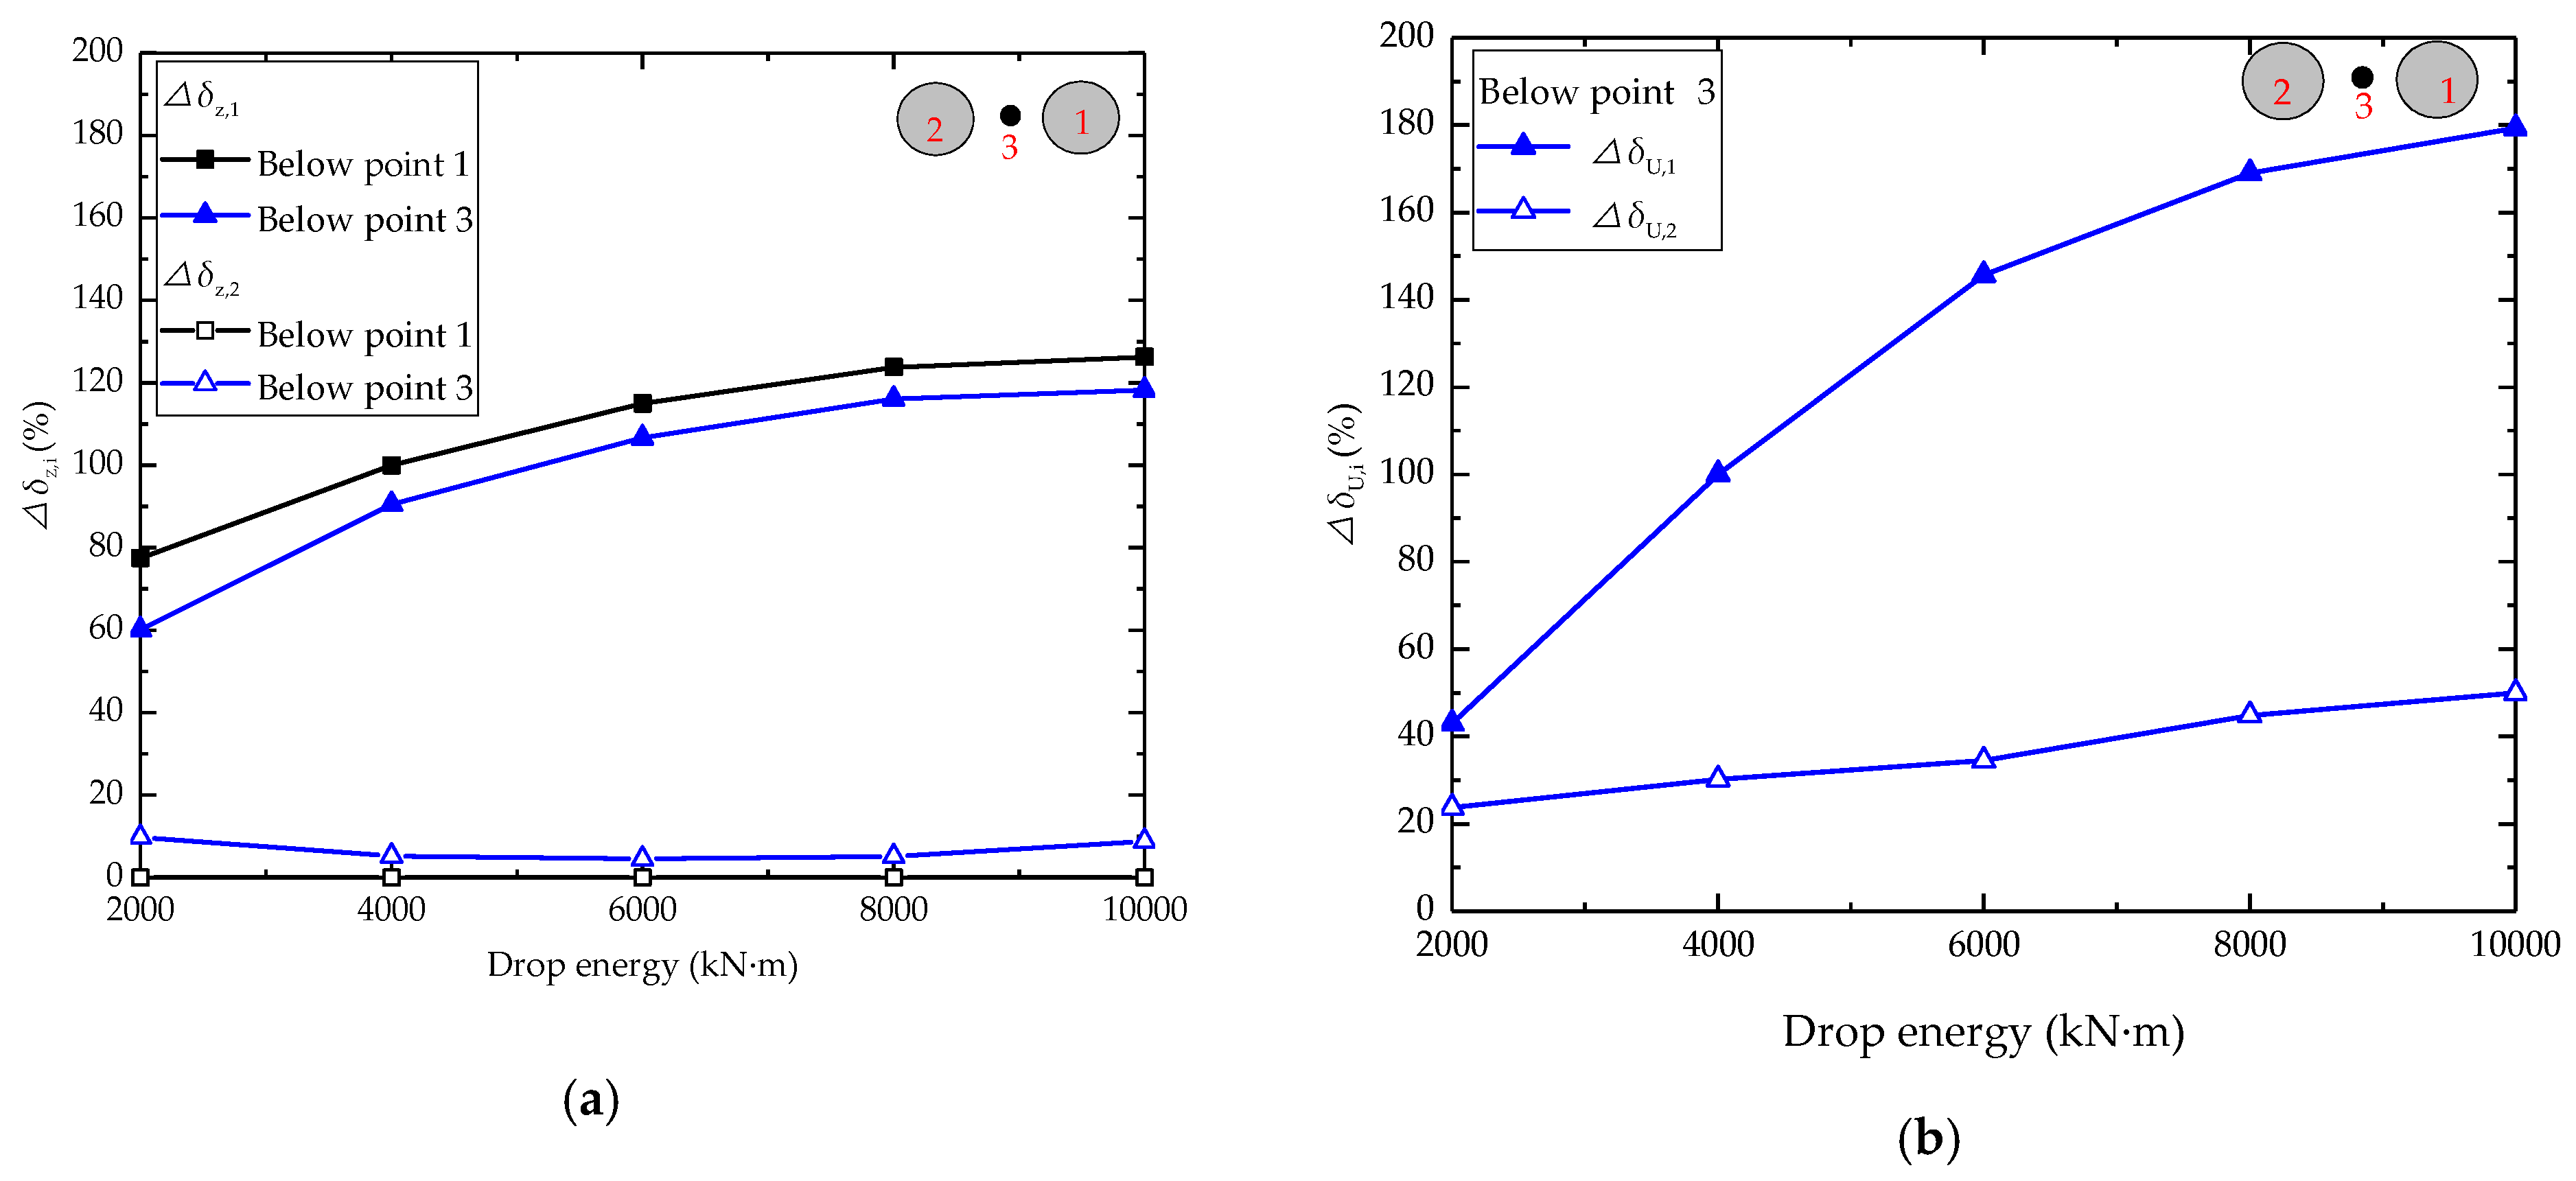
Figure 12.
Normalized indicators versus drop energy: (a) △δz,i; (b) △δU,i.
Figure 12.
Normalized indicators versus drop energy: (a) △δz,i; (b) △δU,i.
Figure 13.
The zone of Ir = 7.7% for tamping distance.
Figure 13.
The zone of Ir = 7.7% for tamping distance.
Figure 14.
Ir of soil versus depth for tamping distance.
Figure 14.
Ir of soil versus depth for tamping distance.
Figure 15.
Normalized indicators versus S/D: (a) △δz,i; (b) △δU,i.
Figure 15.
Normalized indicators versus S/D: (a) △δz,i; (b) △δU,i.
Figure 16.
The zone of Ir = 7.7% for tamper radius: (a) impact at point 1; (b) impact at point 2.
Figure 16.
The zone of Ir = 7.7% for tamper radius: (a) impact at point 1; (b) impact at point 2.
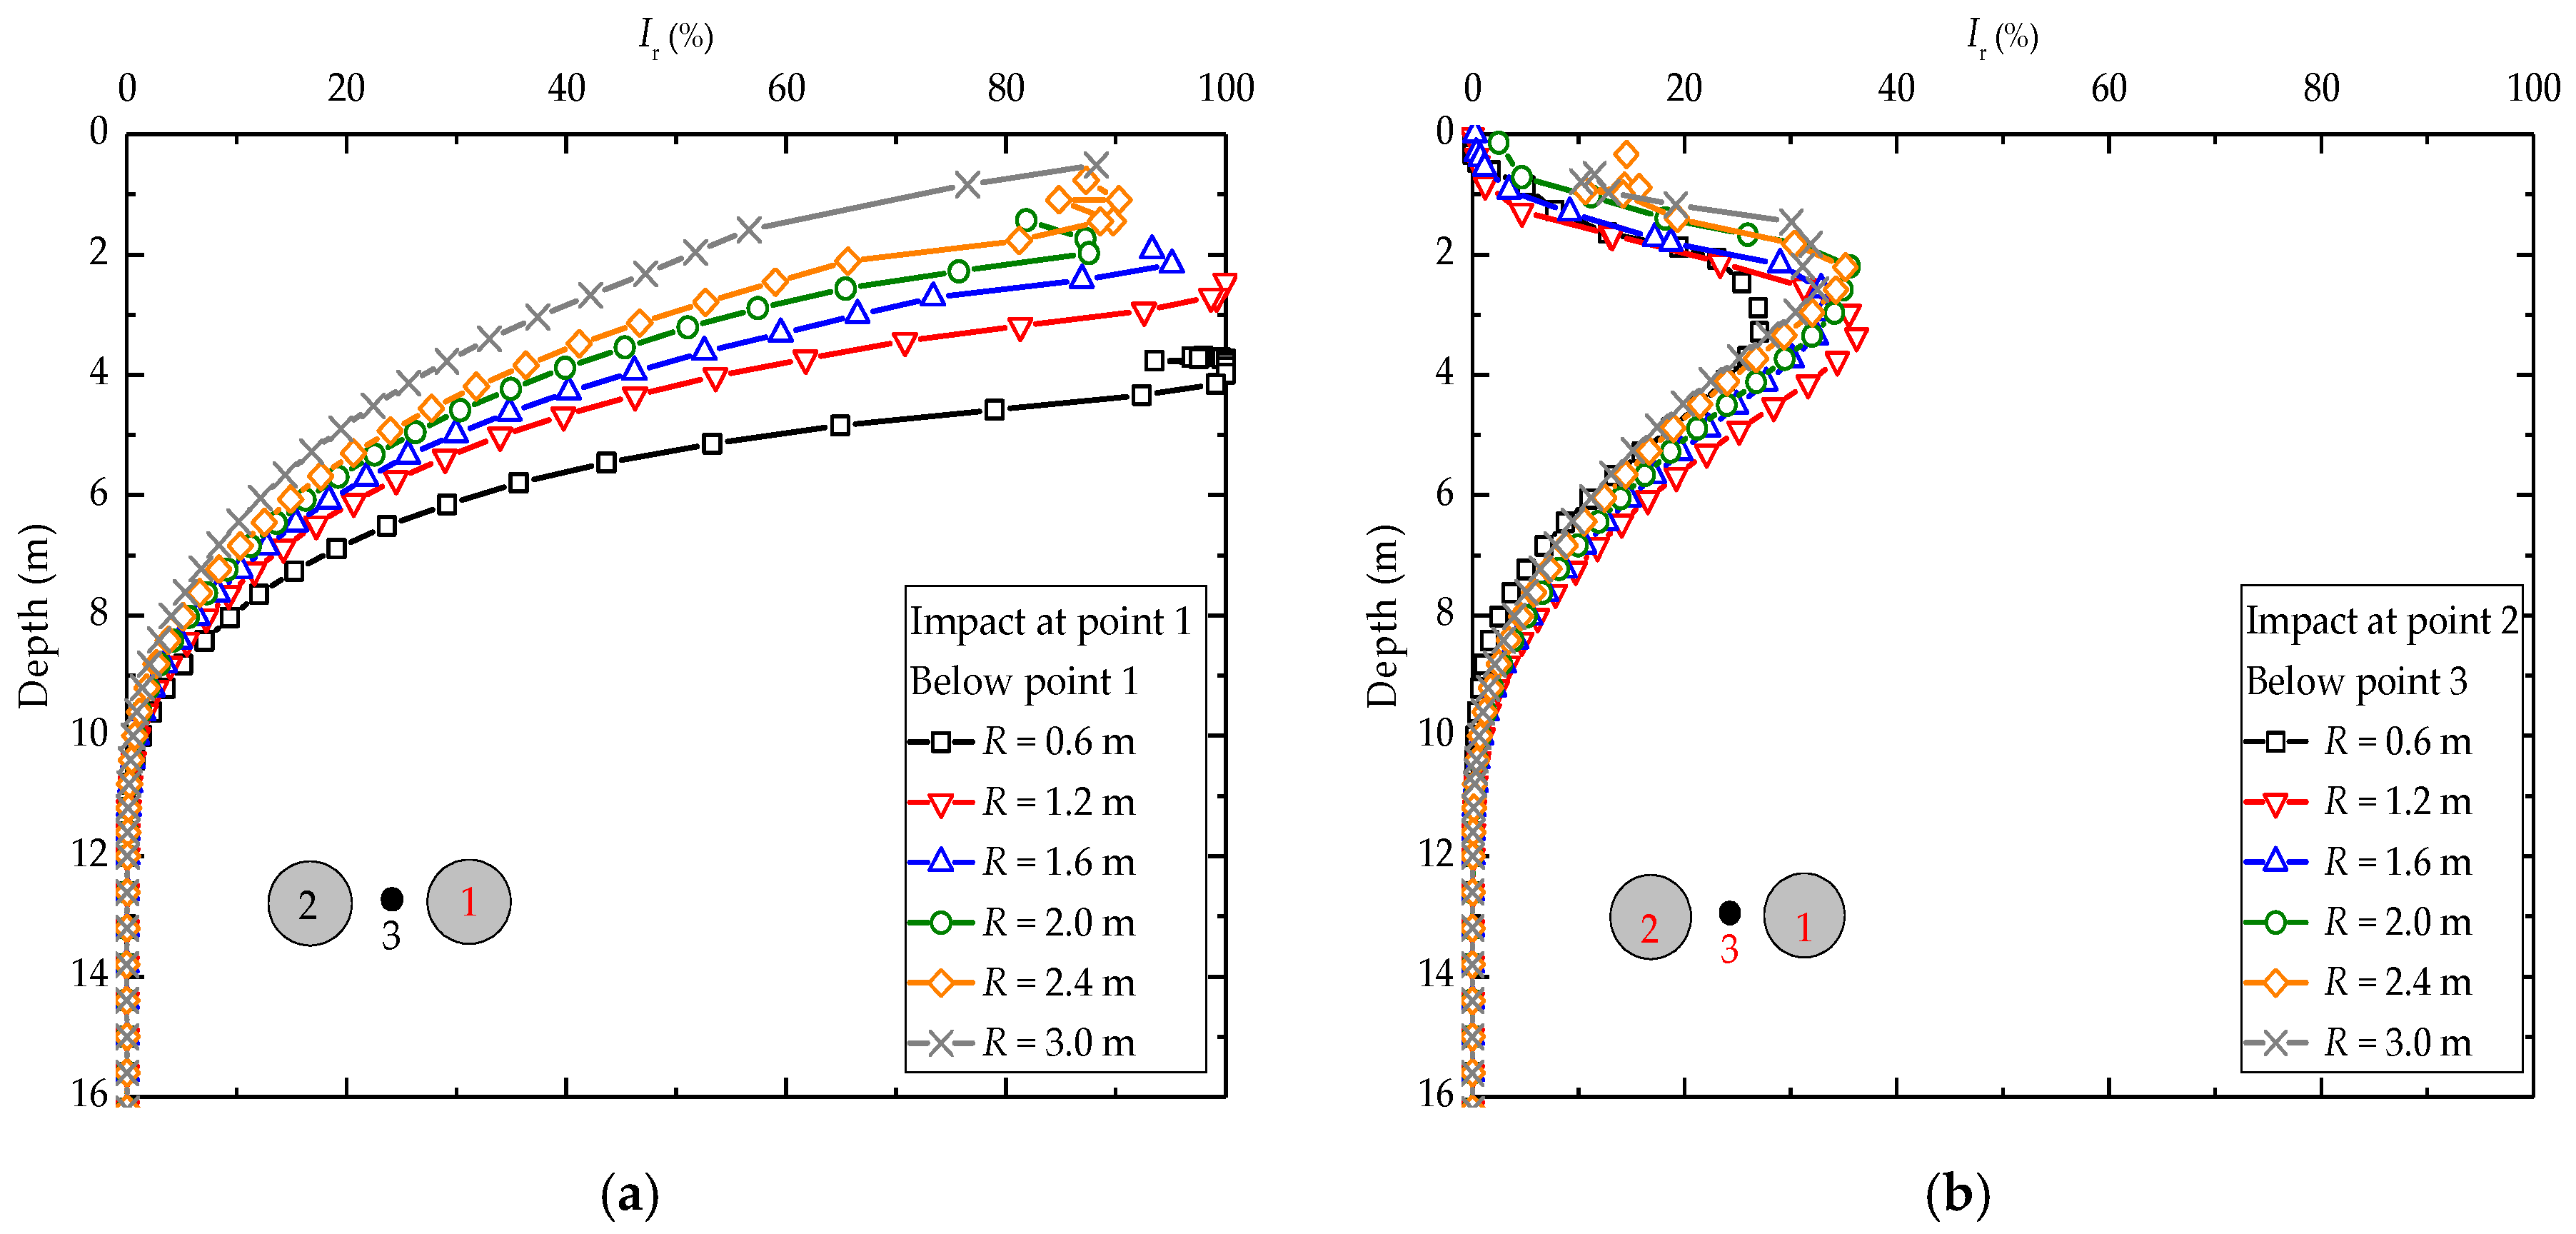
Figure 17.
Ir of soil versus depth for tamper radius: (a) below point 1; (b) below point 3.
Figure 17.
Ir of soil versus depth for tamper radius: (a) below point 1; (b) below point 3.
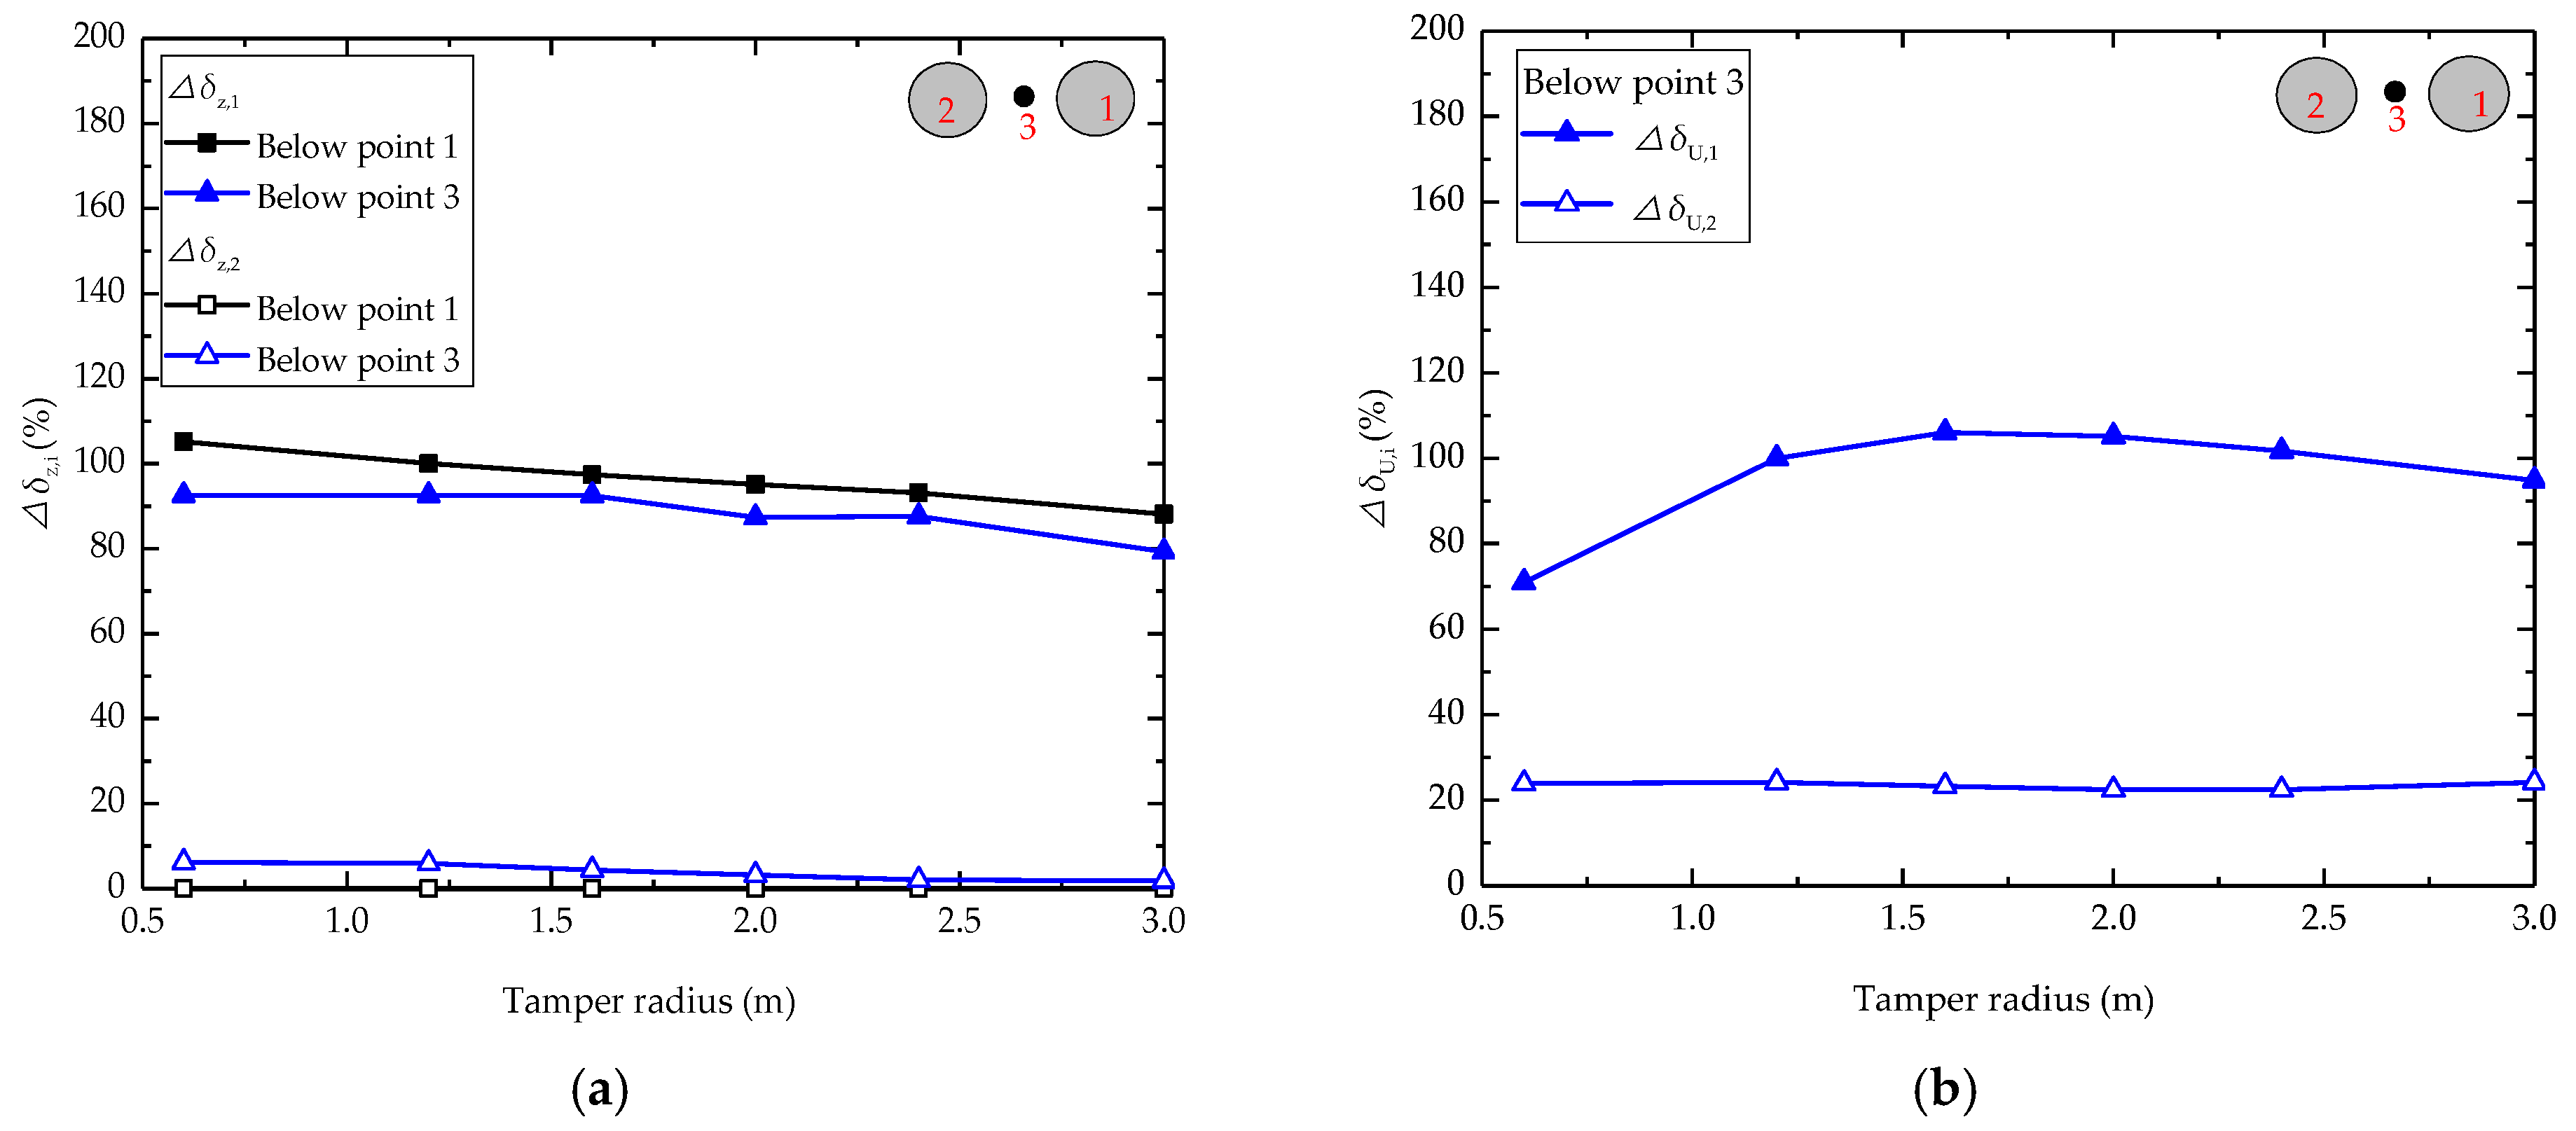
Figure 18.
Normalized indicators versus tamper radius: (a) △δz,i; (b) △δU,i.
Figure 18.
Normalized indicators versus tamper radius: (a) △δz,i; (b) △δU,i.
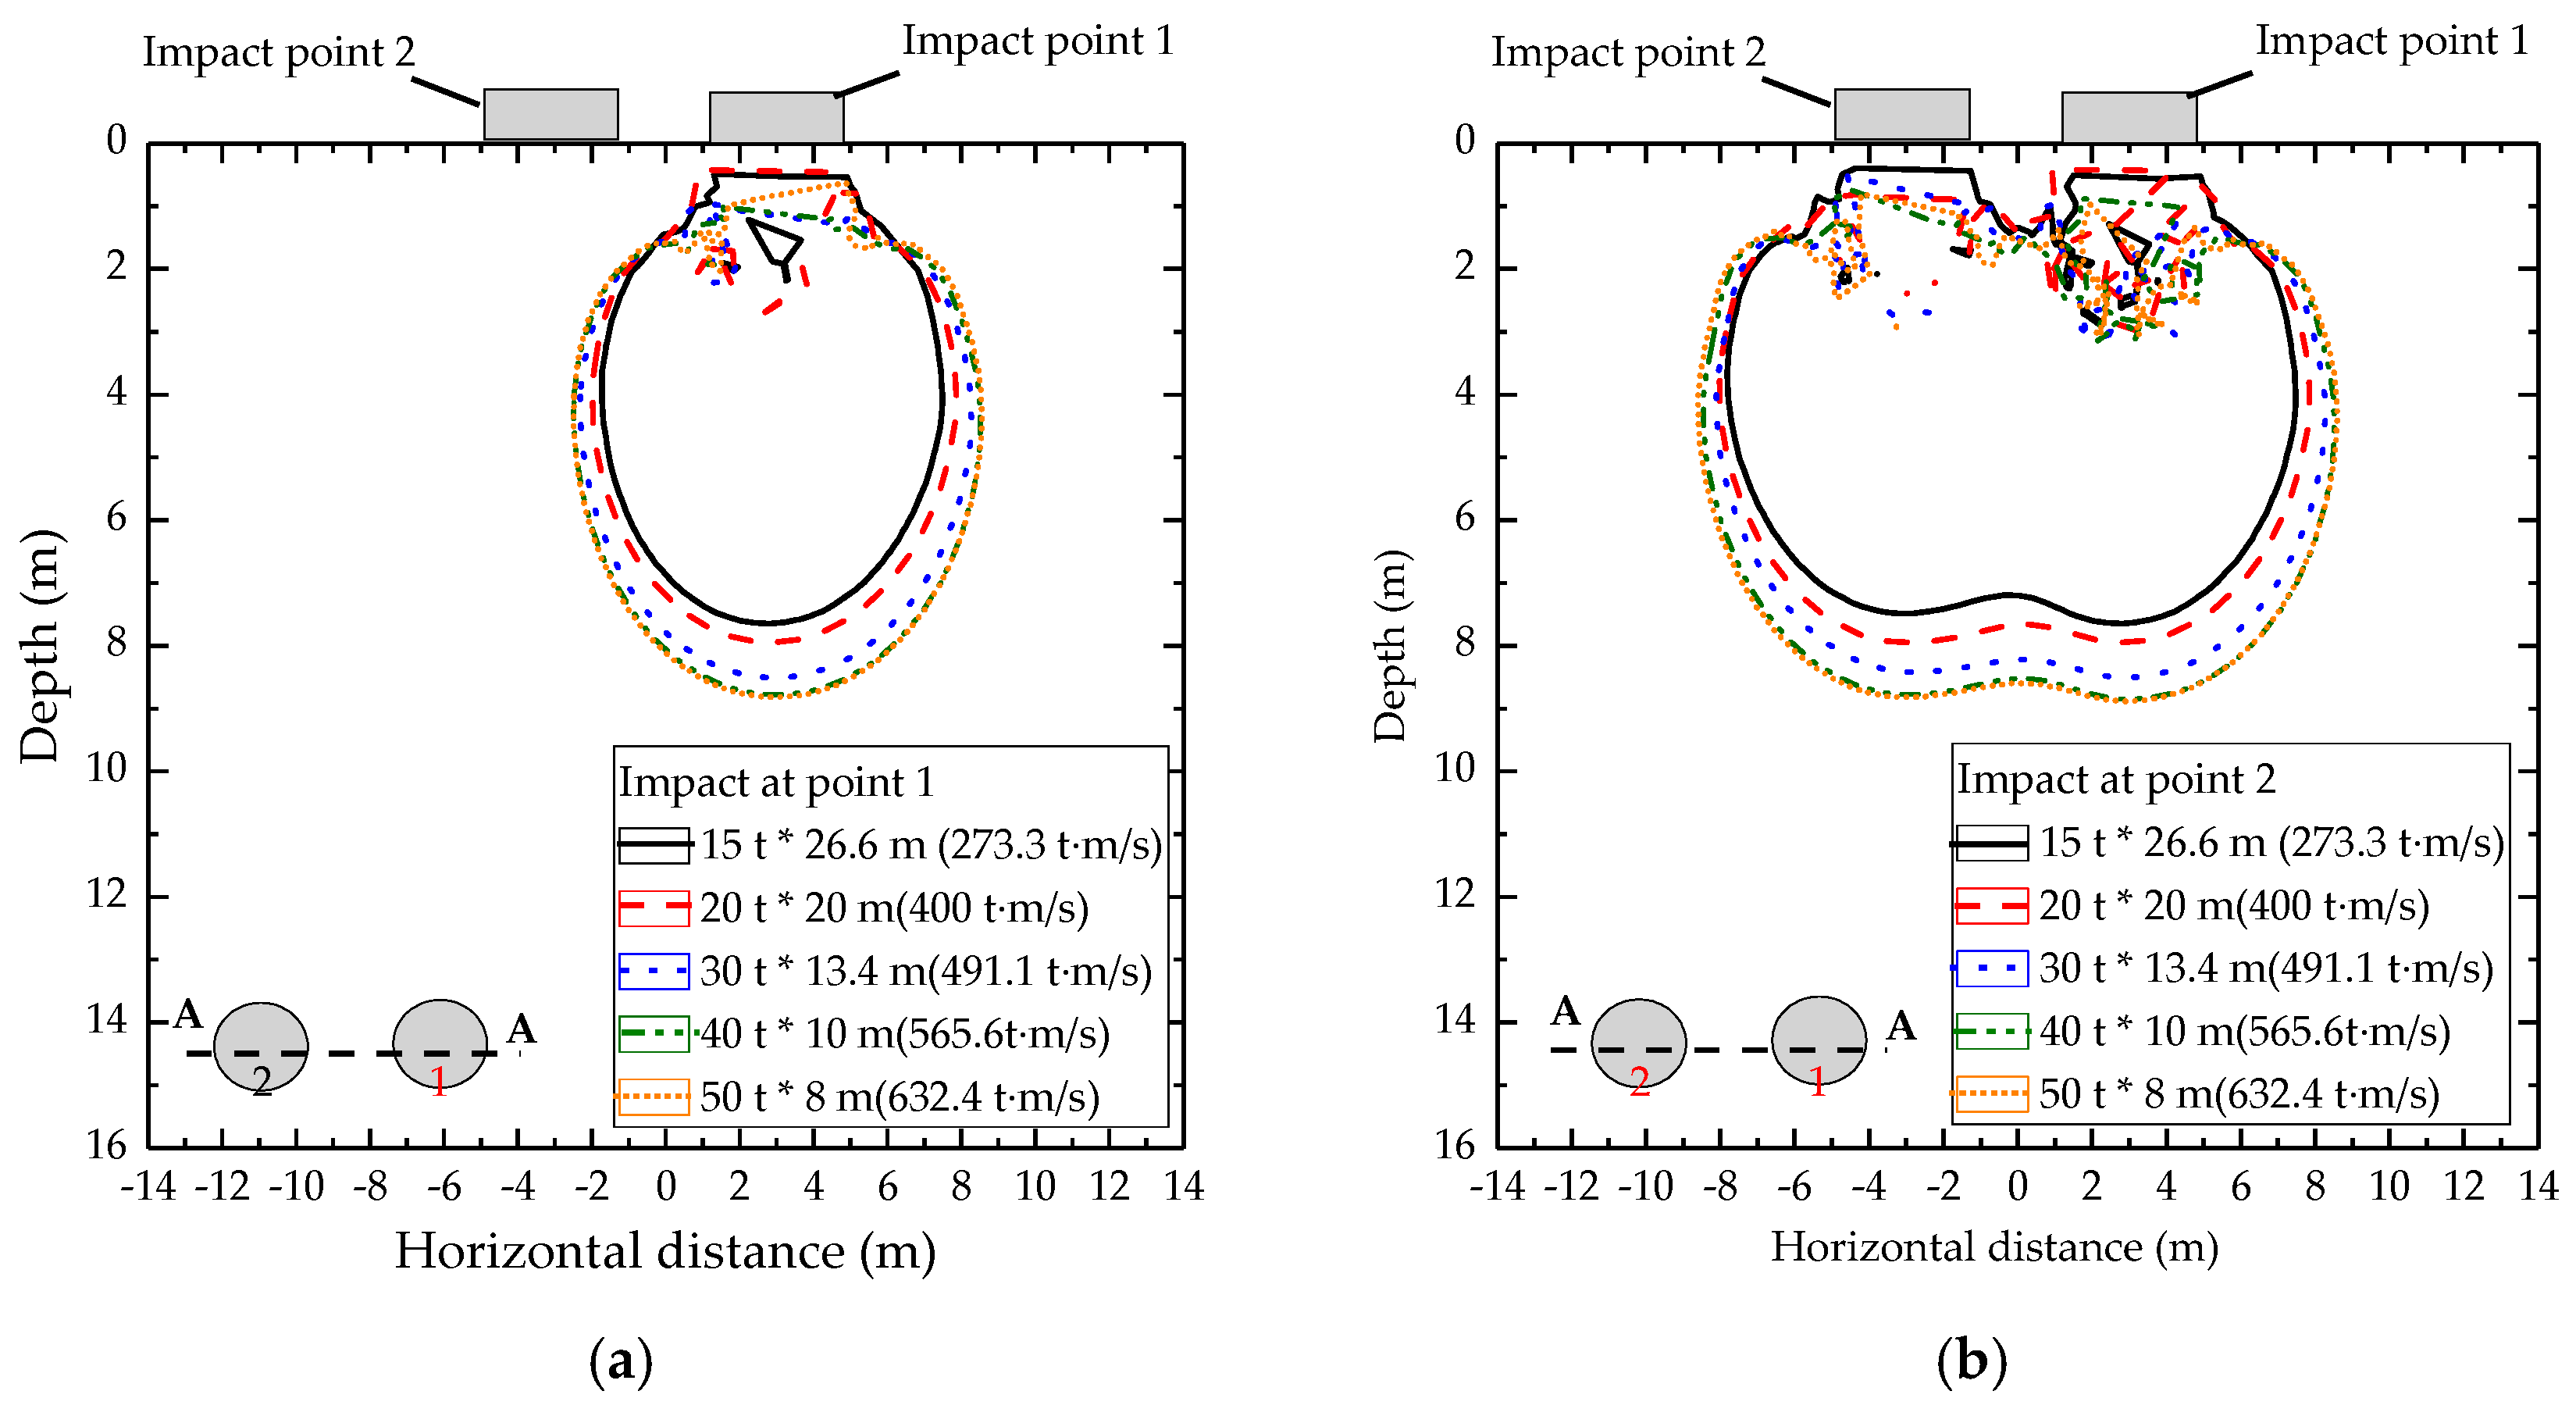
Figure 19.
The zone of Ir = 7.7% for different combinations of the tamper mass and the drop height: (a) impact at point 1; (b) impact at point 2.
Figure 19.
The zone of Ir = 7.7% for different combinations of the tamper mass and the drop height: (a) impact at point 1; (b) impact at point 2.
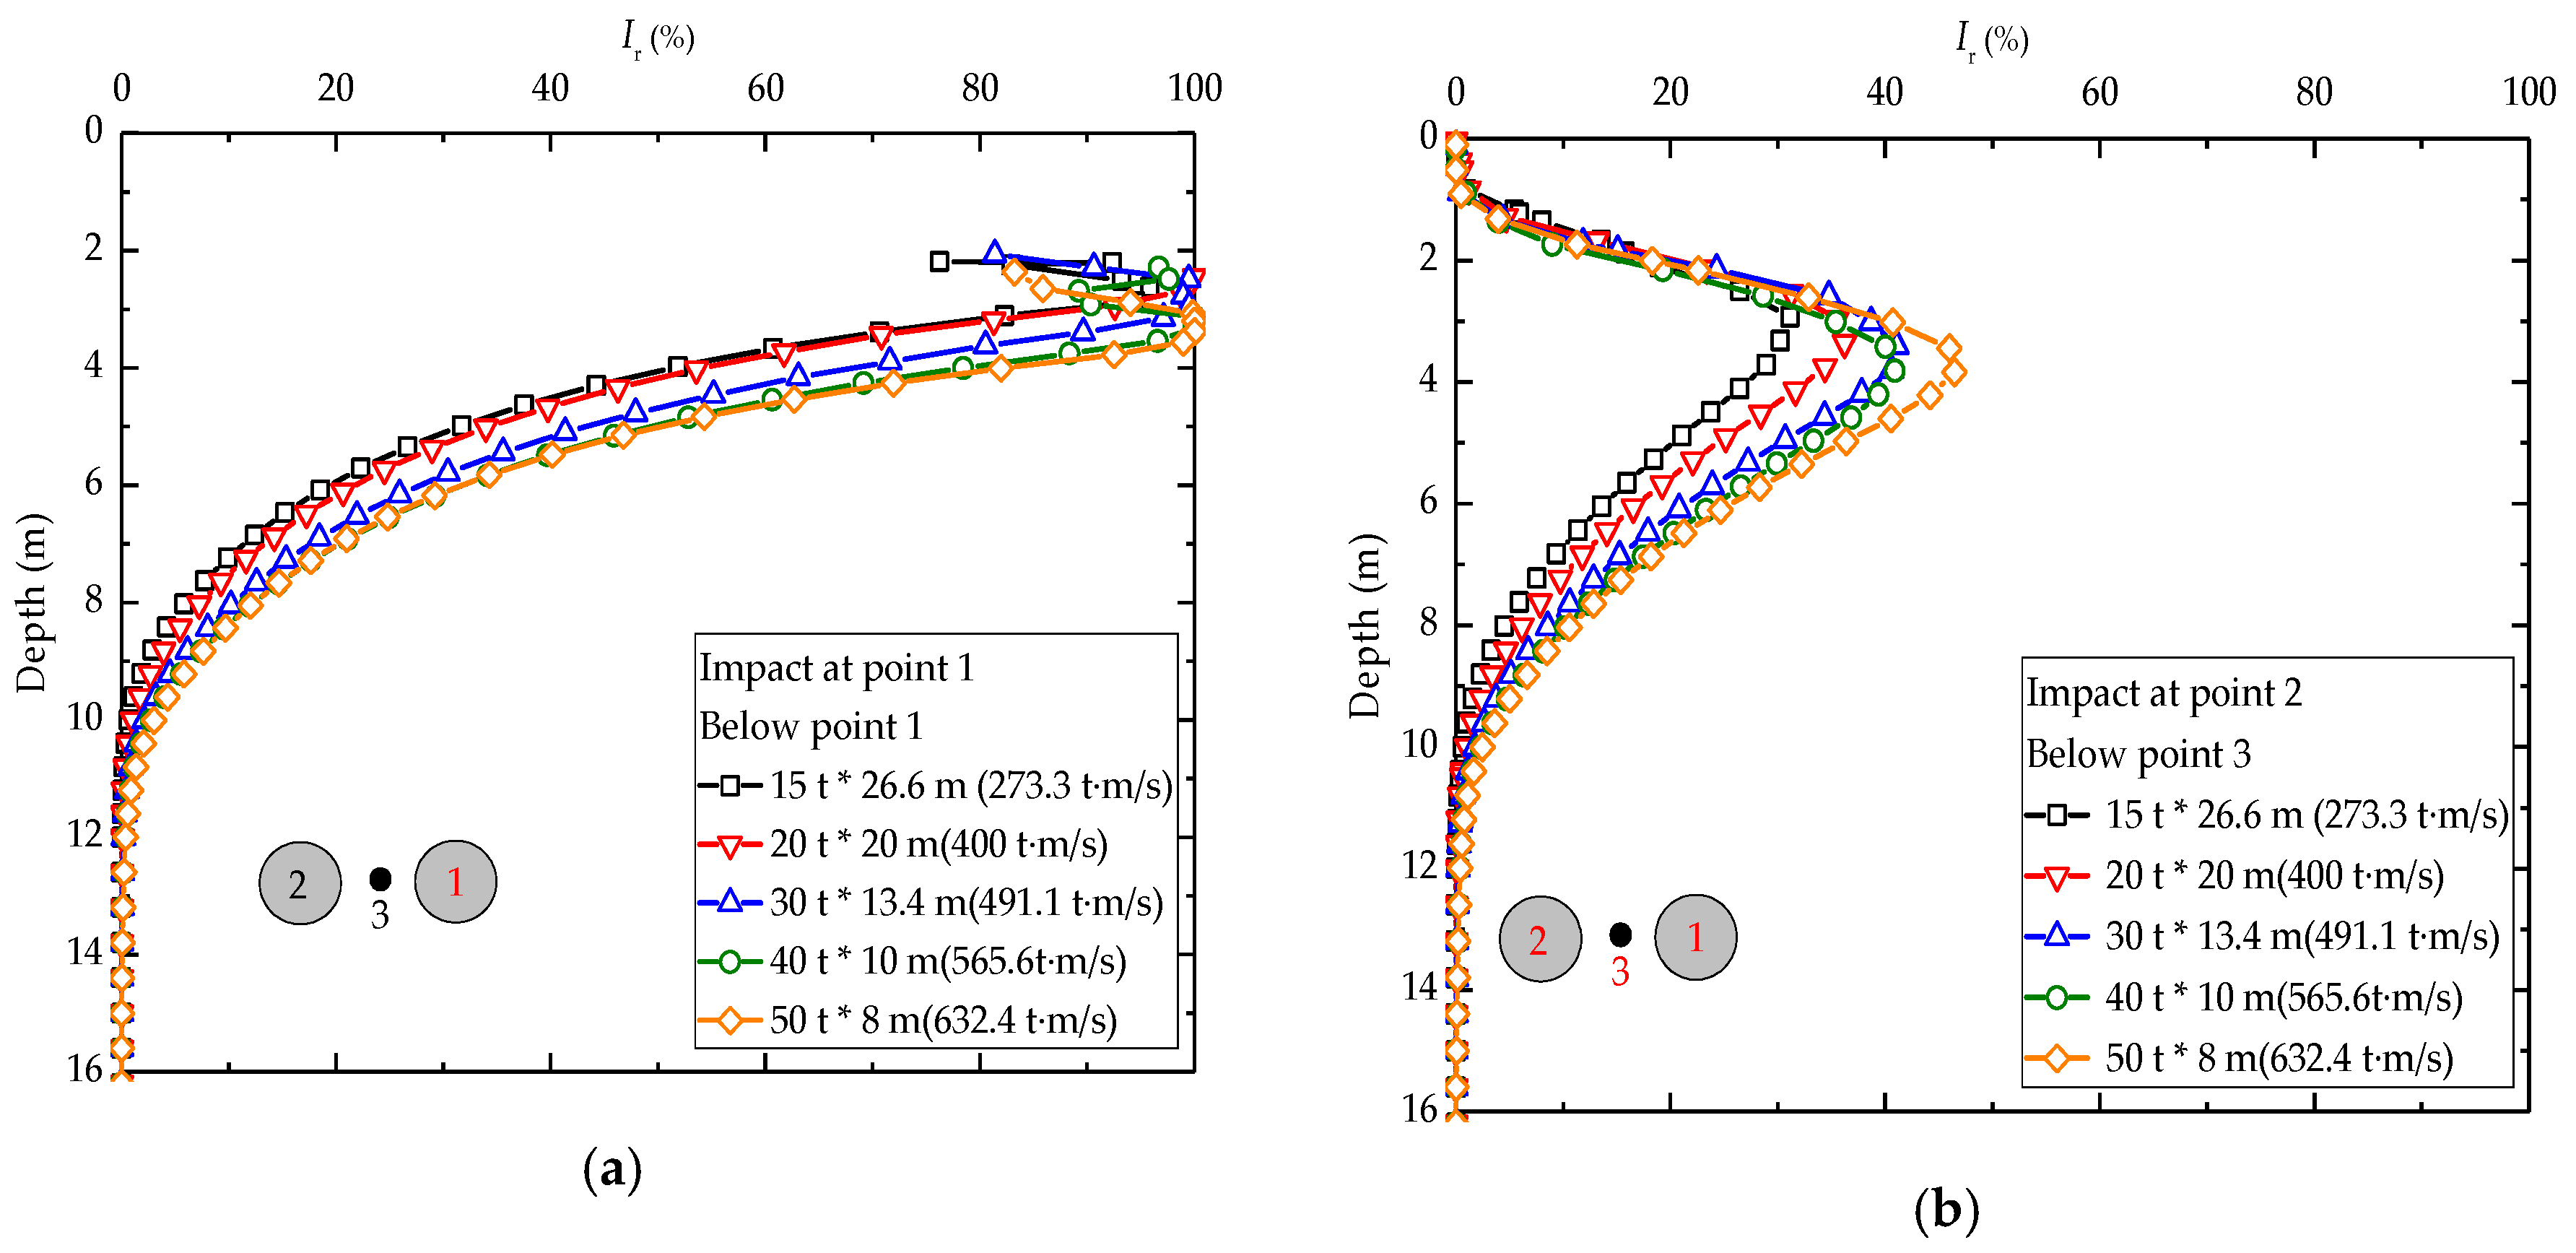
Figure 20.
Ir of soil versus depth for different combinations of the tamper mass and the drop height: (a) below point 1; (b) below point 3.
Figure 20.
Ir of soil versus depth for different combinations of the tamper mass and the drop height: (a) below point 1; (b) below point 3.
Figure 21.
Normalized indicators versus different combinations of the tamper mass and the drop height: (a) △δz,i; (b) △δU,i.
Figure 21.
Normalized indicators versus different combinations of the tamper mass and the drop height: (a) △δz,i; (b) △δU,i.
Figure 22.
The sensitivity analysis for the multipoint tamping: (a) δz,2; (b) δU,2; (c) δA,2.
Figure 22.
The sensitivity analysis for the multipoint tamping: (a) δz,2; (b) δU,2; (c) δA,2.
Figure 23.
Schematic diagram of DC: (a) below point 1; (b) below point 3.
Figure 23.
Schematic diagram of DC: (a) below point 1; (b) below point 3.
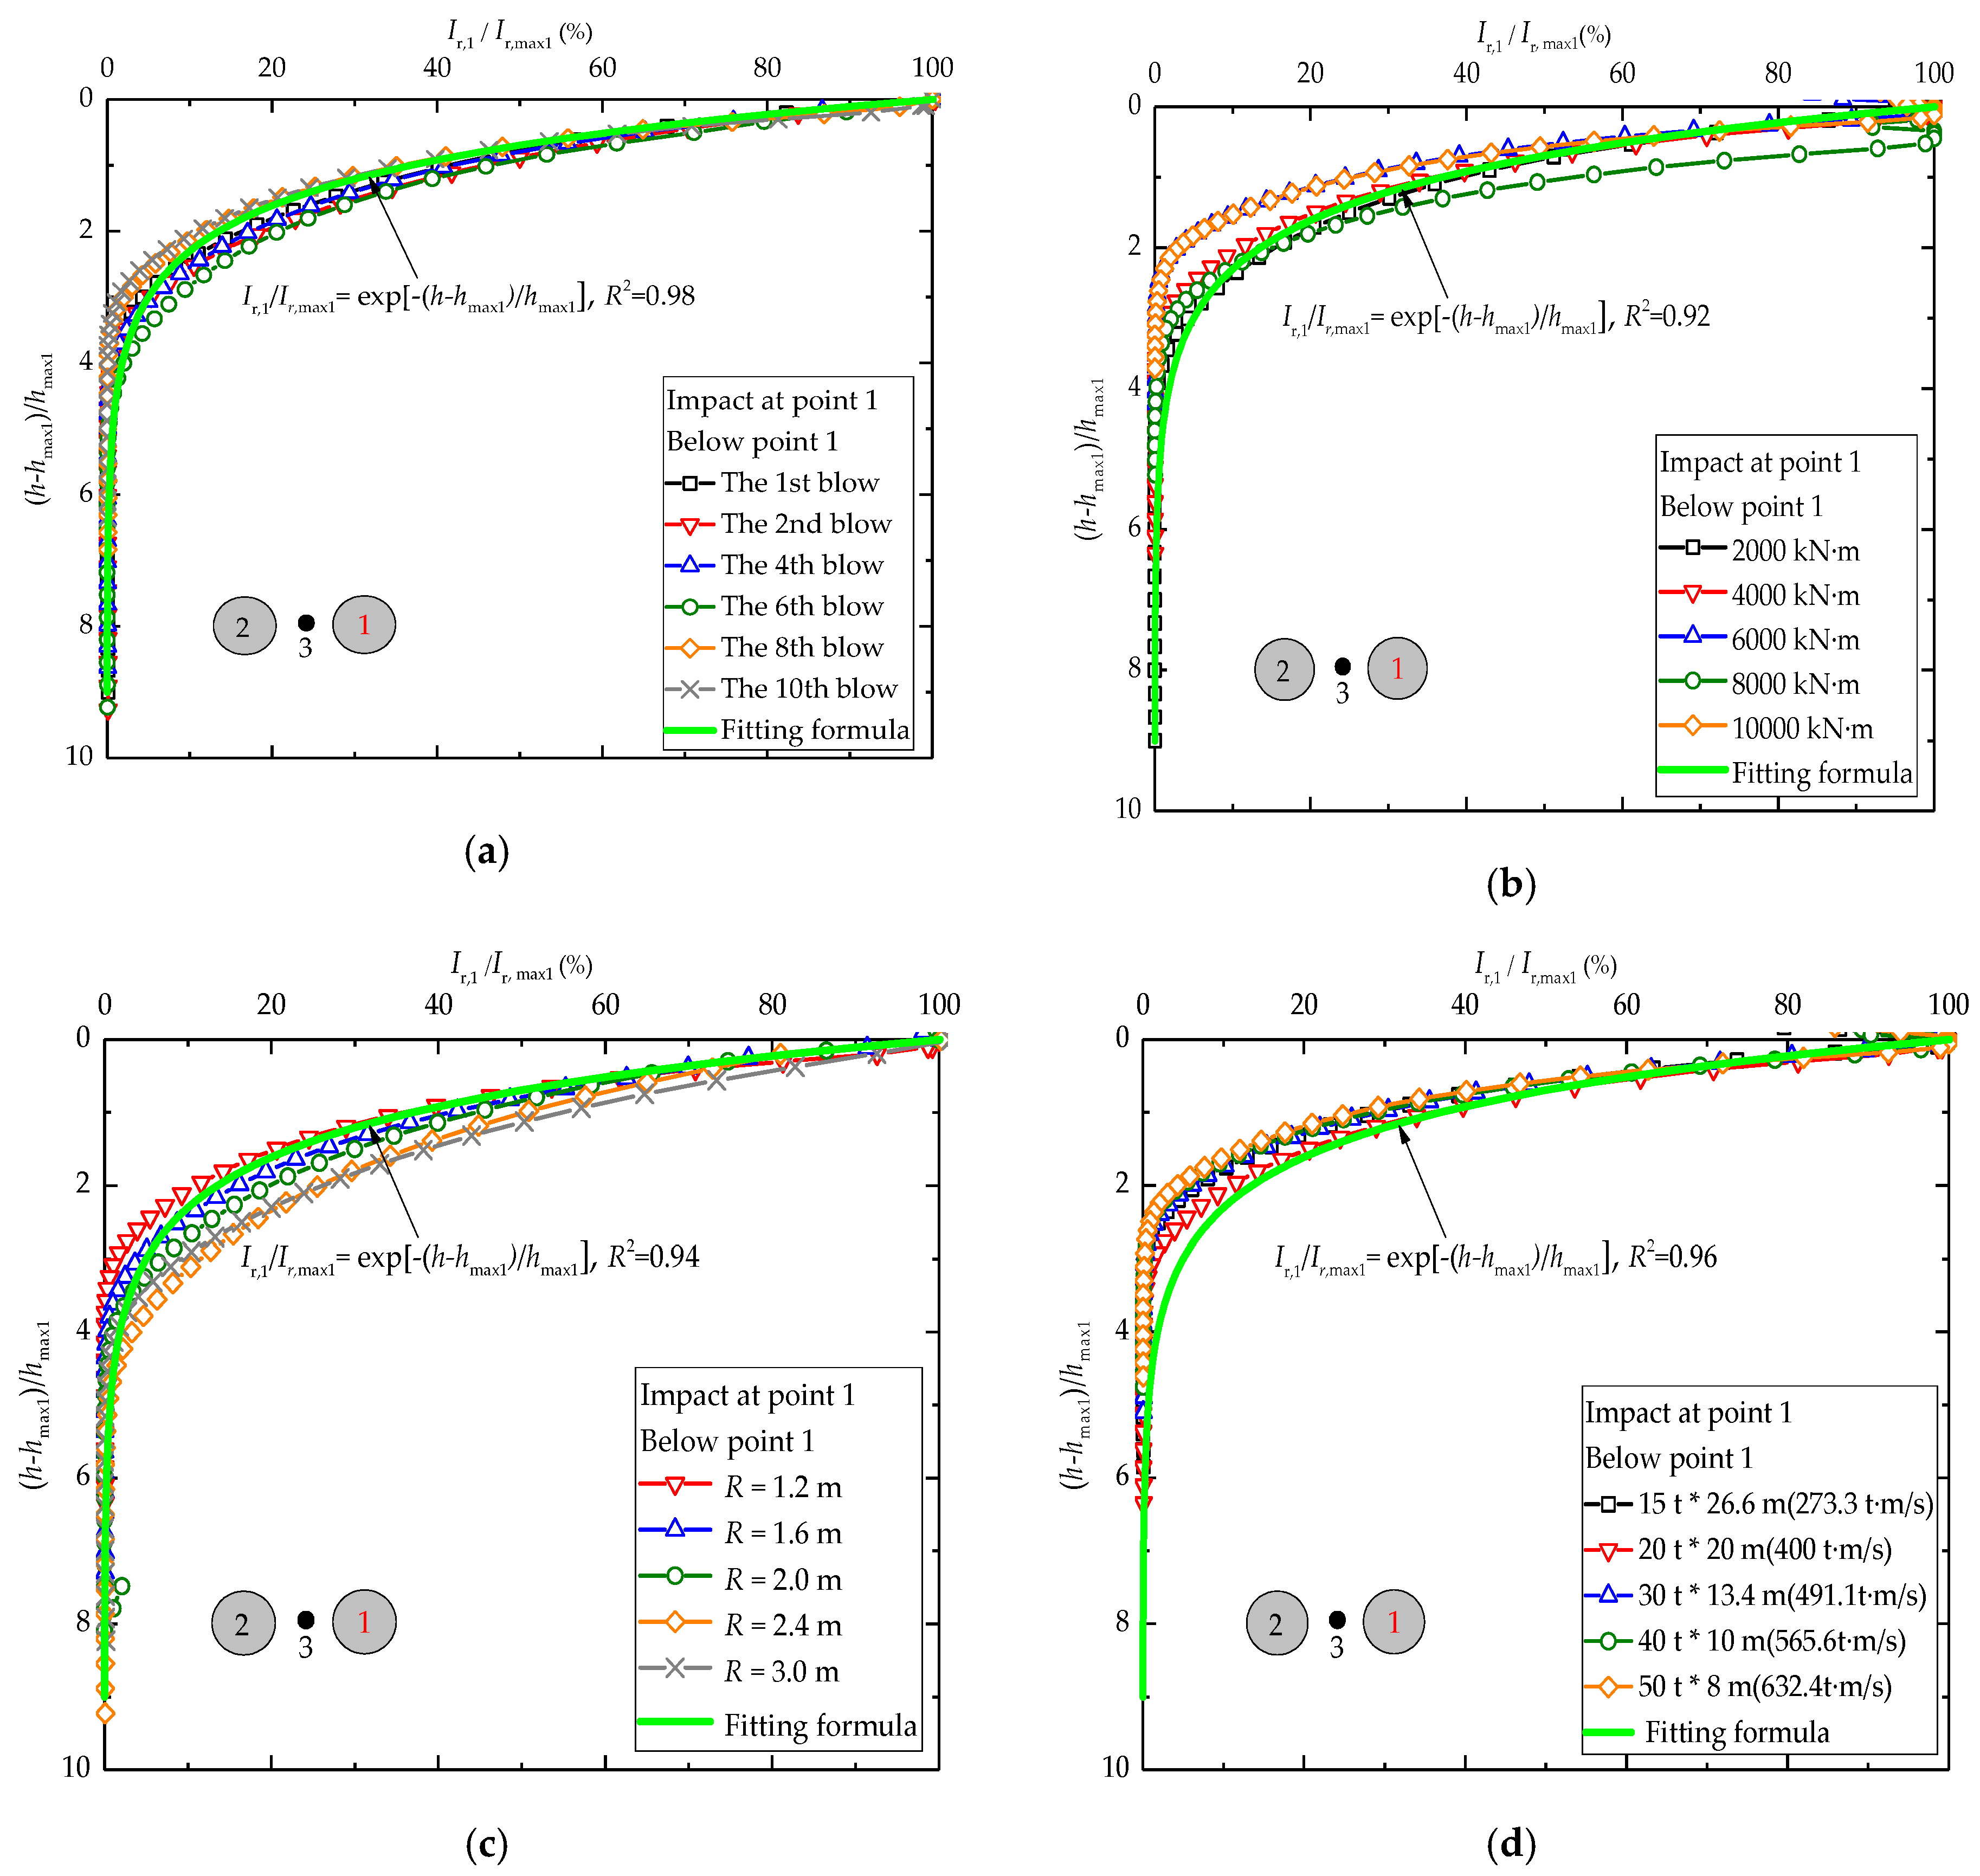
Figure 24.
Normalized Ir,1/Ir, max1 (%) and (h-hmax1)/hmax1 for construction parameter: (a) drop number; (b) drop energy; (c) tamper radius; (d) drop momentum.
Figure 24.
Normalized Ir,1/Ir, max1 (%) and (h-hmax1)/hmax1 for construction parameter: (a) drop number; (b) drop energy; (c) tamper radius; (d) drop momentum.
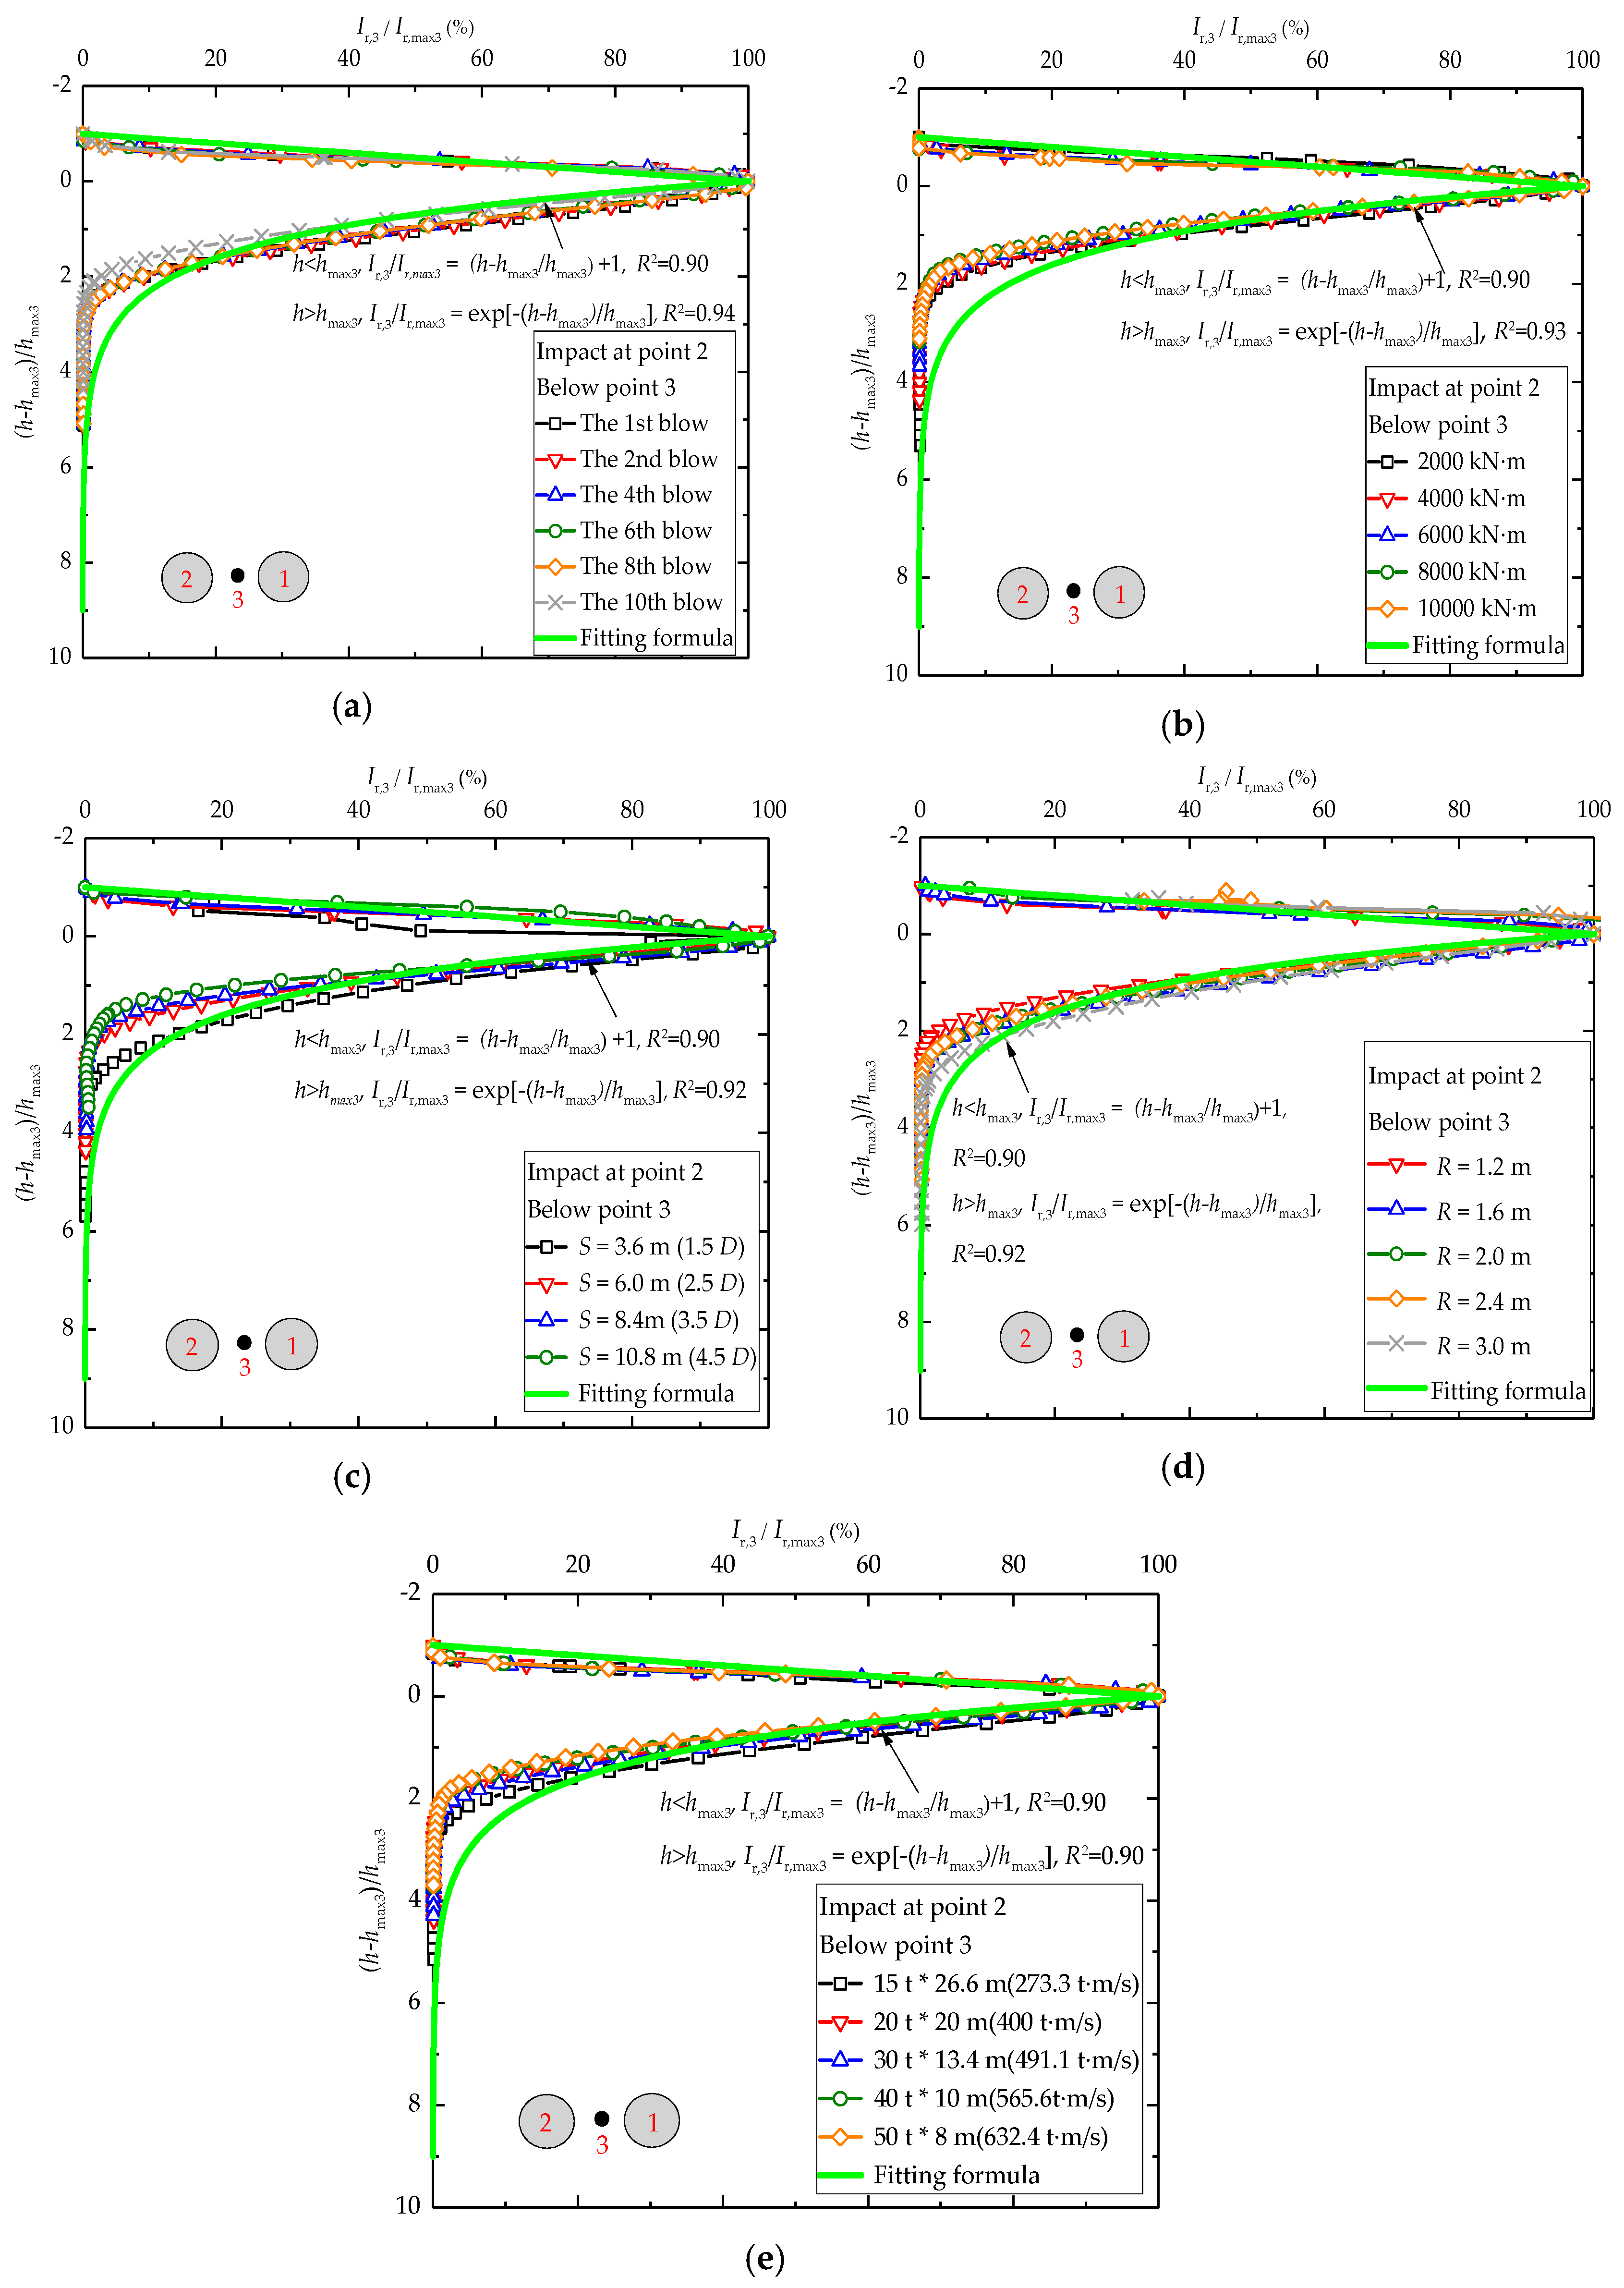
Figure 25.
Normalized Ir,3/Ir, max3 (%) and (h-hmax3)/hmax3 for construction parameter: (a) drop number; (b) drop energy; (c) tamping distance; (d) tamper radius; (e) drop momentum.
Figure 25.
Normalized Ir,3/Ir, max3 (%) and (h-hmax3)/hmax3 for construction parameter: (a) drop number; (b) drop energy; (c) tamping distance; (d) tamper radius; (e) drop momentum.
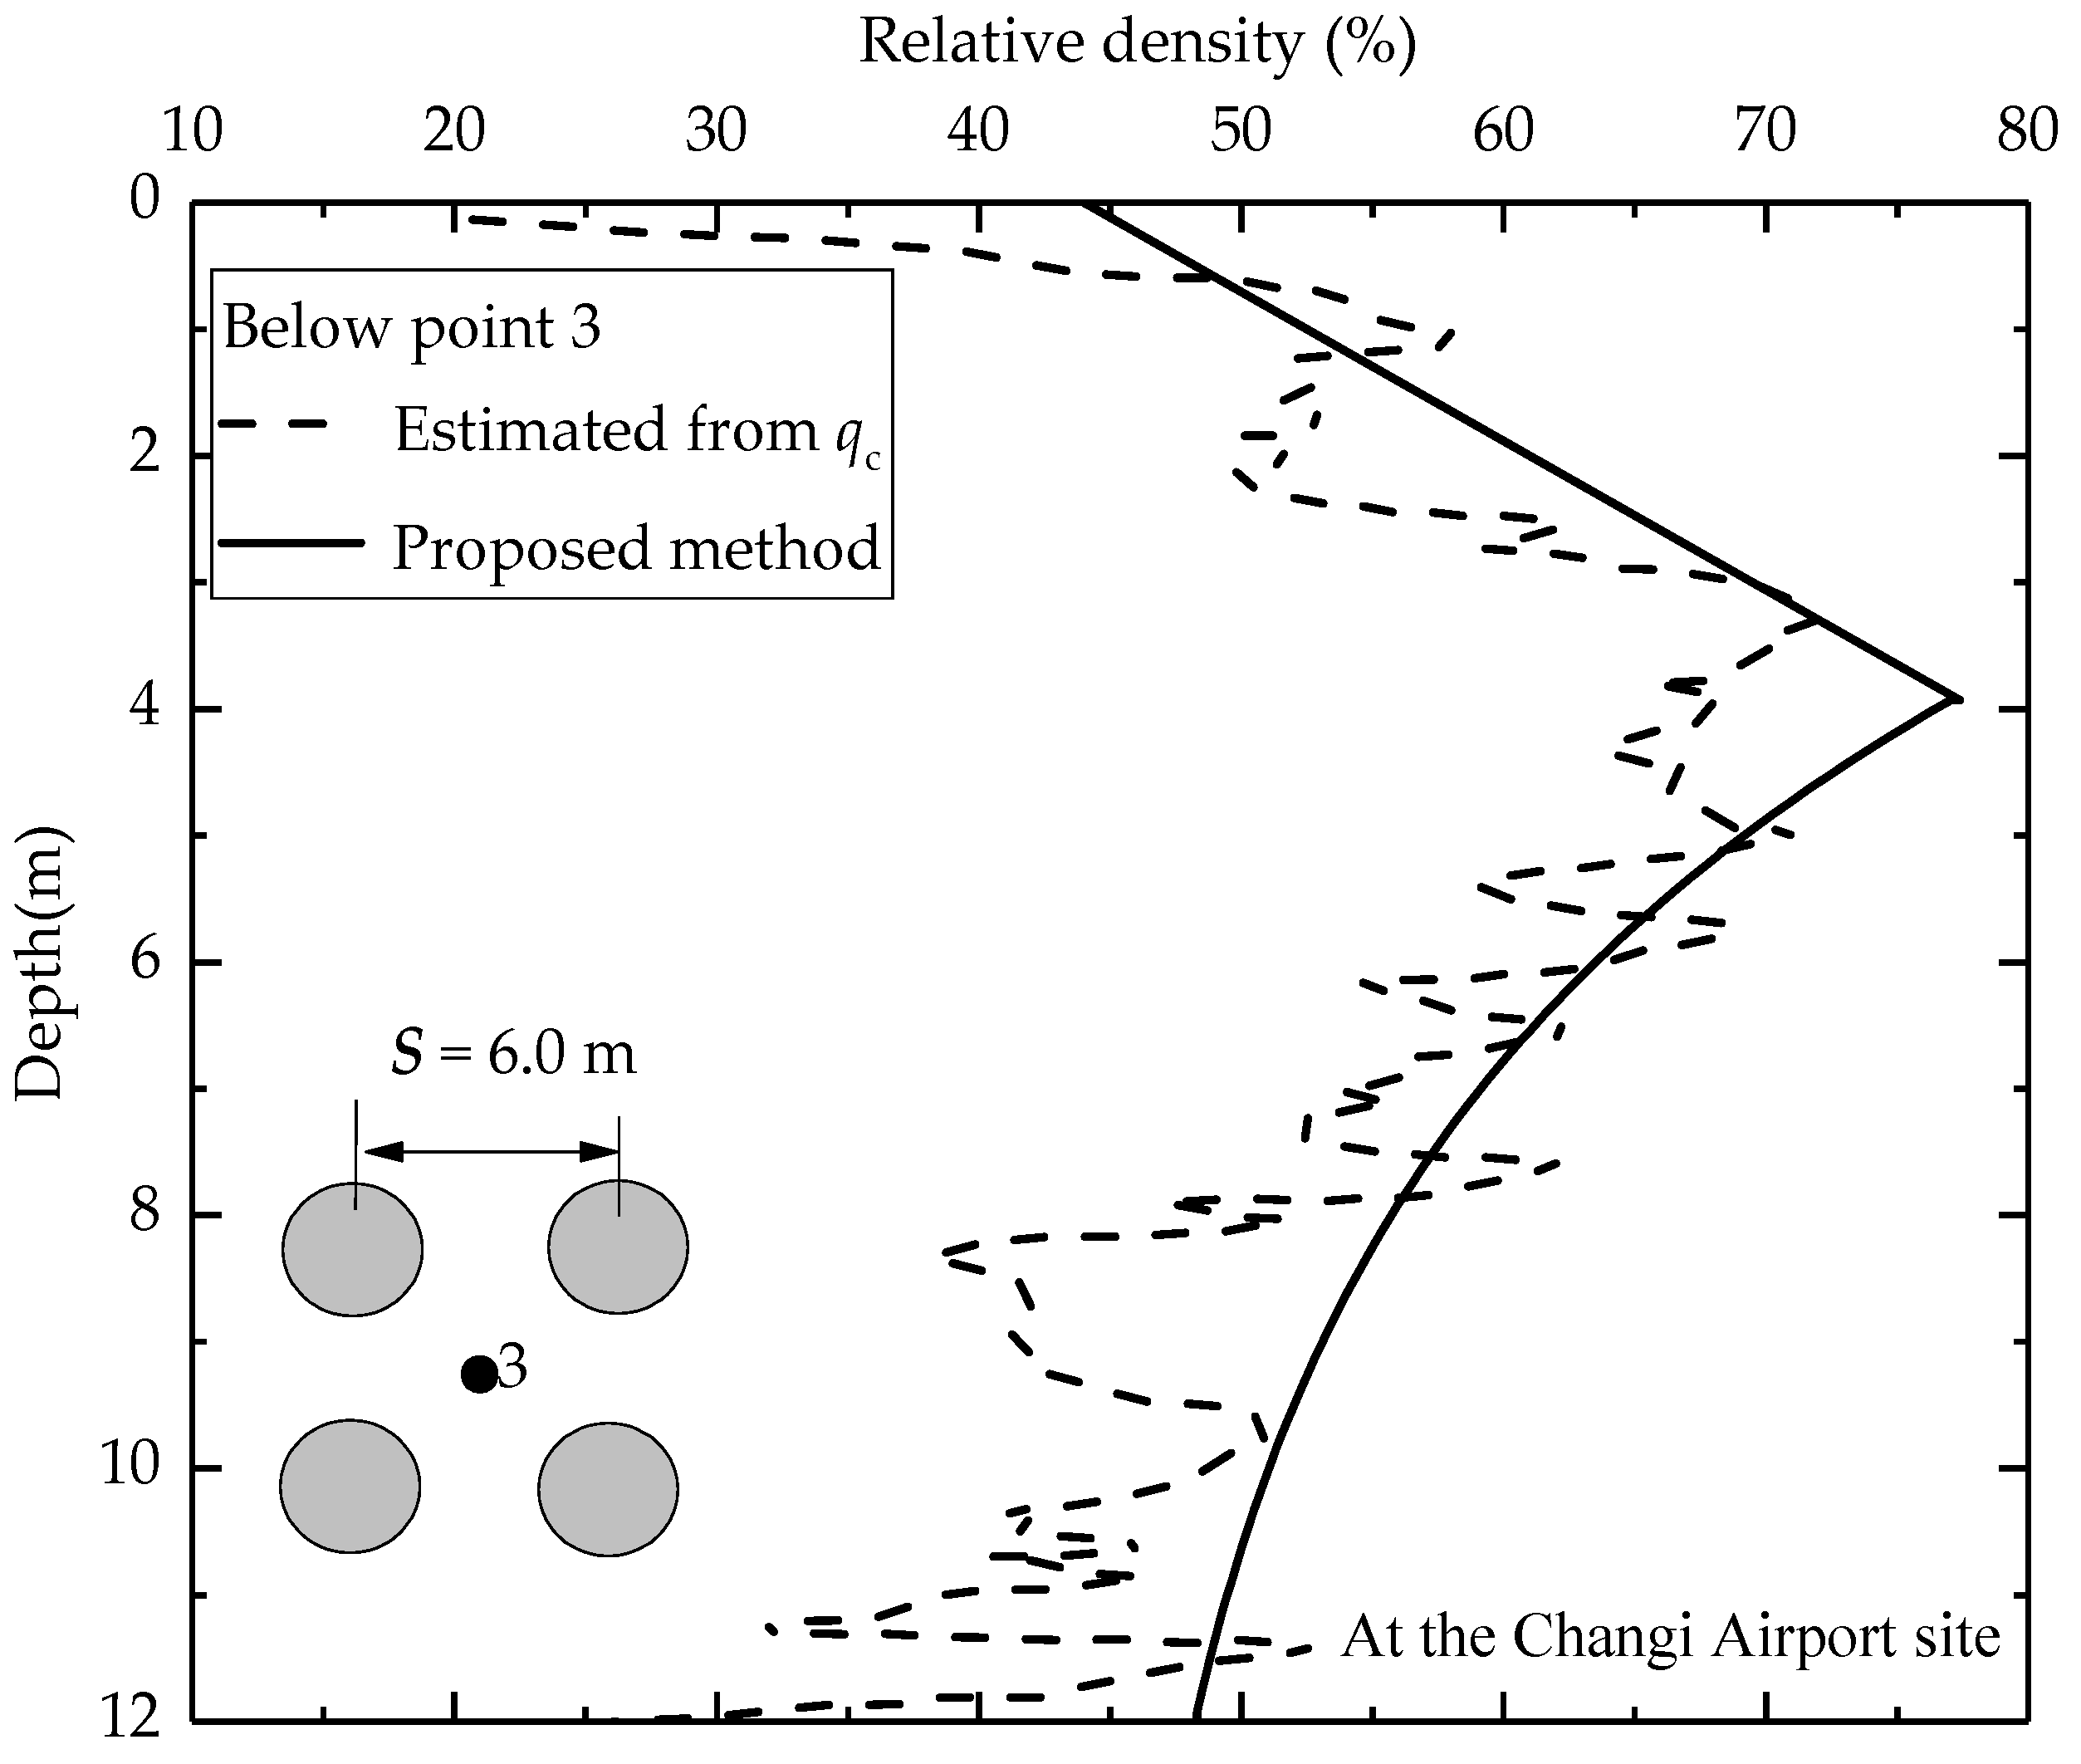
Figure 26.
Measured relative density and estimated relative density in the center of the square of tamping.
Figure 26.
Measured relative density and estimated relative density in the center of the square of tamping.
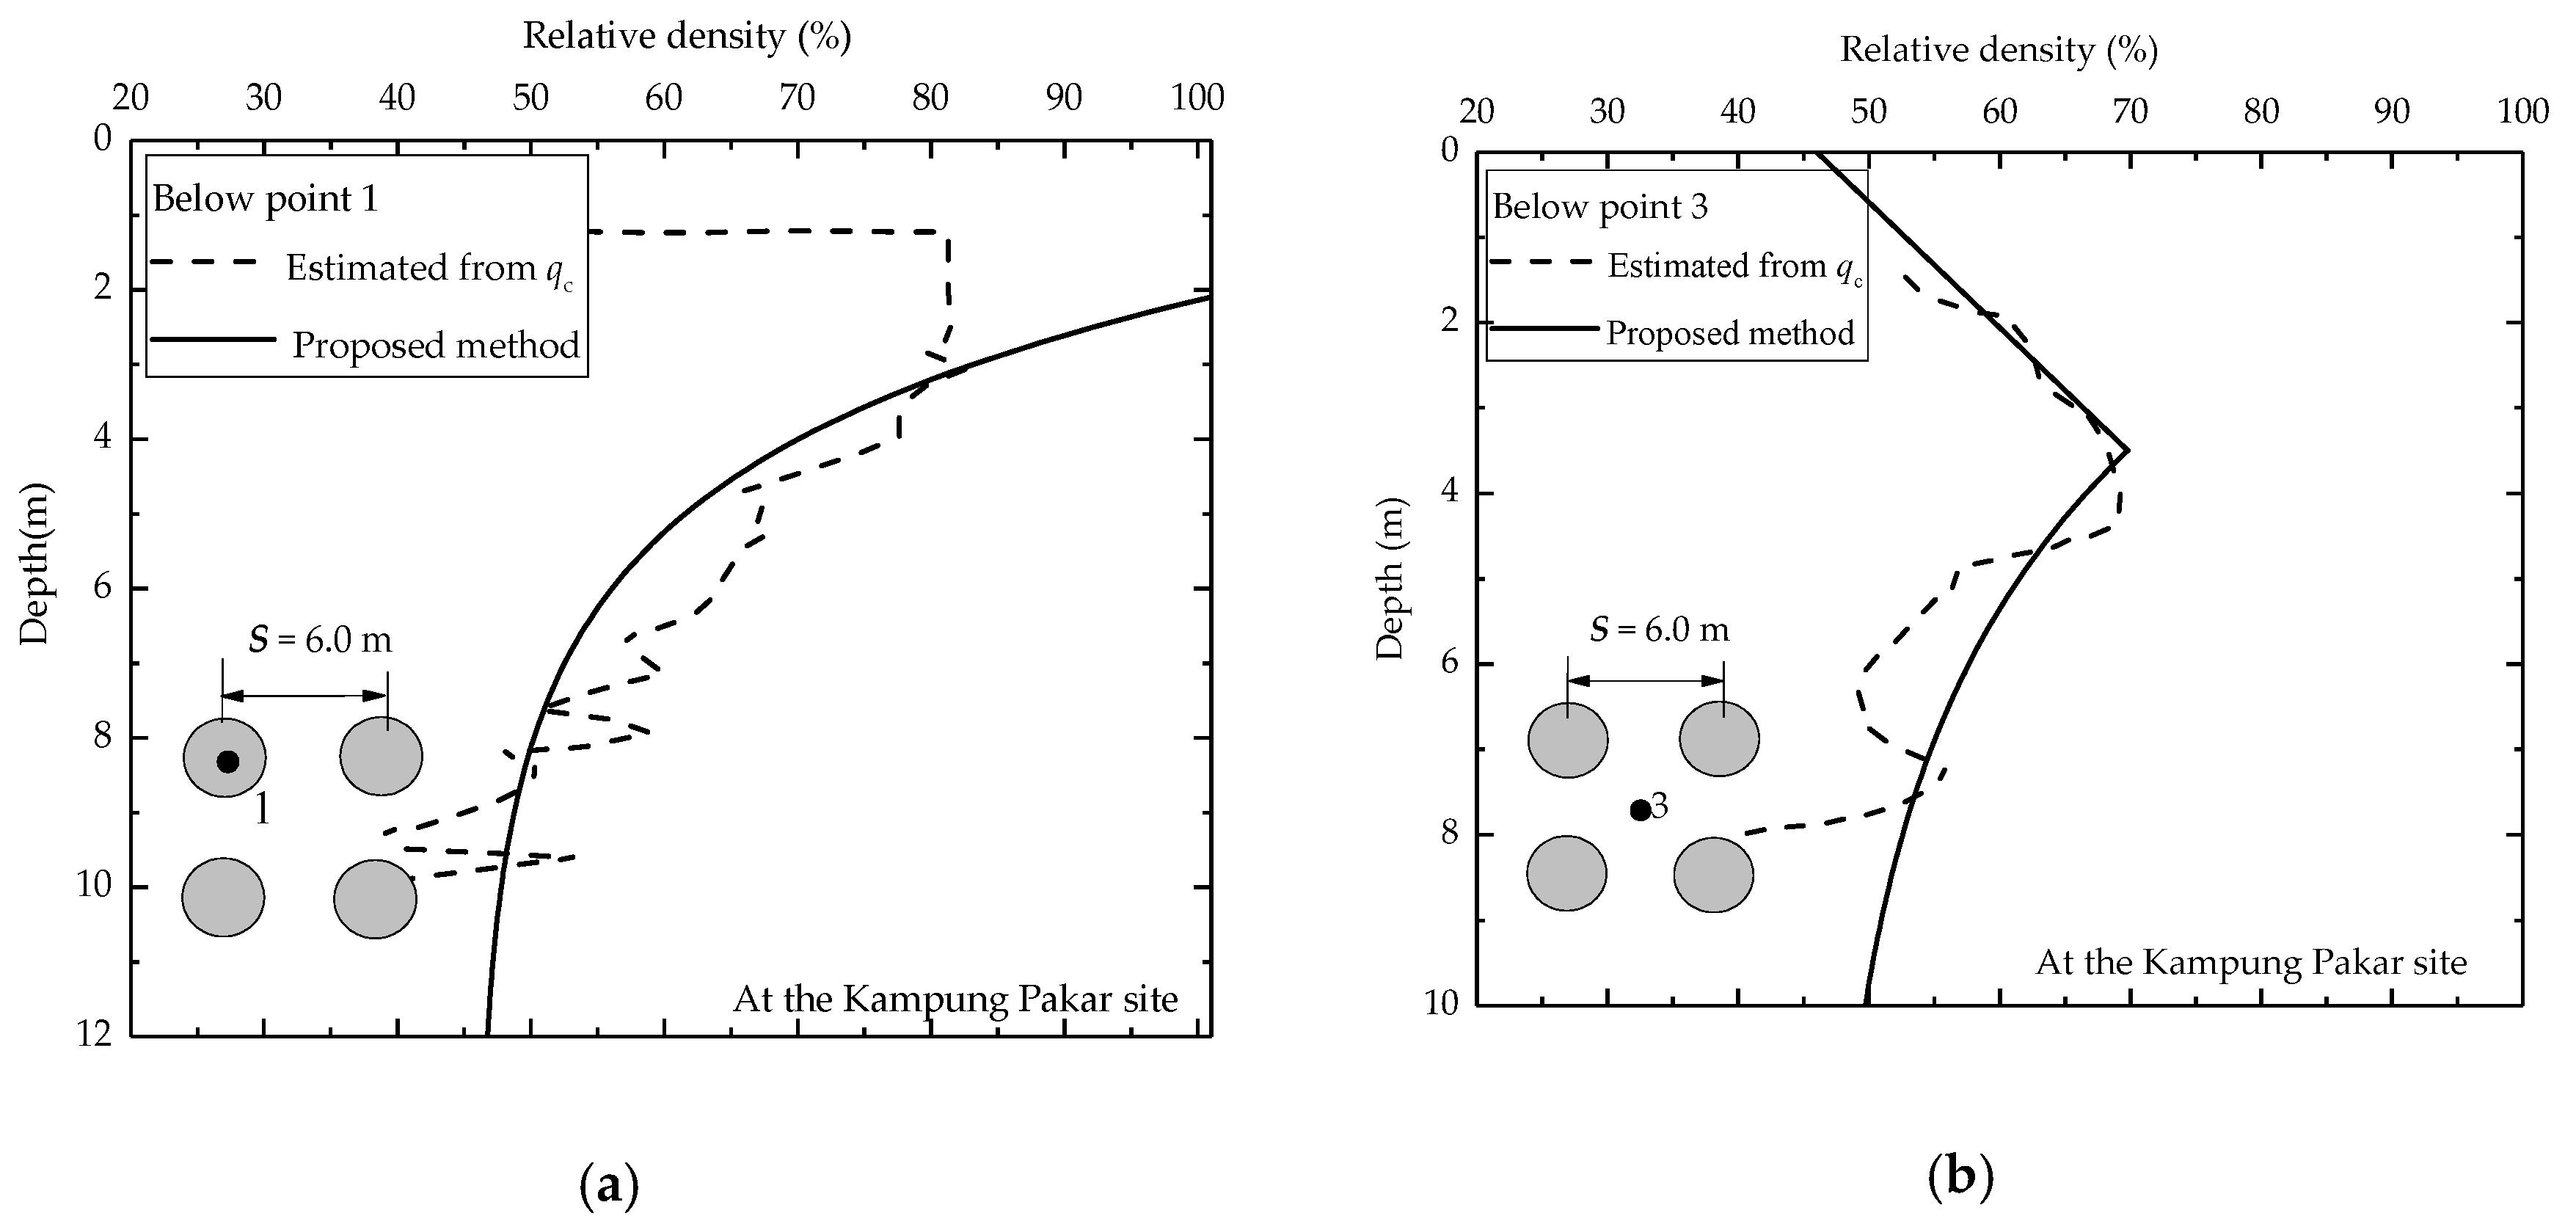
Figure 27.
Measured relative density and estimated relative density: (a) below point 1; (b) in the center of the square of tamping.
Figure 27.
Measured relative density and estimated relative density: (a) below point 1; (b) in the center of the square of tamping.
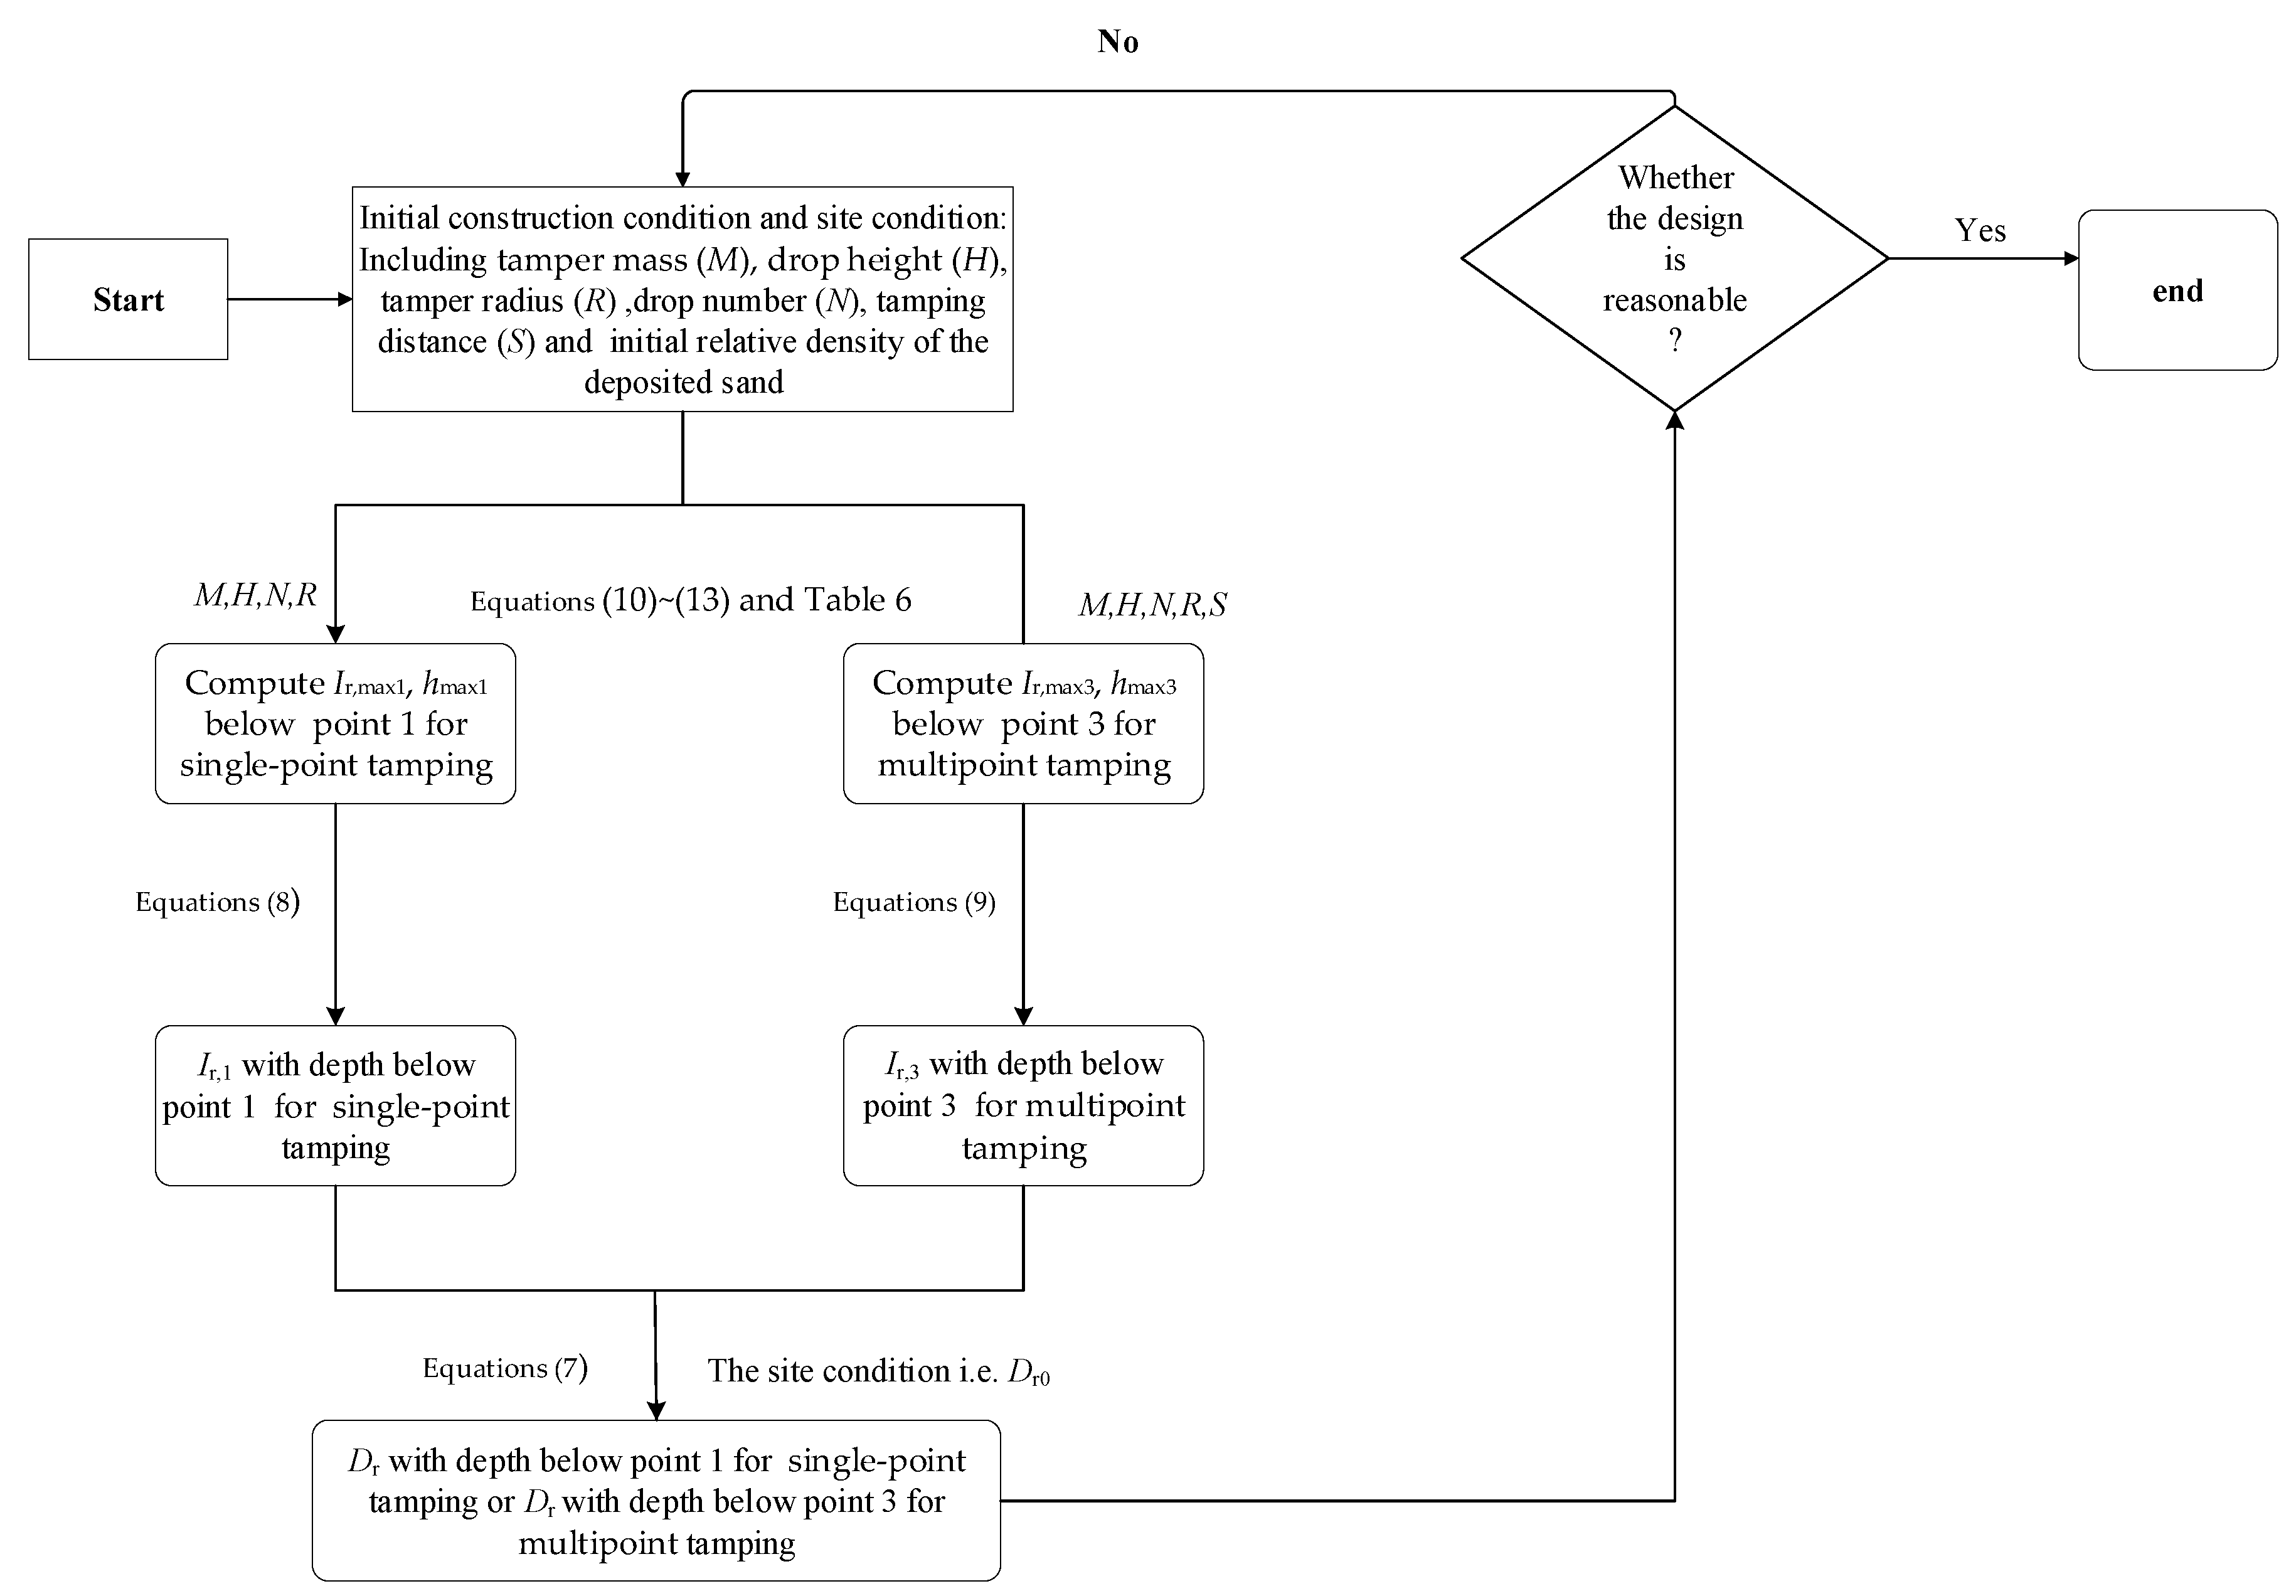
Figure 28.
Flow chart of the estimation method for dynamic compaction (DC) of granular soils.
Figure 28.
Flow chart of the estimation method for dynamic compaction (DC) of granular soils.
Table 1.
Parameters of the cap model.
Table 1.
Parameters of the cap model.
| Coordinate System | c′ (kPa) | φ′ | R | W′
| D′ (m2/kN) | η | κ |
|---|
| p′-q | 0 | 30.0° | 0.83 | 0.4 | 1.8 × 10⁻⁴ | 120 | 0.0134 |
Table 2.
Typical hardening parameters for granular soils.
Table 2.
Typical hardening parameters for granular soils.
| Case Number | ρs (kg/m3) | W′
| D′ (m2/kN) | Dense Degree |
|---|
| 1 | 1500 | 0.4 | 2.2 × 10⁻⁴ | Loose |
| 2 | 1500 | 0.4 | 1.8 × 10⁻⁴ | Slightly dense |
| 3 | 1500 | 0.22 | 3.0 × 10⁻⁵ | Medium dense |
| 4 | 1500 | 0.18 | 1.0 × 10⁻⁶ | Dense |
Table 3.
Summary of operational parameters in the simulation.
Table 3.
Summary of operational parameters in the simulation.
| Case Number | Drop Energy, M × H (kN·m) | Tamper Mass, M (tons) | Drop Height, H (m) | Drop Number, (N) | Tamper Diameter, D (m) | Tamping Distance, S (m) |
|---|
| 1 | 2000 | 10 | 20 | 10 | 2.4 | 6.0 (2.5 D) |
| 2 | 4000 | 20 | 20 | 10 | 2.4 | 6.0 (2.5 D) |
| 3 | 6000 | 30 | 20 | 10 | 2.4 | 6.0 (2.5 D) |
| 4 | 8000 | 40 | 20 | 10 | 2.4 | 6.0 (2.5 D) |
| 5 | 10000 | 50 | 20 | 10 | 2.4 | 6.0 (2.5 D) |
| 6 | 4000 | 20 | 20 | 10 | 1.2 | 6.0 (5.0 D) |
| 7 | 4000 | 20 | 20 | 10 | 3.2 | 6.0 (1.875 D) |
| 8 | 4000 | 20 | 20 | 10 | 4.0 | 6.0 (1.5 D) |
| 9 | 4000 | 20 | 20 | 10 | 4.8 | 6.0 (1.25 D) |
| 10 | 4000 | 20 | 20 | 10 | 6.0 | 6.0 (1.0 D) |
| 11 | 4000 | 20 | 20 | 10 | 2.4 | 3.6 (1.5 D) |
| 12 | 4000 | 20 | 20 | 10 | 2.4 | 8.4 (2.0 D) |
| 13 | 4000 | 20 | 20 | 10 | 2.4 | 10.8 (2.5 D) |
| 14 | 4000 | 15 | 26.6 | 10 | 2.4 | 6.0 (2.5 D) |
| 15 | 4000 | 30 | 13.4 | 10 | 2.4 | 6.0 (2.5 D) |
| 16 | 4000 | 40 | 10 | 10 | 2.4 | 6.0 (2.5 D) |
| 17 | 4000 | 50 | 8 | 10 | 2.4 | 6.0 (2.5 D) |
Table 4.
The meaning of normalized indicators.
Table 4.
The meaning of normalized indicators.
| Notation | Formula Definition | Physical Meaning |
|---|
| where a = 0 m means the ground surface; b = 18 m means the depth at 18 m from the ground surface. | and are the mean value theorem of integral computation results between Ir and depth after tamping of the 1st and 2nd impact points. |
| - | and are the improvement depth corresponding to Ir = 7.7% after tamping of the 1st and 2nd impact points. |
| - | and are the improvement area corresponding to the zone of Ir = 7.7% after tamping the 1st and 2nd impact points. |
| S’R, Z’R, and A’R | - | Three standard values based on the case of the numerical model with S = 6.0 m, MH = 4000 kN·m, R = 1.2 m after the completion of the 1st impact points. |
| | and are the normalized mean values of Ir after tamping of the 1st and 2nd impact points. |
| | and are the normalized improvement depth after tamping of the 1st and 2nd impact points. |
| | and are the normalized improvement area after tamping of the 1st and 2nd impact points. |
| | and are used to investigate the soil improvement below point 3 (between impact points) during impact at points 1 and 2, respectively. |
| | and are used to investigate improvement depth during impact at points 1 and 2, respectively. |
| | and are used to investigate the improvement area corresponding to the zone of Ir = 7.7% during impact at points 1 and 2, respectively. |
Table 5.
Parameters of the tamper with different drop momentum.
Table 5.
Parameters of the tamper with different drop momentum.
| M (tons) | 15 | 20 | 30 | 40 | 50 |
| H (m) | 26.6 | 20 | 13.4 | 10 | 8 |
| Drop momentum (tons·m/s) | 273.3 | 400 | 491.1 | 565.6 | 632.4 |
Table 6.
Curve-fitting coefficients of Equations (10)–(13).
Table 6.
Curve-fitting coefficients of Equations (10)–(13).
| Equation | Fitting Coefficients | R-Square |
|---|
| Equation (10) | k1 | k2 | k3 | k4 | 0.90 |
| 0.32 | 0.34 | 0.072 | −0.44 |
| Equation (11) | l1 | l2 | l3 | l4 | 0.93 |
| 0.21 | 0.22 | 0.35 | −0.50 |
| Equation (12) | e1 | e2 | e3 | e4 | 0.94 |
| 0.9 | 0.23 | 0.54 | 0.20 |
| Equation (13) | f1 | f2 | f3 | f4 | 0.91 |
| 0.26 | 0.26 | 0.28 | 0.29 |
Table 7.
Details of DC at two field cases.
Table 7.
Details of DC at two field cases.
| Site Location | M (tons) | H (m) | D (m) | S (m) | N | Type of Soil |
|---|
| Changi Airport | 23 | 25 | 2.65 | 6 | 10 | Highly permeable sandy soil |
| Kampung Pakar | 15 | 20 | 2.06 | 6 | 10 |


