Abstract
The detailed studies of converted S-waves recorded on the Ocean Bottom Seismometer (OBS) can provide evidence for constraining lithology and geophysical properties. However, the research of converted S-waves remains a weakness, especially the S-waves’ inversion. In this study, we applied a travel-time inversion method of converted S-waves to obtain the crustal S-wave velocity along the profile NS5. The velocities of the crust are determined by the following four aspects: (1) modelling the P-wave velocity, (2) constrained sediments Vp/Vs ratios and S-wave velocity using PPS phases, (3) the correction of PSS phases’ travel-time, and (4) appropriate parameters and initial model are selected for inversion. Our results show that the vs. and Vp/Vs of the crust are 3.0–4.4 km/s and 1.71–1.80, respectively. The inversion model has a similar trend in velocity and Vp/Vs ratios with the forward model, due to a small difference with ∆Vs of 0.1 km/s and ∆Vp/Vs of 0.03 between two models. In addition, the high-resolution inversion model has revealed many details of the crustal structures, including magma conduits, which further supports our method as feasible.
1. Introduction
The Ocean Bottom Seismometer (OBS) survey is a kind of seismic observation technology whose geophones are directly deployed on the seafloor, which has a wide range of use in the research of deep seismic structures [1,2]. In contrast to Multichannel Seismic Reflection (MCS) survey, the OBS survey has wider detection coverage, both in depth (>25 km), and width (>100 km) [3]. Another advantage is the ability to record converted S-waves [4,5], because OBSs, including 4-component geophones, are placed on the seafloor. The joint studies of P- and S-wave velocities derived Vp/Vs ratios of the crustal structures, which provide direct evidence for constraining the lithology and geophysical properties [6,7]. Therefore, the S-wave research has made a huge contribution to distinguishing crystalline basement compositions [4,8,9,10] and mantle serpentinization [11], as well as estimating the saturation of gas hydrates or fluids [12]. However, the RayInvr forward approach, one of the common modelling methods of the converted shear wave, has complicated steps and leads to difficulties in ensuring the optimal solution, which is urgently needed to improve the existing methods.
The detailed studies of converted S-waves remain a weakness. One reason for this is that the converted S-waves are hard to observe due to the complicated submarine environment (the coupling between the instruments and seabed) and the specific conversion interface for P- to S-wave. Previous studies have mainly been limited to modelling P-wave velocity structure, and only three OBS profiles (Figure 1) have revealed the S-wave velocity structure in the north-eastern continental margin of the South China Sea (SCS) [4,13,14]. Additionally, the research of converted S-waves has a critical defect because of the deficient modeling method. For example, only the Vp/Vs ratio of the entire layer in the model was obtained by using 2-D ray tracing along the profile on the Lofoten continental margin, northern Norway [15]. The same cases were seen by Chian and Louden in 1994 [8], and Kodaira et al. in 1996 [16], too. Almost all similar studies used the RayInvr forward modelling [17] after 2003 [9], when the forward approach was first applied to modelling the observed converted S-waves data [4,10,11,18]. In the RayInvr model, the depth and velocity nodes of layers defined variable-sized trapezoidal blocks. In that case, only Poisson’s ratio (σ) of different blocks was adjusted to acquire the forward S-wave model. The forward modelling method is often affected by human subjectivity (e.g., if the grid size of blocks is set too small, it will result in a huge workload; otherwise the model resolution will be insufficient), so a more objective inversion method is needed.
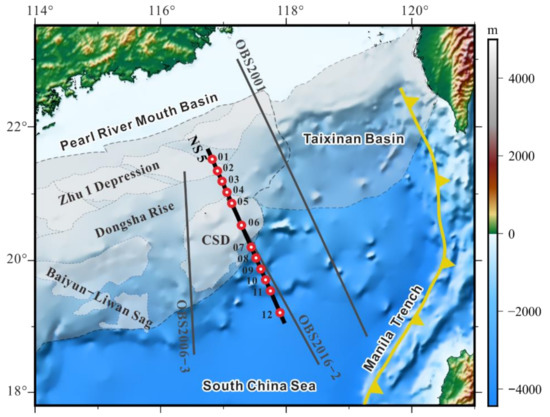
Figure 1.
Topography and bathymetry map of north-eastern South China Sea (SCS) with the location of deep seismic survey lines. The gray lines represent the deep seismic survey lines which have conducted the studies of converted S-waves, including OBS2001 [4], OBS2006-3 [13], OBS2016-2 [14]. The thick, black, solid line is the profile NS5 in this study. Red dots represent ocean bottom seismometers (OBSs). Gray areas represent the distribution of the Pearl River Mouth Basin and Taixinan Basin. The yellow curve with triangles denotes Manila Trench. CSD: Chaoshan Depression.
In May–July 2014, a deep seismic refraction profile (NS5) was carried out in the north-eastern SCS (Figure 1). A large number of converted S-wave phases through the crust were recorded by the OBSs, which provided good data for crustal S-wave velocity inversion. In this study, we introduced the improvements in the inversion method to acquire the crustal S-wave velocity model using converted S-waves phases.
2. Data and Methodology
2.1. Data Acquisition and Processing
A wide-angle seismic profile (NS5) was conducted by the R/V Shiyan 2 of the South China Sea Institute of Oceanology in May–July 2014. The profile NS5 is 317 km long and is an NW-SE trending line crossing the Dongsha Rise (Figure 1). OBSs are deployed at an interval of ~15–20 km along the profile with 12 OBS instruments (comprising three orthogonal geophones and one hydrophone) that record usable data. The seismic source consisted of four BOLT air-guns arrayed with a total volume of 6000 in3 (~98.3 L), which were operated at a pressure of 2000 psi (13.79 MPa). A total of 965 shots were fired along profile with a shooting interval time of 120 s. The recorded OBS data are of high quality, and most instruments have recorded clear air-gun signals. The processing of OBS data includes data format conversion, correction of OBS position and clock drift, and thereby four components of seismic profile are plotted. We have identified five P-wave phases on the vertical component profile: refracted/reflected phases in the Cenozoic sediment layers (Ps2/Psp), refracted phases in the Mesozoic sediment layers (Ps3), refracted phases in the upper and lower crust (Pg), refracted phases in the upper mantle (Pn), and reflected phases at the crust-mantle boundary (PmP). Based on the seismic phases described above, we set seven layers in the initial velocity model (water, Cenozoic sediment, Mesozoic sediment, upper crust, lower crust, high-velocity lower crust, and upper mantle), corresponding to velocities of 1.5 km/s, 1.7–3.5 km/s, 3.5–5.5 km/s, 5.5–6.5 km/s, 6.5–7.0 km/s, 7.0–7.5 km/s, and 7.8–8.2 km/s. The Cenozoic sediment layer was further divided into two layers, each corresponding to a high-amplitude reflection in single-channel reflection seismic data [19] and OBS data (Figure 2). Furthermore, we performed forward P-wave velocity modelling using the RayInvr [17]. We adjusted the boundary nodes and velocity values by using a manual trial-and-error method to make the modelled, theoretical travel times consistent with observed times, based on ray tracing and travel-time fitting. The final model (Figure 3 and Figure S1) had the root–mean–square travel-time residuals (RMS) of 81 ms, and normalised chi-squared value (χ2) of 1.468. The uncertainty of the Moho depth and P-wave velocity of the high-velocity lower crust were determined to be −0.2–0.2 km and −0.2–0.2 km/s (Figure S2), respectively. The converted S-waves phases are primarily concentrated in the two horizontal components. We rotated two horizontal components into radial and transverse components to make the S-wave phases clearer. The polarisation angle (for details see Table S1) is calculated using the energy scanning method [20]. Then, the S-wave modelling is conducted using the S-wave phases recorded on the radial component.
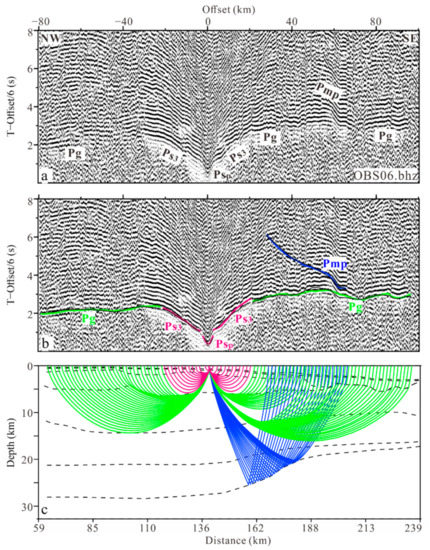
Figure 2.
(a) Vertical seismic profile from OBS 06, with a reduction velocity of 6 km/s and a band-pass filter of 3–10 Hz (see Figure 1 for location). (b) The phase picking and fitting of OBS 06. The coloured lines represent picked travel times, and the thin, black lines represent calculated travel times from the final velocity model. (c) Ray tracing for OBS 06. Different line colours correspond to different phases.
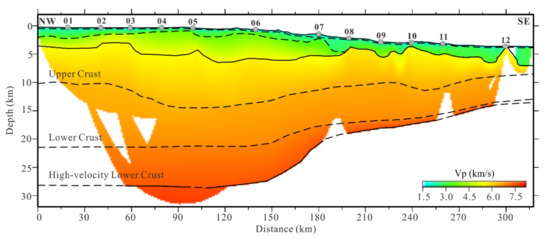
Figure 3.
The forward P-wave velocity model along profile NS5. Gray circles represent OBS locations.
2.2. Method
In this study, we apply the RayInvr algorithm [17] for crustal S-wave velocity inversion. RayInvr allows the flexibility of ray tracing and inverts different converted S-waves phases, simulating different mode conversions. It also has the ability to switch between forward modelling and inversion, to allow Vp/Vs to vary within model layers.
Based on asymptotic ray theory of the zeroth order, the ray-tracing equations (Equation (1)) were solved by Runge–Kutta method [21] with error control, and Snell’s Law is applied to model interfaces. In Equation (1), θ is the angle between the tangent of the ray and the z axis, v is the wave velocity, vz and vx are the partial derivatives of the velocity on the z and x axis, respectively. The initial values of x, z and θ are x0, z0 (shooting coordinates) and θ0 (take-off angles of rays).
Equation (2) is the discrete form of the travel-time equation, where li and vi are the path length and velocity of the i-th ray segment. Equation (3) is derived from Equation (2) to linearize by Taylor series expansion, and the higher-order terms are neglected. In Equation (3), A is the partial derivative matrix, Δm is the model parameter adjustment vector, and Δt is the travel-time residual vector. The model parameter adjustment vector was calculated in each inversion and used to update the model. After multiple iterations, inversion will be terminated when the preset criteria are reached, then an optimum inverted model will be obtained.
3. Types and Applications of Converted S-Waves Phases
In the OBS surveys, only the incident P-wave can reach the seafloor and propagate for the seismic waves that are generated by firing an air-gun in seawater. The S-wave phases recorded by the OBS are converted from the P-wave at different subsurface interfaces, such as the seafloor, sedimentary basement, and crust-mantle boundary [4,9,22]. The energy of converted S-waves depends on the angle of incidence [23]. The same parameters of filtering and reduction velocity were used to plot seismic profiles of the vertical and radial components. The converted S-wave phases were determined by comparing the kinematic (e.g., travel times, apparent velocity) and dynamic features (e.g., particle motion paths) of arrival phases in the vertical and radial components [4]. Compared to the vertical component, the converted S-wave phases in the radial component have lower apparent velocities and slower travel times (Figure 4a–d). The particle motion paths of the 710th trace in the OBS09 vertical component (Figure 4e) show that the energy of the vertical component (V) is strongest at 2.88–3.48 s, suggesting that particle motion was dominated by P-waves. The energy at 4.66–5.26 s in the radial component (R) is the largest (Figure 4f), denoting that this particle motion was dominated by S-waves. Two modes of S-wave phases [16] generally observed on OBSs are PPS and PSS phases (Figure 5). The apparent velocity of PPS arrivals is similar to corresponding P-waves, whereas the apparent velocity of PSS arrivals is much slower (Figure 6).
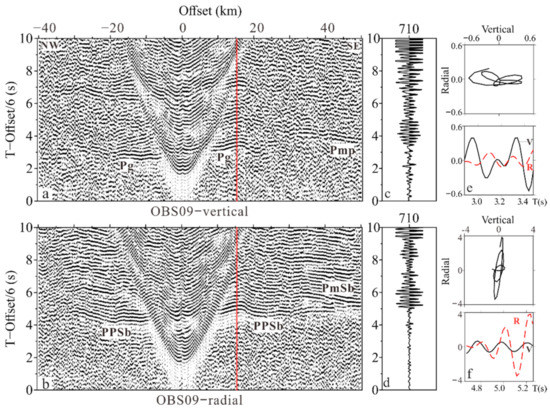
Figure 4.
(a) Vertical and (b) radial component seismic profiles of OBS 09, reduced by 6 km/s. (c) and (d) show the waveform of the 710th trace in the vertical and radial component profiles, respectively. (e,f) correspond to the particle motion paths of the 710th trace in the vertical component (2.88–3.48 s) and radial component (4.66–5.26 s), respectively.
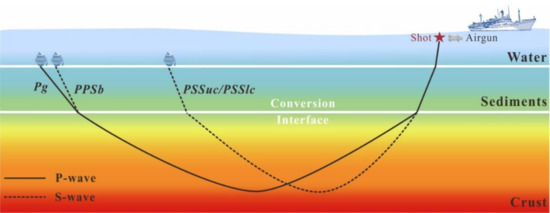
Figure 5.
Cartoon illustrating the ray paths of converted S-wave phases. The PPS phases (PPSb) constrain the sediments S-wave velocity, while the PSS phases (PSSuc/PSSlc) constrain the crustal S-wave velocity.
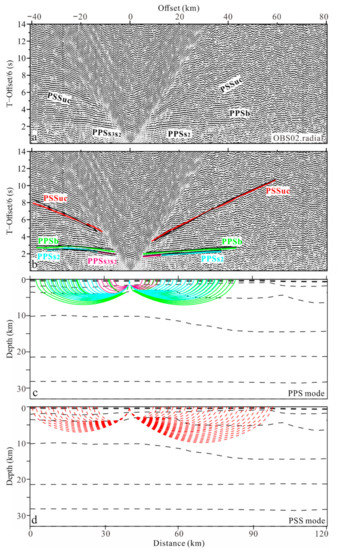
Figure 6.
Seismic record section, S-wave phase identification, and ray tracing of OBS 02. (a) Seismic profile of radial component. (b) The identification and picking of S-wave phases. The coloured lines represent picked travel times and the thin black lines represent calculated travel times. (c,d) Show the ray tracing of PPS and PSS conversion modes, respectively. Solid lines represent P-wave paths, dotted lines represent S-wave paths, and the different coloured lines indicate different phases.
3.1. PPS Phases and Its Role in Constraining Sediments Vp/Vs Ratios
The sediments’ Vp/Vs ratios were constrained well by PPS phases, which were generated by P-waves converted to S-waves, at the interface, on the way up, and across the sediment as S-waves (Figure 5 and Figure 6). The geometry of the S-wave model was kept consistent with the P-wave model, and the sediment interface depths were fixed and only the Poisson’s ratio (σ) of different blocks was changed. The RayInvr software [17] was used to test the various Poisson’s ratios within sedimentary layers until the best agreement was obtained between the calculated and observed PPS phase travel-times. The sediments S-wave velocity is calculated by the Vp/Vs ratios (the equation of Vp/Vs and Poisson’s ratios is ) and the P-wave velocity.
The sedimentary layer in the P-wave model of the profile NS5 is divided into three layers (Figure 7), in which sedimentary layers 1 and 2 are Cenozoic sedimentary layers, and sedimentary layer 3 is Mesozoic strata. Sedimentary layer 1 is characterized by the thin thickness (0.16–0.5 km) and low Vp (1.7–2.2 km/s), thence the bottom of sedimentary layer 1 is a P- to S-wave conversion interface (e.g., PSSuc in Figure 6). Similarly, P- to S-wave conversion can also occur at the bottom of sedimentary layer 2, due to differences in petrophysical properties between sedimentary layer 2 and sedimentary layer 3 (e.g., PPSs2, PPSs3s2 in Figure 6). Refracted phases of Mesozoic sediments (Ps3) were converted to S-waves on the way up, at the bottom of sedimentary layer 2, and formed the PPSs3s2 phase. The PPSb phase was generated by the crustal refracted phases (Pg) converting to S-waves at the sedimentary basement on the way up, whereas the PPSs2 phase is from Pg phase converted at the bottom of sedimentary layer 2. The sediments’ Vp/Vs ratios beneath the OBS were defined by the PPS phases. The S-wave velocity model of the sediment (Figure 7c) was obtained from dividing the previous P-wave velocity model (Figure 7a) by the Vp/Vs model (Figure 7b), which was calculated by the interpolation of the adjacent OBS.
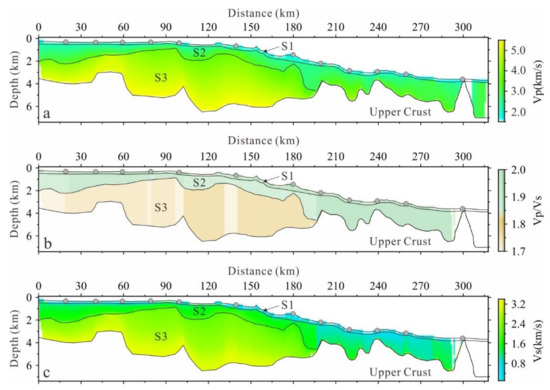
Figure 7.
(a) P-wave velocity model, (b) Vp/Vs model, (c) S-wave velocity model of sedimentary layers. S1, S2 and S3 represent sedimentary layers 1, 2, and 3, respectively.
Our results show that sedimentary layer 1 has a high Vp/Vs of 3.05–7.14, representing unconsolidated sediments. The Vp/Vs of sedimentary layer 2 is also relatively high, with an average of 1.90 on the landward and 5.10 on the oceanward. The Mesozoic strata are characterised by high velocities and low Vp/Vs ratios of 1.71–1.76, due to the effects of long-term tectonism, sedimentary compactions, and later magmatism. The Vp/Vs of the sedimentary layers reveal two trends: one is that the Vp/Vs gradually decrease with the increased depth, which resulted from the confining pressure with depth; another is a seaward increase in Vp/Vs ratios, which may be related to composition and consolidation.
3.2. PSS Phases and Their Travel-Times Correction
The PSS phases result from P-waves are converted to S-waves at the sediment interface on the way down, so the entire path through the crust was at S-wave velocities (Figure 5 and Figure 6). The PSSuc and PSSlc phases originated from the Pg phase refracted in the upper and lower crust, respectively, which were converted to S-waves at the bottom of sedimentary layer 1 on the way down (Figure 6). The PSSm phase was generated by Moho reflected phases (Pmp) converting to S-waves at the bottom of sedimentary layer 1 on the way down, while the Pmp phases converted at the basement formed the PSSmb phase.
The Vp/Vs ratios of the crust were constrained using the PSS phases recorded on the radial component. Since the converted interface of the PSS phases was within the sediments, its ray path included both P- and S-wave velocities segments. However, there is not a travel-time inversion method for the joint inversion of P- and S-wave velocities. The travel-time of the PSS arrivals can be corrected when the P-wave velocity and Vp/Vs ratios of the sedimentary layer are determined [24,25], because RayInvr allows the flexibility to model different arrival phases and conversions. Therefore, the conversion interface of the PSS phases was corrected from the sediments’ interfaces to the seafloor. In that case, the velocity models have S-wave velocity below the seafloor, so the S-wave velocity inversion can be performed by the RayInvr software.
We verified the precision of the travel-time correction by ray-tracing the model using the corrected travel-times. The travel-time difference refers to the propagation time difference between the seafloor and the conversion interface at the velocities of P- and S-waves, respectively. The fitting of the initial travel-time and corrected travel-time were compared by ray tracing the forward and composite model, which shows very small differences in the RMS. Corrected travel-times gave a fit with an RMS of 188 ms, compared to 185 ms for the initial travel-times (for details, see Table 1). In addition, the ray path of corrected travel-time is almost consistent with the initial (Figure 8), indicating that the correction of travel-time is reasonable.

Table 1.
The total root–mean–square travel-time residuals before (RMSb) and after (RMSa) travel-times correction, picking uncertainties, conversion interface, for PSS mode arrival phases.
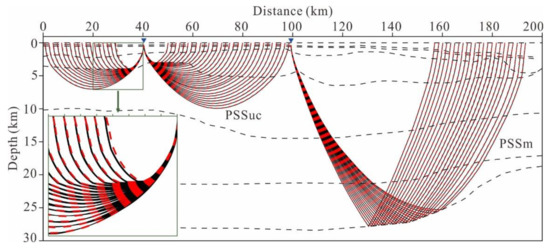
Figure 8.
Comparison of the ray paths before and after the PSS phases’ travel-time correction; The red dotted lines represent the original ray path, and the black solid lines represent the corrected ray path. The left-lower map shows a partial enlarged view of the 20–40 km in the model.
4. Crustal S-Wave Velocity Inversion
We only used the corrected PSS phases for the crustal S-wave velocity inversion, while the S-wave velocity of the sediments, constrained by the PPS phases, stays fixed during inversion. The RayInvr inversion was a process used to invert and update the velocity at individual nodes of the crust, the geometry of the model interfaces was kept consistent with the P-wave model, and the interface depths were kept constant. Vp/Vs ratios were very sensitive to the perturbation of the S-wave velocity model, which can supervise the instabilities during the inversion. The crustal Vp/Vs calculated from dividing the P-wave velocity model by the inverted S-wave velocity model was monitored during the inversion to ensure that the Vp/Vs ratios remained reasonable.
The damping factor (DF) will affect the convergence rate of the RMS. A small damping factor makes convergence faster, and the inversion result gradually approached the least-squares solution, whereas the slower convergence rate is performed with a large damping factor. The numerical experiments show that a large damping factor will reduce the efficiency of the RayInvr algorithm, resulting in the number of iterations being increased and the resolution being reduced [26]. Selecting an appropriate damping factor can not only improve the inversion efficiency, but also make the inversion stable and reliable. After a series of tests, DF = 3 was finally selected as the damping factor for the following inversion. The velocity nodes of inversion are the same as those of P-wave model. The average inversion grid is set to 14, 16.5 and 19 km in the upper crust, lower crust and high-velocity lower crust, respectively (Figure S3).
4.1. Initial Models and the Iteration Termination Conditions
The initial S-wave velocity model is obtained from dividing the P-wave model by the set crustal Vp/Vs ratios. The five initial S-wave velocity models originated from starting Vp/Vs ratios of 1.71, 1.73, 1.75, 1.78, and 1.81 are shown in Figure 9. The Vp/Vs ratios varying from 1.71 to 1.81 represent the gradual change from felsic to mafic [27], which is reasonable for the geological features of the study area. Output Vp/Vs resulting from the division of P- and S-wave velocities are shown in Figure 9c,f,i,l,o. The best theoretical calculation model is achieved using a starting Vp/Vs ratio of 1.81, and the RMS is 187 ms. However, low Vp/Vs is abnormally (the blue area in Figure 9o) observed at the edge and 150 km of the model—such a model is unreasonable. The inversion is terminated after two iterations when the starting Vp/Vs is 1.73. Comprehensive analysis is done of the RMS and output Vp/Vs, and the best inversion model (Figure 9i) is produced from the starting Vp/Vs of 1.75 (Figure 9g). The final inversion model has a relatively good fit with the RMS of 193 ms, χ2 of 1.718, and there is no local anomaly.
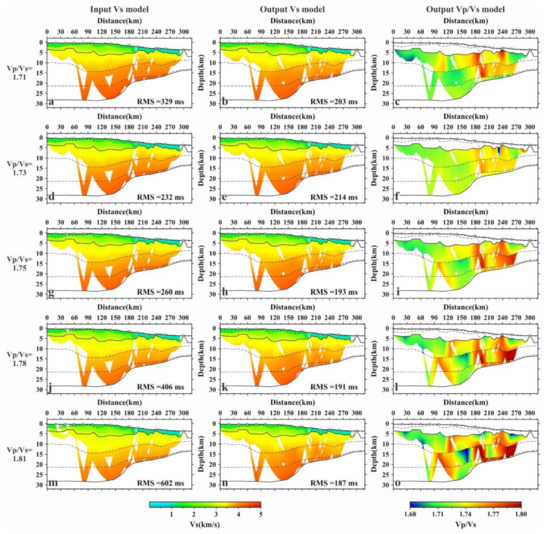
Figure 9.
Inversion results for crustal S-wave velocity along profile NS5. The initial crustal S-wave velocity models of (a,d,g,j,m) in column 1 are originated from starting Vp/Vs ratios of 1.71, 1.73, 1.75, 1.78, and 1.81, respectively. Column 2 (b,e,h,k,n) shows the final results from inversion obtained from the different initial models in column 1 (a,d,g,j,m). Column 3 (c,f,i,l,o) shows apparent crustal Vp/Vs models from the division of the P-wave velocity model by the final S-wave velocity models in column 2 (b,e,h,k,n).
Generally, the optimum model is characterised by the RMS and χ2 tended to 0 and 1, respectively. Therefore, the RMS and χ2 should be taken into consideration if inversion is to be terminated. In addition to having a good travel-time fit, the final model should also trace as many rays as possible. If most of the rays are not traced, then this model should not be adopted. It is very important to establish the necessary conditions to terminate the inversion iteration, because this process requires manual interaction. After several iterations, the χ2 has a value of <2 and the variation range is within 0.2, so the χ2 is not taken into account here. We employed the number of tracing phases (NTP) and the RMS as the criteria for termination of inversion iterations (Figure 10). The NTP and RMS gradually decreased, as the adjustment of the model (sometimes the NTP will increase), and the variation range of the NTP is mainly within 30. After three to six iterations, the NTP sharply decreased with no obvious variation in the RMS (red dots in Figure 10); this means that the inversion can be terminated at this time.
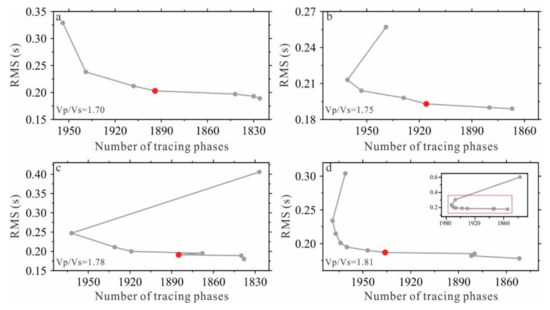
Figure 10.
Variation in the number of tracing phases and travel-time residuals (RMS) during the inversion process under the initial models with the Vp/Vs ratios of 1.71 (a), 1.75 (b), 1.78 (c), 1.81 (d). Red dots indicate inversion is terminated at this time.
4.2. Inversion Results and Analysis
The final inversion model shows (Figure 11a,c) that the upper crust and lower crust have a Vs. of 3.0–3.7 km/s and 3.7–4.4 km/s, respectively. On the upper slope (at profile distance of 0–183 km), the Vp/Vs of the upper crust and lower crust are 1.71–1.75 and 1.72–1.75, respectively. Beneath the lower slope (at profile distance of 183–289 km), the upper crustal Vp/Vs is 1.75–1.79, and lower crustal Vp/Vs is 1.75–1.80. The high-velocity lower crust is also observed in our model that has a Vs. of 4.0–4.4 km/s, and a Vp/Vs of 1.72–1.78. The final inversion model has a similar trend in the lateral velocities and Vp/Vs ratios with the forward model, due to the small difference with ∆Vs of 0.1 km/s and ∆Vp/Vs of 0.03 between the two models (Figure 12). The inversion model reveals more details in the crustal structures. For example, the high Vp/Vs ratios of the crust below two buried volcanos [19] may be related to magma conduits (Figure 11c). Therefore, the inversion results obtained by the RayInvr inversion algorithm are reliable and detailed for crustal structures.
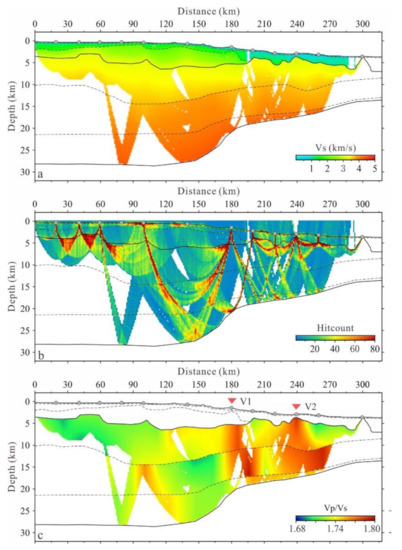
Figure 11.
(a) The final inversion result for crustal S-wave velocity model. (b) Ray coverage density distribution, and the dimensions of counting grid are 1 × 0.25 km. (c) Apparent crustal Vp/Vs model that calculated by dividing the P-wave model by the inverted S-wave model (a). V1, V2 represent the buried volcanos [19].
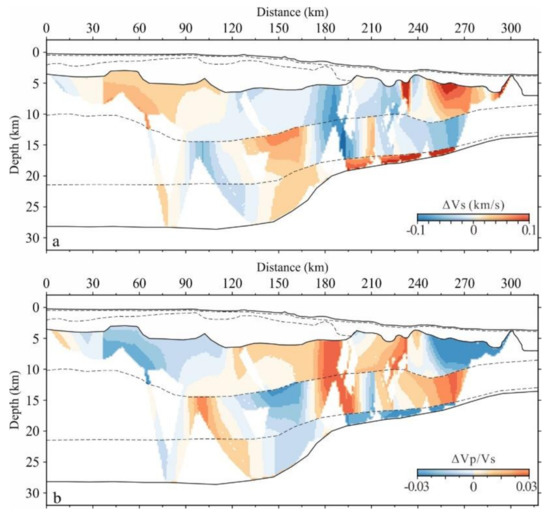
Figure 12.
The difference between the forward and inversion results for crustal S-wave velocity (a), Vp/Vs ratios (b). ∆Vs and ∆Vp/Vs are the difference between inversion and forward results.
Figure 11b shows that the model has a good ray coverage with the ray coverage of most areas exceeding 20–40 hits. To better determine the resolution of the inversion model, we imposed a checkerboard pattern on the model [28]. This grid pattern had a width of 15–25 km in the upper crust, 20–40 km in the lower crust, and the vertical dimension was constrained by the model interface. Furthermore, we added S-wave velocity perturbations of ± 0.2 km/s that were equal in amplitude but opposite in terms of the sign at adjacent nodes (Figure 13a). The output model is shown in Figure 13b. The checkerboard test confirmed the good resolutions of the lower crust, especially in the upper crust.
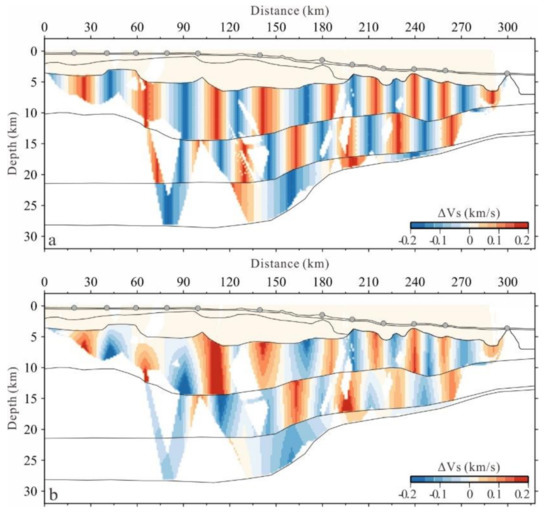
Figure 13.
(a) Synthetic S-wave velocity perturbation using a checkerboard test. (b) Calculated S-wave velocity perturbation for the checkerboard test. The horizontal size of the anomalous block was 15–25 km in the upper crust, 20–40 km in the lower crust, the vertical size was bounded by interface.
5. Conclusions
We skillfully performed the travel-time inversion of converted S-waves based on RayInvr algorithms by transforming the conversion interface of the sedimentary layers to the seafloor. The iterative inversion is terminated by reaching the conditions of the travel-time residuals (RMS) and the number of tracing phases (NTP). The P-wave velocity model and the inverted S-wave velocity mode are presented to calculate the crustal Vp/Vs ratios. Our results show the crust has a Vs. of 3.0–4.4 km/s, and the crustal Vp/Vs ratios are 1.71–1.80, which are reliable due to the small difference, with a ∆Vs of 0.1 km/s and ∆Vp/Vs of 0.03, between the inversion and forward model. In addition, the high-resolution inversion model has revealed many details of the crustal structures, including magma conduits.
Supplementary Materials
The following are available online at https://www.mdpi.com/article/10.3390/app11083571/s1, Figure S1: Results of the forward P-wave velocity, Figure S2: The F-test results for the uncertainty of the Moho depth and velocity in the layer of high-velocity lower crust, Figure S3: The velocity grid nodes for the inversion, Table S1: The polarization angle for each OBS.
Author Contributions
G.W.: Conceptualization, Methodology, Software, Writing—Original Draft. K.W.: Methodology, Resources, Project administration, Writing—Review and Editing. S.X.: Methodology, Resources, Project administration, Writing—Review and Editing. H.X.: Resources, Project administration, Supervision. C.F.: Methodology, Writing—Review and Editing. J.C.: Writing—Review & Editing. All authors have read and agreed to the published version of the manuscript.
Funding
This research is supported by the Key Special Project for Introduced Talents Team of Southern Marine Science and Engineering Guangdong Laboratory (Guangzhou) (GML2019ZD0204), National Natural Science Foundation of China (NSFC, U1701641, 41906055), Science and Technology Planning Project of Guangdong Province—Guangdong Collaborative Innovation Center for Earthquake Prevention and Disaster Mitigation Technology (2018B020207011).
Institutional Review Board Statement
Not applicable.
Informed Consent Statement
Not applicable.
Acknowledgments
OBS Data were collected onboard of R/V Shiyan 2 implementing the open research cruise NORC2014-08 supported by NSFC Shiptime Sharing Project. We are grateful to the captain, crew and scientists for their help during the cruise. We also thank Jennifer D. Eccles for helpful discussions. The figures are plotted by GMT [29].
Conflicts of Interest
The authors declare no conflict of interest.
References
- Xia, S.; Zhao, M.; Qiu, X.; Xu, H.; Shi, X. Crustal structure in an onshore–offshore transitional zone near Hong Kong, northern South China Sea. J. Asian Earth Sci. 2010, 37, 460–472. [Google Scholar] [CrossRef]
- Qiu, X.-L.; Zhao, M.-H.; Ao, W.; Lü, C.-C.; Hao, T.-Y.; You, Q.-Y.; Ruan, A.-G.; Li, J.-B. OBS Survey and Crustal Structure of the SW Sub-Basin and Nansha Block, South China Sea. Chin. J. Geophys. 2011, 54, 1009–1021. [Google Scholar] [CrossRef]
- Xia, S.; Qiu, X.; Zhao, M.H.; Ye, C.; Chen, Y.; Xu, H.; Wang, P. Data processing of onshore offshore seismic experiment in Hongkong and Zhujiang River Delta region. J. Trop. Oceanogr. 2007, 26, 35–38. [Google Scholar]
- Zhao, M.; Qiu, X.; Xia, S.; Xu, H.; Wang, P.; Wang, T.K.; Lee, C.-S.; Xia, K. Seismic structure in the northeastern South China Sea: S-wave velocity and Vp/Vs ratios derived from three-component OBS data. Tectonophysics 2010, 480, 183–197. [Google Scholar] [CrossRef]
- Xia, S.; Cao, J.; Wan, K.; Fan, C.; Sun, J. Role of the Wide-angle OBS Seismic Exploration in the Research of Marine Sedimentary Basin. Adv. Earth Sci. 2006, 31, 1111–1124. [Google Scholar] [CrossRef]
- Domenico, S.N. Rock lithology and porosity determination from shear and compressional wave velocity. Geophysics 1984, 49, 1188–1195. [Google Scholar] [CrossRef]
- Christensen, N.I.; Mooney, W.D. Seismic velocity structure and composition of the continental crust: A global view. J. Geophys. Res. Space Phys. 1995, 100, 9761–9788. [Google Scholar] [CrossRef]
- Chian, D.; Louden, K.E. The continent-ocean crustal transition across the southwest Greenland margin. J. Geophys. Res. Space Phys. 1994, 99, 9117–9135. [Google Scholar] [CrossRef]
- Mjelde, R.; Raum, T.; Digranes, P.; Shimamura, H.; Shiobara, H.; Kodaira, S. Vp/Vs ratio along the Vøring Margin, NE Atlantic, derived from OBS data: Implications on lithology and stress field. Tectonophysics 2003, 369, 175–197. [Google Scholar] [CrossRef]
- Mjelde, R. Continent-ocean transition on the Vøring Plateau, NE Atlantic, derived from densely sampled ocean bottom seismometer data. J. Geophys. Res. Space Phys. 2005, 110. [Google Scholar] [CrossRef]
- Wei, X.; Ruan, A.; Zhao, M.; Qiu, X.; Wu, Z.; Niu, X. Shear wave velocity structure of Reed Bank, southern continental margin of the South China Sea. Tectonophysics 2015, 644–645, 151–160. [Google Scholar] [CrossRef]
- Singhroha, S.; Chand, S.; Bünz, S. Constraints on Gas Hydrate Distribution and Morphology in Vestnesa Ridge, Western Svalbard Margin, Using Multicomponent Ocean-Bottom Seismic Data. J. Geophys. Res. Solid Earth 2019, 124, 4343–4364. [Google Scholar] [CrossRef]
- Wei, X.D.; Zhao, M.H.; Ruan, A.G.; Qiu, X.L.; Hao, T.Y.; Wu, Z.L.; Xiong, H. Crustal structure of shear waves and its tectonic sig-nificance in the mid-northern continental margin of the South China Sea. Chin. J. Geophys. 2011, 54, 3150–3160. [Google Scholar] [CrossRef]
- Hou, W.; Li, C.-F.; Wan, X.; Zhao, M.; Qiu, X. Crustal S-wave velocity structure across the northeastern South China Sea continental margin: Implications for lithology and mantle exhumation. Earth Planet. Phys. 2019, 3, 314–329. [Google Scholar] [CrossRef]
- Mjelde, R. Shear waves from three-component ocean bottom seismographs off Lofoten, Norway, indicative of anisotropy in the lower crust. Geophys. J. Int. 1992, 110, 283–296. [Google Scholar] [CrossRef]
- Kodaira, S.; Bellenberg, M.; Iwasaki, T.; Kanazawa, T.; Hirschleber, H.B.; Shimamura, H. VpIVsratio structure of the Lofoten continental margin, northern Norway, and its geological implications. Geophys. J. Int. 1996, 124, 724–740. [Google Scholar] [CrossRef]
- Zelt, C.A.; Smith, R.B. Seismic traveltime inversion for 2-D crustal velocity structure. Geophys. J. Int. 1992, 108, 16–34. [Google Scholar] [CrossRef]
- Mjelde, R.; Eckhoff, I.; Solbakken, S.; Kodaira, S.; Shimamura, H.; Gunnarsson, K.; Nakanishi, A.; Shiobara, H. Gravity and S-wave modelling across the Jan Mayen Ridge, North Atlantic; implications for crustal lithology. Mar. Geophys. Res. 2007, 28, 27–41. [Google Scholar] [CrossRef]
- Fan, C.; Xia, S.; Cao, J.; Zhao, F.; Sun, J.; Wan, K.; Xu, H. Lateral crustal variation and post-rift magmatism in the northeastern South China Sea determined by wide-angle seismic data. Mar. Geol. 2019, 410, 70–87. [Google Scholar] [CrossRef]
- Zhang, L.; Zhao, M.; Qiu, X.; Wang, Q. Recent progress of converted shear-wave phase identification in Nansha Block using ocean bottom seismometers data. J. Trop. Oceanogr. 2016, 35, 61–71. [Google Scholar] [CrossRef]
- Sheriff, R.E.; Geldart, L.P. Exploration Seismology, 2nd ed.; Cambridge University Press: Cambridge, MA, USA, 1995. [Google Scholar]
- Tan, P.; Breivik, A.J.; Trønnes, R.G.; Mjelde, R.; Azuma, R.; Eide, S. Crustal structure and origin of the Eggvin Bank west of Jan Mayen, NE Atlantic. J. Geophys. Res. Solid Earth 2017, 122, 43–62. [Google Scholar] [CrossRef]
- Digranes, P.; Mjelde, R.; Kodaira, S.; Shimamura, H.; Kanazawa, T.; Shiobara, H.; Berg, E. A regional shear-wave velocity model in the central Vøring Basin, N. Norway, using three-component Ocean Bottom Seismographs. Tectonophysics 1998, 293, 157–174. [Google Scholar] [CrossRef]
- Eccles, J.D.; White, R.S.; Christie, P.A.F. Identification and inversion of converted shear waves: Case studies from the European North Atlantic continental margins. Geophys. J. Int. 2009, 179, 381–400. [Google Scholar] [CrossRef]
- Eccles, J.D.; White, R.S.; Christie, P.A. The composition and structure of volcanic rifted continental margins in the North Atlantic: Further insight from shear waves. Tectonophysics 2011, 508, 22–33. [Google Scholar] [CrossRef]
- Liu, H.; Wang, F.; Liu, Z. 2-DTraveltime Inversion RAYINVR Algorithm Test. J. Geod. Geodyn. 2017, 37, 977–982. [Google Scholar] [CrossRef]
- Holbrook, S.; Mooney, W.; Christensen, N. The seismic velocity structure of the deep continental crust. Dev. Geotecton. 1992, 23, 1–43. [Google Scholar]
- Wan, K.; Sun, J.; Xu, H.; Xie, X.; Xia, S.; Zhang, X.; Cao, J.; Zhao, F.; Fan, C. Seismotectonics of the Taiwan Shoal region in the northeastern South China Sea: Insights from the crustal structure. J. Ocean Univ. China 2018, 17, 156–168. [Google Scholar] [CrossRef]
- Wessel, P.; Smith, W.H.F. New, improved version of generic mapping tools released. Eos Trans. Am. Geophys. Union 1998, 79, 579. [Google Scholar] [CrossRef]
Publisher’s Note: MDPI stays neutral with regard to jurisdictional claims in published maps and institutional affiliations. |
© 2021 by the authors. Licensee MDPI, Basel, Switzerland. This article is an open access article distributed under the terms and conditions of the Creative Commons Attribution (CC BY) license (https://creativecommons.org/licenses/by/4.0/).