Abstract
Frailty poses a considerable risk to the performance of daily living activities, affecting the quality of life of older adults and increasing their risks of falling, disability, hospitalization, and mortality. Frailty is related to pathology with a state of negative energy balance, sarcopenia, diminished muscle strength, and low tolerance for exertion. Few intervention studies have been conducted on prefrail community-dwelling older adults. This study investigated the effects of whole-body vibration training on the biomarkers and health beliefs of prefrail community-dwelling older adults. We conducted a quasi-experimental research. Ninety participants were allocated to either an experimental or control group. This study followed the Transparent Reporting of Evaluations with Nonrandomized Designs (TREND) guidelines for quasi-experimental research design. The experimental group participated in a 12-week whole-body vibration training conducted three times per week, with 5-min continuous vibration at 12-Hz frequency and 3-mm amplitude each time. DVDs on resistance training and manuals were provided to the control group. The data were analysed through descriptive analysis, a chi-square test, an independent t test, a paired t test, and analysis of covariance. There were 42 people in the experimental group and 48 people in the control group. After the 12-week training and intervention, ANCOVA is used to analyze the experimental and control group’s results. Experimental results in 30s chair stand test (F = 98.85, p < 0.05), open-eye stand on dominant foot test (F = 26.15, p < 0.05), two–minute-step test (F = 25.89, p < 0.05), left-leg bone mineral density (F = 14.71, p < 0.05), barriers of perceived frailty (F = 39.81, p < 0.05) and cues to action (F = 92.96, p < 0.05) in health beliefs are statistically significant compared to the control group’s results. The 12-week whole-body vibration program employed in this study partly improved the biomarkers and health beliefs of prefrail community-dwelling older adults. We recommend whole-body vibration training as an exercise strategy, thereby improving community-dwelling older adults’ biomarkers and health beliefs.
1. Background
According to the World Health Organisation, an ageing society consists of a population in which the proportion of older adults is 7% or higher; an aged society is a society in which the proportion of older adults is 14% or higher; and a society in which the proportion of older adults is 20% or higher is referred to as a hyper-aged society [1]. The population of persons aged 65 years or older has continued to grow in Asia, and Taiwan has been a rapidly ageing society since 1993, accounting for 14.1% of the total population, indicating that Taiwan is an “aged society” [2]. Global population ageing is a current challenge and is associated with a shifting disease burden, increased expenditure on health and long-term care, and reconsideration by some countries of healthcare provisions [3,4]. Frailty is a critical issue in geriatric care and is a crucial factor in older people. Frailty is correlated to pathology with energy imbalance, sarcopenia, muscle strength loss, and low tolerance for exertion. Prefrailty is an intermediate state between frailty and non-frailty that has a high risk of progressing to frailty. Relevant literature found that the prevalence of pre-frailty increased from 24.6% to 50.9% from 2001 to 2017 in the global population [2]; the prevalence of pre-frailty among the elderly in Taiwan over 65 years old is 25%~35% [5,6,7]. According to the research of Fried et al. [8], diseases, stress, lack of activity, malnutrition, and physical degradation are caused by frailty. The risk proportion is high in falls, reduced ability in daily living, reduced mobility, hospitalization, or death. Empirical measurement of frailty is based on the following indicators: unintentional weight loss, difficulty rising from a chair without support, and lack of energy.
Fried et al. [6] pointed out that bio-markers are an important basis for objective measurement and evaluation of health indicators, which can effectively reflect the effectiveness of care intervention programs. Therefore, bio-markers can be used as important indicators to support treatment plans and track the effectiveness of care. Cesari et al. [8] mentioned that bio-markers usually include body functional (such as muscle strength measurement, balance and flexibility), physiological (such as blood pressure, bone density and body mass index) or image-related indicators (such as mobile device tomography, body impedance analysis, and the dual-energy X-ray absorption method). Previous studies have pointed out that bio-markers can effectively reflect the physical function status of individuals [6]. Chang et al. [5] identified biomarkers of prefrailty that might characterise the emergence of frailty. Fried et al. [6] and Navarro-Flores [7,9] confirmed that older adults with prefrailty are at high risk of disability, falling, hospitalisation, increased medical expenses, transferral into a long-term care institution, and mortality.
Health belief models are used in many research fields (disease behaviors and preventive health behaviors) to predict and explain personal health behaviors, and are used as the theoretical basis for research [7]. The literature points out that a “health belief model” can strengthen the influence of personal motivation, attitude and cognition on behavior, improve the adoption of preventive health behaviors by the elderly, and slow down the process of frailty [8].
In recent years, whole-body vibration training (whole-body vibration) has been gradually used as an intervention method to improve the physiological function of the muscles of the elderly. Studies have shown that systemic vibration training can increase the efficiency of muscle strength and functional movements of the elderly, prevent falls and improve health and quality of life [8]. In addition, studies have shown that systemic vibration training has similar effects on muscle function as those of traditional resistance training, and is safer and more convenient than resistance training. It can avoid the risk of injury for the elderly caused by resistance training [8]. Vibration training can safely and effectively improve the muscle strength of the elderly, and is widely used in the fields of institutional care, menopause and physical therapy. However, few intervention studies have been conducted on prefrail community-dwelling older adults. Therefore, an intervention program was implemented to improve the biomarkers and health beliefs of prefrail older adults and thereby achieve the goal of active ageing. This is the first study to demonstrate the effects of a whole-body training intervention on the biomarkers and health beliefs of prefrail community-dwelling older adults. This research is innovative and important, and the results will help provide nursing staff with an important basis for caring for the frail elderly.
Aims
The aims of this study were as follows:
- To compare the homogeneity of the demographic characteristics, biomarkers, and health beliefs of experimental and control groups in pre-test.
- To investigate differences pre- and post- test in whole-body vibration training and control training regarding their effects on biomarkers and health beliefs, for prefrail community dwelling older persons.
- To investigate differences between experimental (whole-body vibration) group and control group regarding their effects on biomarkers and health beliefs.
2. Methods
2.1. Study Design
In this study, due to the consideration of regional and economic factors, non-random sampling was adopted, and two communities in northern Taiwan were selected as the experimental group and the control group. Therefore, a quasi-experimental design was employed. This study followed the Transparent Reporting of Evaluations with Nonrandomized Designs (TREND) guideline [8]. The experimental group participated in a 12-week whole-body vibration training that was conducted three times per week, with 5-min continuous vibration at 12-Hz frequency and 3-mm amplitude each time. The control group were provided with home DVDs on resistance exercise and manuals on preventing frailty. To ensure the older people indeed watched the DVD, a questionnaire was conducted on the evaluation of the contents of the DVD.
There were two reasons for the research with only registering retrospectively on clinicaltrials.gov (NCT04273308). First, we were not aware of the need to register the clinical trial in advance. Second, we did not realize that the research meets the criteria of a clinical trial, particularly as it was not a randomized controlled trial or medical or pharmaceutical trial.
2.2. Participants
Older adults (108 participants) who fulfilled the standards of prefrailty were engaged in this study. Unable to fully participate in the study for personal reasons were 18 participants. Finally, there were 42 people in the experimental group and 48 people in the control group. Inclusion criteria were as follows: (1) age 65 years or older and living in a community; (2) fully consciousness and able to communicate verbally; and (3) no severe cognitive disorder (Mini-Mental State Examination score > 24). Exclusion criteria were as follows: (1) impaired mobility after surgery in the past year; (2) serious disease such as cancer by self-report; and (3) severe hearing impairment and inability to fully understand and follow instructions. The participants were not blinded in assigning them to experimental and control groups.
2.3. Sample Size
According to the regression analysis formula of Cohen [10] and based on calculations through G-POWER 3.1.9 software, a minimum number of 40 participants each were required for the experimental and control groups to fulfil the power of test of 0.8, effect size of 0.5, and á-value of 0.05. The effect size is a numerical value that quantifies the intensity of a phenomenon.
2.4. Research Assessment
2.4.1. Prefrailty Assessment
Ensrud et al. [9] proposed the SOF (Study of Osteoporotic Fractures) index for identifying frailty. The SOF index consists of three indicators: (1) Over the past year, have you experienced unintentional weight loss of 3 kg (or more) or 5% of your body weight (or more)? (2) Are you able to rise from a chair without support five times in succession? (3) Do you feel that you lack energy? People who answer ‘yes’ to all three questions, two of the three questions, and one of the three questions are classified as “robust”, “frail”, and “prefrail”, respectively.
Morley et al. [11] assessed the properties of tools of the SOF index and Fried’s Frailty Phenotype index among general, community-dwelling older adults in Taiwan. Study findings showed a moderate association between Fried’s Frailty Phenotype index and the SOF index (p < 0.001). Results showed that the SOF index is a valid tool to evaluate frailty, especially for general, community-dwelling older adults in Taiwan.
Wang and other scholars [12,13] studied the sensitivity, specificity and accuracy of the SOF scale for elderly people over 65 with early cancer. The results showed that the sensitivity was 89.0%, the specificity was 81.1%, and the accuracy was 86.5%. The comparison of SOF index and CHS index in the identification of frailty screening shows that SOF has good predictability for frailty. The SOF assessment method is simple and easy to implement. It is applicable to the general community field, not limited to the clinical field, and has a certain level of reliability and validity, so it is used as a measure of frail elderly [13]. In 2018, a study of SOF indicators to evaluate the elderly in Taiwanese communities collected 471 elderly people over 65 years old in Taipei City as a sample, and used SOF indicators and Fried’s frailty indicators as tools for comparative analysis. The results showed that Fried’s frailty indicators and SOF indicators were different There is a moderate correlation (p <0.001). The effectiveness of AUC prediction shows that SOF has a significant predictive value for falls (p <0.001), and Fried’s frailty index predicts disability better (p <0.001) [14].
2.4.2. Demographic Status
In this study, the following demographic data were collected: age, sex, education level, living arrangements, number of illnesses, hospitalisation history over the preceding year (the experience of the participants admitted to hospital overnight during the previous 12 months), and experience of falling in the last year.
2.4.3. Biomarkers
Grip Strength
To test the maximal force of the upper limb muscles, the participants performed static contractions by using an electronic gripper. To measure the power of the upper limb muscles, each participant used each hand to grip the gripper twice [11]. A high grip strength score indicated higher muscle strength. The intraclass correlation coefficients (ICC) were 0.985 and 0.970 for the tests of left- and right-hand grip strength, respectively [12].
15-Foot Walk Test Speed
To assess their mobility, the participants walked at their normal speed to a 15-foot mark on the floor after the starting call. A stop watch was used to record the time (measured in sec) [13]. Shorter walking time indicated higher mobility. According to the retest reliability calculated by Kim et al. [14], the ICC of this test was 0.715–0.837.
One-Leg Standing Test
In this test, participants stood on their dominant leg and bent the other at a 90° angle, and the time (measured in sec) taken to maintain body balance in this posture was measured [15]. A longer one-leg standing time indicated more ideal body balance. According to the relative reliability determined by Mazaheri et al. [16], the ICC of this test was 0.73–0.80.
Thirty-Second Chair Stand Test
A chair stand test was performed to evaluate the muscle strength of the participants [17]. A higher number of chair stands within 30 s indicated higher lower limb muscle strength. According to the standards formulated and the health standards of older adults by Rikli and Jones [17], the validity coefficient (c) of the 30-sec chair stand test was 0.87, and its retest reliability consistency (phi coefficient, ö) was 0.70.
Two-Minute Step Test
The participants were required to raise their knees as many times as possible within 2 min [18]. A higher number of steps indicated higher muscle strength. In a physical fitness test conducted by Rikli and Jones [17] on 82 community-dwelling older adults aged 70 years or higher, the validity correlation coefficient (c) and retest reliability consistency (ö) of the 2-min step test were 0.91 and 0.79 (n = 68), and their results are applicable to the test conducted in the present study.
Health Beliefs
A structured questionnaire consisted of items on self-perceived morbidity of frailty (five items), self-perceived severity of frailty (five items), benefits of preventing frailty (five items), obstacles to preventing frailty (five items), and cues to action (six items). The participants’ responses were evaluated on a 5-point Likert scale (1 = strongly disagree and 5 = strongly agree). Higher scores for self-perceived morbidity of frailty, self-perceived severity of frailty, benefits of preventing frailty, and cues to action indicated more favourable health behaviours, but a higher score for obstacles to preventing frailty indicated more adverse health behaviours.
The items in the first draft were evaluated through expert validity to enhance the reliability and validity of the questionnaire. Four experts assessed the importance, relevance, and clarity of the questionnaire, and the resultant content validity was 0.80. The items were revised based on the experts’ suggestions and discussion. Cronbach’s α values were 0.79, 0.80, 0.83, 0.81, and 0.82 for self-perceived morbidity of frailty, self-perceived severity of frailty, benefits of preventing frailty, obstacles to preventing frailty, and cues to action, respectively [19,20].
2.5. Whole-Body Vibration Training
The whole-body vibration training is most effective in improving muscle strength and balance when implemented for 3 to 6 months [21,22,23]. Therefore, this study incorporated a 12-week whole-body vibration training programme. Three times per week, the participants stood on an i-vib6050 vibration platform, which was vibrated at 12-Hz frequency and 3-mm amplitude, for 5 min. The participants held onto a handle during platform vibration.
2.6. Statistical Analysis
Data analyses were performed using SPSS 22 (IBM SPSS, Armonk, NY: IBM Corp). Group data was used as the smallest unit being analysed to assess intervention effects. The data from the tests were analysed through descriptive statistics, an independent t test, and a paired sample t test. ANCOVA can be used to increase statistical power (the ability to find a significant difference between groups when one exists) by reducing the within-group error variance. An intraclass regression coefficient test was performed to assess the applicability of ANCOVA to the data. If applicability was verified, ANCOVA was then conducted; otherwise, the data were analysed using the Johnson–Neyman procedure [24].
3. Results
3.1. Homogeneity of the Demographic Characteristics, Biomarkers, and Health Beliefs between Experimental and Control Groups in Pretest
The intervention was conducted for 12 weeks. This study included a total of 108 prefrail older adults, who met the inclusion criteria, from two communities in Sanshing Township, Yilan County. In the experimental group, 42 older adults participated in all the 36 vibration training sessions; in the control group, 48 participants completed the control intervention (Figure 1). The homogeneity of the experimental and control groups was compared before their demographic characteristics, biomarkers, and health beliefs were compared. No significant differences were observed in demographic characteristics, except for sex, between the two groups (p > 0.05). In addition, the two groups were tested for the homogeneity of biomarkers and health beliefs, and the independent sample t was used for the homogeneity test. The results showed no significant difference (p > 0.05) (Table 1 and Table 2). Therefore, one-way ANCOVA was conducted using the groups as the independent variable and the pre-test results and sex as covariate variables to assess the intervention effectiveness. An intraclass regression coefficient homogeneity test was performed to assess the applicability of ANCOVA to the data. If applicability was verified, ANCOVA was then conducted on the data; otherwise, the data were analysed using the Johnson–Neyman procedure [24].
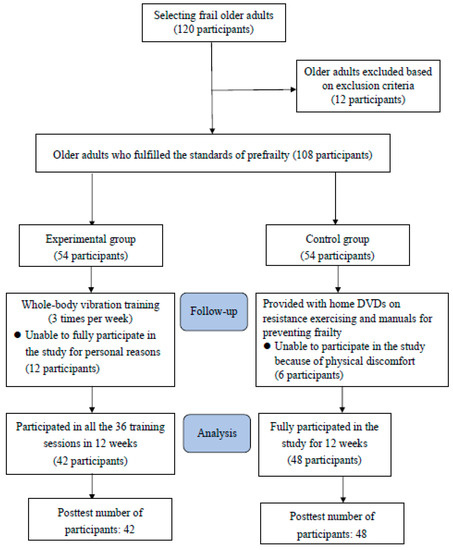
Figure 1.
Study Flow Chart.

Table 1.
The homogeneity of the demographic characteristics between experimental and control groups in pre-test.
Table 2.
The homogeneity of the biomarkers, and health beliefs between experimental and control groups in pre-test.
3.2. The Primary Outcome of Pre-Test and Post-Test Results of the Experimental and Control Groups for Biomarkers and Health Beliefs
After undergoing whole body vibration training for 12 weeks, the experimental group showed significant differences in the following categories in pre-test and post-tests: right hand grip strength (paired t = −3.36, p < 0.05), left hand grip strength (paired t = −4.79, p < 0.05), 15 feet walking speed (paired t = 11.03, p < 0.05), 30-second chair stand test (paired t = −9.28, p < 0.05), one-leg standing balance (paired t = −4.65, p < 0.05), 2-minute step test (paired t = −5.28, p < 0.05), perceived susceptibility of frailty (paired t = −16.83, p < 0.05), perceived seriousness of frailty (paired t = −14.98, p < 0.05), benefits of preventing frailty (paired t = −14.39, p < 0.05), barriers of preventing frailty (paired t = 7.11, p < 0.05), and cues to action (paired t = −13.19, p < 0.05) (Table 3).
Table 3.
Pre-test and post-test results of the experimental and control groups for biomarkers and health beliefs.
3.3. Effects of Whole-Body Vibration Training between Two Groups on Biomarkers
The homogeneity of the experimental and control groups were compared before their demographic characteristics, biomarkers, and health beliefs were compared. No significant differences were observed in demographic characteristics, except for sex, between the two groups (p > 0.05). Therefore, one-way ANCOVA was conducted using the groups as the independent variable and the pretest results and sex as covariate variables to assess the intervention effectiveness (Table 4).
Table 4.
Summary of post-test ANCOVA of the two groups for biomarkers and health beliefs.
The regression coefficient homogeneity test on the right-hand, left-hand grip strength, 15-foot walk test and bone density in the left foot reached significance (F = 10.37, p < 0.01; F = 4.79, p < 0.05; F = 8.79, p < 0.01; F = 34.36, p < 0.001), indicating that the regression lines of the two groups differed in their slopes. Therefore, the Johnson–Neyman procedure was used to analyze the data, as shown in Table 4 and Figure 2.
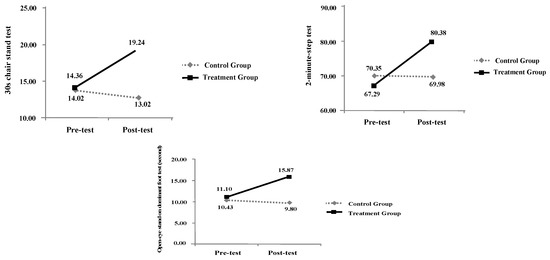
Figure 2.
Intraclass Regression Analysis of Biomarkers.
In addition, the regression coefficient homogeneity test on the 30-sec chair stand test, one-leg standing test, two-minute step test, bone density in the left foot and pulmonary function did not reach significance (F = 0.70, p > 0.05; F = 1.94, p > 0.05; F = 0.25, p > 0.05; F = 2.02, p > 0.05; F = 0.32, p > 0.05), indicating that the regression lines of the two groups exhibited identical slopes. This verified the assumption of homogeneity, indicating that the pretest–posttest differences for this biomarker did not differ according to group, as shown in Table 4 and Figure 3.
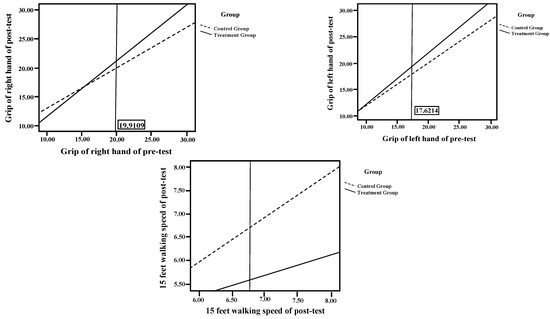
Figure 3.
Sampling Procedure.
3.4. Effects of Whole-Body Vibration Training on Health Beliefs
The regression coefficient homogeneity tests on self-perceived morbidity of frailty, self-perceived severity of frailty, and benefits of preventing frailty all reached significance (F = 12.10, p < 0.001; F = 21.19, p < 0.001; F = 26.05, p < 0.001), indicating that the regression lines of the two groups on all three beliefs differed in their slopes. Therefore, the Johnson–Neyman procedure was used to analyse the data on these health beliefs. After excluding the effects of pre-test results and sex on the post-test results for self-perceived obstacles of frailty, the two groups showed significant differences in their post-test results for self-perceived obstacles of frailty (Table 4 and Figure 3).
4. Discussion
4.1. Primary Outcome of Pretest and Posttest Results of the Experimental and Control Groups for Biomarkers and Health Beliefs
This is the first study to demonstrate the effects of a whole-body training intervention on the biomarkers and health beliefs of prefrail community-dwelling older adults. The results revealed that the experimental group demonstrated significantly improved posttest scores in hand grip strength, 15-foot walking speed, 30-second chair stand, 2-min step, and one-leg standing. These improvements might be attributable to whole-body vibration training enhancing the muscle strength of older people and facilitating their muscle balance and stability. Chang et al. [22] indicated that whole-body vibration training can stimulate neuromuscular contraction and thereby improve explosive muscular strength and power; in addition, such training can reach an intensity level similar to that of resistance training. Numerous studies have reported that whole-body vibration training increases muscular strength, the strength of the foot plantar flexion muscle, the leap distance, and the maximal oxygen uptake of older people, and reduces the time they require to stand up from sitting, increases their walking and movement speed, and improves their one-leg standing [22,25,26]. However, the intervention adopted in the present study spanned only 12 weeks. Longer interventions might be required to obtain more notable improvement [27]. In addition, the significant improvement observed in the present study may also have been caused by the placebo effect rather than the intervention effect of whole-body vibration training. Shepherd et al. [28] reviewed empirical studies on the placebo effect and discovered that health improvement effects may be due to the attendance of “health training”, which can be in any form of exercise. Petrie and Rief [29] indicated that experiments might exert no treatment effect on participants; however, because participants expect or believe that the experiments will be effective, their symptoms are alleviated, and experiments are mistaken to have discovered positive treatment effects. Therefore, further research focusing on psychological aspects, such as the placebo effect, is necessary in the future.
The present study discovered that the self-perceived morbidity of frailty, self-perceived severity of frailty, benefits of preventing frailty, and cues to action scores of the experimental group were significantly improved in the post-test compared with the pre-test; in addition, post-test scores regarding obstacles to preventing frailty were lower than pre-test scores. This indicates that most of the participants responded positively to the intervention. Petrie and Rief [29] reviewed empirical studies and discovered an important spontaneous message of the effect on results of the development of the health belief that “this intervention will cure me”. This health belief positively affects the prevention of frailty in older people. However, previous studies regarding interventions have not explored the health beliefs of prefrail older people. Therefore, in the future, further research focused on the health beliefs of prefrail older people is necessary.
4.2. Posttest ANCOVA of the Experimental and Control Groups for Biomarkers and Health Beliefs
According to the subsequent ANCOVA, the two groups showed substantial differences in the 30-sec chair stand test, one-leg standing test, 2-min step test, and left-foot bone density results after the intervention. This result indicated that whole-body vibration training in the experimental group was more effective than the DVDs on resistance training and the manuals provided to the control group on preventing frailty. The result of this study is similar to those of previous studies. Pérez-Turpin et al. [30] allocated 23 young adults to either an experimental (30–40 Hz, 1.7–2.5 mm) or control group (without vibration). Leg strength and jump performance were discovered to be improved by the intervention compared with traditional strength training. Chang et al. [22] adopted a quasi-experimental, single-group, pre-test–post-test design. Seventeen participants underwent three sessions each week, and each session comprised 10 repetitions, each lasting 60 s followed by a 30-s rest period. The results of the 2-min step test and foot bone density were improved by this intervention compared with the control training. In addition, according to the health beliefs analysis results, participants with higher scores for self-perceived morbidity and severity of frailty and lower scores for self-perceived obstacles were more prone to perform preventive health activities. After the intervention program, the posttest results for self-perceived morbidity and severity of frailty, the benefits of preventing frailty, and cues to action were higher than the pretest results, whereas the posttest results for self-perceived obstacles to frailty were lower than the pretest results. This indicated that most of the participants responded positively to the intervention program.
Our study has a number of limitations. First, this study lacked blinding of researchers and participants as well as random allocation of the participants. Additionally, because we recruited the experimental and control groups from different locations, the two study groups may have had not only different demographics but also different psychosocial conditions. Hence, the adjustment only of sex in the ANCOVA may not have been sufficient, and the generalizability of the study results may be limited. Second, older adults who underwent surgery in the previous month, those whose mobility and walking capabilities were affected by surgeries, and those with severe cardiovascular diseases (received coronary stent or bypass surgeries) were excluded from the study, thus affecting the external validity of the study and lowering its generalizability to all prefrail community-dwelling older adults. Third, since this research is not a randomized experimental research design, but a quasi-experimental design, it cannot fully follow the Intention-To-Treat analysis. Finally, because the attrition rate, or drop out, in an observational study with intervention is nearly always not at random, exclusion of missing data is always biased and affects the validity of the results.
5. Conclusions
Whole-body vibration training intervention was provided to prefrail community-dwelling older adults. This result verified that whole-body vibration training partly enhances the muscle strength, balance, and cues to action in the health beliefs of prefrail older adults. Planning activities that consider specific goals can further enhance the physical biomarkers and health beliefs of older adults, ensuring healthy ageing.
6. Implications for Future Research
According to this study, whole-body vibration training is useful for community-dwelling older adults. Government units should implement diverse exercise programs for community-dwelling older adults to increase their interest in healthcare topics and thereby improve their physical condition and health beliefs. Incorporating whole-body vibration training into the exercise strategy of community-dwelling older adults is recommended.
Author Contributions
S.F.-C.: Study Design, Data Collection and Analysis, Manuscript Preparation. H.C.-Y.: Data Collection and Analysis. W.C.: Manuscript Preparation. All authors have read and agreed to the published version of the manuscript.
Funding
This study was founding by the Ministry of Science and Technology Grant MOST 108-2622-B-227-001-CC2 in Taiwan and Cardinal Tien Hospital Grant CTH110A_NHS_2235 in Taiwan.
Institutional Review Board Statement
This study passed the review and ethical approval by the Behavioral and Social Sciences Research Ethics Office of National Taiwan University (IRB-Reference Code: 20ES014).
Informed Consent Statement
Informed consent was obtained from all subjects involved in the study
Data Availability Statement
Data can be accessed from the corresponding author on reasonable request
Acknowledgments
We are grateful to all respondents of this study and workers for their cooperation.
Conflicts of Interest
The authors declare that they have no competing interests.
References
- WHO (The World Health Organization). Report of the World Health Organization. Active ageing: A policy framework. Aging Male 2002, 5, 1–37. [Google Scholar] [CrossRef]
- Ministry of Internal Affairs, the Executive Yuan, ROC. Annual Census Report in Taiwan Area 2019; Ministry of Internal Affairs, The Executive Yuan, ROC: Taipei City, Taiwan, 2019. Available online: https://www.moi.gov.tw/stat/news_detail.aspx?sn=13742 (accessed on 19 July 2019).
- Bloom, D.; Canning, D.; Lubet, A. Global population aging: Facts, challenges, solutions & perspectives. Daedalus 2015, 144, 80–92. [Google Scholar]
- Harper, S. Economic and social implications of aging societies. Science 2014, 346, 587–591. [Google Scholar] [CrossRef]
- Chang, S.; Lin, P.; Yang, R.; Yang, R. The preliminary effect of whole-body vibration intervention on improving the skeletal muscle mass index, physical fitness, and quality of life among older people with sarcopenia. BMC Geriatr. 2018, 18, 17. [Google Scholar] [CrossRef] [PubMed]
- Fried, L.P.; Tangen, C.M.; Walston, J.; Newman, A.B.; Hirsch, C.; Gottdiener, J.; Seeman, T.; Tracy, R.; Kop, W.J.; Burke, G.; et al. Frailty in older adults evidence for a phenotype. J. Gerontol. A Biol. Sci. Med. Sci. 2001, 56, M146–M156. [Google Scholar] [CrossRef] [PubMed]
- Navarro-Flores, E.; Romero-Morales, C.; Becerro de Bengoa-Vallejo, R.; Rodríguez-Sanz, D.; Palomo-López, P.; López-López, D.; Calvo-Lobo, C. Sex Differences in Frail Older Adults with Foot Pain in a Spanish Population: An Observational Study. Int. J. Environ. Res. Public Health 2020, 17, 6141. [Google Scholar] [CrossRef]
- Chang, S.F.; Lin, P.L. Frail phenotype and mortality prediction: A systematic review and meta-analysis of prospective cohort studies. Int. J. Nurs. Stud. 2015, 52, 1362–1374. [Google Scholar] [CrossRef]
- Navarro-Flores, E.; de Bengoa Vallejo, R.B.; Losa-Iglesias, M.E.; Palomo-López, P.; Calvo-Lobo, C.; López-López, D.; Romero-Morales, C. The reliability, validity, and sensitivity of the Edmonton Frail Scale (EFS) in older adults with foot disorders. Aging 2020, 12, 24623. [Google Scholar] [CrossRef]
- Ensrud, K.E.; Ewing, S.K.; Taylor, B.C.; Fink, H.A.; Cawthon, P.M.; Stone, K.L.; Hillier, T.A.; Cauley, J.A.; Hochberg, M.C.; Rodondi, N.; et al. Comparison of 2 frailty indexes for prediction of falls, disability, fractures, and death in older women. Arch. Intern. Med. 2008, 168, 382–389. [Google Scholar] [CrossRef]
- Morley, J.E.; Malmstrom, T.K.; Miller, D.K. A simple frailty questionnaire (FRAIL) predicts outcomes in middle aged African Americans. J. Nutr. Health Aging 2012, 16, 601–608. [Google Scholar] [CrossRef]
- Wang, N.; Weng, C.S.; Liu, L.M.; Jiao, W.G.; Zhu, C.X. Test-retest reliability of grip strength assessment in bed-ridden Senile patients. Chin. J. Rehabil. Theory Pract. 2009, 15, 259–260. [Google Scholar]
- Cohen, J. Statistical Power Analysis for the Behavioral Sciences, 2nd ed.; Academic press: Cambridge, MA, USA, 1988. [Google Scholar]
- Guralnik, J.; Winograd, C. Physical performance measures in the assessment of older persons. Aging 1994, 6, 303–305. [Google Scholar] [CrossRef] [PubMed]
- Kim, H.J.; Park, I.; Joo Lee, H.; Lee, O. The reliability and validity of gait speed with different walking pace and distances against general health, physical function, and chronic disease in aged adults. J. Exerc. Nutr. Biochem. 2016, 20, 46–50. [Google Scholar] [CrossRef]
- Springer, B.; Marin, R.; Cyhan, T.; Roberts, H.; Gill, N. Normative values for the unipedal stance test with eyes open and closed. J. Geriatr. Phys. Ther. 2007, 30, 8–15. [Google Scholar] [CrossRef] [PubMed]
- Mazaheri, M.; Salavati, M.; Negahban, H.; Parnianpour, M. Test-retest reliability of postural stability measures during quiet standing in patients with a history of nonspecific low back pain. Biomed. Eng. 2010, 22, 255–262. [Google Scholar] [CrossRef]
- Rikli, R.E.; Jones, C.J. Development and validation of criterion-referenced clinically relevant fitness standards for maintaining physical independence in later years. Gerontologist 2013, 53, 255–267. [Google Scholar] [CrossRef] [PubMed]
- Chang, S.F.; Yang, R.S.; Lin, T.C.; Chiu, S.C.; Chen, M.L.; Lee, H.C. The discrimination of using the short physical performance battery to screen frailty for community-dwelling elderly people. J. Nurs. Scholarsh. 2014, 46, 207–215. [Google Scholar] [CrossRef] [PubMed]
- Marín, F.; González-Macías, J.; Díez-Pérez, A.; Palma, S.; Delgado-Rodríguez, M. Relationship between bone quantitative ultrasound and fractures: A meta-analysis. J. Bone Miner. Res. 2006, 21, 1126–1135. [Google Scholar] [CrossRef]
- Sun, L.Y.; Gershon, A.S.; Ko, D.T.; Thilen, S.R.; Yun, L.; Beattie, W.S.; Wijeysundera, D.N. Trends in pulmonary function testing before noncardiothoracic surgery. JAMA Intern. Med. 2015, 175, 1410–1412. [Google Scholar] [CrossRef][Green Version]
- Chen, K.W.; Chang, S.F.; Lin, P.L. Frailty as a predictor of future fracture in older adults: A systematic review and meta-analysis. Worldviews Evid. Based Nurs. 2017, 14, 282–293. [Google Scholar] [CrossRef]
- Chang, S.; Lin, H.; Cheng, C. The relationship of frailty and hospitalization among older people: Evidence from a meta-analysis. J. Nurs. Scholarsh. 2018, 50, 383–391. [Google Scholar] [CrossRef] [PubMed]
- Wei, N.; Pang, M.; Ng, S.; Ng, G. Optimal frequency/time combination of whole body vibration training for developing physical performance of people with sarcopenia: A randomized controlled trial. Clin. Rehabil. 2017, 31, 1313–1321. [Google Scholar] [CrossRef] [PubMed]
- Johnson, P.O.; Neyman, J. Tests of certain linear hypotheses and their application to some educational problems. Stat. Res. Mem. 1936, 1, 57–93. [Google Scholar]
- Furness, T.P.; Maschette, W.E. Influence of whole body vibration platform frequency on neuromuscular performance of community-dwelling older adults. J. Strength Cond. Res. 2009, 23, 1508–1513. [Google Scholar] [CrossRef] [PubMed]
- Rees, S.S.; Murphy, A.J.; Watsford, M.L. Effects of whole body vibration on postural steadiness in an older population. J. Sci. Med. Sport 2009, 12, 440–444. [Google Scholar]
- Bemben, D.; Stark, C.; Taiar, R.; Bernardo-Filho, M. Relevance of whole-body vibration exercises on muscle strength/power and bone of elderly individuals. Dose-Response 2018, 16, 1–8. [Google Scholar] [CrossRef] [PubMed]
- Shepherd, A.I.; Gilchrist, M.; Winyard, P.G.; Jones, A.M.; Hallmann, E.; Kazimierczak, R.; Rembialkowska, E.; Benjamin, N.; Shore, A.C.; Wilkerson, D.P. Effects of dietary nitrate supplementation on the oxygen cost of exercise and walking performance in individuals with type 2 diabetes: A randomized, double-blind, placebo-controlled crossover trial. Free Radic. Biol. Med. 2015, 86, 200–208. [Google Scholar] [CrossRef]
- Petrie, K.J.; Rief, W. Psychobiological mechanisms of control and nocebo effects: Pathways to improve treatments and reduce side effects. Ann. Rev. Psychol. 2019, 70, 599–625. [Google Scholar] [CrossRef]
Publisher’s Note: MDPI stays neutral with regard to jurisdictional claims in published maps and institutional affiliations. |
© 2021 by the authors. Licensee MDPI, Basel, Switzerland. This article is an open access article distributed under the terms and conditions of the Creative Commons Attribution (CC BY) license (https://creativecommons.org/licenses/by/4.0/).