1. Introduction
Human activity recognition (HAR), which is one of the branches of pattern recognition, has received great attention in both the research and industry sectors. HAR can help to discover a deep understanding in various contexts, such as kinematics, human–computer interaction and health surveillance. A wide variety of applications are implemented centering on HAR, for instance, rehabilitation activities [
1], human activity-based recommendation systems [
2], gait analysis [
3] and kinematics analysis [
4,
5,
6].
HAR can be classified in two types: video-based HAR and sensor-based HAR. For video-based HAR, the human motion is recorded using a video camera and the video is analyzed to perform activity classification later. As for sensor-based HAR, sensors such as accelerometers, gyroscopes and depth sensors are used to collect data from the agent. The sensor data collected are then analyzed on a computing platform to discover the similarities and differences between each activity prior to classification. Due to the recent advances in the Internet of Things (IoT) and sensors, such as inertia measurement unit (IMU) sensors, a large amount of personalized data can be collected and analyzed for HAR.
Conventional approaches in machine learning were performed on HAR, such as decision tree, support vector machine, Naive Bayes, and hidden Markov model [
7,
8]. Although these models have produced excellent results on HAR in a controlled environment and in a careful feature selection process, feature engineering is a huge burden for anyone who has no domain knowledge on the field. Most conventional learning can only detect and classify in simple activity or locomotion, but when using a deep learning approach, a robust activity can also be classified using the presence of big data.
However, recent progress in the area of deep learning has brought supervised, unsupervised, and semi-supervised learning in machine learning in a new era, which has achieved enormous results in different fields, such as object recognition [
9], natural language processing [
10] and logic reasoning [
11]. Combining a deep learning model with a high computing platform can accelerate the high-level learning process and features present in the raw sensor data with a neural network from end-to-end.
Current research on HAR in deep learning focuses mainly on model design and hyperparameter tuning. Furthermore, the imbalanced class distributions of the dataset can degrade the model performance during the deployment phase. Therefore, experiments have been designed to study this phenomenon and propose an approach to solve this problem. In addition, for its practical implementation, an upper body activity recognition model has been developed using only five IMU sensors using the deep ConvLSTM network. With the reduction in the number of sensors, it is still able to achieve a performance comparable to the original implementation that used 12 accelerometers and seven IMUs. Upper body activity recognitions are useful for the assessment of home-based rehabilitation that are, in particular, related to activities of daily living.
The main contributions of this paper are as follows:
A hybrid model was developed for HAR using IMU data.
The random undersampling method and multiclass focal loss function were applied to address the imbalanced dataset that will occur in real-life human activity recognition applications.
A high-performance deep model was developed using a smaller dataset and a reasonable result was achieved compared to other implementations.
The rest of the paper is organized as follows:
Section 2 describes the related works on human activity recognition in deep learning. The proposed methods are described in
Section 3, while the experimental result of the proposed method is discussed in
Section 4. Finally,
Section 5 concludes the paper.
2. Related Work
HAR is the study to understand the activity that is performed by the agent using sensor data. HAR aims to identify and classify the activity conducted by the agent using a model with minimum error. Conventional machine learning methods, such as support vector machine [
12], random forest [
13] and logistic regression [
14] require hand-crafted features from the dataset. This is a challenge for sensory-based datasets because of the large size of the dataset and presence of noise in the data. In addition, it also requires expertise in the HAR domain to extract only the significant features as the hand-crafted feature to produce a good performance of the model.
Recently, deep learning has been applied in many challenging research areas, such as computer vision and natural language processing. In these tasks, deep learning has out-performed previous algorithms and machine learning models. The advantage of using deep learning is that the model can learn a complex representation in the large size of a dataset without the need to preprocess the feature and for deep expert knowledge on a domain.
2.1. Sensor-Based HAR
Due to the recent improvements in IoT devices and sensors, wearable sensors are widely used in most electronic devices, such as smartphones, watches, and bands. These data can be used to analyze and interpret body movements. However, the performance of an activity recognition system depends mainly on the sensor modality. Some of the widely used wearable sensors are accelerometers, inertia measurement unit (IMU) sensors, electromyography (EMG) sensors, and electrocardiography (ECG) sensors. Among these types of sensors, accelerometers and IMU are the most used in HAR.
An accelerometer can be used to measure the acceleration of the object. In HAR, it is usually mounted on the body parts, such as the waist [
15], arm [
16], ankle [
17], and wrist [
18]. In addition to the accelerometer, IMU is one of the choices that have been widely chosen due to the reason that it can measure strength, angular velocity and orientation in the fulcrum part of the body. They are made possible from the incorporation of accelerometers, gyroscopes, and magnetometers inside the IMU sensors. Changes in pitch, roll, and yaw in the IMU sensor can help detect body movement.
2.2. Convolutional Neural Network in HAR
The convolutional neural network (CNN) is one of the deep learning architectures which are widely implemented for applications such as image classification, speech recognition, and natural language processing. It stands out from three important ideas, which are the following: sparse interactions, parameter sharing, and equivariant representations [
15]. There are several outstanding architectures in CNN, for example LeNet [
19], AlexNet [
20], GoogLeNet [
21], VGGNet [
22] and ResNet [
23]. These architectures have greatly improved CNN’s performance.
The existing works [
24,
25,
26,
27,
28] have shown that CNN can classify HAR with high accuracy. A CNN-based feature extraction method was adopted to extract the local dependency and scale-invariant characteristics in time series data. A CNN approach [
24] was used to extract the feature representation of activity and the variation of activities can be analyzed by the model. They also conducted test on three public datasets which are SKODA, OPPORTUNITY, and Actitracker. The model consists of a pair of convolution layers and one max-pooling layer, followed by two fully connected layers.
In [
25], tri-axial acceleration data were collected by the single accelerometer to perform the activity classification using CNN. The model was trained in eight different classes of activities that include falling, running, jumping, walking, walking quickly, step walking, walking upstairs, and walking downstairs.
Actigraphy sensors were used in [
26] to collect actigraphy data during sleep to study sleep and physical activity patterns. Physical activity data were collected during the awake time and used to assess the sleep quality of the subject in poor or good sleep efficiency. It showed that the CNN model has the highest specificity and sensitivity compared to all other methods used in the experiments.
In [
27], they compared performance between the deep learning model and machine learning model. In their experiments, the CNN model outperforms the entire machine learning model in HAR in both the public datasets that are the OPPORTUNITY dataset [
29] and Hand Gesture dataset. The transfer learning in CNN [
28] was performed to evaluate the effectiveness of the CNN’s structure framework in adapting data collected by different types of sensors. A study has been conducted on transfer learning for sensor data between the different users, application domain, sensor modality, and sensor location. In their results, CNN can be used to conduct training and adapt to different datasets effectively and reduce training time.
2.3. Recurrent Neural Network in HAR
A recurrent neural network (RNN) that differs from CNN is appropriate for calculating temporal correlations between neurons and widely used in applications such as speech recognition and natural language processing. Since RNN sequentially receives input, it is undoubtedly the previous input that has less influence on the final prediction results. To solve this shortcoming in RNN, long short-term memory (LSTM) [
30] was introduced. LSTM solves the problem of the disappearance gradient in RNN and can accept larger time steps of data than the RNN architecture.
Existing work on HAR using RNN mainly focus on optimizing learning speed and resource consumption. The high recognition and training speed were able to be achieved by using an RNN model with a high throughput [
31]. A new approach [
32] has also been introduced by using the binary number on all parameters in the hidden layer for RNN which has achieved promising results in the OPPORTUNITY dataset. In addition, the execution time and memory consumption of the model are better than other existing methods.
2.4. Hybrid Neural Network in HAR
The presence of a hybrid model is intended to overcome the shortcomings of both the CNN and RNN neural networks. CNN is good in learning sparse representation from the input data while RNN has better performance in learning temporal representation from the input data. Thus, the idea of a hybrid model is to combine these two modules and allow the model to learn the rich representation of the data in the form of spatial and temporal feature representation.
In [
33], CNN and LSTM were combined to perform HAR. The input was fed into the CNN structure followed by the LSTM module. Therefore, the hybrid model works better than using only CNN or RNN alone. The model was able to learn a rich representation from the data provided. In [
34], a CNN and gated recurrent unit (GRU) model framework was introduced. The same architecture as [
33] was applied in his work. With this result, he demonstrated that the model could be well generalized on three different public datasets and produce a consistent result with this hybrid structure.
2.5. Handling Imbalanced Dataset in Machine Learning
An imbalanced dataset refers to the dataset that has an unequal distribution for the classes in the dataset where the number of samples for the majority class is much more than for the minority classes. There is an imbalanced class when the data are unevenly distributed in classes that can normally occur during the data collection phase. This phenomenon will cause the classifier to have biased performance toward the majority data. The error rate of minority classes is not significant due to the small number of samples.
In [
35], several methods to deal with oversampling and undersampling for the imbalanced dataset were discussed and evaluated. There are various types of sampling methods to be used to tackle the imbalanced dataset acquired from wireless sensors. An inverse random undersampling method [
36] was applied to produce several training datasets. By using these newly produced datasets from random undersampling for model training, the model’s performance increases compared with the model without using this approach.
In [
37], a loss function-based optimization, named Focal Loss, was introduced to optimize the model during training without any preprocessing on the dataset. It is more effective and easier to learn from hard examples that are minority classes using loss function-based optimization for model training. A suitable technique for handling an imbalanced dataset, whether it is resampling the dataset or a loss-function based optimization, can help the model achieve better performance in an imbalanced dataset.
3. Proposed Architecture
This article used the OPPORTUNITY [
29] dataset as the benchmark dataset. It contains data from accelerometers and IMU sensors of four subjects. The reasons for choosing this dataset as a benchmark dataset are as follows:
The dataset contains annotated data for high-level activity classes (for example open drawer, open door, close door) and these activities are related to activities of daily living using IMU sensors.
The dataset has imbalanced class distributions, and the same problem will occur during the data collection phase. Therefore, a method is needed to train the model with an imbalanced dataset.
Using the weights of the model obtained from this dataset and the transfer learning approach, the knowledge gained can be used to improve the generalization of research in the assessment of rehabilitation progress.
Several experiments were designed to study the problem of class imbalance that is usually observed in the real-life sensor dataset. In terms of model selection, a deep ConvLSTM [
33] model was used as a benchmark model to assess the performance of the model developed after applying the data resampling method in the imbalanced dataset. An upper body activity recognition model was developed using a deep ConvLSTM architecture with a reduced number of sensor data and the results were compared with the original implementation.
3.1. Dataset Details
The dataset consisted of multiple sensor data collected from four subjects. There are 18 classes of high-level activities that are performed by each participant. The details of OPPORTUNITY Activity Recognition Dataset can be found in
Table 1 and
Table 2. The guideline given in the OPPORTUNITY challenge was followed to ensure that the results were comparable to current research and other state-of-the-art technologies that used this dataset for HAR. As shown in
Table 3, run 5 from Subject 1 was used as the validation set while runs 4 and 5 from Subjects 2 and 3 were used as test datasets. The filename convention was S1-ADLx where x is the run number. The remaining data were used as the training set. The details of the training dataset, the validation dataset and the test dataset are shown in
Table 3.
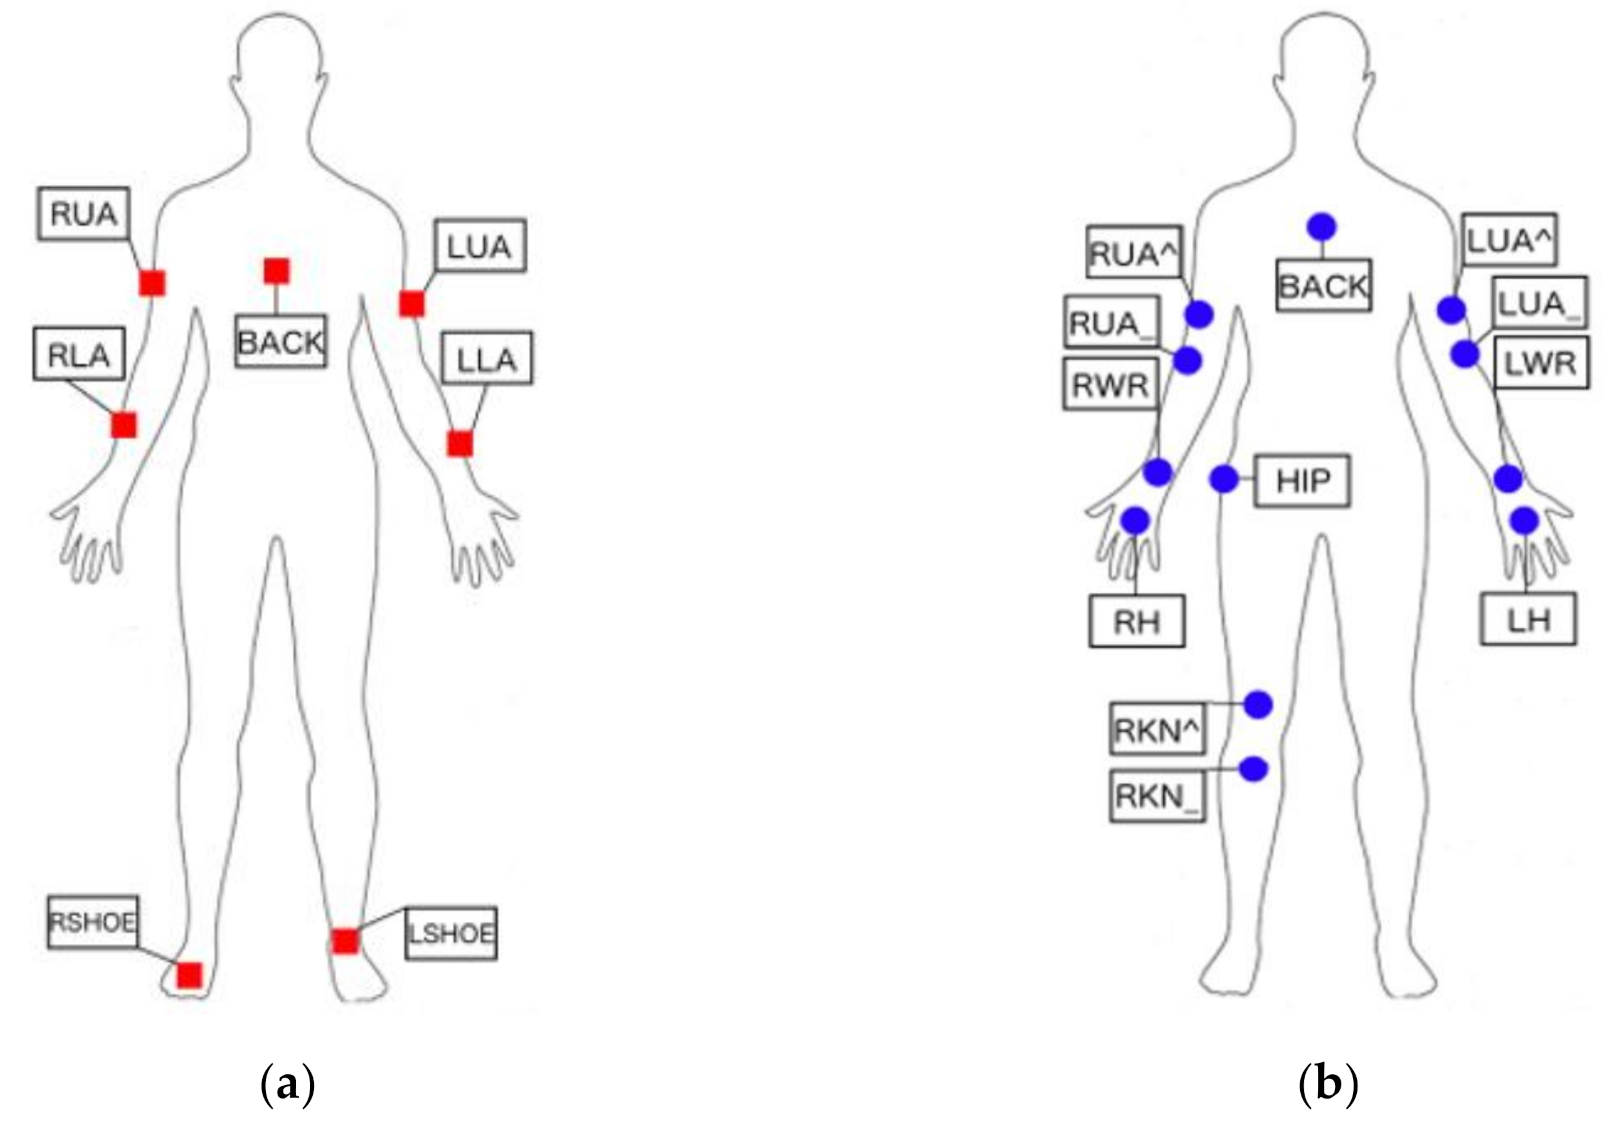
Figure 1 shows the sensor positions on the human body. The abbreviations of the OPPORTUNITY dataset used in
Figure 1 can be found in
Appendix A.
3.2. The Imbalanced Dataset
Imbalanced data typically refers to a classification problem in which the number of samples per class is not equally distributed. The usual phenomena in an imbalanced dataset are one of the sample classes has a very high number of samples, which is also known as the majority class, while there are classes in which the number of samples is much lower than the majority class. The training process using a high imbalanced dataset can be a challenge, as most of the metrics used to evaluate model performance assume that the dataset is well distributed.
In the OPPORTUNITY dataset, the majority of the classes were found to be 40 times larger than the minority classes. This strong difference in class distribution led to the model learning the representation of the majority classes well, but not that of the minority classes. However, there is a need to train and develop the model to identify minority classes, which are the activities aside from NULL (no activity) stated in
Table 2 which represent real-life scenarios; hence, further feature engineering and handling strategies are needed to work on this dataset before the model is trained.
To address the problem of the imbalanced dataset, a resampling approach was applied to the OPPORTUNITY dataset. The undersampling method was used to reduce the size of the majority class, which is the NULL class in the OPPORTUNITY dataset. In order to apply undersampling, firstly the NULL class data were segmented out from the original dataset. Then, part of the NULL class data of each subject was randomly selected and combined with the training dataset before feeding them into the training pipeline. In the experiment, for each subject, 10% of the original NULL-class data was selected from the dataset.
In addition, a focal loss function [
37] was used to address the issue of the class imbalance problem without the resampling method. It can transfer between the object detection domain to the sensor classification domain. This approach can reduce the relative loss toward well classified examples in the majority class and draw attention to model optimization in hard, misclassified examples in the minority classes.
3.3. Model Architecture
The structure of Deep ConvLSTM [
33] is composed of convolutional and LSTM recurrent layers, respectively designed to learn the sparse feature representation and to model the temporal dependencies between each activation of the feature representation. The architecture of the model is shown in
Figure 2. The input data presented in the input layer are the sensory data that were preprocessed earlier. Four 1D convolutional layers were used to extract the spatial feature representation of the input data and then the output was fed to the stacked LSTM layer, where the second LSTM used the outputs of the first LSTM and computed the result. The output of the LSTM layer was fed to the dropout layer with a probability of 0.5. Finally, the linear layer with linear transformation was applied to generate the probability output for each class of activity.
3.4. Learning Algorithm
The PyTorch [
38] framework was used to perform the training and testing of the HAR model. The model was developed using Pytorch’s API and was trained using the algorithm shown in Algorithm 1. The cross-entropy loss and focal loss, as shown in Equations (1) and (2), were used as the model optimization loss, respectively. During the training process, an early stop strategy was applied to track the model’s validation loss and prevent the model from overfitting. If the model’s validation loss did not decrease in five training loops, the progression of the training was stopped.
where
is the score of positive class in
C, and
is the hyperparameter gamma for focal loss.
| Algorithm 1: Model learning algorithm |
Input: Training set DT = {(X1, Y1), (X2, Y2), …, (Xn, Yn)};
Training set DV = {(X1, Y1), (X2, Y2), …, (Xn, Yn)};
DeepConvLSTM model M;
Number of training set NT;
Number of validations set NV;
and epoch E;
Output: H(DT) which is the class label of the training sample DT
H(DV) which is the class label of the validation sample DV
Process:
1. For i = 1: E
2. For j: NT
3. H(DT) = M(DT);
4. For k: NV
5. H(DV) = M(DT);
6. If H(DV) <= previous H(DV)
7. I++
8. Else
9. I = 0
10. If I = 5
11. Break loop
12. End For |
3.5. Experimental Design
By using the OPPORTUNITY dataset, three comparative experiments were conducted with different configurations and parameters. In Experiment 1, the Deep ConvLSTM network was developed to train the original dataset, consisting of 113 channels of accelerometers and IMU sensors. Data were normalized, and linear interpolation was performed to fix the missing data. The sliding window approach has been used to increase the number of samples required for training and testing. The training process is summarized in
Figure 3. In Experiment 2, the undersampling method was applied in the data preprocessing stage where the NULL class was resampled prior to model training. In Experiment 3, the number of sensors in the dataset was reduced to only five IMU sensors, consisting of RUA, RLARLA, BACK, LUA, and LLA. Using only the five IMU sensors, the number of features used for model development were also reduced. In addition, the number of IMU sensors required in the deployment phase were reduced.
3.6. Evaluation Criteria
The evaluation metrics commonly used to evaluate the performance of the HAR model are accuracy, F1-score, recall, and Area Under the Curve (AUC). However, as the OPPORTUNITY dataset is extremely imbalanced, the NULL class accounts for 70% of all classes in this dataset. This represents real-life scenarios, and the classifier predicts NULL class with very high accuracy. Therefore, accuracy is not an appropriate index for performance evaluation in an imbalanced dataset.
In addition to the model accuracy, the F1-score was used as the model evaluation metrics. F1-score is the common evaluation metric used to evaluate the developed model using an imbalanced dataset as it shows the balance between the precision and the recall. The relative contribution of precision and recall to the F1-score are equal. Therefore, the combination of the F1-score, confusion matrix and model accuracy can help in identifying the best model for this application, especially in handling imbalanced datasets. The two metrics were calculated using the following formula:
where
n and
CN denote the class number and total class number respectively, and variables
TPn, FPn,
TNn, and
FNn are true positive, false positive, true negative, and false negative of the class
n, respectively.
4. Result and Discussion
4.1. Training and Testing on Original OPPORTUNITY Dataset
The Deep ConvLSTM model was implemented following the details in the previous literature [
33]. In this benchmark model, 113 channels consisting of accelerometers and IMU sensors were used. The distributions of data for the training, validation and test are shown in
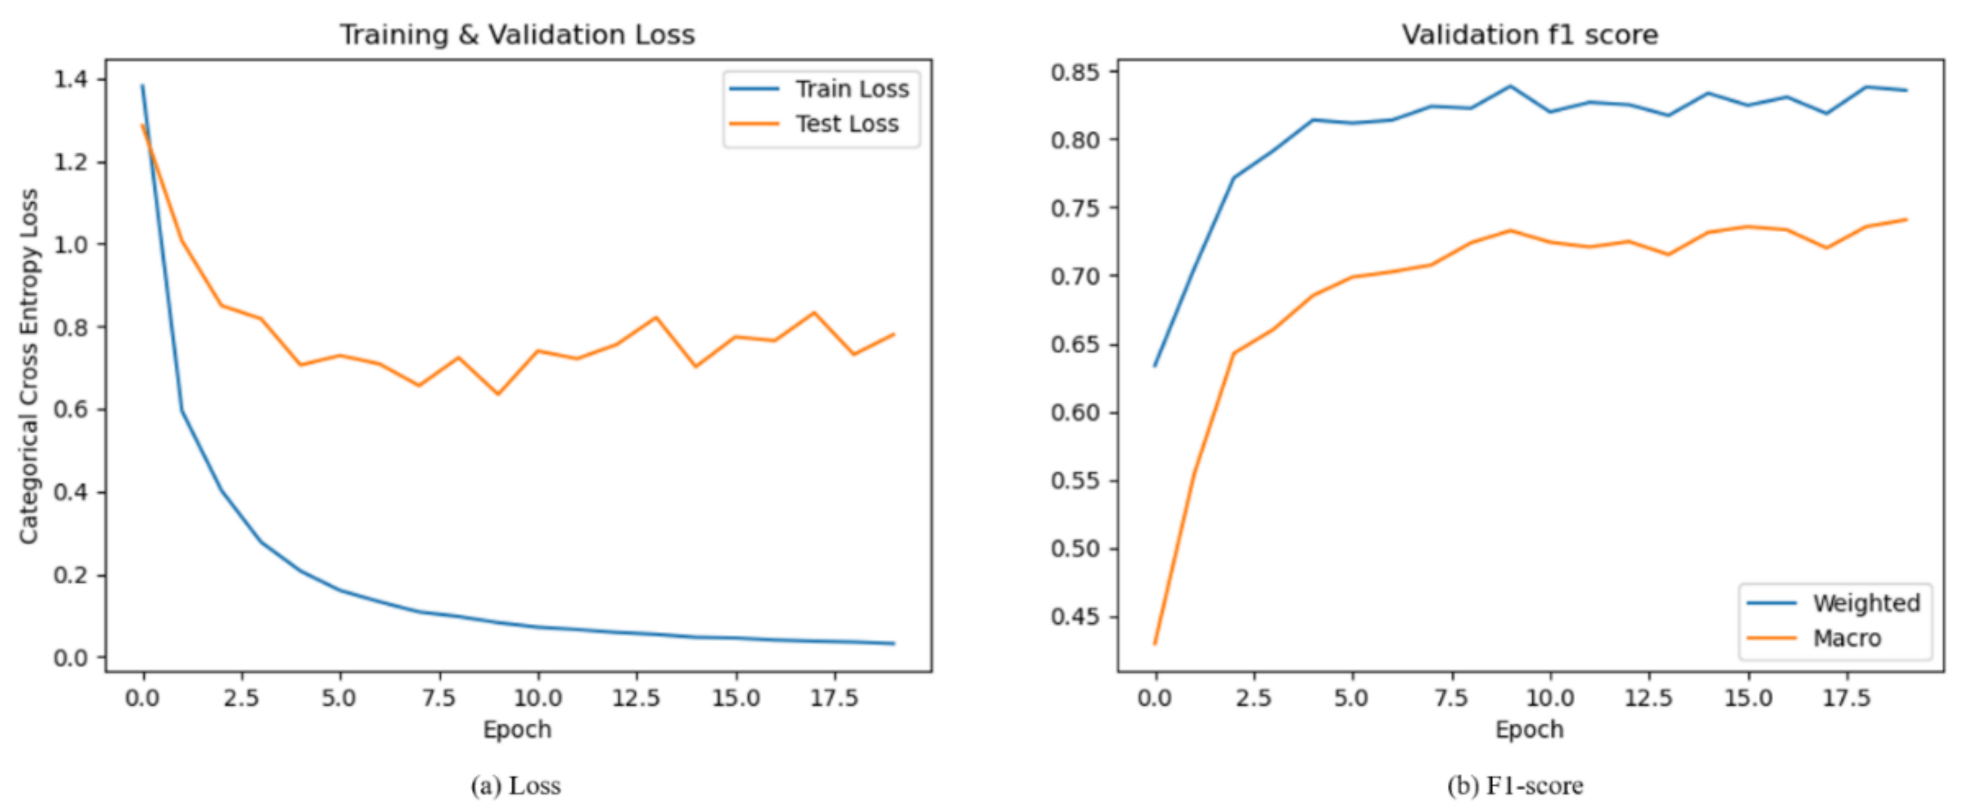
Figure 4. As shown in
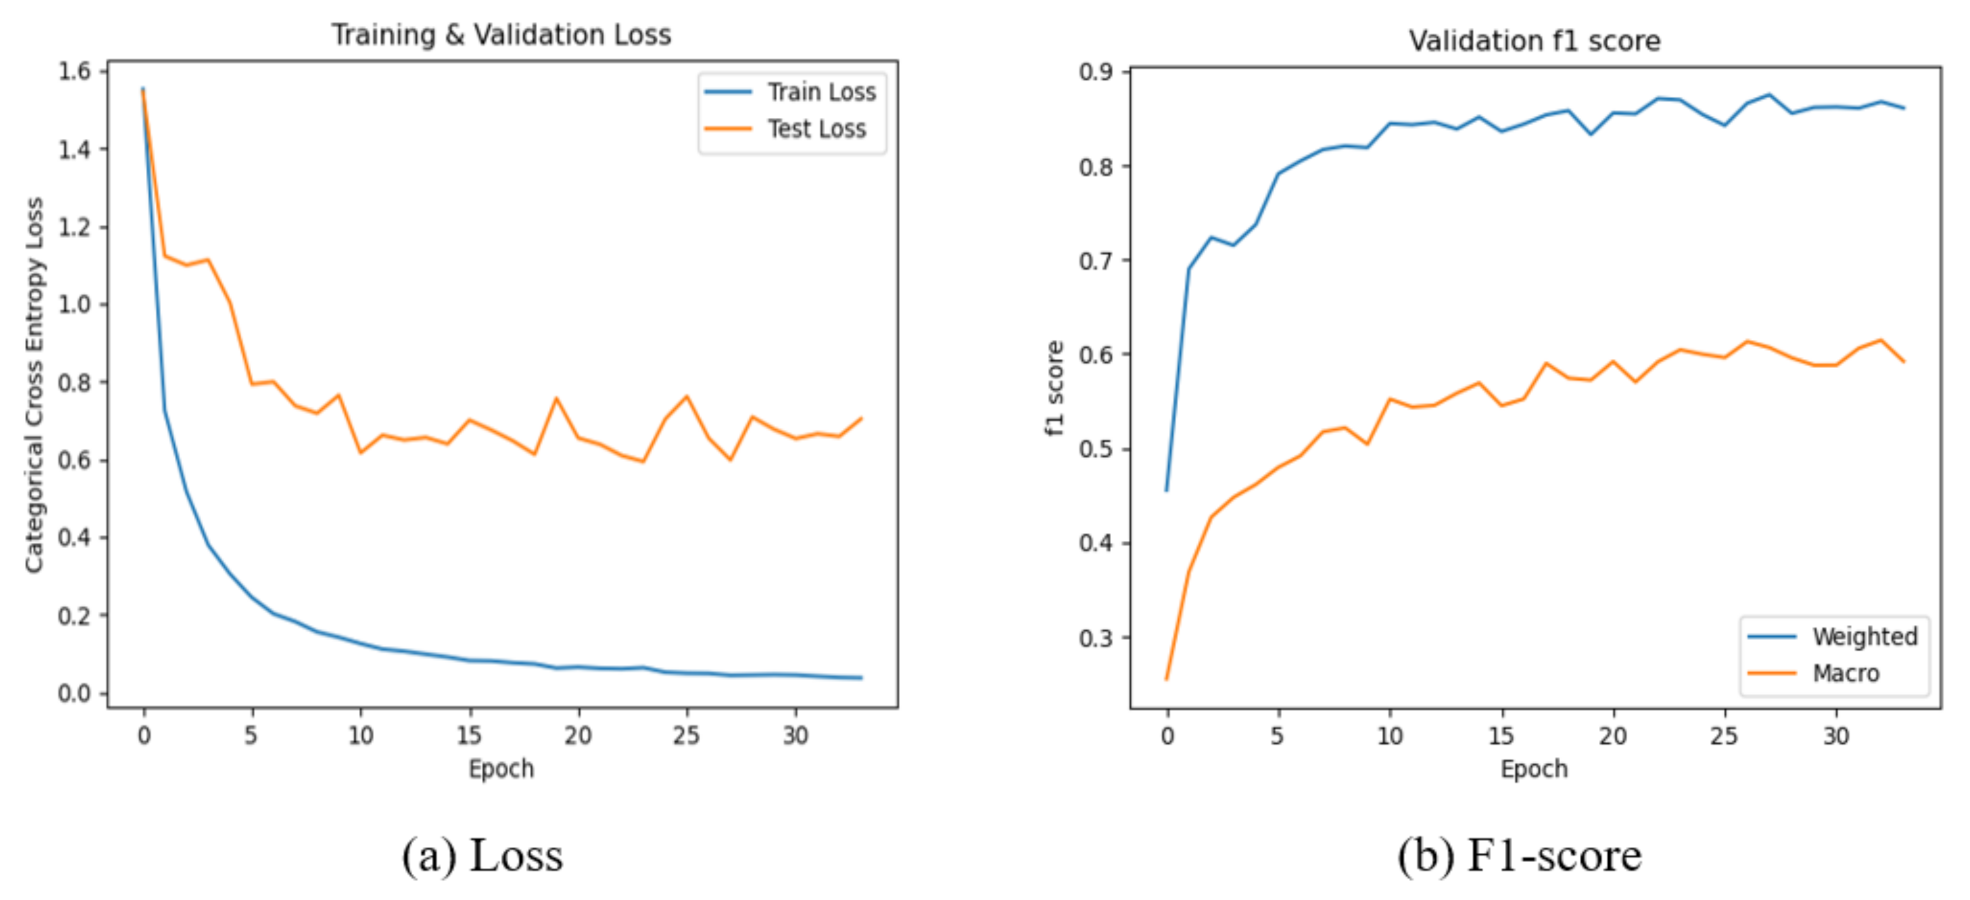
Table 3, the validation dataset consists of only one subset of subject 1, which is S1-ADL5. The training dataset consists of samples from subject 1, subject 2 and subject 3. Therefore, the model presents a greater gap between the training and validation loss (
Figure 5a).
Based on the distribution of the dataset as shown in
Figure 4, the imbalanced class distribution was clearly observed. The NULL class numbers were high compared to the other classes in this dataset. The model training result consisting of the loss curve for training and validation are shown in
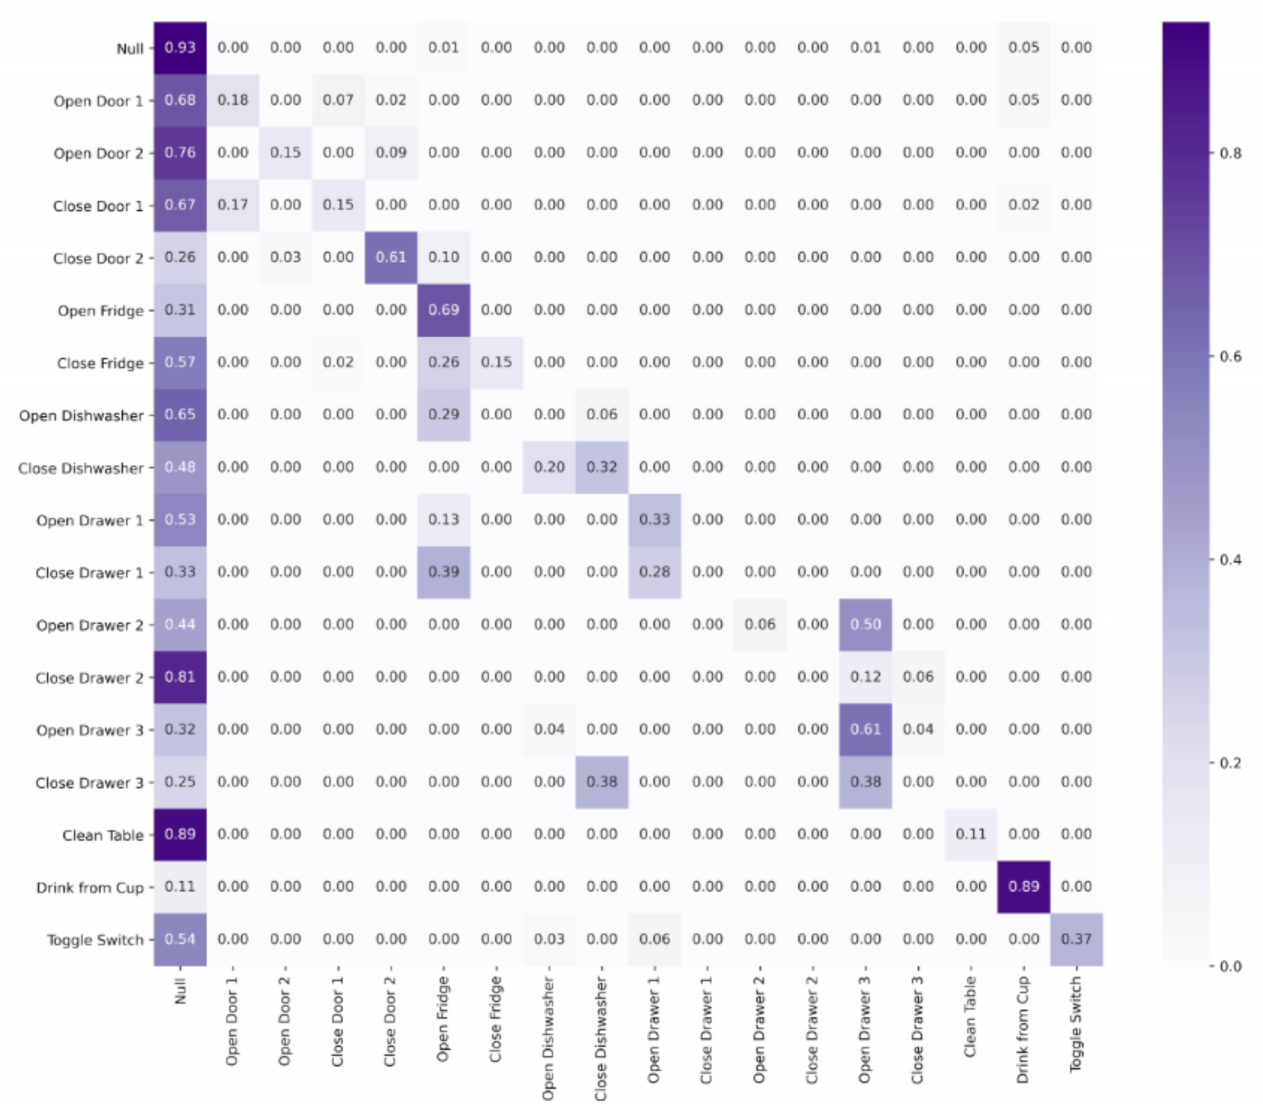
Figure 5. In the model testing phase, the model gave 0.83 in the F1-score and 0.85 in model accuracy. Through the confusion matrix, as shown in
Figure 6, it was observed that most classes had low true positive scores, although the F1-score and accuracy of the model were high. This is due to the imbalance distribution of the OPPORTUNITY dataset. Therefore, to solve this problem, further improvements have been made in the algorithm and more experiments need to be conducted.
4.2. Removal of the Majority Class in the Dataset
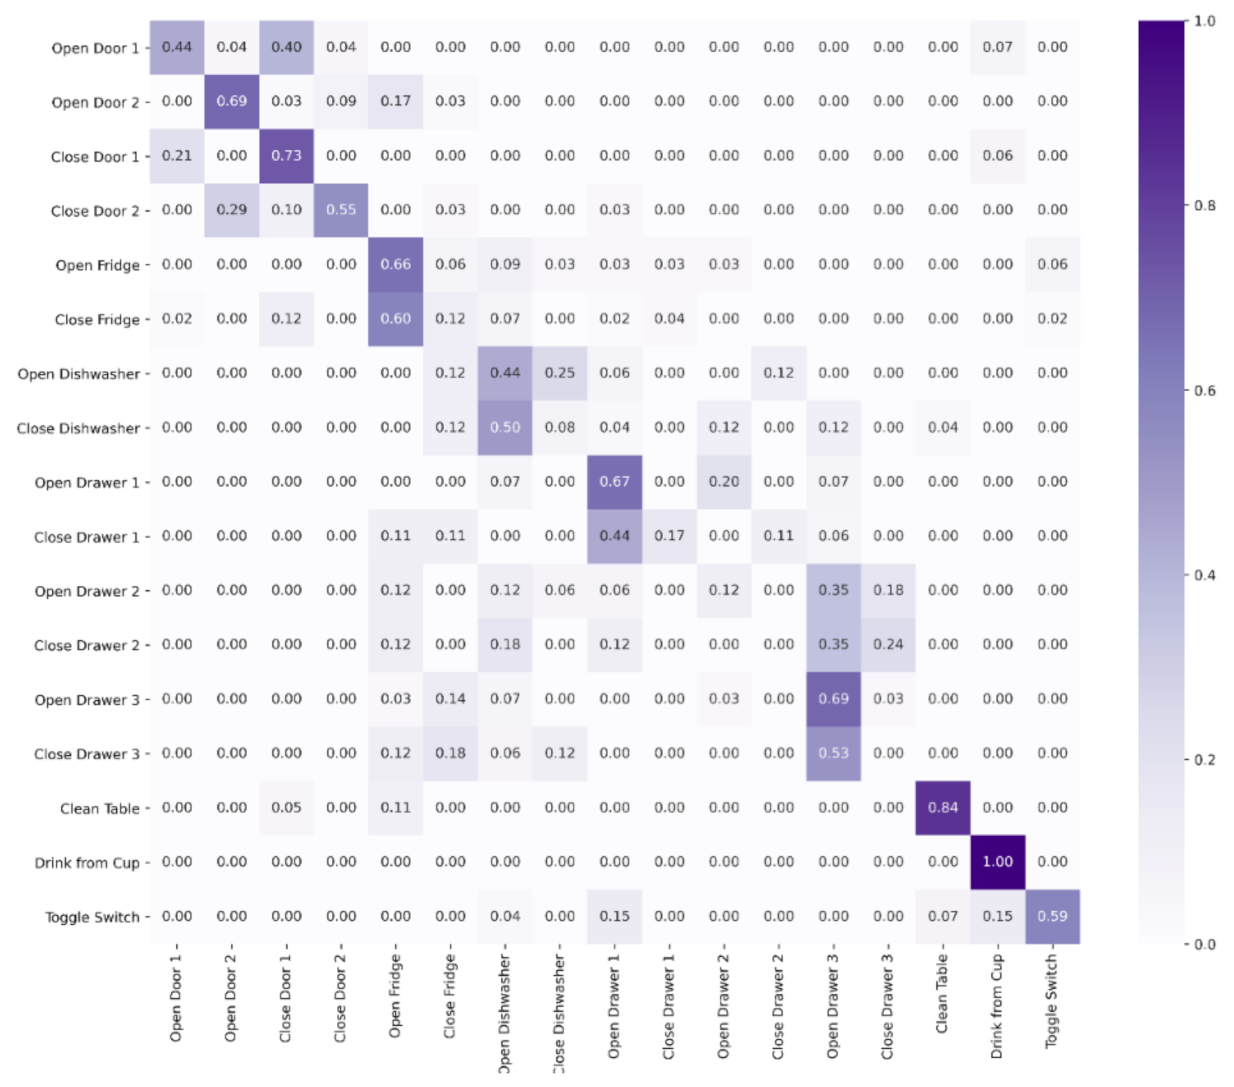
In this section, the NULL class of the dataset was removed to verify if the model can learn the pattern of the other classes. For this purpose, the entire NULL class was removed from the dataset. The distributions of the datasets for training, validation and test dataset are shown in
Figure 7. The distributions of the datasets for all the sets were more balanced after the removal of the NULL class. The training results and confusion matrix of the model are shown in
Figure 8 and
Figure 9, respectively. Although this model worked well in training and the validation sets (
Figure 8), the model failed to properly classify the test samples and had many false positive cases, as shown in the confusion matrix in
Figure 9.
4.3. Resampling OPPORTUNITY Dataset
The resampling method was used to reduce the number of NULL classes in the dataset. To resample the dataset of each subject, 10% of the NULL class samples were retained. The model was trained using this new dataset.
Figure 10,
Figure 11 and
Figure 12 show the distribution of the dataset after resampling, the results of the model training and the confusion matrix of the model, respectively. The model can get good performance after applying the resampling method. This model can classify the 18 annotated classes in the dataset.
4.4. Upper Body Recognition Model
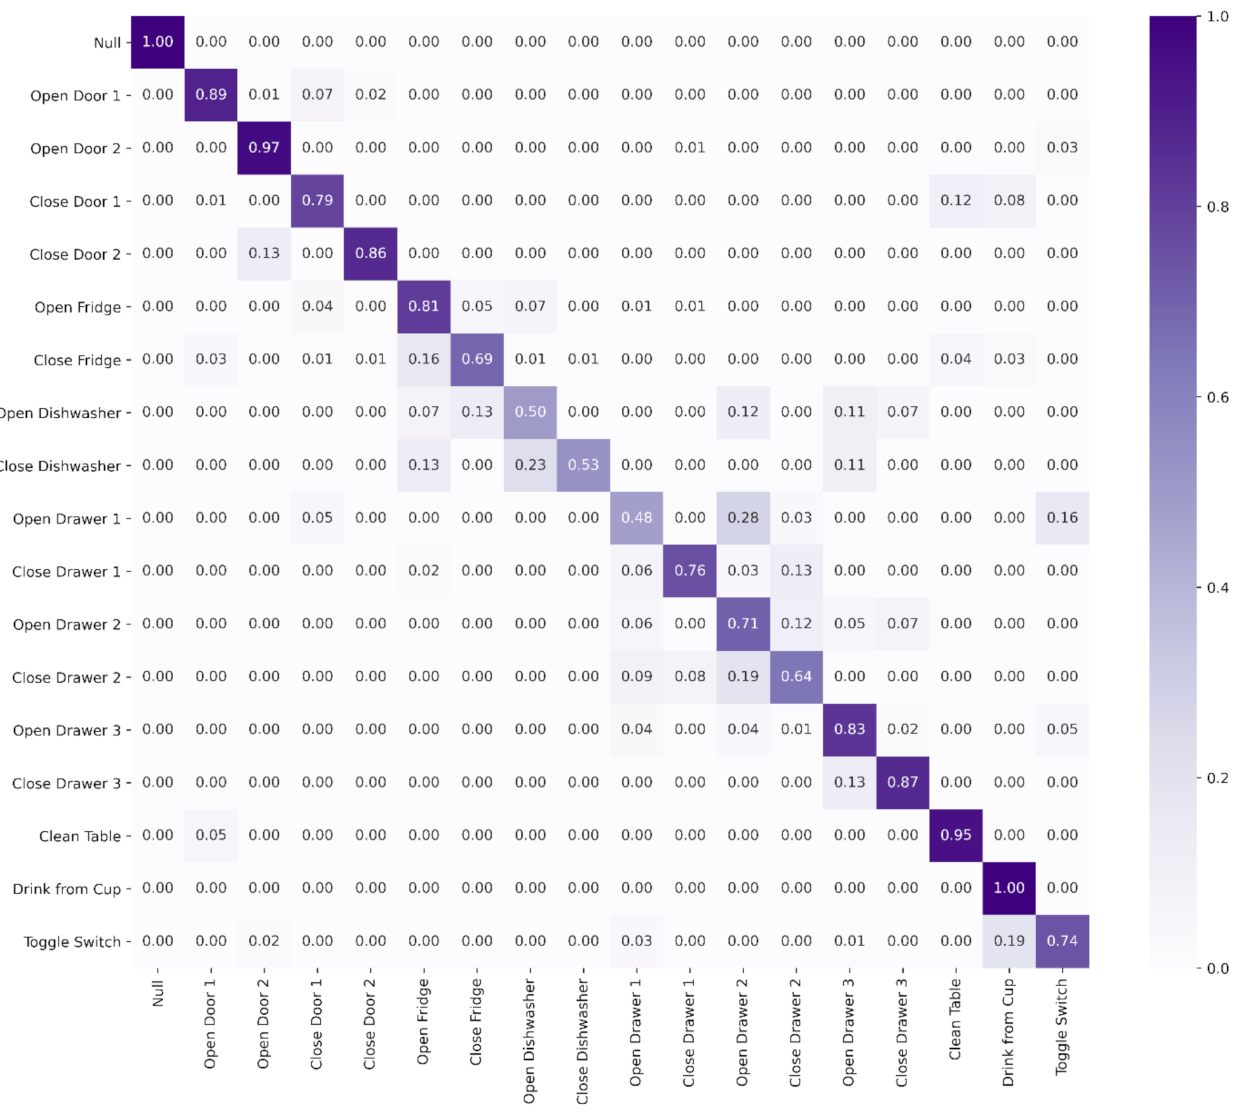
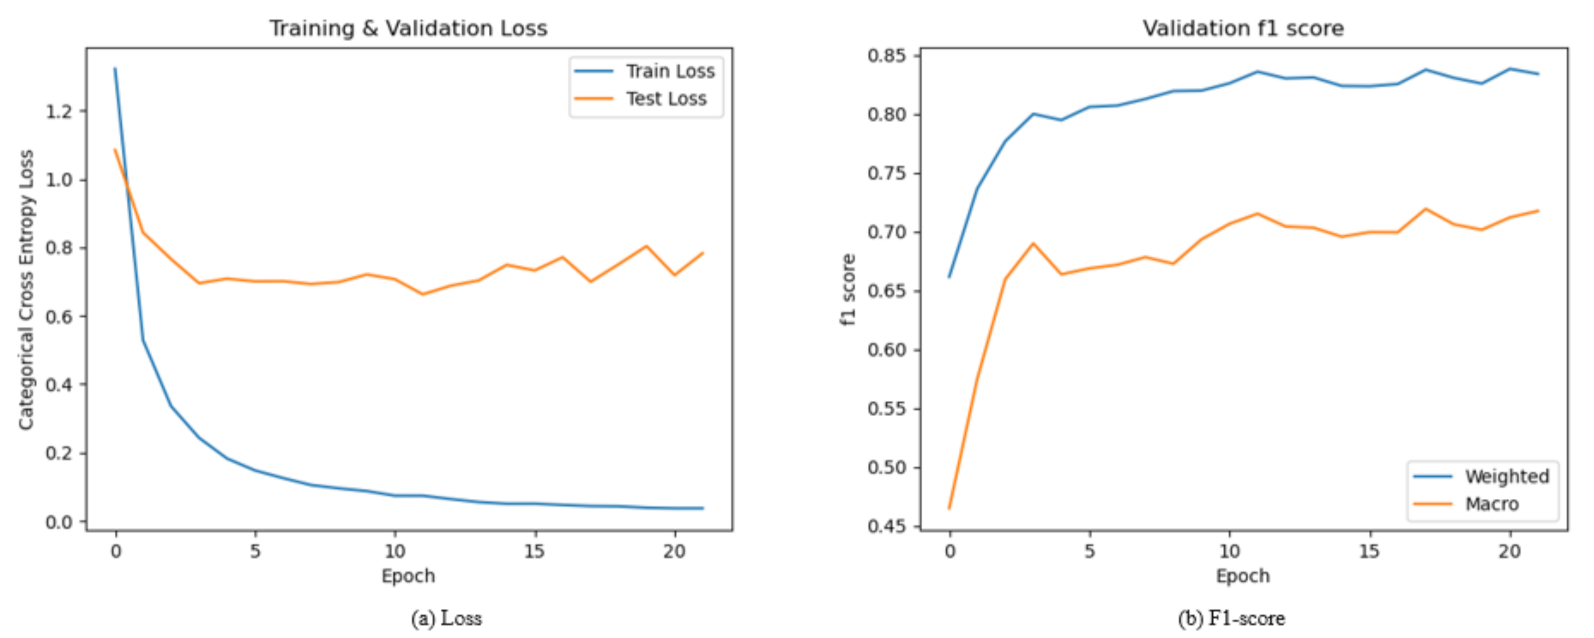
In order to enable the practical implementation during the model deployment stage, the number of sensors used in model training was reduced from 19 to 5 units. The accelerometers data were removed from the dataset and only five IMU sensors were selected, which were RLA, RUA, BACK, LLA, and LUA.
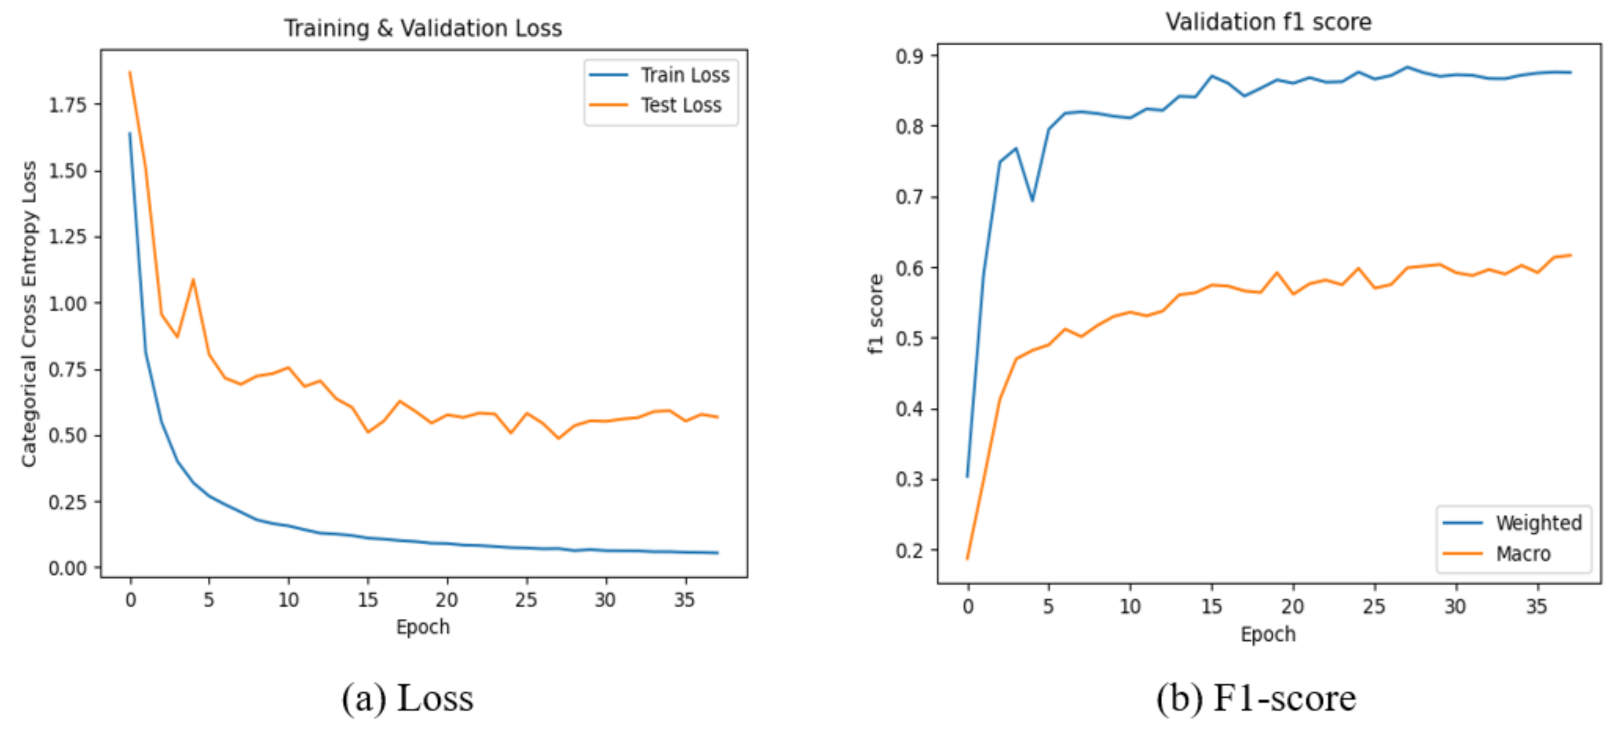
The model was trained with the resampled IMU dataset that was obtained after data reduction in the unwanted sections. The results of the model training are shown in
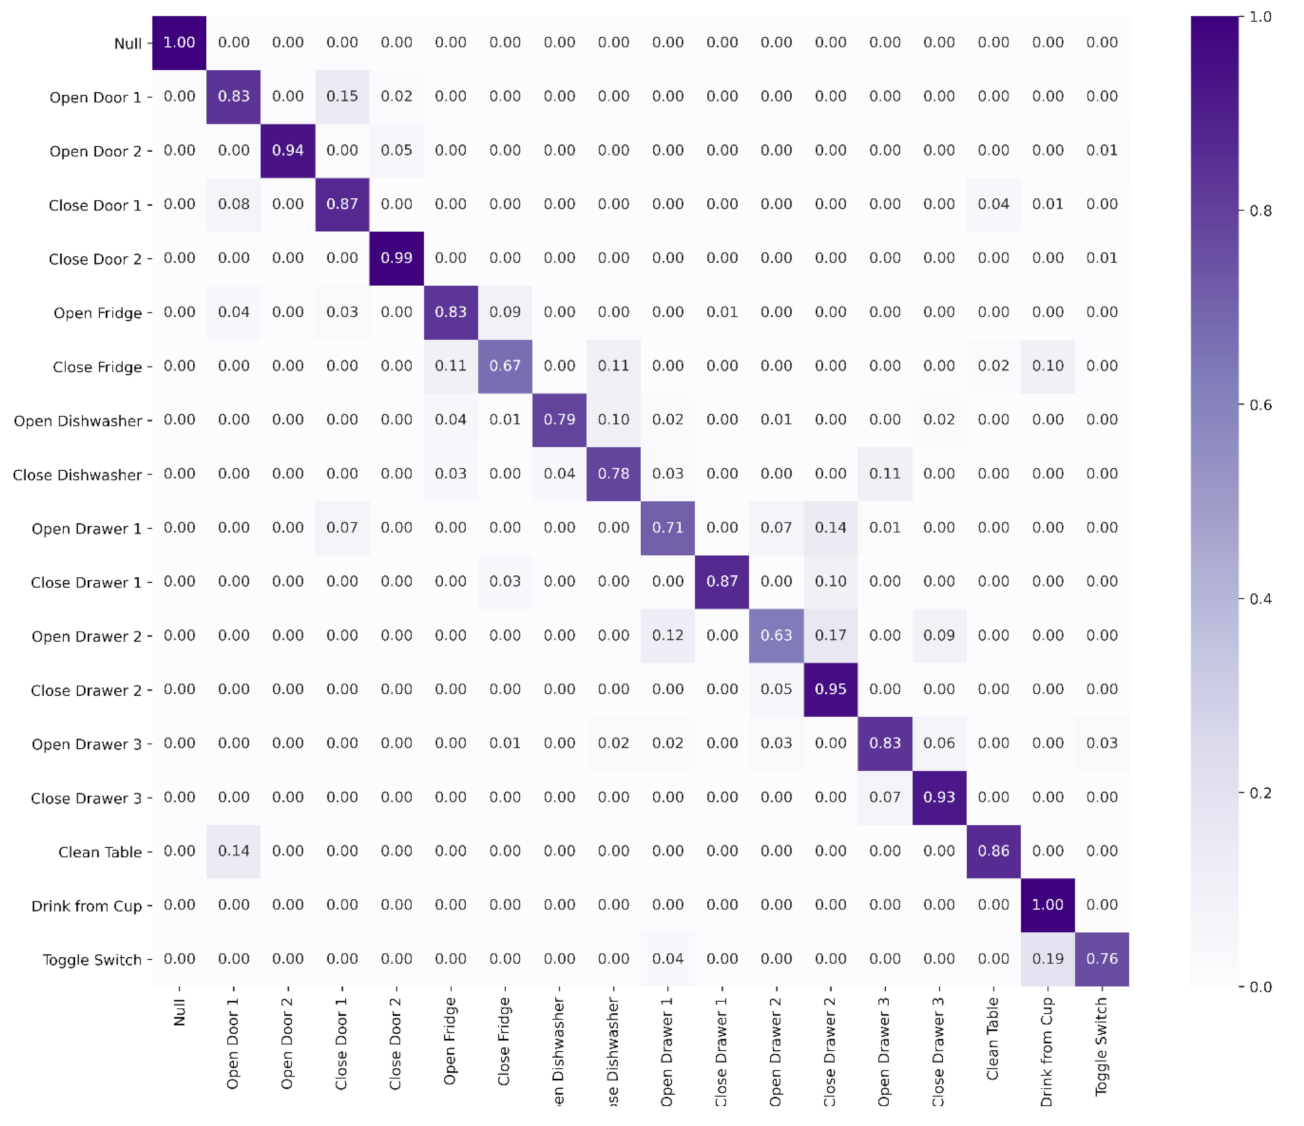
Figure 13. The model confusion matrix in the test dataset is presented in
Figure 14. The confusion matrix shows that there is a low rate of false positives, and each class shows a good rate of true positive rates compared to previous experiments.
4.5. Loss Function Based Optimization for Imbalanced Dataset
In this experiment, the multiclass focal loss was used in the sensor classification task to replace the conventional multiclass loss method, namely cross-entropy loss. The hyperparameter gamma acts as a relaxation parameter that is used to adjust the weight for each class. When the gamma value is high, the model focuses on optimization of the minority classes. The learning process is more difficult, and it is harder to correctly classify all the classes. By using this approach, the model can be trained directly with the imbalanced distribution dataset without the need for random undersampling.
This approach was tested with five IMU sensor datasets, as mentioned in
Section 4.4. By setting the gamma value to 1.0, both models achieved the best accuracy score of 0.9 and F1-score of 0.9. Although the model using multiclass focal loss was successful in classifying the minority classes, the result was no better than the random undersampling approach. The result of the multiclass focal loss is shown in
Table 4.
4.6. Summary of Results
The model developed with the proper handling of the imbalanced dataset can achieve an overall high F1-score on all 18 activity classes for both the full-body and upper-body dataset. The model results for all the experiments are presented in
Table 5.
Table 5 shows a comparison of the developed model with other works. There are several deep neural network models that were used to train the model for human activity recognition. InnoHAR used a multi-level neural network structure model based on the combination of Inception Neural Network and GRU. The experiment was conducted on the Intel Atom E3826 processor platform but the imbalanced class distribution still remains unsolved, as reported in [
34].
InnoHAR has a slightly better performance in the HAR classification, as shown by its F-measure of 0.94 compared to our works with an F-measure of 0.91. A ConvLSTM network has the advantage of having lower parameters and a low memory footprint from hidden representations, which is more suitable for wearable activity recognition during the deployment stage. Although the developed model is slightly lower in F1-score (3%) as compared to InnoHAR [
34], it remains at the same level of performance with state-of-the-art technologies. More importantly, a home-based rehabilitation assessment system can be developed with this model and a minimal number of sensors.
5. Conclusions
Data imbalance is a common problem in wearable sensor data acquisition. It can greatly degrade the performance of the model during the deployment stage. This article presented a method to address an imbalanced dataset for upper body activity recognition. A resampling method was used to ensure the convergence of the model and produce a high-performance model in classifying different activity. The results of the experiment showed that this method remains at the same level of performance as the state-of-the-art technology. This model used only five IMU sensors and achieved the same F1-score as 19 sensors.
Although the HAR model with a multiclass focal loss function can address the imbalanced dataset, it has a slightly lower model accuracy and F1-score with a 1% (for both) difference from the resampling method. The application of the multiclass focal loss function in the HAR model will facilitate the subsequent deployment phase on edge devices. However, the accuracy of the model and the F1-score in the multiclass classification will be sacrificed. This tradeoff will be taken into consideration in the next implementation phase.
To emphasize, the contributions of these works are the random undersampling to address the problem of data imbalance in real-life human activity recognition and the reduction in the number of features that are needed for the model training that, at the same time, achieved reasonable results compared to previous work. In practical application, this will reduce the number of IMU sensors required to be attached on the human body.
In the future, the developed model will be implemented on a mobile device to perform real-time activity classification in real-world scenarios. Real-world scenarios involve the comparison of movement between healthy and hemiparetic limbs and the quantification of human movement during the activities of daily living. It is hoped that the future models using HAR will be the bridging tool between engineering and medical research.
Author Contributions
Conceptualization, X.Y.L. and K.B.G.; Formal analysis, X.Y.L.; Funding acquisition, K.B.G.; Methodology, X.Y.L.; Project administration, K.B.G.; Supervision, K.B.G. and N.A.A.A.; Validation, X.Y.L.; Writing—original draft, X.Y.L.; Writing—review and editing, K.B.G. and N.A.A.A. All authors have read and agreed to the published version of the manuscript.
Funding
This research is funded by Universiti Kebangsaan Malaysia under the Grand Challenge Grant (DCP-2018-004/2) and Ministry of Higher Education under the Fundamental Research Grant scheme (FRGS/1/2020/TK0/UKM/02/14).
Institutional Review Board Statement
Not applicable. A publicly available dataset [
29] was used in this work.
Informed Consent Statement
Not applicable. A publicly available dataset [
29] was used in this work.
Data Availability Statement
Not applicable.
Acknowledgments
We would like to express our sincere gratitude to the reviewers for their helpful comments that improved the quality of the manuscript.
Conflicts of Interest
The authors declare no conflict of interest.
Appendix A
Table A1 shows the abbreviations of the OPPORTUNITY Activity Recognition dataset, as shown in
Figure 1. The details and sequences of activities performed by the subjects during the data collection are shown in
Table A2 and
Table A3.
Table A1.
Abbreviations for sensor placement.
Table A1.
Abbreviations for sensor placement.
| Abbreviations | Sensor Placement | Abbreviations | Sensor Placement |
|---|
| RUA | right upper arm | RUA_ | right upper arm |
| RLA | right lower arm | RUA^ | right upper arm |
| LUA | left upper arm | RWR | right wrist region |
| LLA | left lower arm | RH | right hand |
| BACK | back upper body | LUA_ | left upper arm |
| RSHOES | right shoes | LUA^ | left upper arm |
| LSHOES | left shoes | LWR | left wrist region |
| | | LH | left hand |
| | | BACK | back upper body |
| | | HIP | hip |
| | | RKN^ | right knee |
| | | RKN_ | right knee |
Table A2.
ADL run details.
Table A2.
ADL run details.
| Activities | Details |
|---|
| Start | Lying on the deckchair, get up |
| Groom | Move in the room, check that all the objects are in the right places in the drawers and on shelves |
| Relax | Go outside and have a walk around the building |
| Prepare coffee | Prepare a coffee with milk and sugar using the coffee machine |
| Drink coffee | Take coffee sips, move around in the environment |
| Prepare sandwich | Include bread, cheese, and salami, using the bread cutter and various knives and plates |
| Eat sandwich | Eat |
| Cleanup | Put objects used to the original place or dishwasher, clean up the table |
| Break | Lie on the deckchair |
Table A3.
Drill run details.
Table A3.
Drill run details.
| Activities | Details |
|---|
| Activity 1 | Open then close the fridge |
| Activity 2 | Open then close the dishwasher |
| Activity 3 | Open then close 3 drawers (at different heights) |
| Activity 4 | Open then close door 1 |
| Activity 5 | Open then close door 2 |
| Activity 6 | Toggle the lights on then off |
| Activity 7 | Clean the table |
| Activity 8 | Drink while standing |
| Activity 9 | Drink while seated |
References
- Kringle, E.; Knutson, E.; Terhorst, L. Semi-Supervised Machine Learning for Rehabilitation Science Research. Arch. Phys. Med. Rehabil. 2017, 98, e139. [Google Scholar] [CrossRef]
- Wang, X.; Rosenblum, D.; Wang, Y. Context-aware mobile music recommendation for daily activities. In Proceedings of the 20th ACM International Conference on Multimedia—MM, New York, NY, USA, 29 October 2012; Volume 12, p. 99. [Google Scholar] [CrossRef]
- Hammerla, N.Y.; Fisher, J.M.; Andras, L.R.; Walker, R.; Plötz, T. PD disease state assessment in naturalistic environments using deep learning. Proc. Natl. Conf. Artif. Intell. 2015, 3, 1742–1748. [Google Scholar]
- Ponvel, P.; Singh, D.K.A.; Beng, G.K.; Chai, S.C. Factors Affecting Upper Extremity Kinematics in Healthy Adults: A Systematic Review. Crit. Rev. Phys. Rehabil. Med. 2019, 31, 101–123. [Google Scholar] [CrossRef]
- Abidin, S.B.Z.; Jusoh, W.N.I.W.; Beng, G.K. Kinematic analysis on reaching activity for hemiparetic stroke subjects using simplified video processing method. Malays. J. Fundam. Appl. Sci. 2018, 14, 386–390. [Google Scholar] [CrossRef][Green Version]
- Ramlee, M.H.; Beng, G.K.; Bajuri, N.; Kadir, M.R.A. Finite element analysis of the wrist in stroke patients: The effects of hand grip. Med. Biol. Eng. Comput. 2017, 56, 1161–1171. [Google Scholar] [CrossRef]
- Anguita, D.; Ghio, A.; Oneto, L.; Parra, F.X.L.; Ortiz, J.L.R. Human Activity Recognition on Smartphones Using a Multiclass Hardware-Friendly Support Vector Machine. In International Workshop on Ambient Assisted Living; Springer: Berlin/Heidelberg, Berlin, 2012; pp. 216–223. [Google Scholar] [CrossRef]
- Lara, O.D.; Labrador, M.A. A Survey on Human Activity Recognition using Wearable Sensors. IEEE Commun. Surv. Tutor. 2013, 15, 1192–1209. [Google Scholar] [CrossRef]
- Russakovsky, O.; Deng, J.; Su, H.; Krause, J.; Satheesh, S.; Ma, S.; Huang, Z.; Karpathy, A.; Khosla, A.; Bernstein, M.; et al. ImageNet Large Scale Visual Recognition Challenge. Int. J. Comput. Vis. 2015, 115, 211–252. [Google Scholar] [CrossRef]
- Devlin, J.; Chang, M.-W.; Lee, K.; Toutanova, K. BERT: Pre-training of Deep Bidirectional Transformers for Language Understanding. In Proceedings of the 2019 Conference of the North American Chapter of the Association for Computational Linguistics: Human Language Technologies, Seattle, DC, USA, 5–10 July 2019; pp. 4171–4186. [Google Scholar] [CrossRef]
- LeCun, Y.; Bengio, Y.; Hinton, G. Deep learning. Nature 2015, 521, 436–444. [Google Scholar] [CrossRef]
- Yang, D.; Huang, J.; Tu, X.; Ding, G.; Shen, T.; Xiao, X. A Wearable Activity Recognition Device Using Air-Pressure and IMU Sensors. IEEE Access 2019, 7, 6611–6621. [Google Scholar] [CrossRef]
- Mehrang, S.; Pietilä, J.; Korhonen, I. An activity recognition framework deploying the random forest classifier and a single optical heart rate monitoring and triaxial accelerometer wrist-band. Sensors 2018, 18, 613. [Google Scholar] [CrossRef]
- Liu, L.; Luo, G.; Qin, K.; Zhang, X. An algorithm based on logistic regression with data fusion in wireless sensor networks. EURASIP J. Wirel. Commun. Netw. 2017, 2017, 10. [Google Scholar] [CrossRef]
- Anguita, D.; Ghio, A.; Oneto, L.; Parra, X.; Reyes-Ortiz, J.L. A public domain dataset for human activity recognition using smartphones. In Proceedings of the ESANN 2013 Proceedings, 21th European Symposium on Artificial Neural Networks, Computational Intelligence and Machine Learning, Bruges, Belgium, 24–26 April 2013; pp. 437–442. [Google Scholar]
- Zappi, P.; Lombriser, C.; Stiefmeier, T.; Farella, E.; Roggen, D.; Benini, L.; Tröster, G. Activity Recognition from On-Body Sensors: Accuracy-Power Trade-Off by Dynamic Sensor Selection. In Wireless Sensor Networks; Springer: Berlin/Heidelberg, Germany, 2008; pp. 17–33. [Google Scholar]
- Bachlin, M.; Plotnik, M.; Roggen, D.; Maidan, I.; Hausdorff, J.M.; Giladi, N.; Troster, G. Wearable Assistant for Parkinson’s Disease Patients with the Freezing of Gait Symptom. IEEE Trans. Inf. Technol. Biomed. 2009, 14, 436–446. [Google Scholar] [CrossRef] [PubMed]
- Huynh, T.; Fritz, M.; Schiele, B. Discovery of activity patterns using topic models. In Proceedings of the 10th International Conference on Ubiquitous Computing—UbiComp, Seoul, Korea, 21–24 September 2008; p. 10. [Google Scholar] [CrossRef]
- LeCun, Y.; Bottou, L.; Bengio, Y.; Haffner, P. Gradient-based learning applied to document recognition. Proc. IEEE 1998, 86, 2278–2324. [Google Scholar] [CrossRef]
- Krizhevsky, A.; Sutskever, I.; Hinton, G.E. ImageNet classification with deep convolutional neural networks. Commun. ACM 2017, 60, 84–90. [Google Scholar] [CrossRef]
- Szegedy, C.; Liu, W.; Jia, Y.; Sermanet, P.; Reed, S.; Anguelov, D.; Erhan, D.; Vanhoucke, V.; Rabinovich, A. Going deeper with convolutions. In Proceedings of the Conference on Computer Vision and Pattern Recognition, Columbus, OH, USA, 23–28 June 2015; pp. 1–9. [Google Scholar] [CrossRef]
- Simonyan, K.; Zisserman, A. Very Deep Convolutional Networks for Large-Scale Image Recognition. arXiv 2014, arXiv:1409.1556, 1–14. [Google Scholar]
- He, K.; Zhang, X.; Ren, S.; Sun, J. Deep residual learning for image recognition. arXiv 2015, arXiv:1512.03385. [Google Scholar]
- Zeng, M.; Nguyen, L.T.; Yu, B.; Mengshoel, O.J.; Zhu, J.; Wu, P.; Zhang, J. Convolutional Neural Networks for Human Activity Recognition using Mobile Sensors. In Proceedings of the 6th International Conference on Mobile Computing, Applications and Services, Austin, TX, USA, 6–7 November 2014. [Google Scholar] [CrossRef]
- Chen, Y.; Xue, Y. A Deep Learning Approach to Human Activity Recognition Based on Single Accelerometer. In Proceedings of the 2015 IEEE International Conference on Systems, Man, and Cybernetics, Hong Kong, China, 9–12 October 2015; pp. 1488–1492. [Google Scholar] [CrossRef]
- Sathyanarayana, A.; Joty, S.; Fernandez-Luque, L.; Ofli, F.; Srivastava, J.; Elmagarmid, A.; Arora, T.; Taheri, S. Sleep Quality Prediction from Wearable Data Using Deep Learning. JMIR mHealth uHealth 2016, 4, e125. [Google Scholar] [CrossRef]
- Jianbo, Y.; Nhut, N.M.; Phyophyo, S.; Xiaoli, L.; Priyadarsini, K.S. Deep convolutional neural networks on multichannel time series for human activity recognition. IJCAI 2015, 15, 3995–4001. [Google Scholar]
- Morales, F.J.O.; Roggen, D. Deep convolutional feature transfer across mobile activity recognition domains, sensor modalities and locations. In Proceedings of the 2016 ACM International Symposium on Wearable Computers—ISWC ’16; Association for Computing Machinery: New York, NY, USA, 2016; pp. 92–99. [Google Scholar] [CrossRef]
- Roggen, D.; Calatroni, A.; Rossi, M.; Holleczek, T.; Forster, K.; Troster, G.; Lukowicz, P.; Bannach, D.; Pirkl, G.; Ferscha, A.; et al. Collecting complex activity datasets in highly rich networked sensor environments. In Proceedings of the 2010 Seventh International Conference on Networked Sensing Systems (INSS), Kassel, Germany, 15–18 June 2010; pp. 233–240. [Google Scholar] [CrossRef]
- Sak, H.; Senior, A.; Beaufays, F. Long Short-Term Memory Based Recurrent Neural Network Architectures for Large Vocabulary Speech Recognition. February 2014. Available online: http://arxiv.org/abs/1402.1128 (accessed on 23 November 2020).
- Inoue, M.; Inoue, S.; Nishida, T. Deep recurrent neural network for mobile human activity recognition with high throughput. Artif. Life Robot. 2018, 23, 173–185. [Google Scholar] [CrossRef]
- Edel, M.; Koppe, E. Binarized-BLSTM-RNN based Human Activity Recognition. In Proceedings of the 2016 International Conference on Indoor Positioning and Indoor Navigation (IPIN), Madrid, Spain, 4–7 October 2016; pp. 1–7. [Google Scholar] [CrossRef]
- Ordóñez, F.J.; Roggen, D. Deep Convolutional and LSTM Recurrent Neural Networks for Multimodal Wearable Activity Recognition. Sensors 2016, 16, 115. [Google Scholar] [CrossRef] [PubMed]
- Xu, C.; Chai, D.; He, J.; Zhang, X.; Duan, S. InnoHAR: A Deep Neural Network for Complex Human Activity Recognition. IEEE Access 2019, 7, 9893–9902. [Google Scholar] [CrossRef]
- Batista, G.E.; Prati, R.C.; Monard, M.C. A study of the behavior of several methods for balancing machine learning training data. ACM SIGKDD Explor. Newsl. 2004, 6, 20–29. [Google Scholar] [CrossRef]
- Tahir, M.A.; Kittler, J.; Yan, F. Inverse random under sampling for class imbalance problem and its application to multi-label classification. Pattern Recognit. 2012, 45, 3738–3750. [Google Scholar] [CrossRef]
- Lin, T.; Goyal, P.; Girshick, R.B.; He, K.; Dollár, P. Focal Loss for Dense Object Detection. Proc. IEEE Int. Conf. Comput. Vis. 2017, 2999–3007. [Google Scholar]
- Paszke, A.; Gross, S.; Massa, F.; Lerer, A.; Bradbury, J.; Chanan, G.; Killeen, T.; Lin, Z.; Gimelshein, N.; Antiga, L.; et al. PyTorch: An Imperative Style, High-Performance Deep Learning Library; NeurIPS: Vancouver, BC, Canada, 2019; pp. 8024–8035. [Google Scholar]
- Hammerla, N.Y.; Halloran, S.; Plötz, T. Deep, convolutional, and recurrent models for human activity recognition using wearables. IJCAI Int. Jt. Conf. Artif. Intell. 2016, 2016, 1533–1540. [Google Scholar]
Figure 1.
Placement of on-body sensors used in the OPPORTUNITY dataset: (a) inertia measurement unit sensor placement; (b) triaxial accelerometer placements.
Figure 1.
Placement of on-body sensors used in the OPPORTUNITY dataset: (a) inertia measurement unit sensor placement; (b) triaxial accelerometer placements.
Figure 2.
Model architecture for DeepConvLSTM (D: input data channel and C: number of class activity).
Figure 2.
Model architecture for DeepConvLSTM (D: input data channel and C: number of class activity).
Figure 3.
Flowchart for model training process.
Figure 3.
Flowchart for model training process.
Figure 4.
(a) Training set distribution, (b) validation set distribution, (c) test set distribution.
Figure 4.
(a) Training set distribution, (b) validation set distribution, (c) test set distribution.
Figure 5.
(a) Training and validation loss, (b) F1-score on the training dataset.
Figure 5.
(a) Training and validation loss, (b) F1-score on the training dataset.
Figure 6.
Confusion matrix of the model on the testing dataset.
Figure 6.
Confusion matrix of the model on the testing dataset.
Figure 7.
(a) Training set distribution without NULL, (b) validation set distribution without NULL, (c) test set distribution without NULL.
Figure 7.
(a) Training set distribution without NULL, (b) validation set distribution without NULL, (c) test set distribution without NULL.
Figure 8.
(a) Training and validation loss, (b) F1-score on training dataset without NULL class.
Figure 8.
(a) Training and validation loss, (b) F1-score on training dataset without NULL class.
Figure 9.
Confusion matrix of the model on testing dataset without NULL class.
Figure 9.
Confusion matrix of the model on testing dataset without NULL class.
Figure 10.
(a) Training set distribution after resampling, (b) validation set distribution after resampling, (c) test set distribution after resampling.
Figure 10.
(a) Training set distribution after resampling, (b) validation set distribution after resampling, (c) test set distribution after resampling.
Figure 11.
(a) Training and validation loss, (b) F1-score on training dataset after resampling.
Figure 11.
(a) Training and validation loss, (b) F1-score on training dataset after resampling.
Figure 12.
Confusion matrix of the model on testing dataset after resampling.
Figure 12.
Confusion matrix of the model on testing dataset after resampling.
Figure 13.
(a) Training and validation loss, (b) F1-score on training dataset for upper body recognition model.
Figure 13.
(a) Training and validation loss, (b) F1-score on training dataset for upper body recognition model.
Figure 14.
Confusion matrix of the model on the testing dataset for upper body recognition model.
Figure 14.
Confusion matrix of the model on the testing dataset for upper body recognition model.
Table 1.
Details of the OPPORTUNITY dataset for human activity recognition.
Table 1.
Details of the OPPORTUNITY dataset for human activity recognition.
| Elements | Details |
|---|
| Type | The activity of daily living |
| Participants | 4 |
| Sampling rate | 32 Hz |
| Activity recorded | 16 |
| No. of raw data generated | 701,366 |
| Sensors in used | Accelerometer, gyroscope, magnetometer, object, and ambient sensor |
Table 2.
Activity classes of the OPPORTUNITY dataset.
Table 2.
Activity classes of the OPPORTUNITY dataset.
| Class | Label | Class | Label |
|---|
| 0 | NULL (no activity) | 9 | Open Drawer 1 |
| 1 | Open Door 1 | 10 | Close Drawer 1 |
| 2 | Open Door 2 | 11 | Open Drawer 2 |
| 3 | Close Door 1 | 12 | Close Drawer 2 |
| 4 | Close Door 2 | 13 | Open Drawer 3 |
| 5 | Open Fridge | 14 | Close Drawer 3 |
| 6 | Close Fridge | 15 | Clean Table |
| 7 | Open Dishwasher | 16 | Drink from Cup |
| 8 | Close Dishwasher | 17 | Toggle Switch |
Table 3.
The training, validation and test set in model development using OPPORTUNITY dataset.
Table 3.
The training, validation and test set in model development using OPPORTUNITY dataset.
| Training Set | Validation Set | Test Set |
|---|
| S1-Drill | S1-ADL5 | S2-ADL4 |
| S1-ADL1 | | S2-ADL5 |
| S1-ADL2 | | S3-ADL4 |
| S1-ADL3 | | S3-ADL5 |
| S1-ADL4 | | |
| S2-Drill | | |
| S2-ADL1 | | |
| S2-ADL2 | | |
| S3-Drill | | |
Table 4.
Result of model performance using multiclass focal loss.
Table 4.
Result of model performance using multiclass focal loss.
| Gamma (Hyperparameter) | Model Accuracy | F1-Score |
|---|
| 0.5 | 0.87 | 0.89 |
| 1.0 | 0.90 | 0.90 |
| 1.5 | 0.85 | 0.89 |
| 2.0 | 0.83 | 0.89 |
Table 5.
Summary of results in this paper compared to previous approaches.
Table 5.
Summary of results in this paper compared to previous approaches.
| Experiments | Model Accuracy | F1-Score |
|---|
| InnoHAR [34] | - | 0.94 |
| b-LSTM-S [39] | 0.92 | - |
| CNN [28] | 0.88 | - |
| CNN [27] | 0.85 | - |
| ConvLSTM [33] | - | 0.91 |
| ConvLSTM (Full body sensors) | 0.85
0.80
0.89 | 0.83
0.80
0.88 |
| ConvLSTM (Upper body IMU sensors) | 0.86
0.85
0.90 | 0.84
0.85
0.90 |
| 0.91 | 0.91 |
| Publisher’s Note: MDPI stays neutral with regard to jurisdictional claims in published maps and institutional affiliations. |
© 2021 by the authors. Licensee MDPI, Basel, Switzerland. This article is an open access article distributed under the terms and conditions of the Creative Commons Attribution (CC BY) license (https://creativecommons.org/licenses/by/4.0/).
