Article

Effects of Tube Radius and Surface Tension on Capillary Rise Dynamics of Water/Butanol Mixtures

1
Graduate Program, Department of Energy and Mechanical Engineering, Gyeongsang National University, Tongyeonghaean-ro 2, Tongyeong-si 53064, Gyeongsangnam-do, Korea
2
Department of Energy and Mechanical Engineering, Gyeongsang National University, Tongyeonghaean-ro 2, Tongyeong-si 53064, Gyeongsangnam-do, Korea
3
Department of Automobile, Korea Polytechnic VII, Changwon-si 51518, Gyeongsangnam-do, Korea
4
Hydrogen Technology Planning Team, Hyundai Steel Company, Dangjin-si 31719, Chungcheongnam-do, Korea
5
Environment and Energy Research Team, Hyundai Steel Company, Dangjin-si 31719, Chungcheongnam-do, Korea
*
Author to whom correspondence should be addressed.
Co-First authors.
Appl. Sci. 2021, 11(8), 3533; https://doi.org/10.3390/app11083533
Submission received: 14 March 2021 / Revised: 11 April 2021 / Accepted: 14 April 2021 / Published: 15 April 2021

Abstract

:
Capillary-driven action is an important phenomenon which aids the development of high-performance heat transfer devices, such as microscale heat pipes. This study examines the capillary rise dynamics of n-butanol/water mixture in a single vertical capillary tube with different radii (0.4, 0.6, and 0.85 mm). For liquids, distilled water, n-butanol, and their blends with varying concentrations of butanol (0.3, 0.5, and 0.7 wt.%) were used. The results show that the height and velocity of the capillary rise were dependent on the tube radius and liquid surface tension. The larger the radius and the higher the surface tension, the lower was the equilibrium height (he) and the velocity of rise. The process of capillary rise was segregated into three characteristic regions: purely inertial, inertial + viscous, and purely viscous regions. The early stages (purely inertial and inertial + viscous) represented the characteristic heights h1 and h2, which were dominant in the capillary rise process. There were linear correlations between the characteristic heights (h1, h2, and he), tube radius, and surface tension. Based on these correlations, a linear function was established between each of the three characteristic heights and the consolidated value of tube radius and surface tension (σL/2πr2).

1. Introduction

The capillary penetration of wetting fluids into narrow spaces such as cylindrical (or square) tube and porous media is important in many industrial and natural processes. For example, wettability changes in the oil production process like the chemical enhanced oil recovery have a significant effect on capillary pressure, irreducible water saturation, and residual oil saturation [1,2,3,4]. In addition, capillary-driven flow is a fundamental phenomenon in important applications such as the development of high-performance heat transfer and thermal management systems. In particular, the cooling of modern electronic devices requires a suitable configuration for high-performance devices with reduced-size because heat loads and heat fluxes increase exponentially [5,6]. In light of the continued miniaturization of electronic components, micro heat pipes are promising micro-scale cooling devices and their operation is sustained by two-phase heat transfer and capillary forces [7]. Therefore, capillary-based flows can replace electric pumps that consume space and require electrical power to operate in microscale heat pipes. This implies that capillary flow does not require any additional power-consuming actuation devices [8,9].
Li et al. [10] investigated the capillary pumping performance of a porous wick for a looped heat pipe with water and acetone as the working fluid, and they found that the capillary pumping rate increased with increasing porosity of the wicks. Huang et al. [11] developed a novel stainless steel fiber-powder composite wick with high capillary pressure and good permeability for use in stainless steel heat pipes. Their work showed that the powder particle size has a significant influence on the capillary performance of the wick. Li et al. [12] showed that wicks using working fluids with lower viscosity, larger surface tension, and higher density demonstrated better capillary performance by comparing the results of three different working fluids: water, acetone, and ethanol.
Generally, micro heat pipes have a wickless configuration, and hence, the capillary dynamics in the micro-pipes is utilized to drive the working fluids. Moreover, the operation of the micro-heat pipe is governed by transportation of the working fluids and aided by the capillaries or microscale pipes, and its overall thermal performance is predominantly determined by the thermal properties of the working fluids and the size of the capillaries. Thus, the selection of the type of working fluid and the physical size of the system, as well as their impacts on the capillary dynamics are of technological interest. Therefore, the capillary rise dynamics of mixtures with different surface tension and capillary tubes of several hundred micrometers were investigated.
Cao et al. [13] investigated the dynamics of water/ethanol mixtures in capillary tubes and found that surface tension plays an important role in the travelling speed inside the capillary tubes. O’Loughlin et al. [14] investigated the capillary rise dynamics of glycerol and aqueous glycerol solutions in vertical glass capillaries of various radii. Extrand and Moon [15] measured the forces and energies generated by the rising liquids such as ethylene glycol, glycerol, and silicone oil in capillary tubes with diameters ranging from 0.5 to 1.4 mm. They found that larger diameter tubes produced a smaller height in the capillary rise and larger forces in terms of capillary dynamics. Quéré [16] found that the early stage of the capillary rise has a linear relationship with the position of the meniscus height versus time, and the meniscus oscillation around the equilibrium height occurs when the liquid viscosity is sufficiently low. Hamraoui et al. [17] investigated the capillary rise dynamics of pure water and ethanol as well as mixtures using a high-speed imaging technique. They found that the dynamic inertial effect is significant at the initial stages and may be important for capillaries of larger radii. Stange et al. [18] found that capillary-driven flow is divided into three successive phases: inertia, convective losses, and viscous forces which counteract the driving capillary force. Further, Fries and Dreyer [19] discussed the different time stages during early capillary rise, and they concluded that the purely inertial and purely viscous flow periods were separated by a viscoinertial stage, wherein both effects have to be considered. Zhong et al. [20] showed that the velocity of the capillary flow at the initial stage is determined by the Bo number (comparison of gravitational and surface tension forces), and the viscosity effect becomes significant in the final stage. In addition, Walls et al. [21] showed that the properties of liquids in capillary tube rise processes are significant in the early stages.
The above studies showed that the properties such as surface tension and viscosity of liquids were important factors in the capillary rise dynamics. However, the dependency of the capillary rise dynamics on the liquid properties is not straightforward in microscale heat pipe systems because the process of capillary rise is a complex interaction between capillary size and fluid properties. Therefore, the influence of the various capillary sizes on the capillary rise dynamics is still indispensable. In particular, the inner diameter and the fluid properties cannot be considered independently, and the level of these conditions must be considered at the same time.
To determine the effect of capillary size and liquid properties on the capillary dynamics for the performance enhancement of the microscale heat transfer systems, a consolidated correlation of those parameters is required. Therefore, in this study, effects of capillary tube radius (0.4, 0.6, and 0.85 mm) and the surface tension of water, n-butanol, and their blends on the capillary rise dynamics were investigated. The height of capillary rise and velocity were measured using a high-speed camera. The capillary rise process was divided into three characteristic stages: I, II, and III, corresponding to purely inertial, inertial + viscous, and purely viscous region, respectively. The characteristic heights, including the equilibrium height as functions of the tube radius and surface tension, were then analyzed and correlated.

2. Materials and Methods

2.1. Materials

In this study, two types of liquids, distilled water (DW) and n-butanol (B), were used, including their blends. The blending ratio based on the mass fraction (wt.%) was 0%, 0.3%, 0.5%, 0.7% of n-butanol, namely, B0% (DW), B0.3%, B0.5%, and B0.7%, respectively. Capillary tubes (DURAN® High-Precision Glass Capillary, SCHOTT AG, Landshut, Germany) were made of borosilicate glass. To investigate the effect of tube diameters on the capillary dynamics considering future researches on the development of microscale heat pipe systems, capillaries with three different inner radii (r = 0.4, 0.6, and 0.85 mm) were employed at a fixed outer diameter of 6 mm and tube length (L) of 150 mm in this study.

2.2. Methods

Figure 1 shows the experimental setup designed for measuring the surface tension (σ) and capillary rise dynamics. The measurement system comprises of three subsystems: a PC/monitoring part, capillary rising part, and high-speed imaging part, as shown in Figure 1a–c, respectively. In the experiments, we raised the height of the liquid using a lab jack to connect the bottom of the capillaries with the liquid, hence facilitating the entry of liquid into the capillaries. The height of rise (h) of the liquid was measured as the point where the capillary tube just touches the liquid to the point where the meniscus stops at the equilibrium height (he). These rising processes were recorded using a high-speed camera (FASTCAM SA4, Photron Ltd., Tokyo, Japan) connected to a PC. The σ first measured using dual capillary tubes based on differential capillary-rise-height method [22], and the capillary dynamics using a single capillary tube was then analyzed by measuring the height of rise and its velocity [13,14,23].
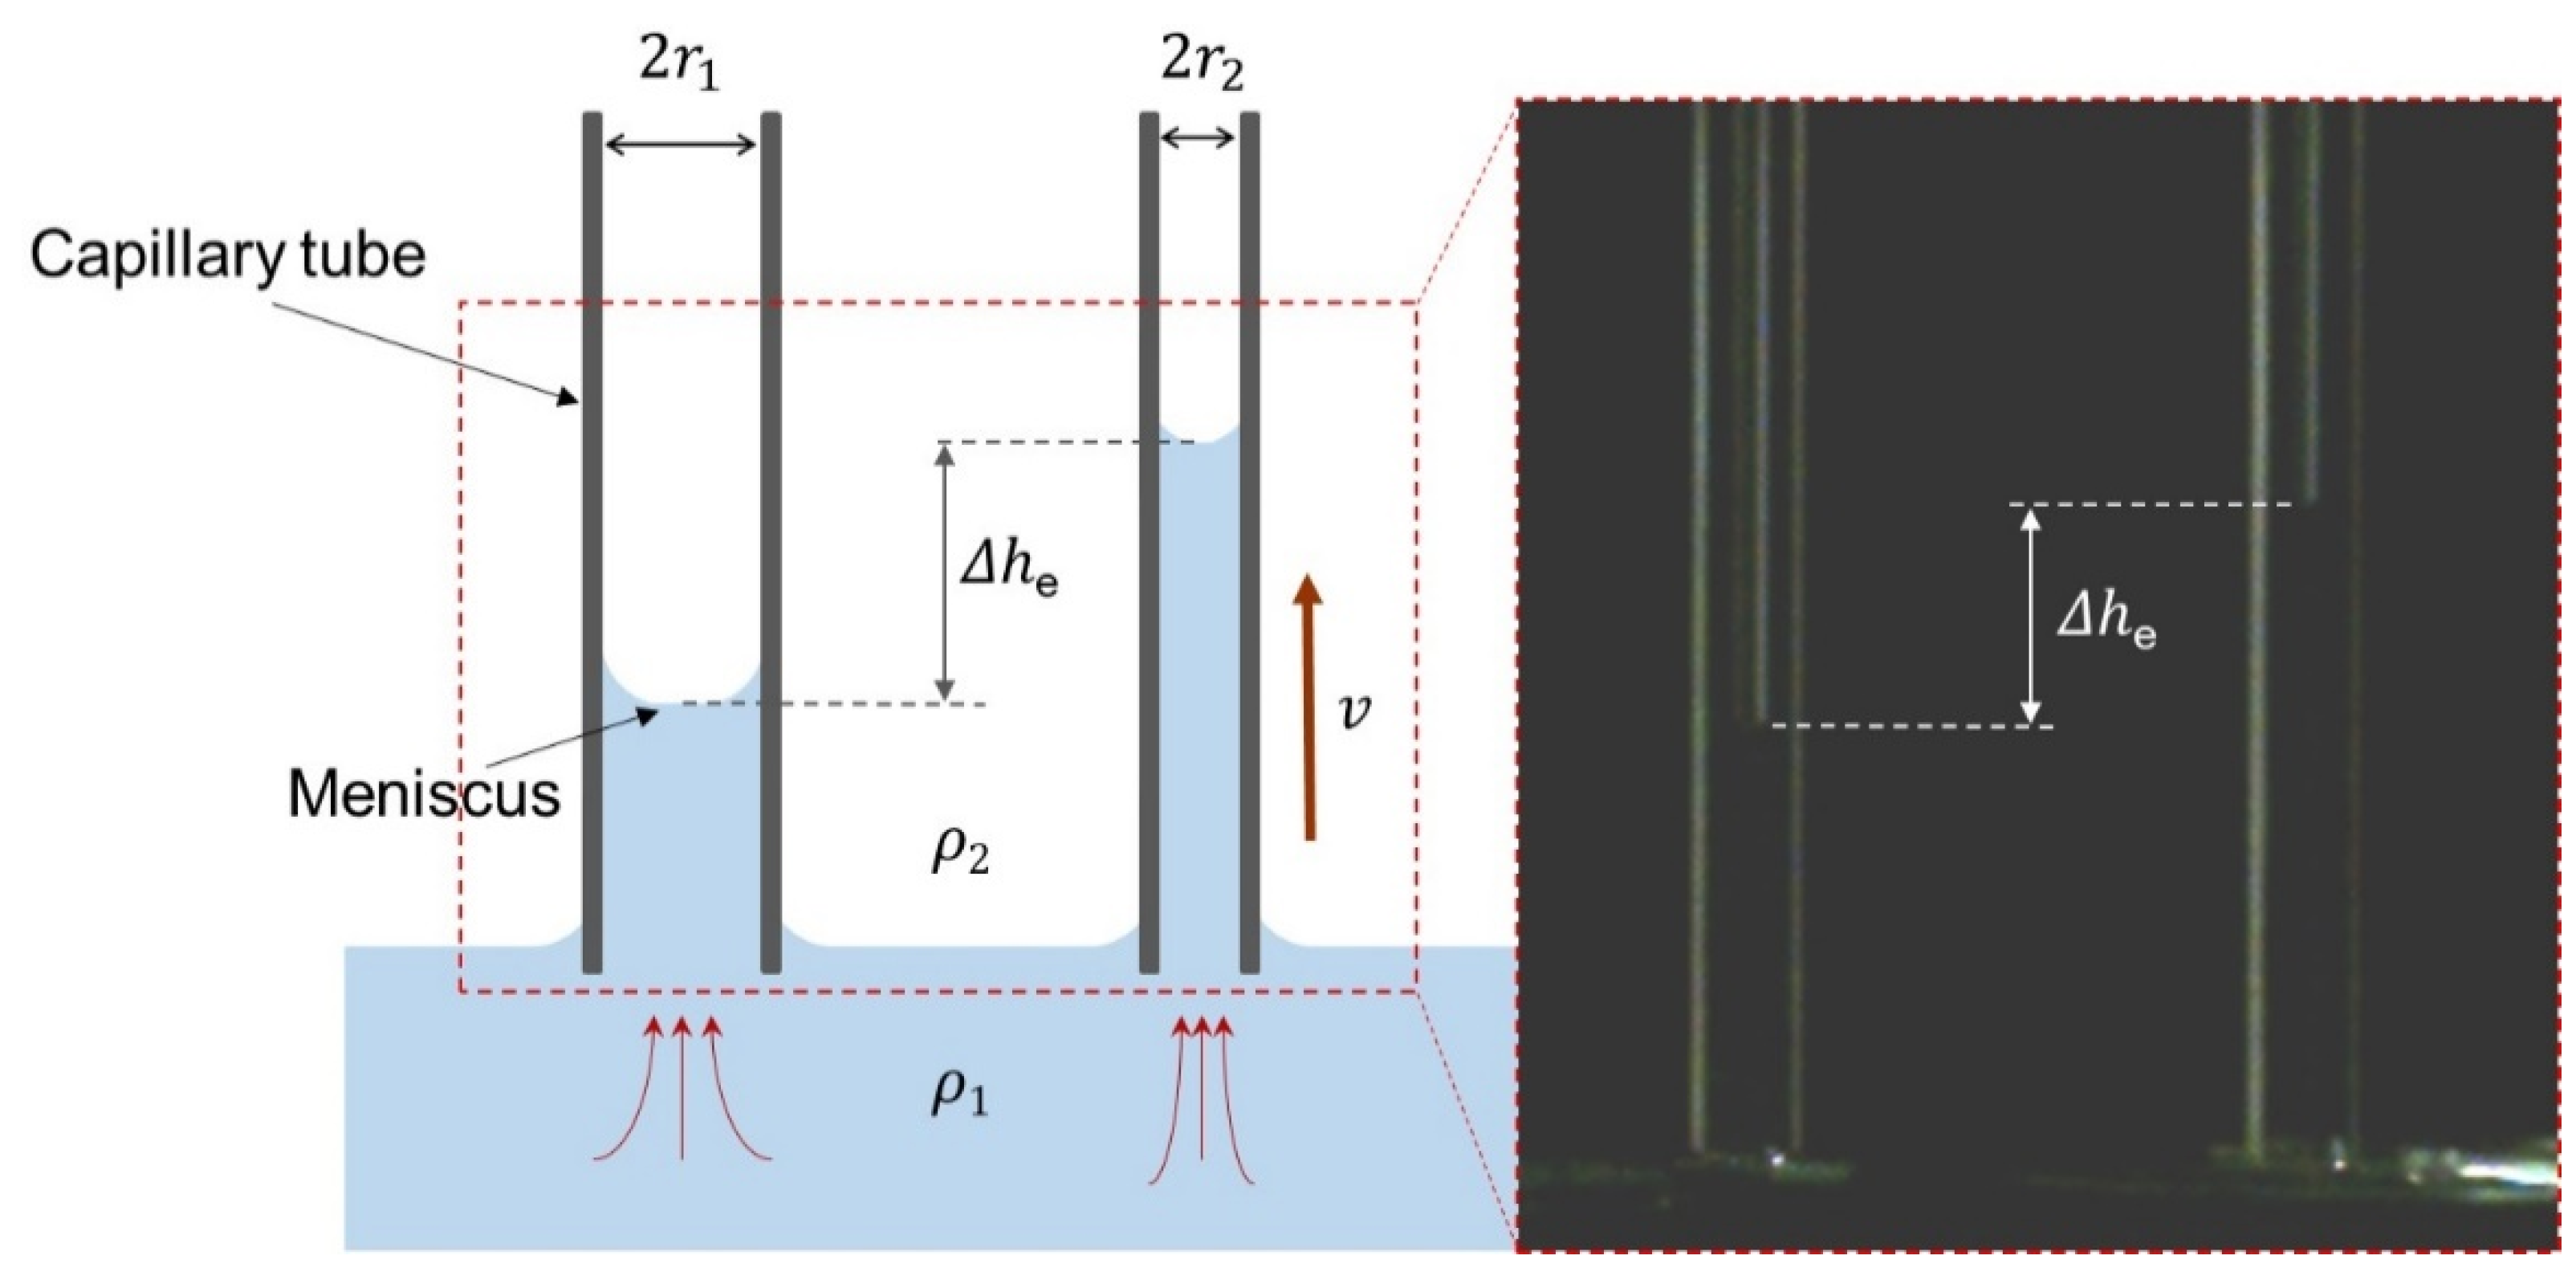
Figure 2 shows the principle of the differential capillary rise method and the captured image for the difference in the rising height. When the liquid contacts the bottom of the capillary tube, the contact forces with the wall of the capillaries aid in the capillary rise (he) for each of the capillary tubes. The height of the meniscus is a function of the capillary radius. σ can be calculated from the difference in the height of the capillary tubes. σ in the captured image on the right side of Figure 2 is calculated by the following equation [24]:
σ = ρ g Δ h e 2 ( r 1 r 2 r 1 r 2 ) ,
studies where σ is the surface tension (mN/m), g is the standard gravity (m/s2), ρ is the density of the liquid (kg/m3), r is the capillary radius (mm), and Δhe is the difference in equilibrium height (mm), which is experimentally measured at the rise height (h) (t → ∞); r1 is larger than r2. The σ for DW was measured with three capillary tube combinations (r1/ r2 = 0.8/1.2, 0.8/1.7, and 1.2 mm/1.7 mm). The measurements were conducted at room temperature (23 ± 1 °C), and the results are presented in Figure 3. The mean value of each test case was 72.17, 72.27, and 71.99 mN/m at r1/ r2 = 0.8/1.2, 0.8/1.7, and 1.2 mm/1.7 mm, respectively. Thus, the mean value of σ for DW was 72.13 mN/m at 23 ± 1 °C, which was consistent with a known value of 72.29 mN/m at 23 °C [25].
To measure the height of rise and velocity, individual images of the liquid invasion inside a single capillary tube were captured at a frame rate of 1000 frames per second (fps) and a pixel resolution of 640 × 640 using a high-speed camera in conjunction with a 105 mm lens (F2.8 EX DG OS HSM MACRO, SIGMA, Japan), as shown in Figure 1b. The pixel size (220 μm/pixel) calibration was based on the known size of the tapeline. Every image for the height of rise of the liquid was obtained with a time resolution of 1 ms (1000 fps), and then the rise velocity was calculated using the frame-to-frame method (Δht). All capillary rise measurements were carried out at room temperature (23 ± 1 °C). Each experiment was repeated five times, and the mean value was calculated, along with standard deviation to measure the error. In addition, there was an additional error of ±1 pixel (220 μm) for the vertical observation because the capillary tip was not perfectly submerged inline with liquid surface in each experiment.

3. Results and Discussion

3.1. Effect of Tube Inner Radius on Capillary Dynamics

Figure 4 shows time series of images for DW, demonstrating the movements of the meniscus during 0.25 s, with different capillary tube radii. In every result obtained at the tube diameter—at 0.4 mm (Figure 4a), 1.2 mm (Figure 4b), and 1.7 mm (Figure 4c)—the location of the meniscus exhibited a common trend with time. In the very early stage of the capillary rise near 0.05 s, as shown in Figure 4c, the rise profile in the vertically oriented tube increased nonlinearly with time. Then, the rise degraded over time. The rise height corresponding to the meniscus location at 0.25 s decreases from 29 to 16 mm, with increase in the tube radius from 0.4 to 0.85 mm. As shown in Figure 3 and Figure 4a, the maximum rise height at r = 0.4 and 0.6 mm was 29 and 23 mm at 0.25 s, respectively. However, the maximum value (17 mm) was observed at 0.08 s and not at 0.25 s, as shown in Figure 4c. This phenomenon, called meniscus oscillation, has been previously reported by researchers [13,26,27]. The main reason for the oscillation is that the kinetic force may lead to the oscillation. More precisely, meniscus oscillation occurs when the boundary layer of viscous grows at a slow pace with low viscous forces, and keeping liquid inertia to balance the capillary and gravitational force only. In other words, the viscous force restrains the meniscus oscillation energy out while fluids rise up in the tube having radius [23]. In addition, this oscillation is affected by liquid temperature and capillary tube diameters [28]. According to the study by Zhmud et al. [29], such oscillations occur when the aspect ratio (tube radius/equilibrium height), r/he, is approximately greater than 0.05. In this study, aspect ratios for tube radius/equilibrium height, 0.4/36.1, 0.6/24.1, and 0.85 mm/16.1 mm, were 0.011, 0.025, and 0.053, respectively. Another criterion proposed by Masoodi et al. [30] describes the occurrence of oscillations and involves using a dimensionless number, ω, as follows:
ω = ρ 2 g r 4 64 μ 2 h e ,
where ρ is the density of the liquid (kg/m3), g is the standard gravity (m/s2), r is the capillary radius (mm), μ is the viscosity of the liquid (m Pa·s), and he is the equilibrium height (mm). The critical value of ω was 0.25, according to Masoodi’s results (oscillation at ω > 0.25). The test case for r = 0.85, in which oscillation occurs in this study, has ω = 5.7.
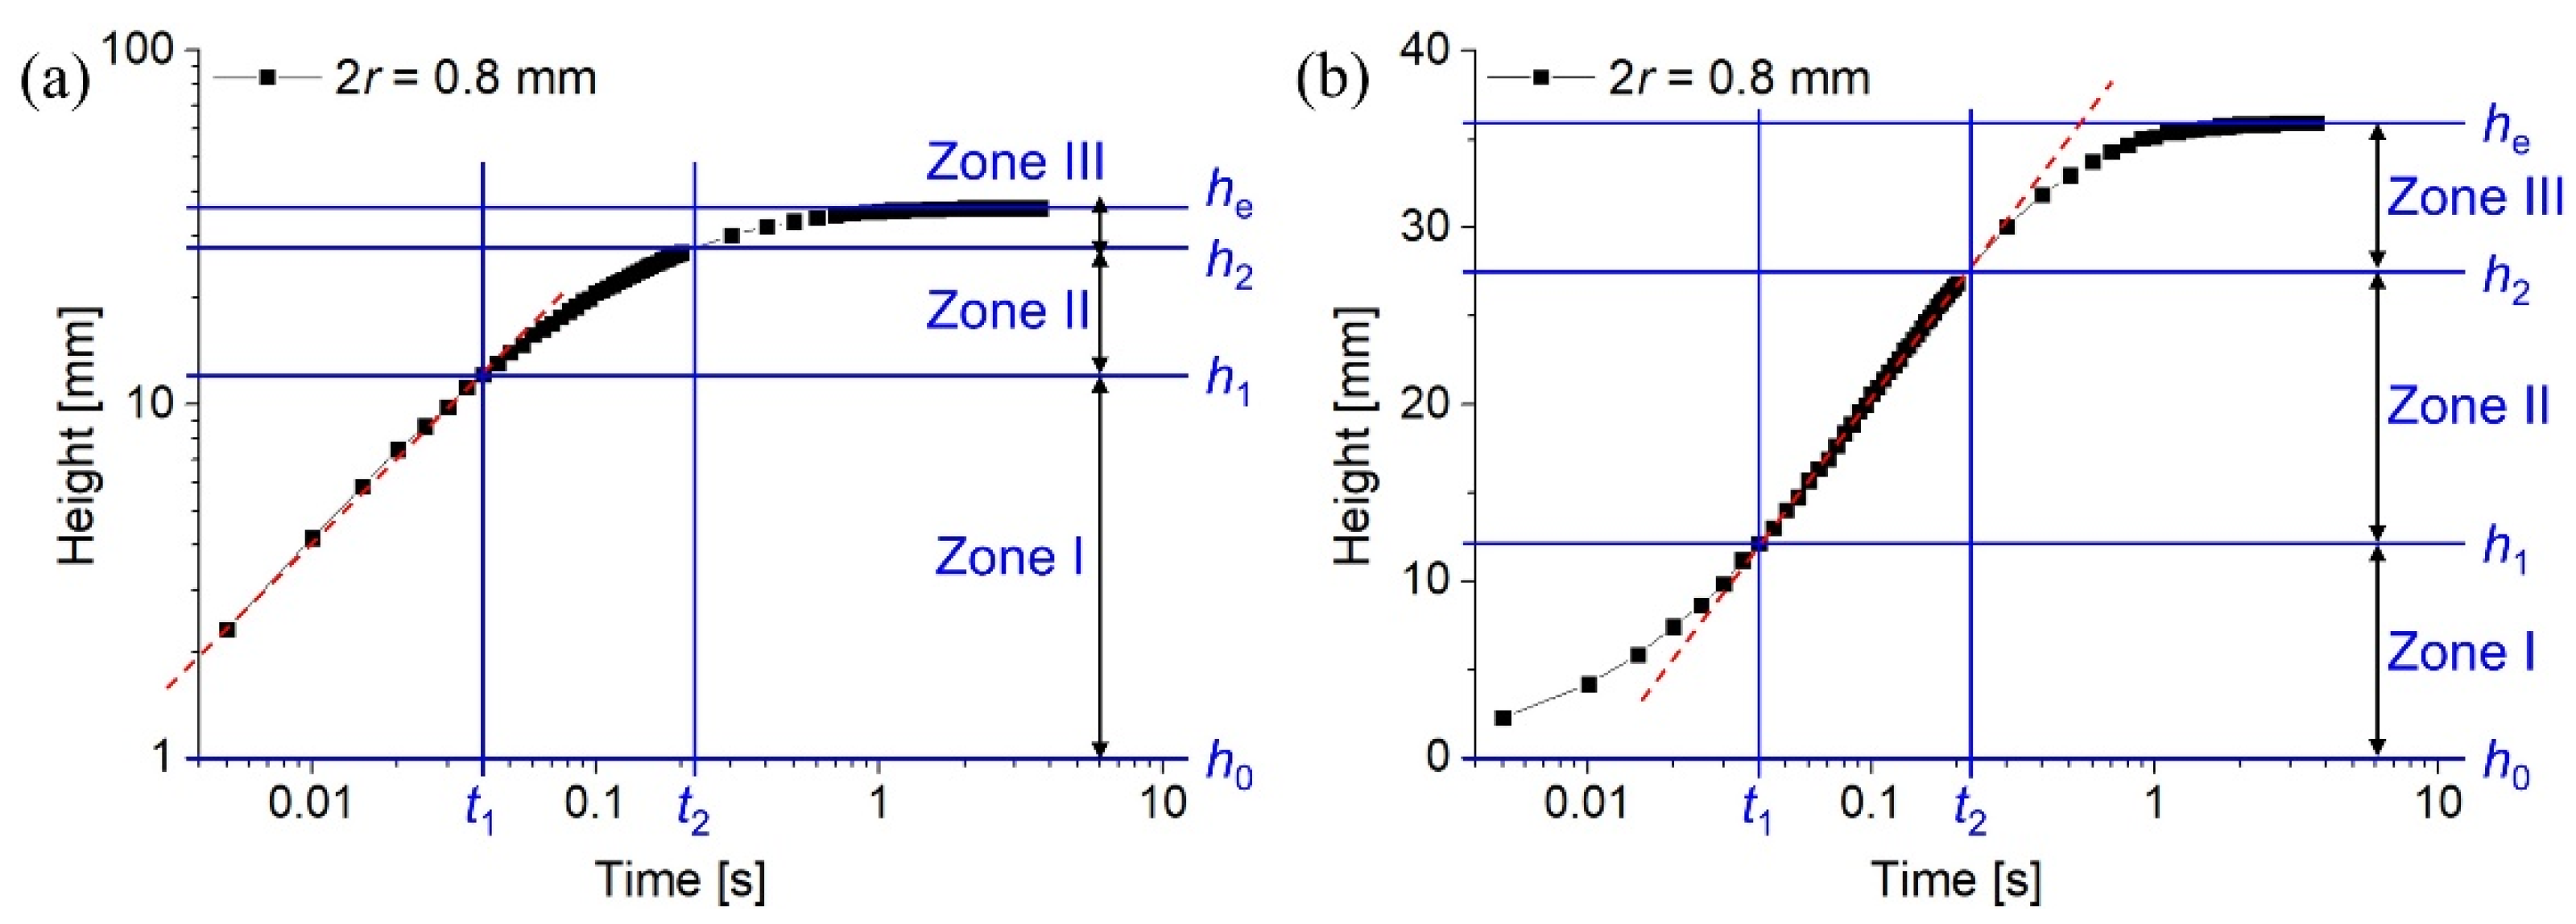
Figure 5 shows the rise height (h) of DW in time (t), which is plotted as log 10 to magnify the differences in the h at the test case of r = 0.4 mm. The capillary rise has several stages [31]: the first stage is purely dominated by inertial forces, the second is where the influence of viscosity increases (visco-inertial flow), and the third is when the effect of inertia becomes nil and the flow becomes purely viscous. According to proposed analytical solutions in the previous studies [16,31,32,33], the capillary rise for the stages I–III can be expressed by Equations (3)–(5), respectively:
h = t 2 σ cos θ ρ r ,
h = σ r cos θ 2 μ [ t ρ r 2 8 μ ( 1 e 8 μ ρ r 2 t ) ] ,
h = σ r cos θ 2 μ t .
Figure 5a shows both h and t expressed in log scales for identifying the early stage of the rise by inertial forces, as found in previous studies [16,19,34]. In Figure 5a, the red dotted line represents a linear variation of h versus t in the inertial stage of the capillary rise dynamics. However, it was difficult to divide the stages after the first stage using inertial forces. In this study, we modified Figure 5a as Figure 5b, where h is plotted as a function of t and expressed in millimeters to clearly describe the various stages of a capillary rise phenomenon. The capillary rise can be divided into three characteristic stages: Stage I is the purely inertial region, Stage II is inertial + viscous region, and Stage III is purely viscous region). Similar studies in terms of segregation of the capillary rise process have been reported [18,35]. Stage II shows a linear increase in h with t. Meniscus height increases as per the parabolic law were observed at both Stages I and III. The h1 represents the transition between Stages I and II, and h2 represents the transition between Stages II and III. The he was calculated as the position at 0.99he at the start of initiating the capillary rise. End positions of individual stages (Stages I, II, and III), such as heights (h1, h2, and he), can also be expressed for their corresponding times t1, t2, and te, respectively. As shown in Figure 6, comparing the experimental results of this study with Equations (3)–(5) shows that the capillary rise height of water is relatively well described with the models in the early stage. Therefore, the transition time between Stages I and II was calculated by t1 = ρr2/4μ [31,34] based on the Washburn’s equation. The value of t1 was 0.045 in rather good agreement with this study, as shown in Figure 5b. For the transition time between Stages II and III, t2 was determined at the point where the linear region ends at the start point of t1. The lengths (including percentages of corresponding Stages I, II, and III) of the inertial, inertial + viscous, and viscous stages, and their end positions are given in Table 1 with different tube radii.
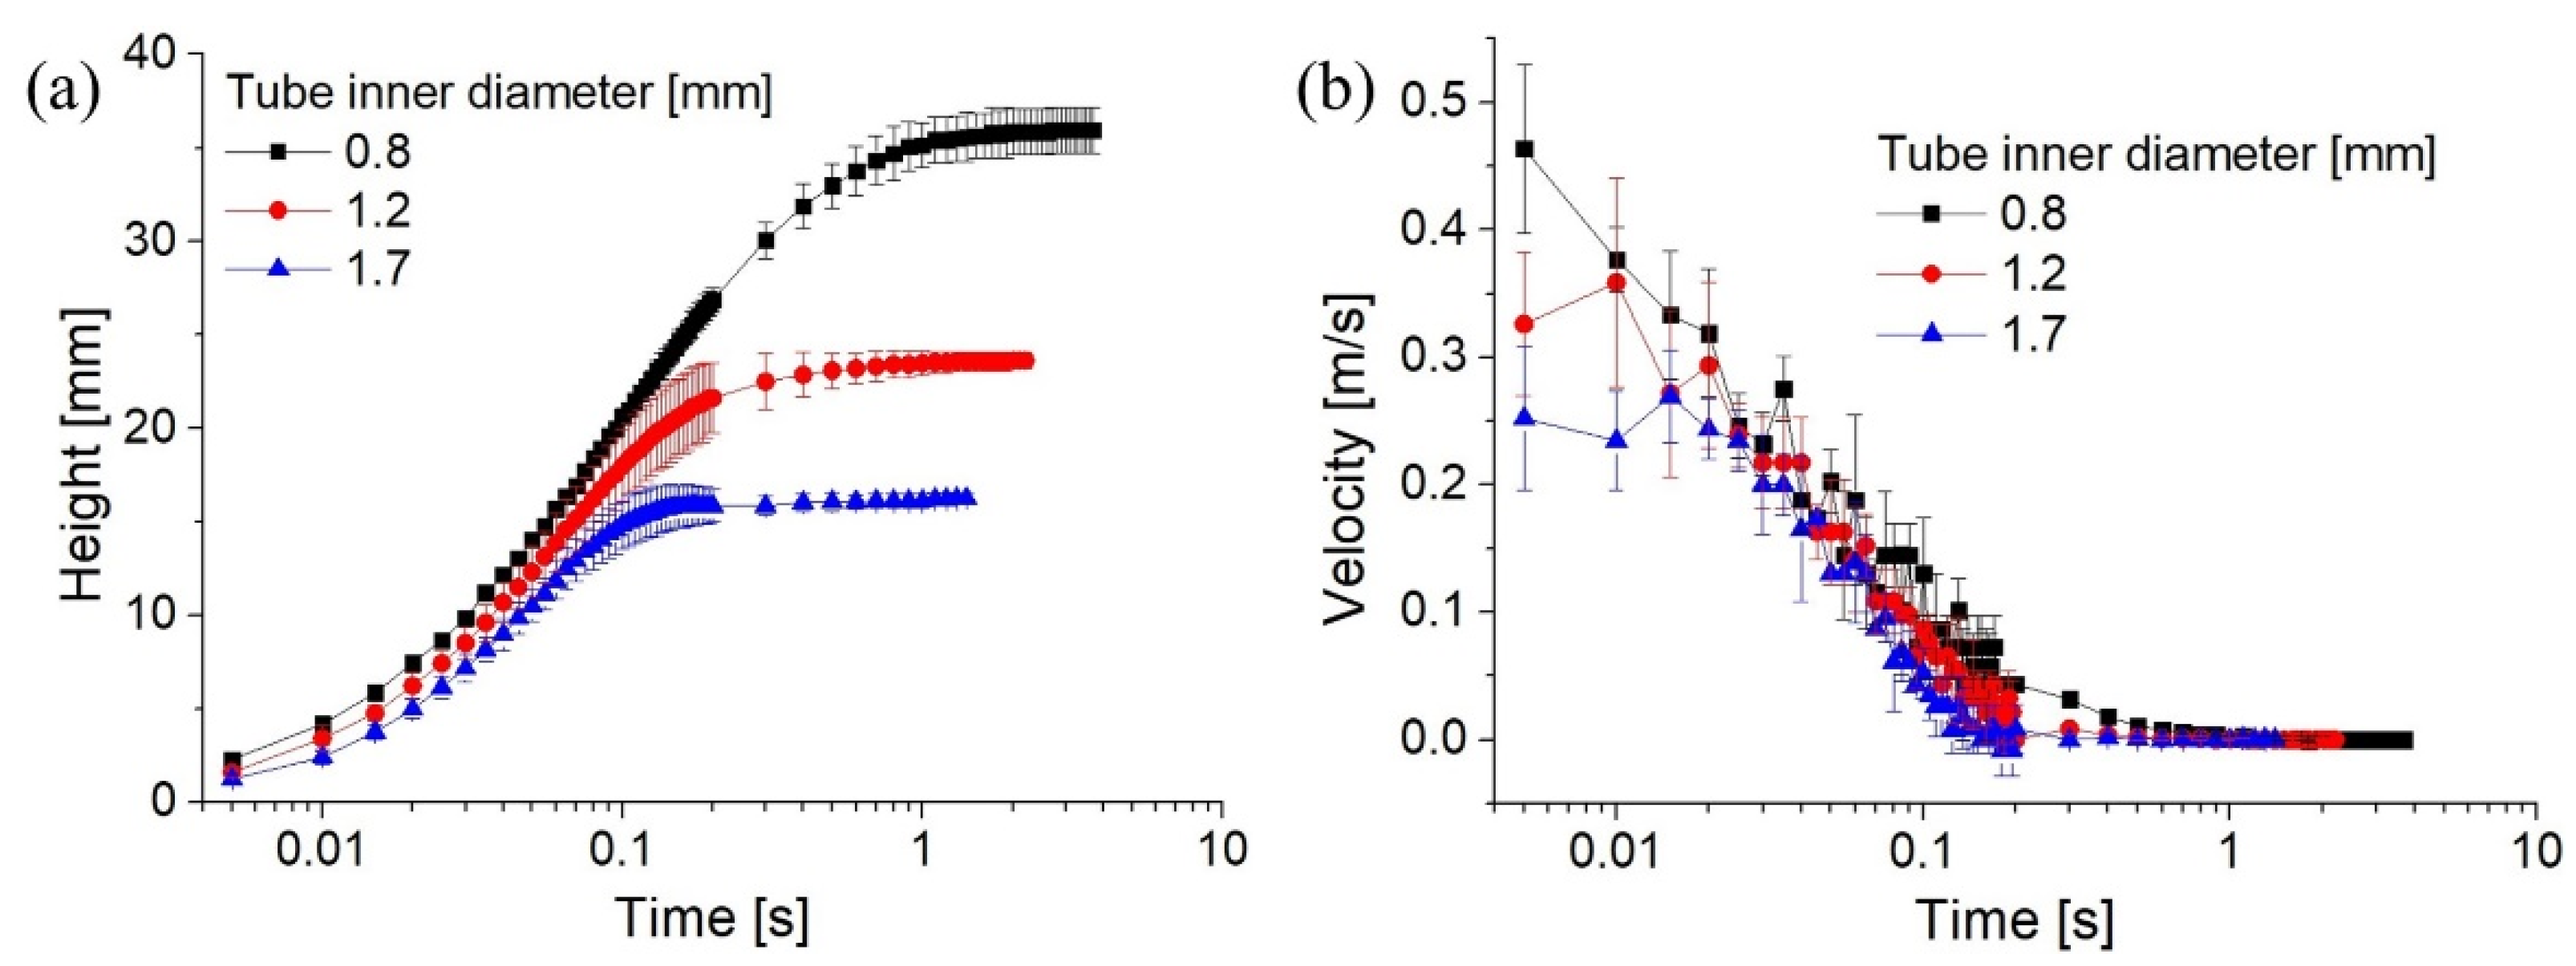
The results in Table 1 were obtained from the data (h versus t) in Figure 7a and using the method shown in Figure 5b. As shown in Figure 5b and Table 1 at the test case of r = 0.4 mm, the sequence for the length of each stage was as follows: Stage II (inertial + viscous) > Stage I (inertial) > Stage III (viscos region). In the capillary rise processes for r = 0.4 mm, the lengths of Stages I, II, and III were 11.2, 16.4, and 8.3 mm, corresponding to 31.2%, 45.7%, and 23.1%, respectively. Stage II was completed at time point (t2) of approximately 0.23 s. This period is a relatively short time for the entire rise process, therefore, it is an early stage. These results indicate that the capillary rise at the early stage is dominantly influenced by the pure inertia and hybrid (inertia + viscous) regions rather than by the pure viscous region. The length of Stages I + II and III was 27.6 and 8.3 mm, corresponding to 76.9%, and 23.1%, respectively. This influence was more noticeable at higher tube radius. The length of Stage III, which is a purely viscous region, was reduced from 23.1% to 9.3% with the increase in the capillary tube radius from 0.4 to 0.85 mm. Additionally, the time expressed as t2 corresponding to h2 was reduces from 0.23 to 0.1 s with the capillary tube radius increasing from 0.4 to 0.85 mm, as shown in Figure 7a. Based on these results, the capillary rise dynamics can be controlled by the tube diameter, regardless of whether the flow is inertial dominant or viscous dominant in all the capillary rise applications.
The effect of the tube radius on the capillary rise height is shown in Figure 7a. At the end of Stage III, gravitational forces become significant owing to the balance of gravity and capillarity. The meniscus stops at the equilibrium capillary rise height (he) expressed as follows [15,36]:
h e = 2 σ cos θ e ρ g r ,
where σ is the surface tension (mN/m), g is the standard gravity (m/s2), ρ is the density of the liquid (kg/m3), r is the capillary radius (mm), and θe is the contact angle. From Figure 7a and Table 1, he was 35.9, 24.1, and 16.1 mm at tube radii 0.4, 0.6, and 0.85 mm, respectively. The theoretical prediction values were 36.8 at r = 0.4 mm, 24.5 at r = 0.6 mm, and 17.3 at r = 0.85 mm. In this theoretical prediction for Equation (6), we used cosθe = 1 in all the test conditions because the contact angle for water at he was measured to be very small by [17]. In Figure 7a, it is expected that the contact angle θ varies in time, and the value of cosθ extracted from Equation (3) increases with increasing the time (or rise height). At the equilibrium state, the value of cosθ reaches unity (cosθe = 1) and its value in this study was 0.98, 0.98, and 0.93 at tube radii 0.4, 0.6, and 0.85 mm, respectively. In addition, the effect of capillary tube radii on the rise height depends on the capillary pressure (PC). The isothermal pressures in gas (PG) and liquid (PL) phases are defined as the PC that is:
P C = P G P L .
The equilibrium relation between the pressures on the two sides of an interface can be expressed by well-known Young–Laplace equation as given below for a spherical meniscus in a cylindrical tube [37,38]:
P C = 2 σ r cos θ ,
where r is the radius of capillary tube, σ is the surface tension between the gas and liquid phases, and θ is the contact angle of the gas-liquid interface with respect to the solid surface. In Equation (8), the surface tension of and the tube radius are the parameters that affect capillary pressure at fixed value of cosθ = 1. At r = 0.4, 0.6, and 0.85 mm in radii, the PC values were 360, 240, and 169 N/m2, respectively. The trend of capillary rise height with a variation in tube radii was consistent with the results of capillary pressures. As shown in Figure 7b, the larger the radius of the capillary tube, the lower is the maximum instantaneous rise velocity. At r = 0.4, 0.6, and 0.85 mm in radii, the peak velocity values were 0.46, 0.36, and 0.27 m/s, respectively. The velocity decreases after reaching the peak value and tends to converge to zero near he. These trends are in qualitative agreement with a previous publication [20,23,39,40]. Regarding the effects of changes in the radius, we demonstrated that the capillary rise is sensitive to the radius; thus, the capillary radius is an important control parameter in the capillary rise dynamics.

3.2. Effect of Surface Tension of the Fluids on Capillary Rise Dynamics

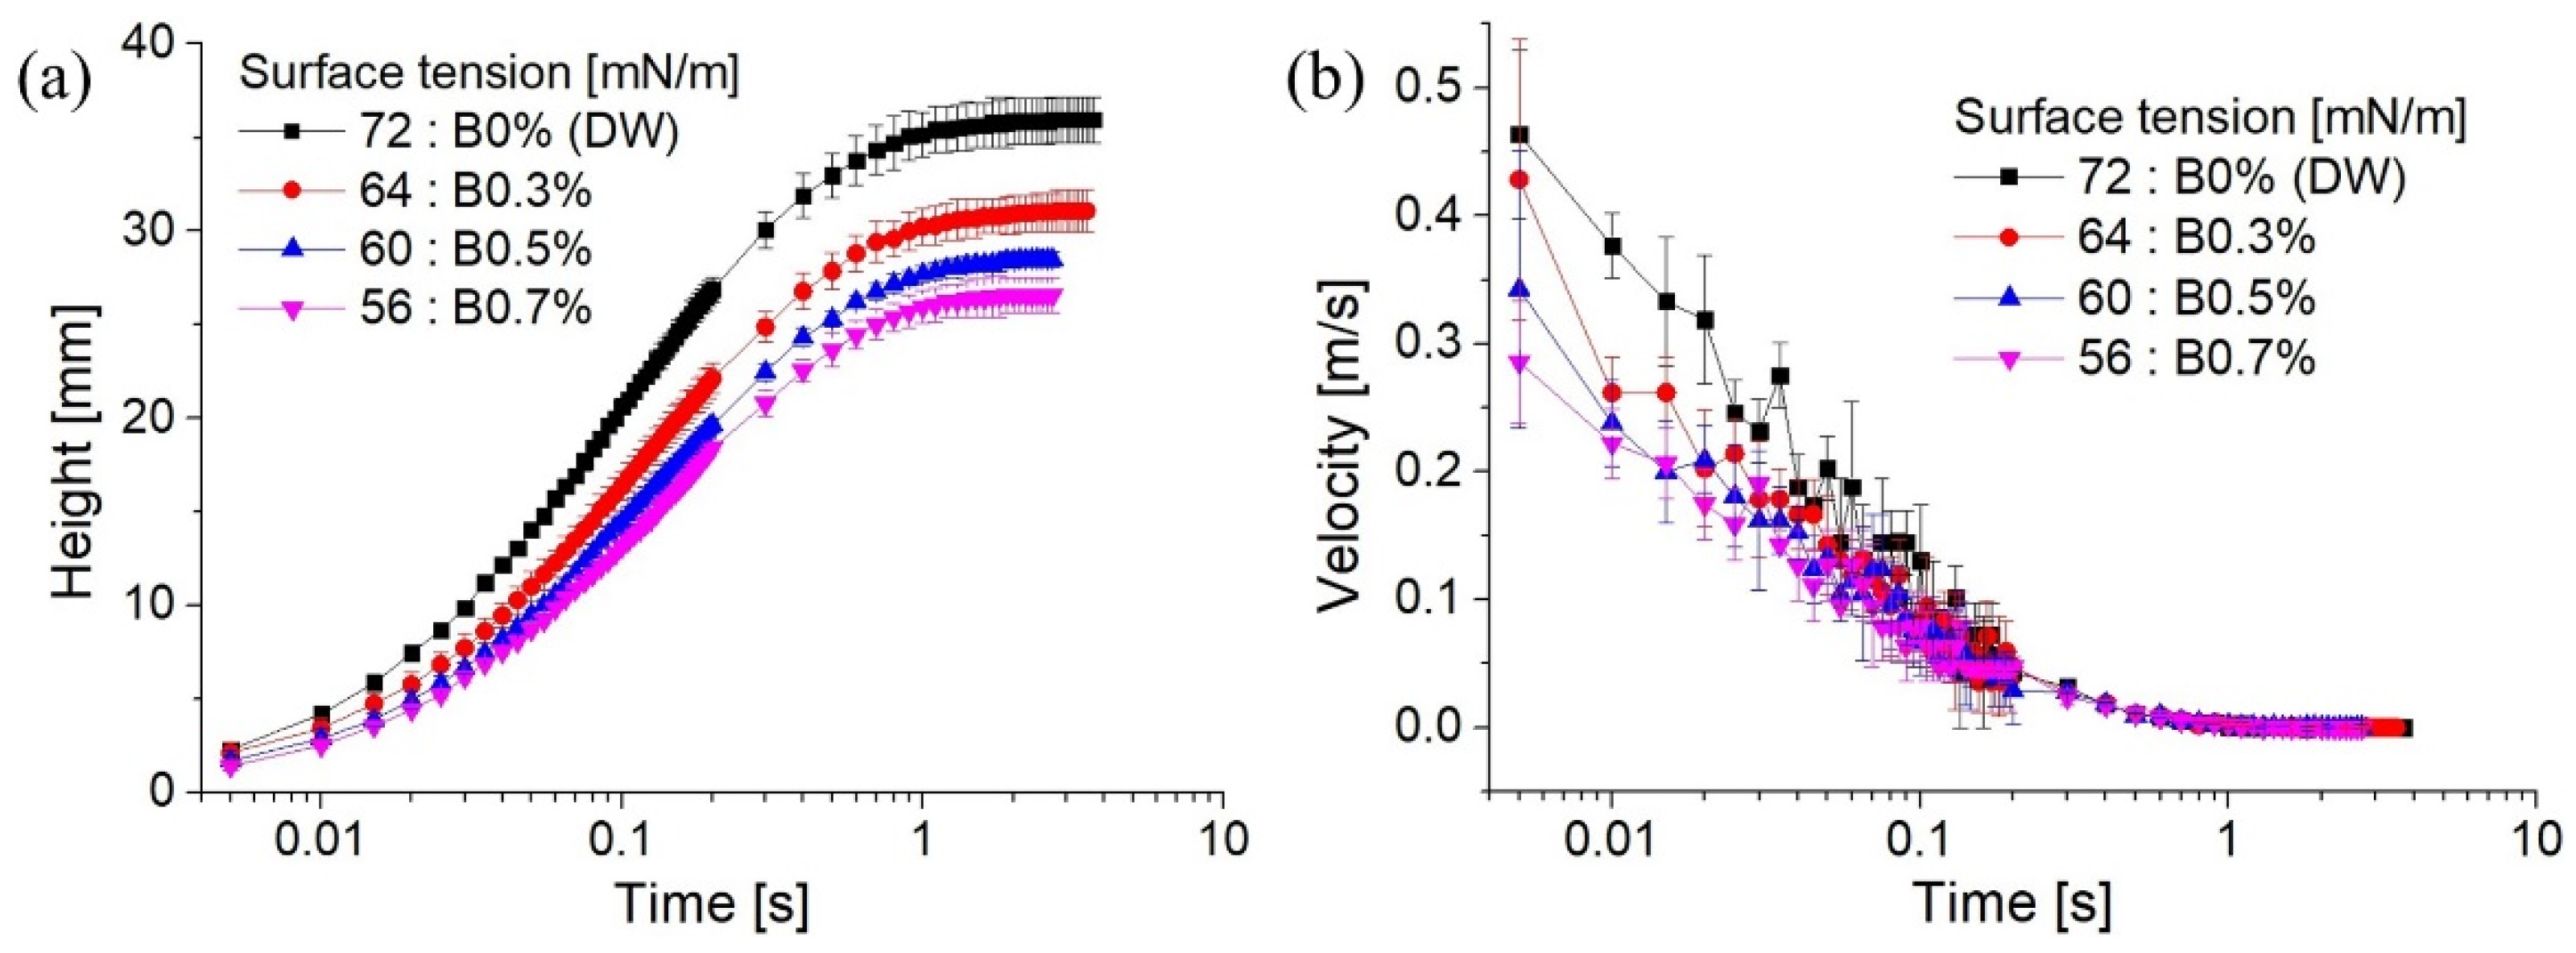
Experiments were performed in a single capillary tube (r = 0.4 mm) at room temperature (23 ± 1 °C) to evaluate the effect of liquid surface tension on the capillary rise dynamics. Based on the measurement method shown in Figure 2, the σ values of the test materials for B0% (DW), B0.3%, B0.5%, and B0.7% were approximately 72, 64, 60, and 56 mN/m, respectively. The values of σ were consistent with the measurement results obtained from the pendant drop method [41,42] with SmartDrop (SmartDrop Plus HS, Femtobiomed Inc., Gyeonggi-do, South Korea). The measurement σ values for B0% (DW), B0.3%, B0.5%, and B0.7% in the pendent drop method were 72.32 ± 0.42, 64.25 ± 0.73, 60.02 ± 0.67, and 56.19 ± 0.57 mN/m, respectively. The addition of n-butanol in a low concentration causes a considerable decrease in the interfacial tension of water/butanol mixtures. This phenomenon stems from the property of pure n-butanol that has a relatively low surface tension (24 mN/m) compared to DW (72 mN/m). For this reason, the surface tension of the butanol-added solutions sharply decreases with increasing butanol concentration until it reaches a critical concentration, after which the surface tension decreases monotonically. The critical mass concentrations of alcohol/water solutions with butanol, pentanol, and hexanol were 3%, 0.5% and 0.3%, respectively [43]. In general, the σ of n-butanol/water mixtures as well as other alcohol/water mixtures depend on their corresponding temperature and composition, and even at low n-butanol concentrations of 0 to 1 wt%, the σ value varies [43,44]. Figure 8 shows the capillary rise dynamics for four different concentrations of n-butanol/water mixtures with different values of σ. Generally, as shown in Figure 8, all measurements show that the height of rise increases with time; however, the velocity of rise at which the meniscus moves through the capillary decreases over time, as shown in Figure 8b. In addition, the height of rise decreased with an increase in the concentration of n-butanol. In particular, he was 35.9, 32.1, 28.7, and 26.6 mm at B0%, B0.3%, B0.5%, and B0.7%, respectively. The viscosity, which depends on the concentration of blends, can be one of the parameters that plays an important role in capillary dynamic parameter because the viscosity can be changed due to the blends during the rising period. To calculate the equilibrium capillary rise height (he) that is considered as steady state characteristics of blends, Equation (3), using the surface tension of the blends and well-established and widely used by the balance of gravity and capillarity, was used [45]. As shown in Figure 8b, the higher the σ of the mixtures, the lower is the maximum instantaneous rise velocity. At B0%, B0.3%, B0.5%, and B0.7%, the peak velocity values were 0.45, 0.41, 0.34, and 0.3 m/s, respectively. The peak velocity when comparing σ values was observed at the same position on time basis (0.005 s), as shown in Figure 8b, unlike the peak values observed at different positions when comparing the capillary radii shown in Figure 7b. In Figure 8b, the peak value decreases systematically with σ because there is no oscillation phenomenon, as shown in Figure 4.
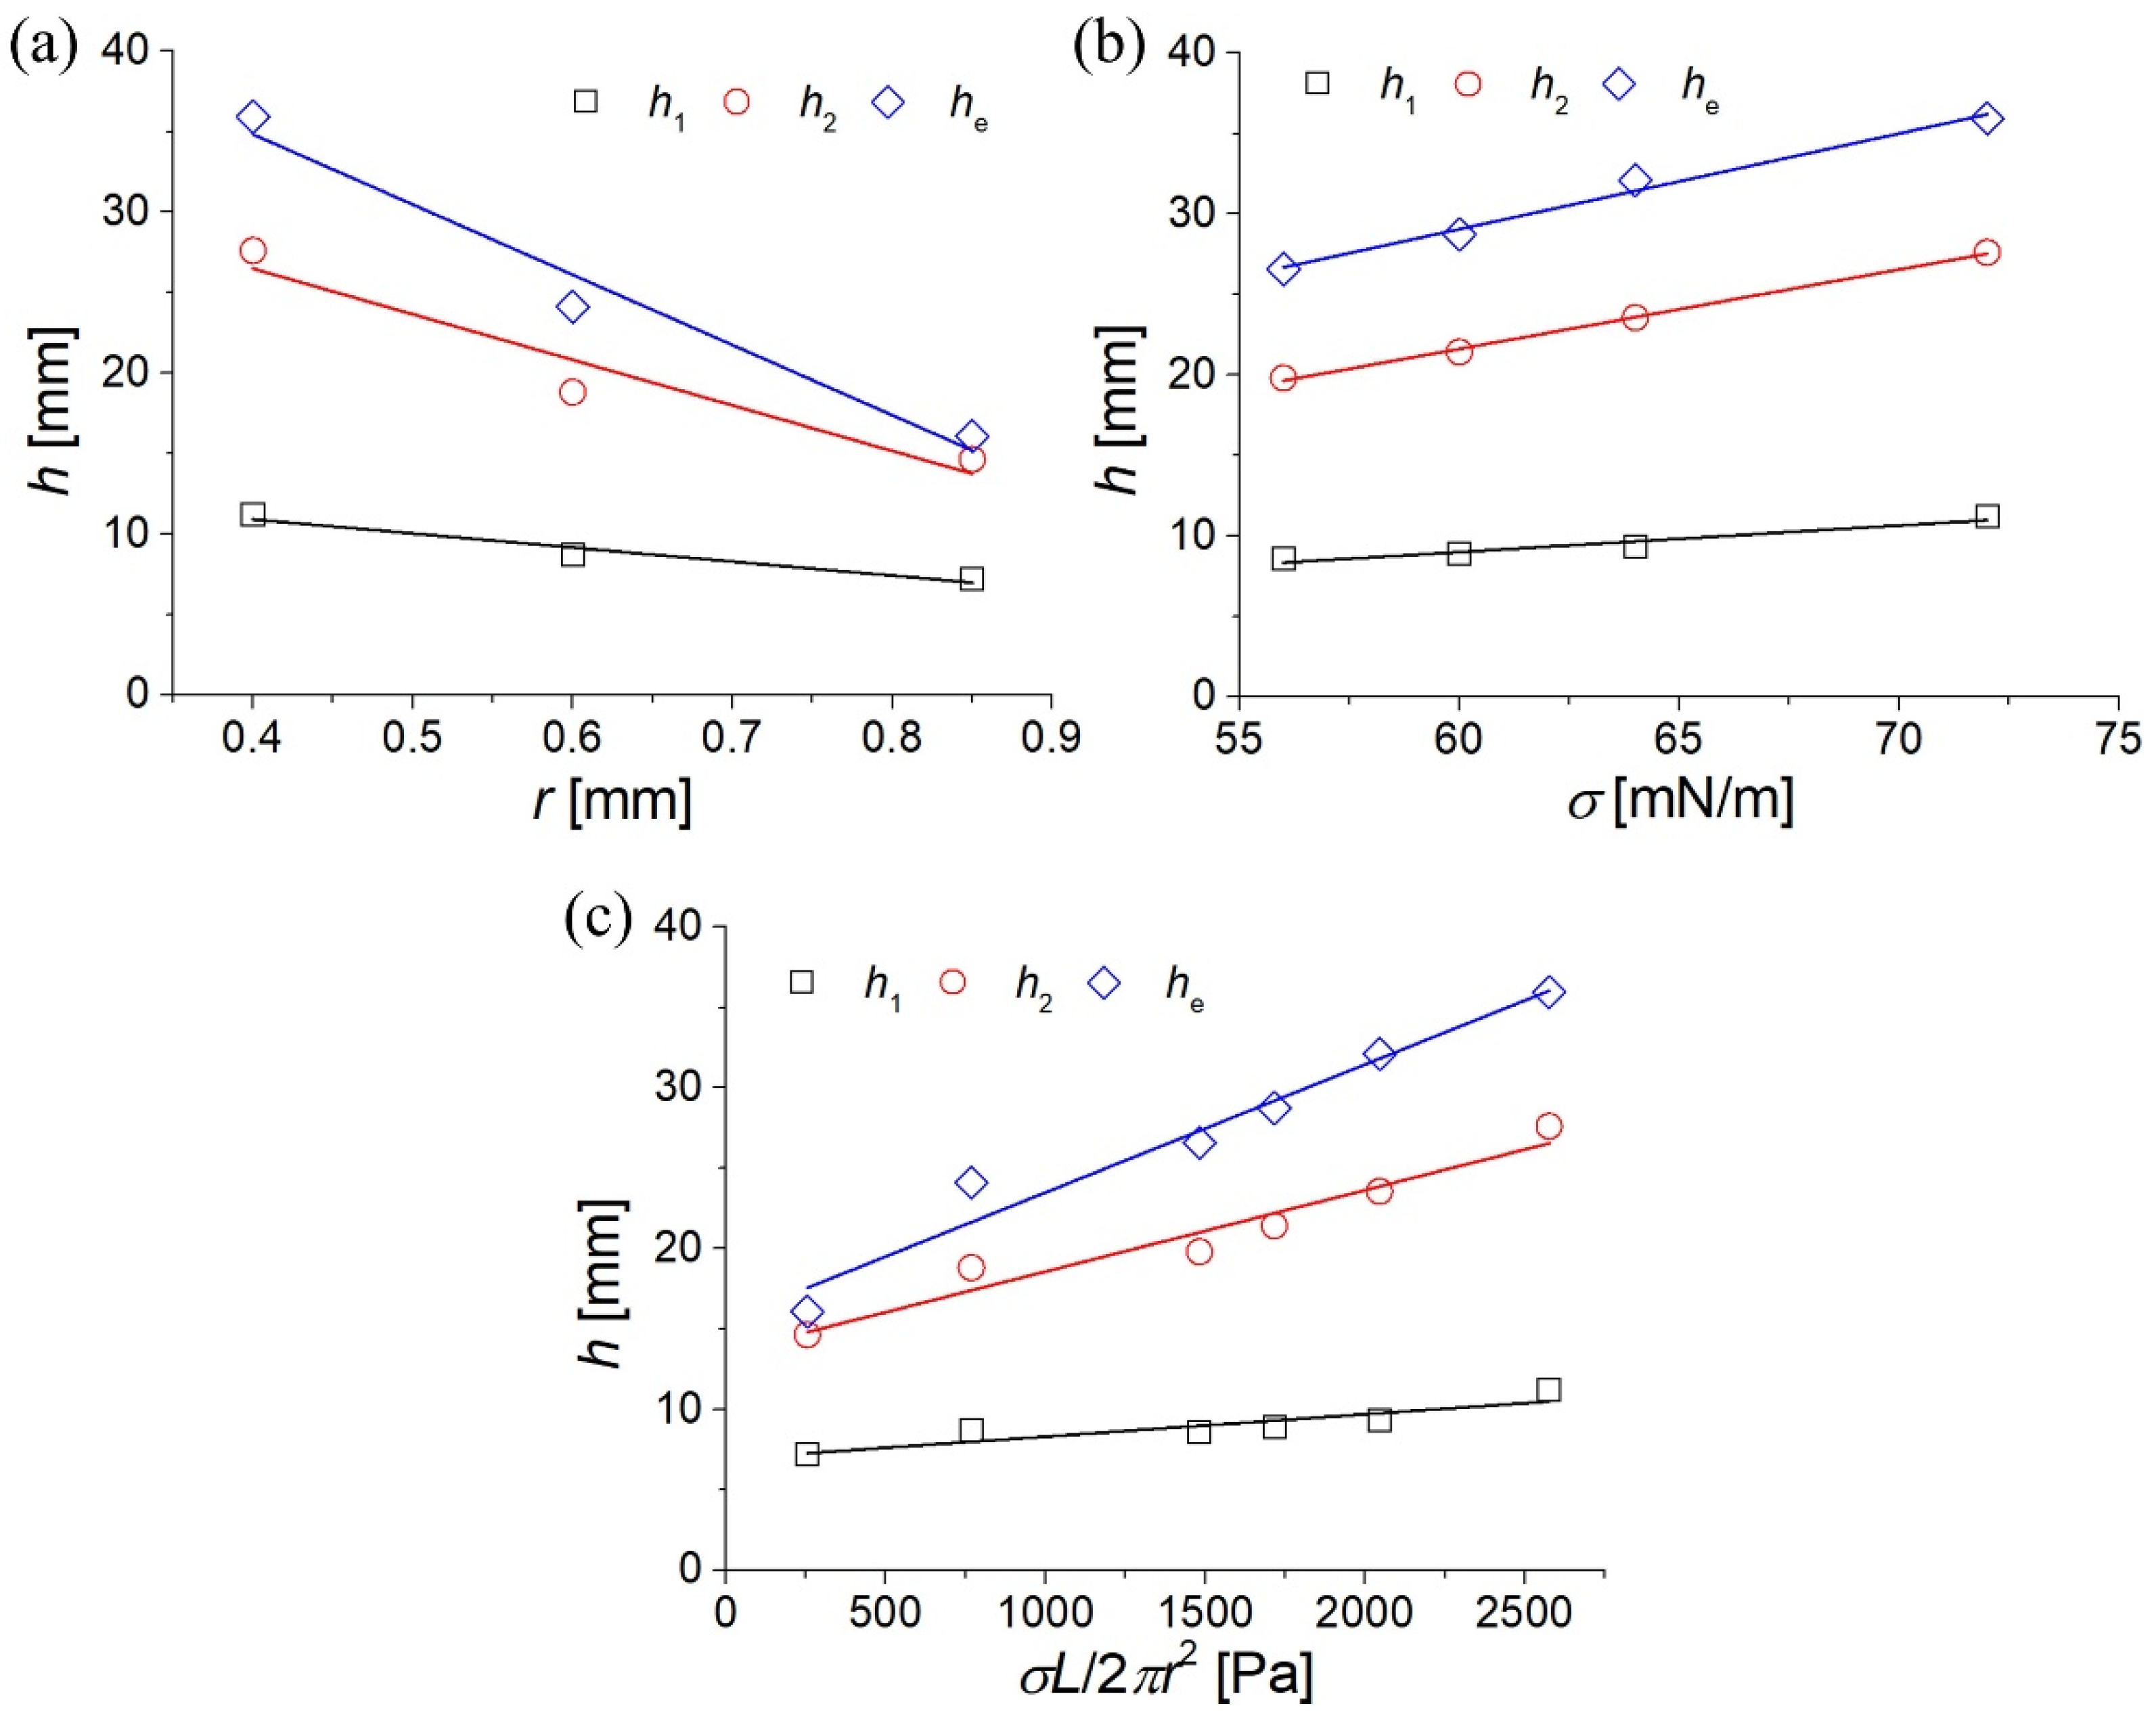
Table 2 shows the lengths of characteristic stages (as defined in Figure 5) of n-butanol/water mixtures at r = 0.4 mm. In each of Stage I, II, and III length, the overall trend was dependent upon the increase in n-butanol blending ratios. The length increases with the increase of n-butanol ratio in Stage II, whereas there was no similar trend observed in Stages I and III, for the same condition. In the comparison between Table 1 and Table 2, the characteristic h in lengths of Stages I, II, III shows a clear trend with increasing r and σ. To clarify these relations for parameters such as capillary tube radius and liquid surface tension on the capillary rise characteristics, we analyzed a consolidated quantity between r and σ on characteristic heights. The quantity, which is a formulation analogous to pressure (σL/2πr2), was a consolidated expression of liquid surface tension (σ), capillary tube length (L), and tube surface area (2πr2). Figure 9 shows the characteristic heights h1, h2, and he as a function of r, σ, and σL/2πr2. Straight lines represent linear fits between characteristic heights and each of the comparative parameters. In Figure 9a, characteristic heights showed a linear decrease with capillary tube radius. The characteristic heights are also linearly dependent on σ, as shown in Figure 9b. Each of characteristic heights becomes a linear function of σL/2πr2 as shown in Figure 9c. In Figure 9c, the linearity (R-square) of h1, h2, and he with r and σ was 0.78, 0.93, and 0.95. Hence, all the characteristic heights increase with an increase of the said function. This linear increment was more noticeable in the sequence of h1 < h2 < he. As such, the slope value of h1, h2, and he with the quantity was 0.00139, 0.00506, and 0.00796.

4. Conclusions

The experimental correlation between the capillary tube radius and the liquid surface tension on the capillary rise dynamics was investigated. The conclusions of the present study are summarized as follows:
(1)
The height of rise and the velocity of rise are dependent on the capillary tube radii. The larger the radius, the lower is the equilibrium height and the velocity of rise. The meniscus oscillation was observed only at the test case of r = 0.85.
(2)
The capillary rise process is divided into three characteristic stages: the inertial (Stage I), inertial + viscous (Stage II), and viscous (Stage III) flow region. The capillary rise was predominantly influenced by the pure inertia and hybrid region (inertia + viscous).
(3)
The capillary rise height decreased with an increase in the concentration of n-butanol and with a decrease in the surface tension of n-butanol/water mixtures. With respect to the velocity of rise, the higher the surface tension of the mixtures, the higher the velocity.
(4)
There were some correlations between the characteristic heights (h1, h2, and he) and the capillary tube radius and liquid surface tension. Characteristic heights showed a linear decrease in the capillary tube radius and a linear decrease in the liquid surface tension. Consequentially, each characteristic height exhibited a linear function of the consolidated quantity of σL/2πr2.

Author Contributions

Conceptualization, H.J.; methodology, S.P.; software, J.C.; investigation, S.B.; data curation, J.S.; writing—original draft preparation, S.J. and S.B.; writing—review and editing, S.B. and Y.S.; visualization, S.L.; project administration, Y.S.; funding acquisition, Y.S. All authors have read and agreed to the published version of the manuscript.

Funding

This work was supported by the National Research Foundation of Korea (NRF) grant funded by the Korea government (MSIT) (No. 2020R1F1A1049268).

Conflicts of Interest

The authors declare no conflict of interest.

Abbreviations

Bn-butanol
DWDistilled water
gStandard gravity [m/s2]
hCapillary rise height [mm]
h1Height at the transition time between the purely inertial and the visco-inertial stage [mm]
h2Height at the transition time between the visco-inertial and the purely viscous stage [mm]
heEquilibrium capillary rise height [mm]
LCapillary tube length [mm]
PCCapillary pressure [Pa]
PGPressure in gas [Pa]
PLPressure in liquid [Pa]
rCapillary tube radius [mm]
t1Transition time between the purely inertial and the visco-inertial stage [s]
t2Transition time between the visco-inertial and the purely viscous stage [s]
θeEquilibrium contact angle [°]
μViscosity of liquid [mPa·s]
ρDensity of liquid [kg/m3]
σSurface tension of liquid [mN/m]

References

  1. Esfandyari, H.; Hoseini, A.H.; Shadizadeh, S.R.; Davarpanah, A. Simultaneous evaluation of capillary pressure and wettability alteration based on the USBM and imbibition tests on carbonate minerals. J. Pet. Sci. Eng. 2021, 200, 108285. [Google Scholar] [CrossRef]
  2. Davarpanah, A. Parametric study of polymer-nanoparticles-assisted injectivity performance for axisymmetric two-phase flow in EOR processes. Nanomaterials 2020, 10, 1818. [Google Scholar] [CrossRef] [PubMed]
  3. Pan, F.; Zhang, Z.; Zhang, X.; Davarpanah, A. Impact of anionic and cationic surfactants interfacial tension on the oil recovery enhancement. Powder Technol. 2020, 373, 93–98. [Google Scholar] [CrossRef]
  4. Esfandyari, H.; Shadizadeh, S.R.; Esmaeilzadeh, F.; Davarpanah, A. Implications of anionic and natural surfactants to measure wettability alteration in EOR processes. Fuel 2020, 278, 118392. [Google Scholar] [CrossRef]
  5. Das, P.K.; Mallik, A.K.; Ganguly, R.; Santra, A.K. Synthesis and characterization of TiO2-water nanofluids with different surfactants. Int. Commun. Heat Mass Transf. 2016, 75, 341–348. [Google Scholar] [CrossRef]
  6. Fumoto, K.; Sasa, M.; Okabe, T.; Savino, R.; Inamura, T.; Shirota, M. Research on heat transfer performance of the open-loop micro pulsating heat pipe with self-rewetting fluids. Microgravity Sci. Technol. 2019, 31, 261–268. [Google Scholar] [CrossRef]
  7. Gan, J.S.; Hung, Y.M. Thermal analysis of Al2O3/water nanofluid-filled micro heat pipes. RSC Adv. 2015, 5, 26716–26725. [Google Scholar] [CrossRef]
  8. Savino, R.; di Francescantonio, N.; Fortezza, R.; Abe, Y. Heat pipes with binary mixtures and inverse Marangoni effects for microgravity applications. Acta Astron. 2017, 61, 16–26. [Google Scholar] [CrossRef]
  9. Berthier, J.; Brakke, K.A.; Furlani, E.P.; Karampelas, I.H.; Poher, V.; Gosselin, D.; Cubizolles, M.; Pouteau, P. Whole blood spontaneous capillary flow in narrow V-groove microchannels. Sens. Actuator B Chem. 2015, 206, 258–267. [Google Scholar] [CrossRef]
  10. Li, J.; Zou, Y.; Cheng, L. Experimental study on capillary pumping performance of porous wicks for loop heat pipe. Exp. Therm. Fluid Sci. 2010, 34, 1403–1408. [Google Scholar] [CrossRef]
  11. Huang, S.; Wan, Z.; Zhang, X.; Yang, X.; Tang, Y. Evaluation of capillary performance of a stainless steel fiber-powder composite wick for stainless steel heat pipe. Appl. Therm. Eng. 2019, 148, 1224–1232. [Google Scholar] [CrossRef]
  12. Li, X.; Yao, D.; Zuo, K.; Xia, Y.; Zeng, Y.P. Effects of pore structures on the capillary and thermal performance of porous silicon nitride as novel loop heat pipe wicks. Int. J. Heat Mass Transf. 2021, 169, 120985. [Google Scholar] [CrossRef]
  13. Cao, H.; Amador, C.; Jia, X.; Ding, Y. Capillary dynamics of water/ethanol mixtures. Ind. Eng. Chem. Res. 2015, 54, 12196–12203. [Google Scholar] [CrossRef]
  14. O’Loughlin, M.; Wilk, K.; Priest, C.; Ralston, J.; Popescu, M.N. Capillary rise dynamics of aqueous glycerol solutions in glass capillaries: A critical examination of the Washburn equation. J. Colloid Interface Sci. 2013, 411, 257–264. [Google Scholar] [CrossRef] [PubMed]
  15. Extrand, C.W.; Moon, S.I. Experimental measurement of forces and energies associated with capillary rise in a vertical tube. J. Colloid Interface Sci. 2013, 407, 488–492. [Google Scholar] [CrossRef] [PubMed]
  16. Quéré, D. Inertial capillarity. Europhys. Lett. 1997, 39, 533–538. [Google Scholar] [CrossRef]
  17. Hamraoui, A.; Thuresson, K.; Nylander, T.; Yaminsky, A. Can a dynamic contact angle be understood in terms of a friction coefficient? J. Colloid Interface Sci. 2000, 226, 199–204. [Google Scholar] [CrossRef]
  18. Stange, M.; Dreyer, M.E.; Rath, H.J. Capillary driven flow in circular cylindrical tubes. Phys. Fluids 2018, 30, 082103. [Google Scholar] [CrossRef]
  19. Fries, N.; Dreyer, M. The transition from inertial to viscous flow in capillary rise. J. Colloid Interface Sci. 2008, 327, 125–128. [Google Scholar] [CrossRef] [Green Version]
  20. Zhong, X.; Sun, B.; Liao, S. Analytic solutions of the rise dynamics of liquid in a vertical cylindrical capillary. Eur. J. Mech. B Fluids 2019, 78, 1–10. [Google Scholar] [CrossRef] [Green Version]
  21. Walls, P.L.L.; Dequire, G.; Bird, J.C. Capillary displacement of viscous liquids. Langmuir 2016, 32, 3186–3190. [Google Scholar] [CrossRef]
  22. Kondou, C.; Higashi, Y. Surface tension measurement for a new low-GWP refrigerant HFO-1123 by a differential capillary rise method. Trans. Jpn. Soc. Refriger. Air Condit. Eng. 2018, 35, 403–408. [Google Scholar]
  23. Shardt, O.; Waghmare, P.R.; Derksen, J.J.; Mitra, S.K. Inertial rise in short capillary tubes. RSC Adv. 2014, 4, 14781–14785. [Google Scholar] [CrossRef]
  24. Gittens, G.J. Variation of surface tension of water with temperature. J. Colloid Interface Sci. 1969, 30, 406–412. [Google Scholar] [CrossRef]
  25. Vargaftik, N.B.; Volkov, B.N.; Voljak, L.D. International tables of the surface tension of water. J. Phys. Chem. Ref. Data 1983, 12, 817–820. [Google Scholar] [CrossRef] [Green Version]
  26. Hamraoui, A.; Nylander, T. Analytical approach for the Lucas-Washburn equation. J. Colloid Interface Sci. 2002, 250, 415–421. [Google Scholar] [CrossRef] [PubMed]
  27. Marston, J.; Toyofuku, G.; Li, C.; Truscott, T.; Uddin, J. Drainage, rebound and oscillation of a meniscus in a tube. Phys. Fluids 2018, 30, 082103. [Google Scholar] [CrossRef]
  28. Maggi, F.; Alonso-Marroquin, F. Temperature dependence of capillary dynamics: A multiphase and multicomponent adiabatic approach. Phys. Rev. E 2013, 88, 053013. [Google Scholar] [CrossRef] [PubMed] [Green Version]
  29. Zhmud, B.V.; Tiberg, F.; Hallstensson, K. Dynamics of capillary rise. J. Colloid Interface Sci. 2000, 228, 263–269. [Google Scholar] [CrossRef] [PubMed]
  30. Masoodi, R.; Languri, E.; Ostadhossein, A. Dynamics of liquid rise in a vertical capillary tube. J. Colloid Interface Sci. 2013, 389, 268–272. [Google Scholar] [CrossRef] [PubMed]
  31. Fries, N.; Dreyer, M. An analytic solution of capillary rise restrained by gravity. J. Colloid Interface Sci. 2008, 320, 259–263. [Google Scholar] [CrossRef]
  32. Bosanquet, C.H. LV. On the flow of liquids into capillary tubes. Philos. Mag. Ser. 1923, 45, 525–531. [Google Scholar] [CrossRef]
  33. Washburn, E.W. The dynamics of capillary flow. Phys. Rev. 1921, 17, 273–283. [Google Scholar] [CrossRef]
  34. Siebold, A.; Nardin, M.; Schultz, J.; Walliser, A.; Oppliger, M. Effect of dynamic contact angle on capillary rise phenomena. Colloid Surf. A-Physicochem. Eng. Asp. 2000, 161, 81–87. [Google Scholar] [CrossRef]
  35. Dreyer, M.; Delgado, A.; Rath, H.J. Capillary rise of liquid between parallel plates under microgravity. J. Colloid Interface Sci. 1994, 163, 158–168. [Google Scholar] [CrossRef]
  36. Wijnhorst, R.; de Goede, T.C.; Bonn, D.; Shchidzadeh, N. Surfactant effects on the dynamics of capillary rise and finger formation in square capillaries. Langmuir 2020, 36, 13784–13792. [Google Scholar] [CrossRef] [PubMed]
  37. Hassanizadeh, S.M.; Gray, W.G. Thermodynamic basis of capillary pressure in porous media. Water Resour. Res. 1993, 29, 3389–3405. [Google Scholar] [CrossRef] [Green Version]
  38. Zuo, J.Y.; Guo, X.; Liu, Y.; Pan, S.; Canas, J.; Mullins, O.C. Impact of capillary pressure and nanopore confinement on phase behaviors of shale gas and oil. Energy Fuels 2018, 32, 4705–4714. [Google Scholar] [CrossRef]
  39. Delannoy, J.; Lafon, S.; Koga, Y.; Reyssat, É.; Quéré, D. The dual role of viscosity in capillary rise. Soft Matter 2019, 15, 2757–2761. [Google Scholar] [CrossRef] [PubMed]
  40. Sun, B. Monotonic rising and oscillating of capillary-driven flow in circular cylindrical tubes. API Adv. 2021, 11, 025227. [Google Scholar] [CrossRef]
  41. Arashiro, E.Y.; Demarquette, N.R. Use of the pendant drop method to measure interfacial tension between molten polymers. Mater. Res. 1999, 2, 23–32. [Google Scholar] [CrossRef]
  42. Stauffer, C.E. The measurement of surface tension by the pendant drop technique. J. Phys. Chem. 1965, 69, 1933–1938. [Google Scholar] [CrossRef]
  43. Cheng, K.K.; Park, C. Surface tension of dilute alcohol-aqueous binary fluids: N-Butanol/water, n-Pentanol/water, and n-Hexanol/water solutions. Heat Mass Transf. 2017, 53, 2255–2263. [Google Scholar] [CrossRef]
  44. Habrdová, K.; Hovorka, Š.; Bartovská, L. Concentration dependence of surface tension for very dilute aqueous solutions of organic nonelectrolytes. J. Chem. Eng. Data 2004, 49, 1003–1007. [Google Scholar] [CrossRef]
  45. Xue, H.T.; Fang, Z.N.; Tang, Y.; Huang, J.P.; Zhou, L.W. Contact angle determined by spontaneous dynamic capillary rise with hydrostatic effects: Experiment and theory. Chem. Phys. Lett. 2006, 432, 326–330. [Google Scholar] [CrossRef]
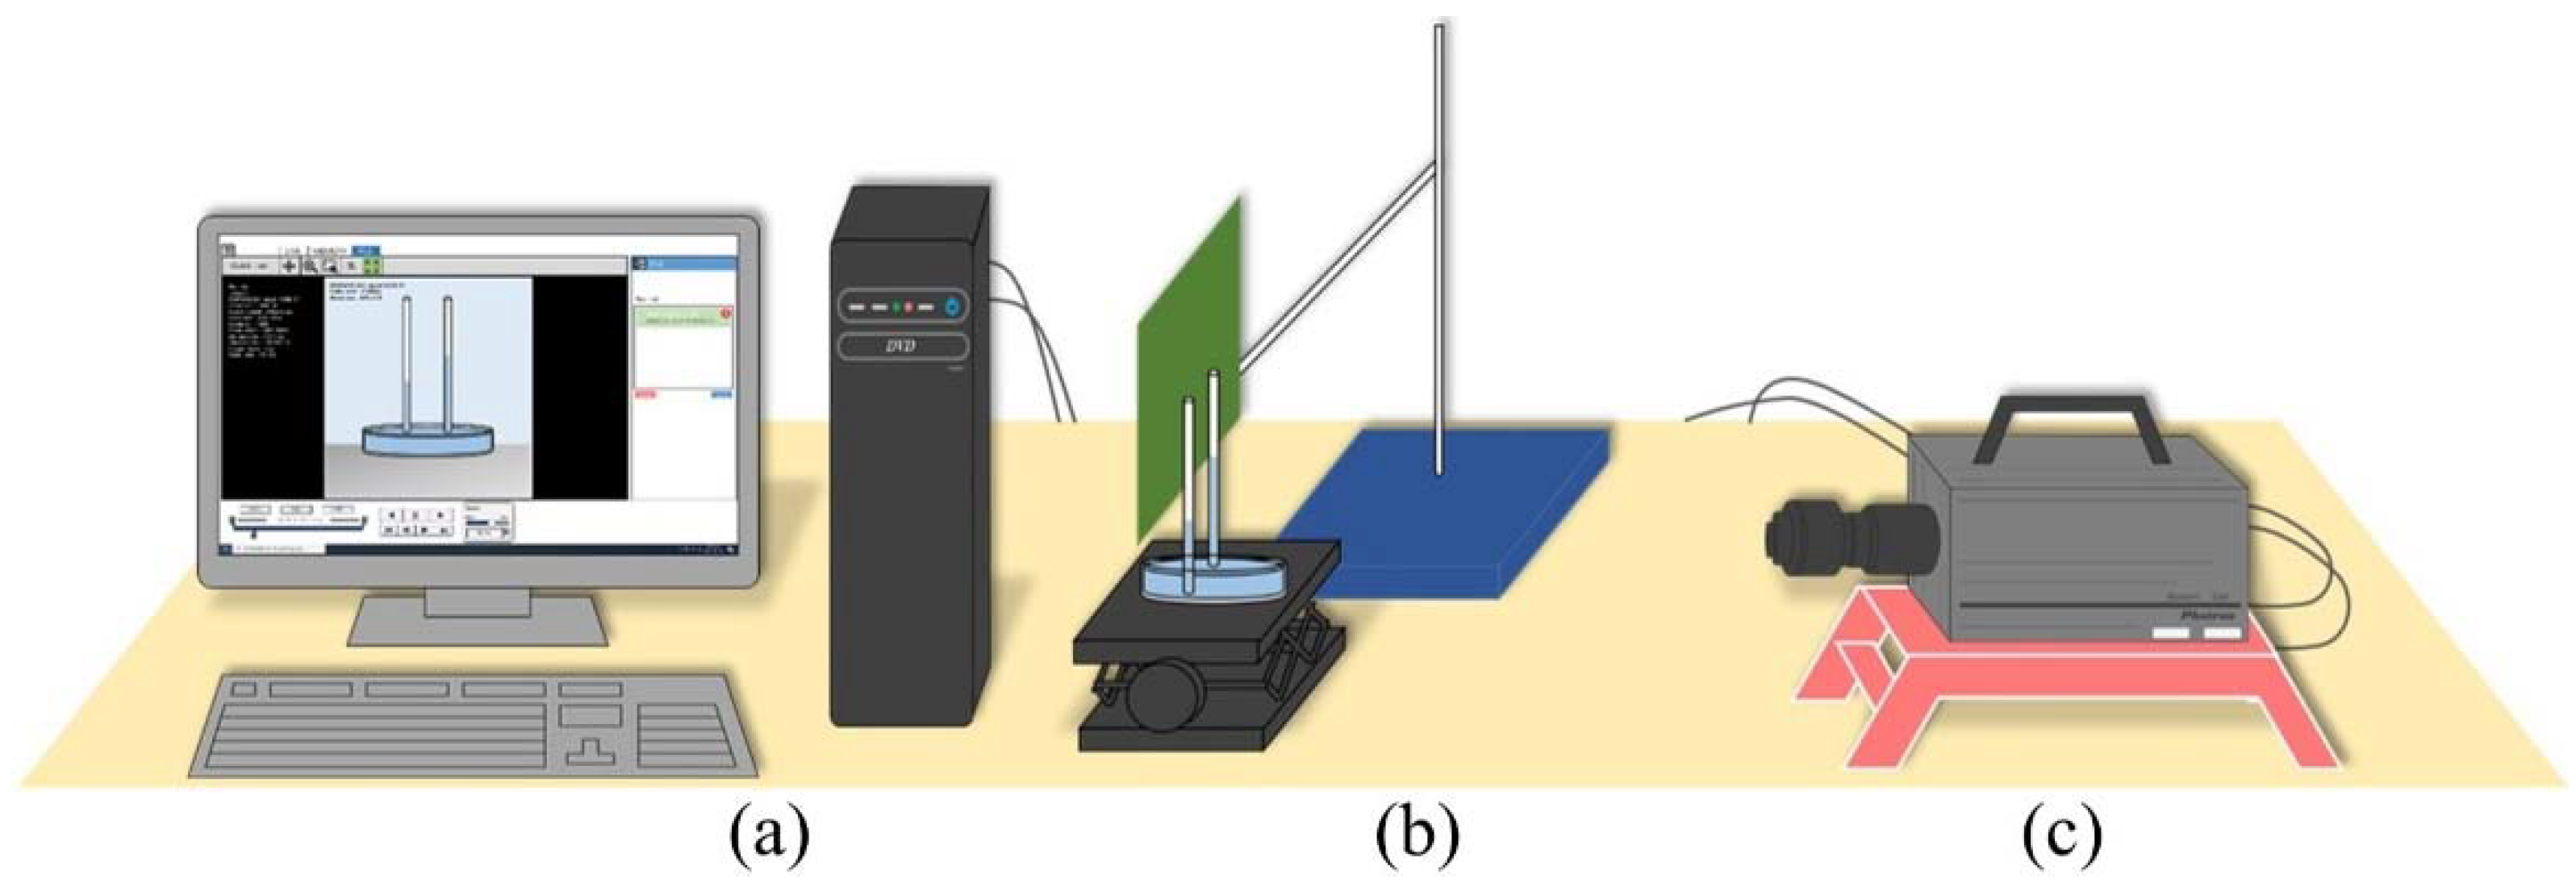
Figure 1. Schematic of the experimental setup. (a) PC and monitor, (b) capillary tube and liquid, and (c) high-speed camera and lens.
Applsci 11 03533 g001
Figure 2. Principle of the measurement method and instantaneous image of the capillary rise height.
Applsci 11 03533 g002
Figure 3. Surface tension of DW (distilled water) with different tube radius combinations in the differential capillary-rise-height method.
Applsci 11 03533 g003
Figure 4. Time series of direct photographs for DW showing the height with different tube radii. (a) 0.4 mm, (b) 0.6 mm, and (c) 0.85 mm.
Applsci 11 03533 g004
Figure 5. Variation of height (h) versus time (t) for the DW rise in capillary tube at test case of 2r = 0.8. (a) h (log 10 mm) versus t (log 10 s) and (b) h (mm) versus t (log 10 s).
Applsci 11 03533 g005
Figure 6. Comparison of analytic solutions with experimental results of this study (water in a capillary tube with r = 0.4 mm). The variable value of cosθ, as extracted from Equation (6), was used.
Applsci 11 03533 g006
Figure 7. Effect of tube diameter (2r = 0.8, 1.2, and 1.7 mm) on capillary rise dynamics of DW. (a) height and (b) velocity.
Applsci 11 03533 g007
Figure 8. Effect of surface tension of liquids (σ = 56, 60, 64, and 72 mN/m) on capillary rise dynamics at r = 0.4 mm. (a) height and (b) velocity.
Applsci 11 03533 g008
Figure 9. (a) Characteristic heights (h1, h2, and he) as a function of the capillary tube radius (r). (b) Characteristic heights as a function of the surface tension of liquids (σ). (c) Characteristic heights as a function of the quantity in terms of r and σ (σL/2πr2). Solid lines represent linear fits between characteristic heights and each comparative parameter.
Applsci 11 03533 g009
Table 1. Lengths of characteristic stages including percentages of corresponding stages and their end positions for DW with different capillary tube radii.
r (mm)Stage I (mm)Stage II (mm)Stage III (mm)h1 (mm)h2 (mm)he (mm)
0.411.2 (31.2%)16.4 (45.7%)8.3 (23.1%)11.227.635.9
0.68.7 (36.1%)10.1 (41.9%)5.3 (22%)8.718.824.1
0.87.2 (44.7%)7.4 (46%)1.5 (9.3%)7.214.616.1
Table 2. Lengths of characteristic stages for butanol/water mixtures at the test case of r = 0.4 mm.
Mixture (Butanol wt.%)Stage I (mm)Stage I (mm)Stage I (mm)h1 (mm)h2 (mm)he (mm)σ (mN/m)
B0% (DW)11.2 (31.2%)16.4 (45.7%)8.3 (23.1%)11.227.635.972
B0.3%9.3 (29%)14.3 (44.5%)8.5 (26.5%)9.323.632.164
B0.5%8.9 (31%)12.5 (43.6%)7.3 (25.4%)8.921.428.760
B0.7%8.6 (32.3%)11.2 (42.1%)6.8 (25.6%)8.619.826.656
Publisher’s Note: MDPI stays neutral with regard to jurisdictional claims in published maps and institutional affiliations.