Article

Deep Learning Based Airway Segmentation Using Key Point Prediction

1
Department of Oral and Maxillofacial Surgery, School of Dentistry, Pusan National University, Yangsan 50612, Korea
2
Department of Oral and Maxillofacial Radiology, School of Dentistry, Pusan National University, Yangsan 50612, Korea
3
Dental and Life Science Institute & Dental Research Institute, School of Dentistry, Pusan National University, Yangsan 50612, Korea
*
Author to whom correspondence should be addressed.
Jinyoung Park and JaeJoon Hwang have equally contributed to this work and should be considered co-first authors.
Appl. Sci. 2021, 11(8), 3501; https://doi.org/10.3390/app11083501
Submission received: 22 March 2021 / Revised: 11 April 2021 / Accepted: 12 April 2021 / Published: 14 April 2021
(This article belongs to the Special Issue Machine Learning/Deep Learning in Medical Image Processing)

Abstract

:
The purpose of this study was to investigate the accuracy of the airway volume measurement by a Regression Neural Network-based deep-learning model. A set of manually outlined airway data was set to build the algorithm for fully automatic segmentation of a deep learning process. Manual landmarks of the airway were determined by one examiner using a mid-sagittal plane of cone-beam computed tomography (CBCT) images of 315 patients. Clinical dataset-based training with data augmentation was conducted. Based on the annotated landmarks, the airway passage was measured and segmented. The accuracy of our model was confirmed by measuring the following between the examiner and the program: (1) a difference in volume of nasopharynx, oropharynx, and hypopharynx, and (2) the Euclidean distance. For the agreement analysis, 61 samples were extracted and compared. The correlation test showed a range of good to excellent reliability. A difference between volumes were analyzed using regression analysis. The slope of the two measurements was close to 1 and showed a linear regression correlation (r2 = 0.975, slope = 1.02, p < 0.001). These results indicate that fully automatic segmentation of the airway is possible by training via deep learning of artificial intelligence. Additionally, a high correlation between manual data and deep learning data was estimated.

1. Introduction

Recently, artificial intelligence has been used in the medical field to predict risk factors through correlation analysis and genomic analyses, phenotype-genotype association studies, and automated medical image analysis [1]. Recent advances in machine learning are contributing to research on identifying, classifying, and quantifying medical image patterns in deep learning. Since the convolutional neural network (CNN) based on artificial neural networks has begun to be used in medical image analysis, research on various diseases is rapidly increasing [2,3]. The use of deep learning in the medical field helps diagnose and treat diseases by extracting and analyzing medical images, and its effectiveness has been proven [4].
However, studies related to deep learning in the areas of oral and maxillofacial surgery are limited [5]. For oral and maxillofacial surgery, radiology is used as an important evaluation criterion in the diagnosis of diseases, treatment plans, and follow-up after treatment. However, the evaluation process is performed manually and the assessment can be different among examiners, or even with the same examiner. This may result in an inefficient and time-consuming procedure [6]. In particular, the evaluation of the airway is difficult to analyze due to its anatomical complexity and the limited difference in gray scale between soft tissue and air [7,8,9]. Airway analysis is essential for diagnosis and assessment of the treatment progress of obstructive sleep apnea patients and for predicting the tendency of airway changes after orthognathic surgery [10,11,12,13,14,15,16,17,18,19,20,21].
In most previous studies, the airway was segmented semi-automatically using software systems for volumetric measurements using cone-beam computed tomography (CBCT) images [21,22,23]. These studies evaluated the reliability and reproducibility of the software systems on the measurement of the airway [7,24,25,26,27] and compared the accuracy between the various software systems [9,24,25,27]. However, in all cases, the software systems require manual processing by experts.
In this study, a regression neural network-based deep-learning model is proposed, which will enable fully automatic segmentation of airways using CBCT. The differences between the manually measured data and data measured by deep learning will be analyzed. Using a manually positioned data set, training and deep learning will be performed to determine the possibility of a fully automatic segmentation of the airway and to introduce a method and its proposed future use.

2. Materials and Methods

2.1. Sample Collection and Information

Images from 315 patients who underwent CBCT for orthognathic surgery were collected retrospectively from 2017 to 2019. The CBCT data were acquired using PaX-i3D (Vatech Co., Hwaseong-si, Korea) at 105–114 KVP, 5.6–6.5 mA with 160 mm × 160 mm field of view, and 0.3 mm in voxel size. The scanning conditions were automatically determined by the machine according to the patients’ age and gender. The CBCT images were converted to DICOM 3.0 and stored on a Windows-10-based graphic workstation (Intel Core i7-4770, 32 GB). The patients were all placed in a natural head position. All image processing was performed using MATLAB 2020a (MathWorks, Natick, MA, USA) programming language.

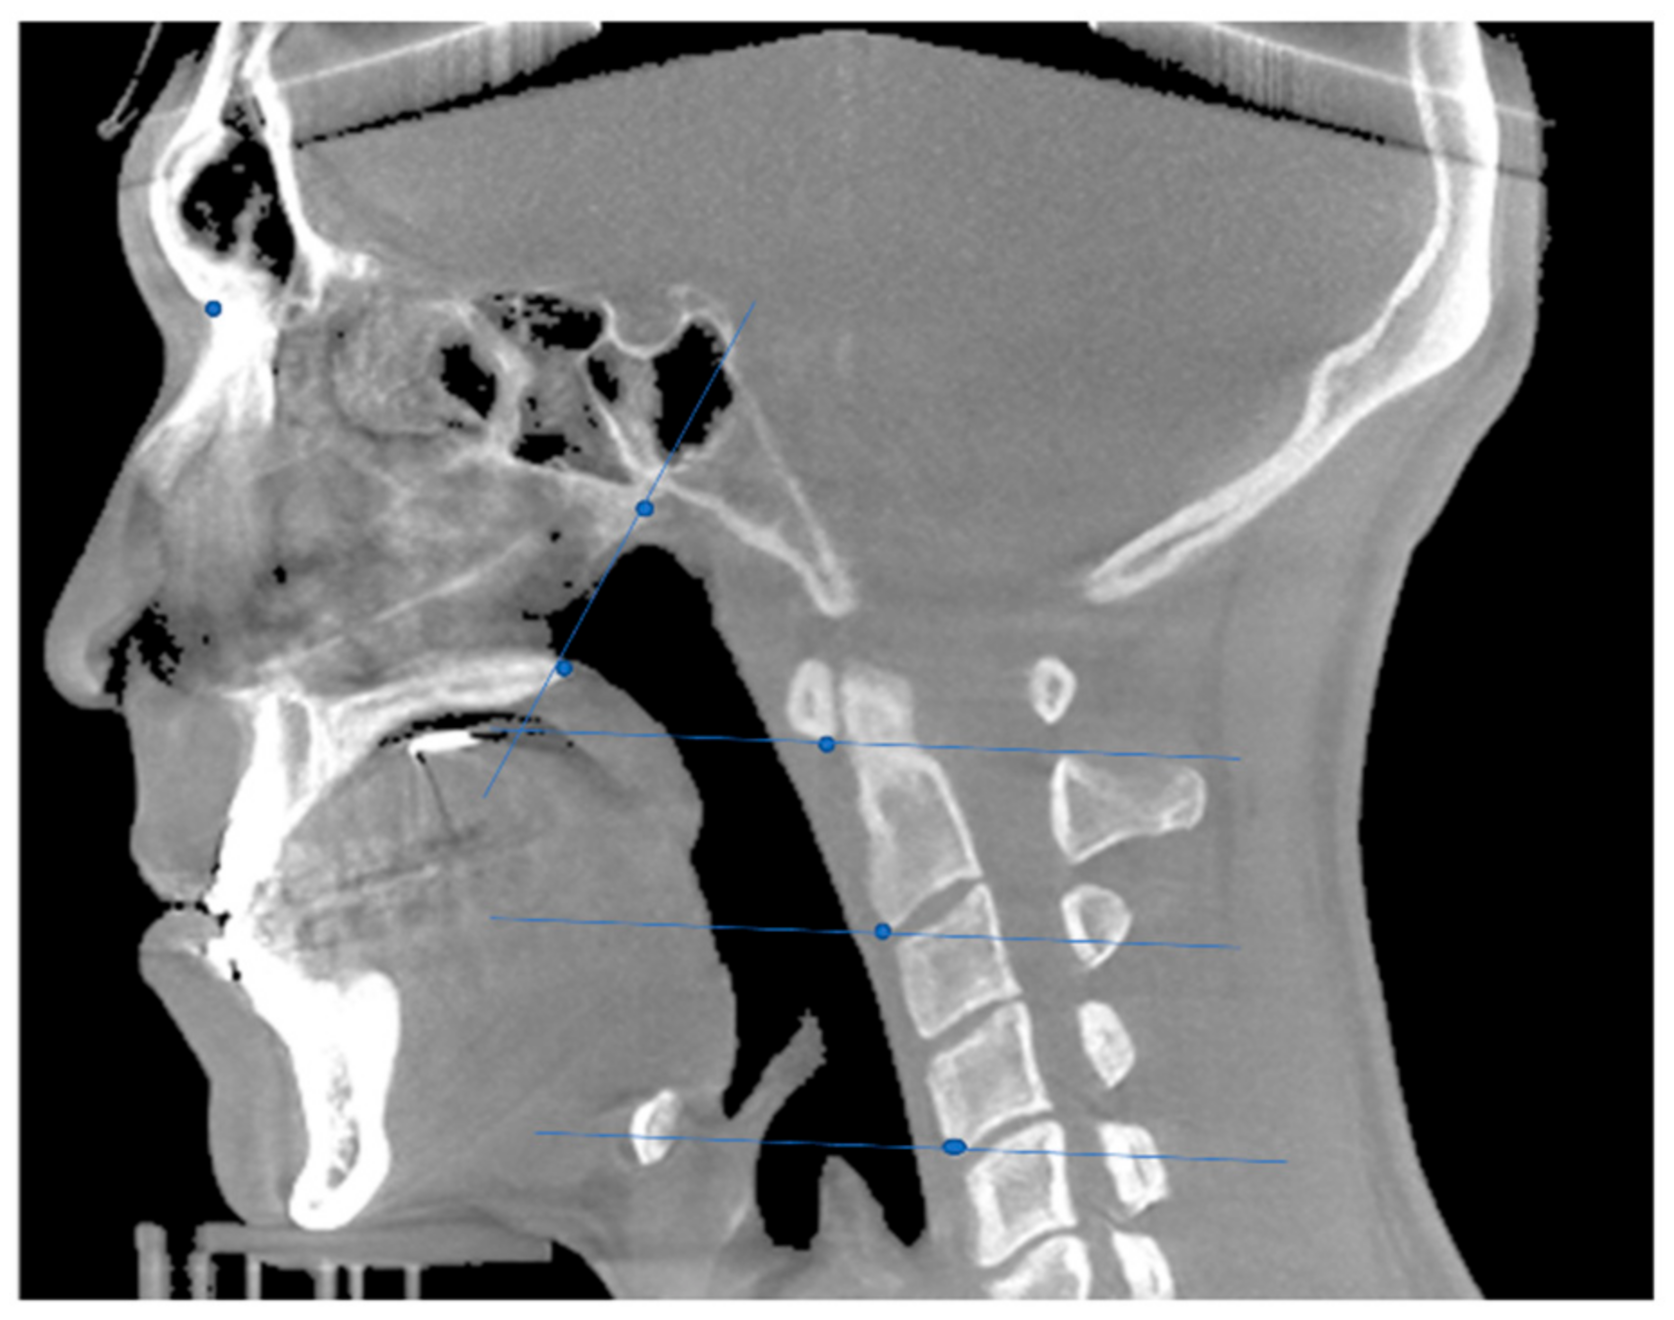
2.2. Coordinate Determination in the Mid-Sagittal Plane

Five coordinates for each original image were obtained manually in the midsagittal plane of the CBCT images (Figure 1). The definitions of the points and planes for the airway division are presented in Table 1, referring to Lee et al. [28]. These five coordinates were predicted by a 2D convolutional neural network for airway segmentation in the sagittal direction.

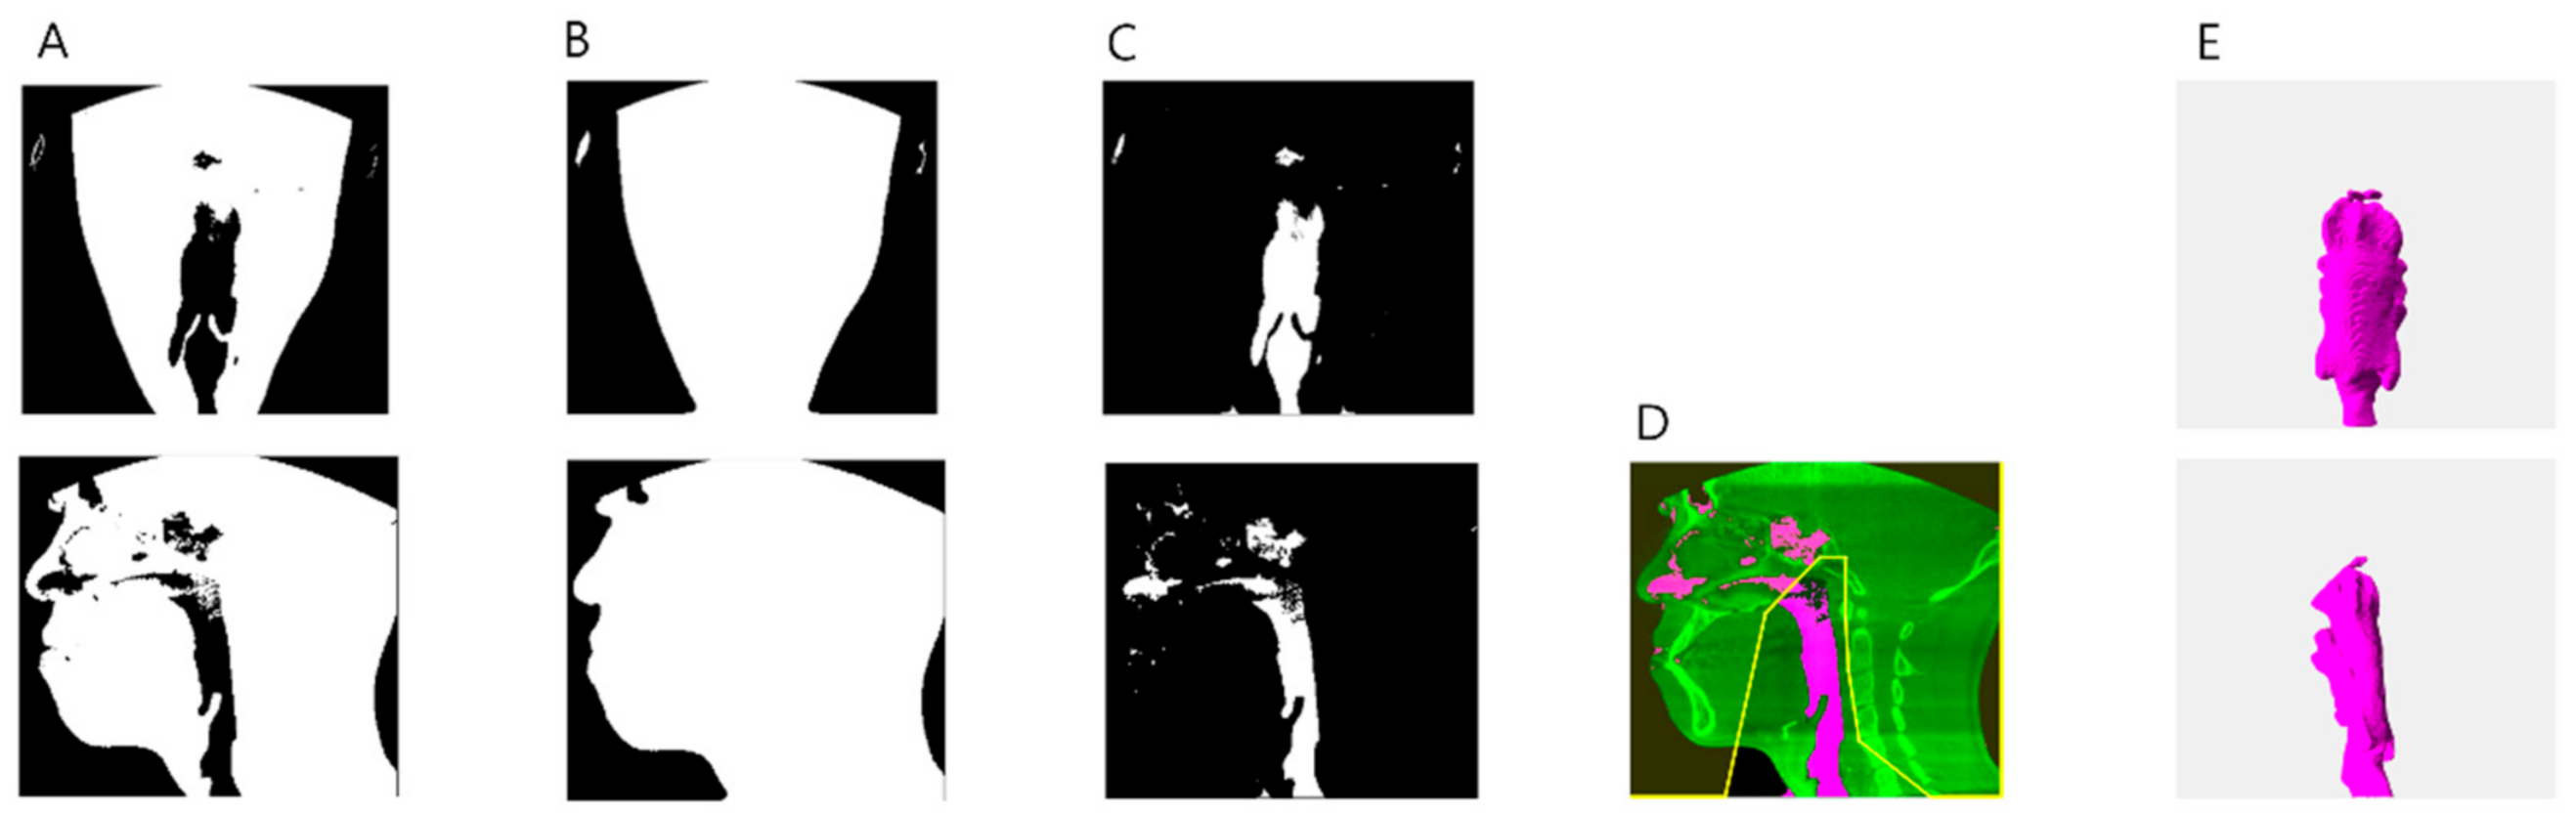
2.3. Airway Segmentation

First, the image was binarized, then it was filled through a 3D close operation, and hole filling, and then, the binarized image was subtracted from the filled image to obtain an airway image. After erasing the image outside, the area that references five points, and the 1/4 and 3/4 of the inferior border are connected. Only the largest object is left to obtain the airway image (Figure 2).

2.4. Training via Regression Neural Network and Metrics for Accuracy Comparison

The 315 midsagittal images obtained from the patient’s cone-beam computed tomography (CBCT) data were split into training and test sets at a ratio of 4:1. During clinical data set-based training, validation was not performed because the sample size was too small for validation. Instead, a five-fold cross-validation was applied. First, the image size was set to 200 × 200 pixels, and 16 convolution layers were packed for feature extraction. To generate the regression model, the regression layer was connected to a fully connected layer. Mean-squared-error was used as a loss function. Data augmentation was then conducted, including rotation from −6° to +6°, uniform (isotropic) scaling from 0.5° to 1°, Poisson noise addition, and contrast and brightness adjustment. An NVIDIA Titan RTX GPU with CUDA (version 10.1) acceleration was used for network training. The models were trained for 243 epochs using an Adam optimizer with an initial learning rate of 1e-4 and a mini-batch size of 8.
The prediction accuracy of the model was calculated using (a) the volume difference between the predicted and manually determined nasopharynx, oropharynx, and hypopharynx, and (b) the Euclidean distance between where the predicted and manually determined points are real data.

3. Results

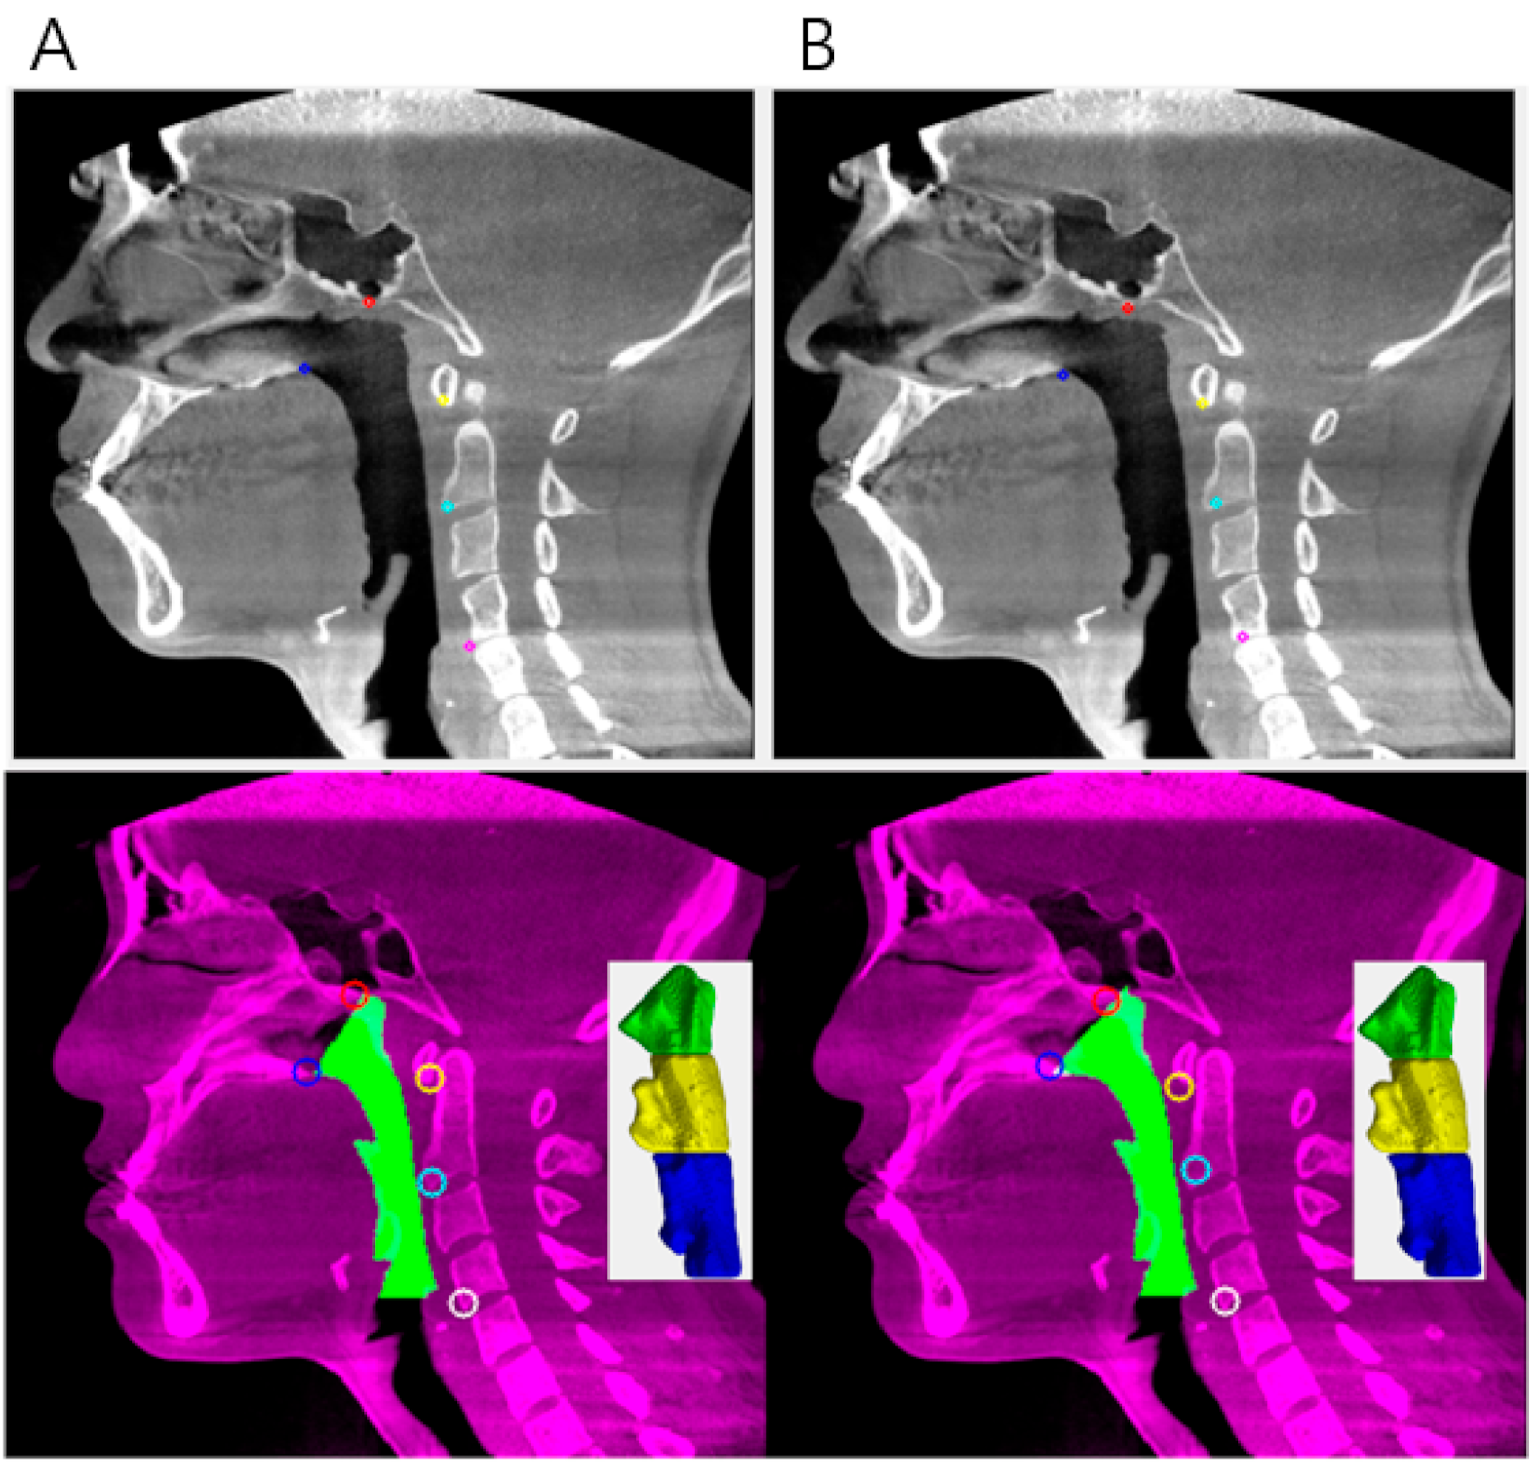
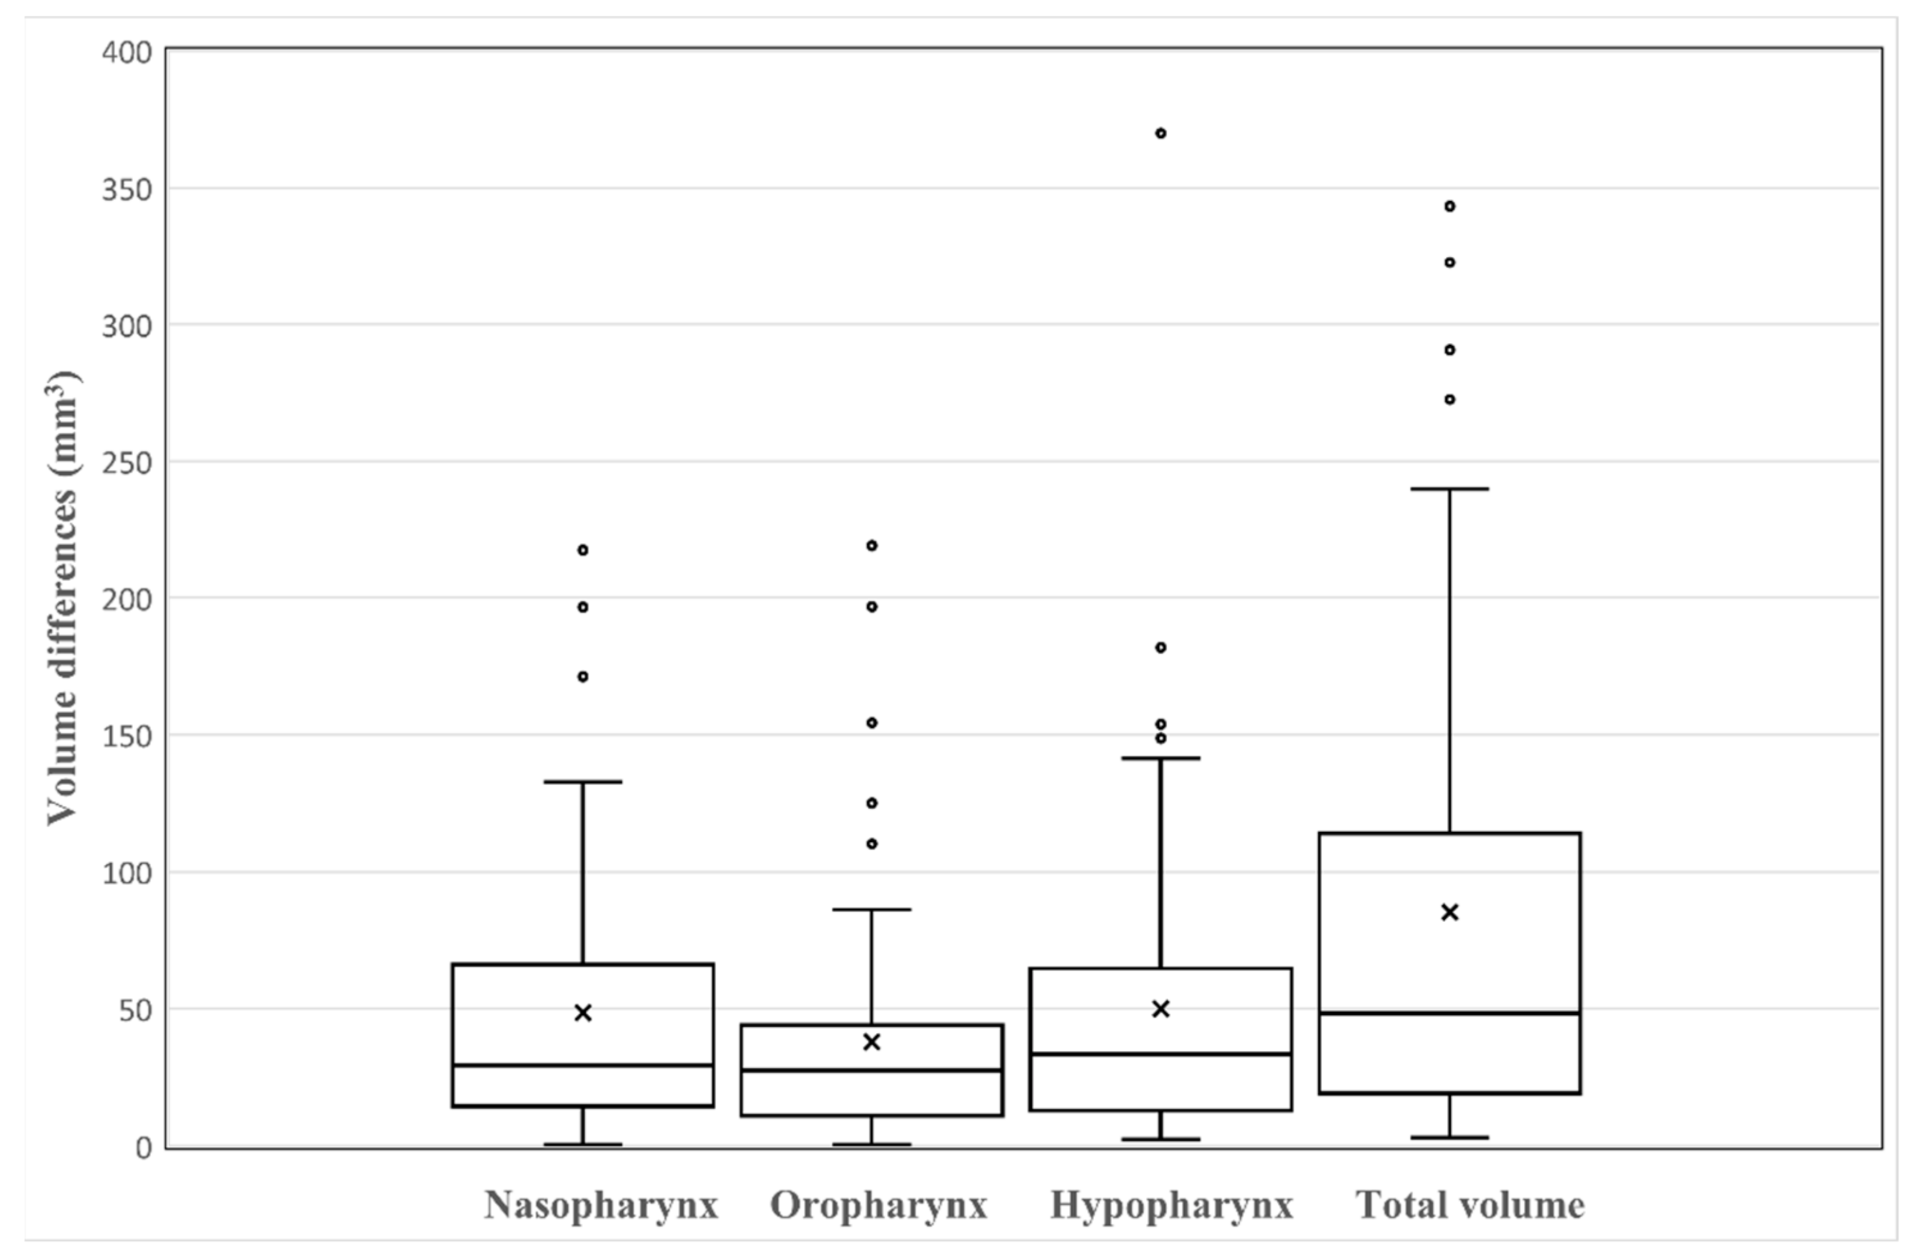
3.1. Measurements of the Differences between Manual Analysis and Deep Learning Analysis

The five coordinates manually pointed and predicted by the deep learning model are shown in Figure 3. The Euclidean distance between the predicted and manually determined points was largest at CV4 (4.156 ± 2.379 mm) and smallest at CV1 (2.571 ± 2.028 mm). Other Euclidean distances were estimated as 2.817 ± 1.806 mm at PNS, 2.837 ± 1.924 mm at Vp, and 2.896 ± 2.205 mm at CV2. When the volume was compared for each part, the hypopharynx showed the largest difference difference (50 ± 57.891 mm3), and the oropharynx was assessed as having the smallest difference (37.987 ± 43.289 mm3). The difference in the nasopharyngeal area was 48.620 ± 49.468 mm3. The difference in total volume was measured as 137.256 ± 146.517 mm3. All measurements of the differences are shown in Table 2. Volume differences among parts of the airway are shown in Figure 4.

3.2. Agreement Analysis

Using agreement analysis, 61 samples were extracted and the manually measured value and deep learning network predicted value were compared for both volumes and coordinates. The total volume was the most correlated intra-class correlation coefficient (ICC) value in the oropharynx (0.986), followed by the hypopharynx (0.964), and the nasopharynx (0.912). The intra-class correlation coefficient (ICC) value for the coordinate CV2(x) was the most correlated (0.963) and the least correlated at CV4(y) (0.868). All ICC values are presented in Table 3.

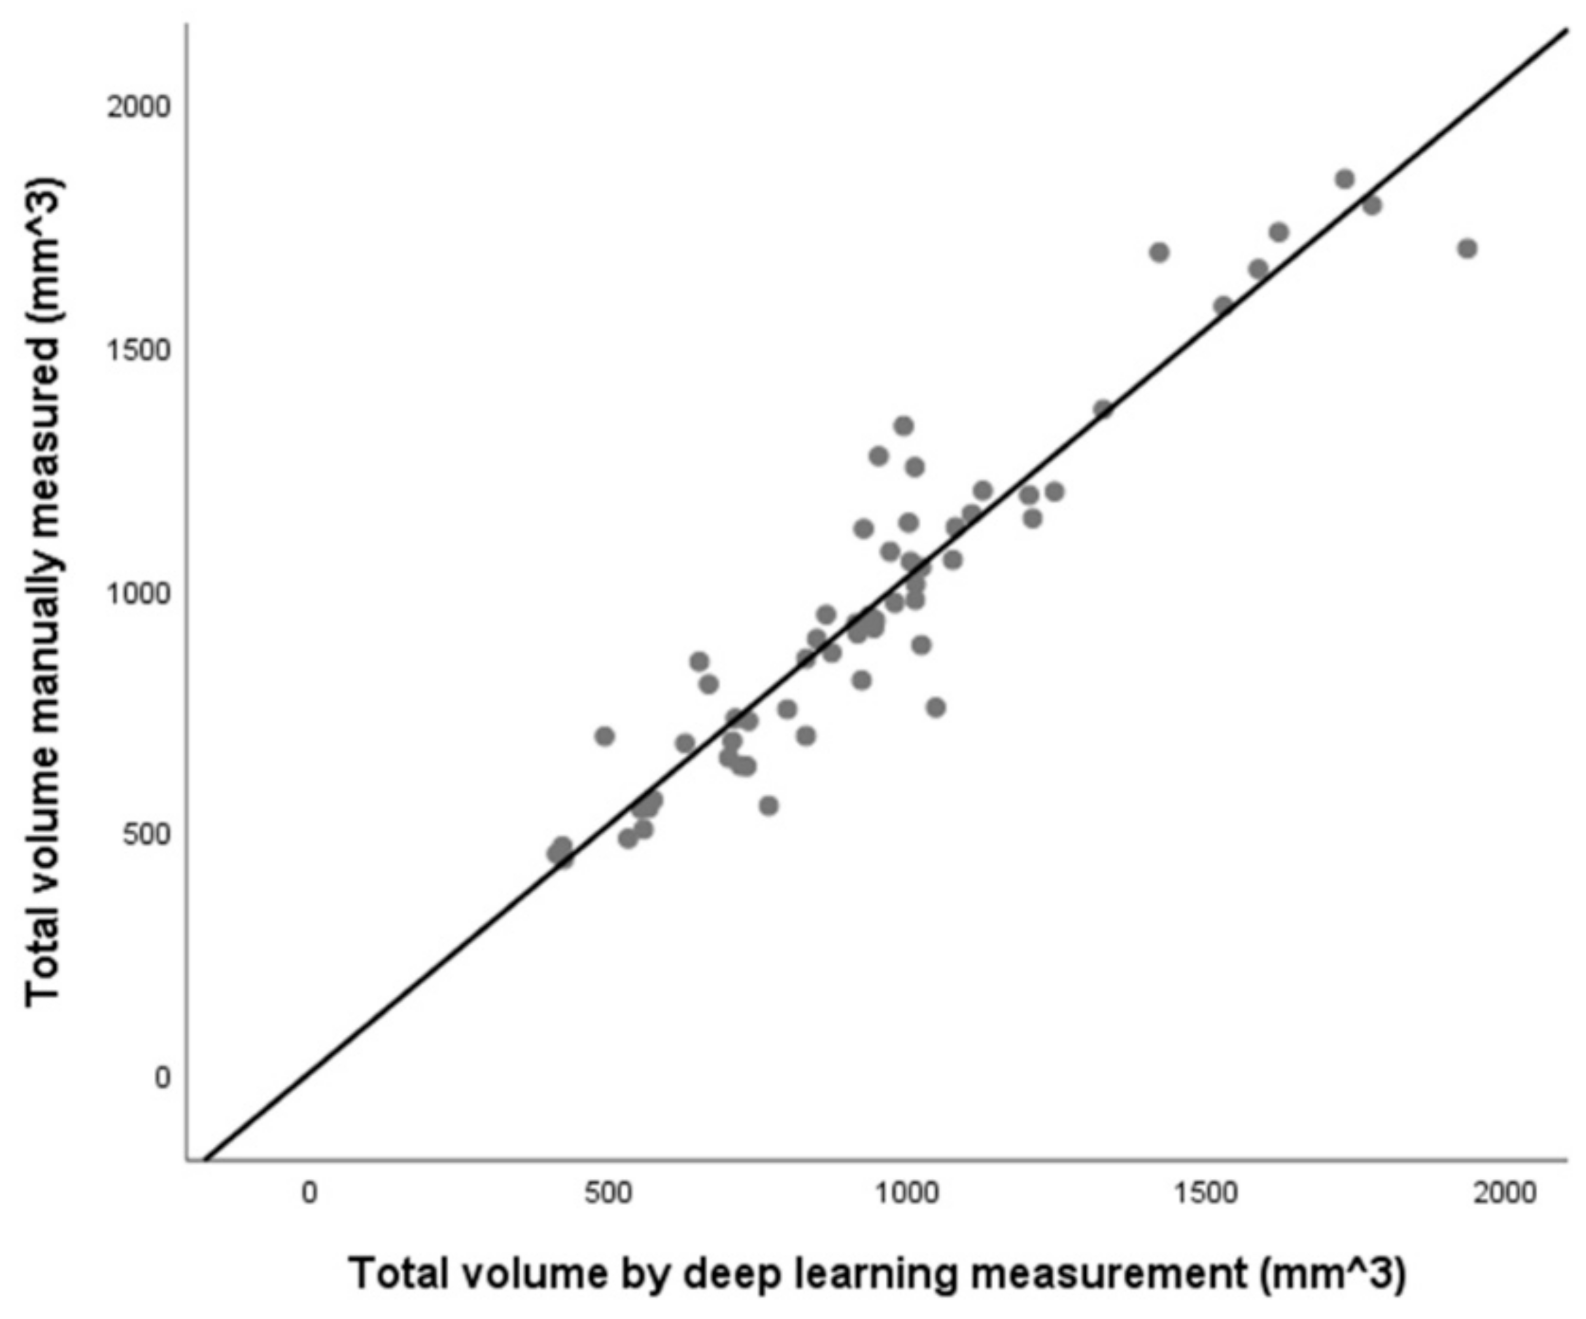
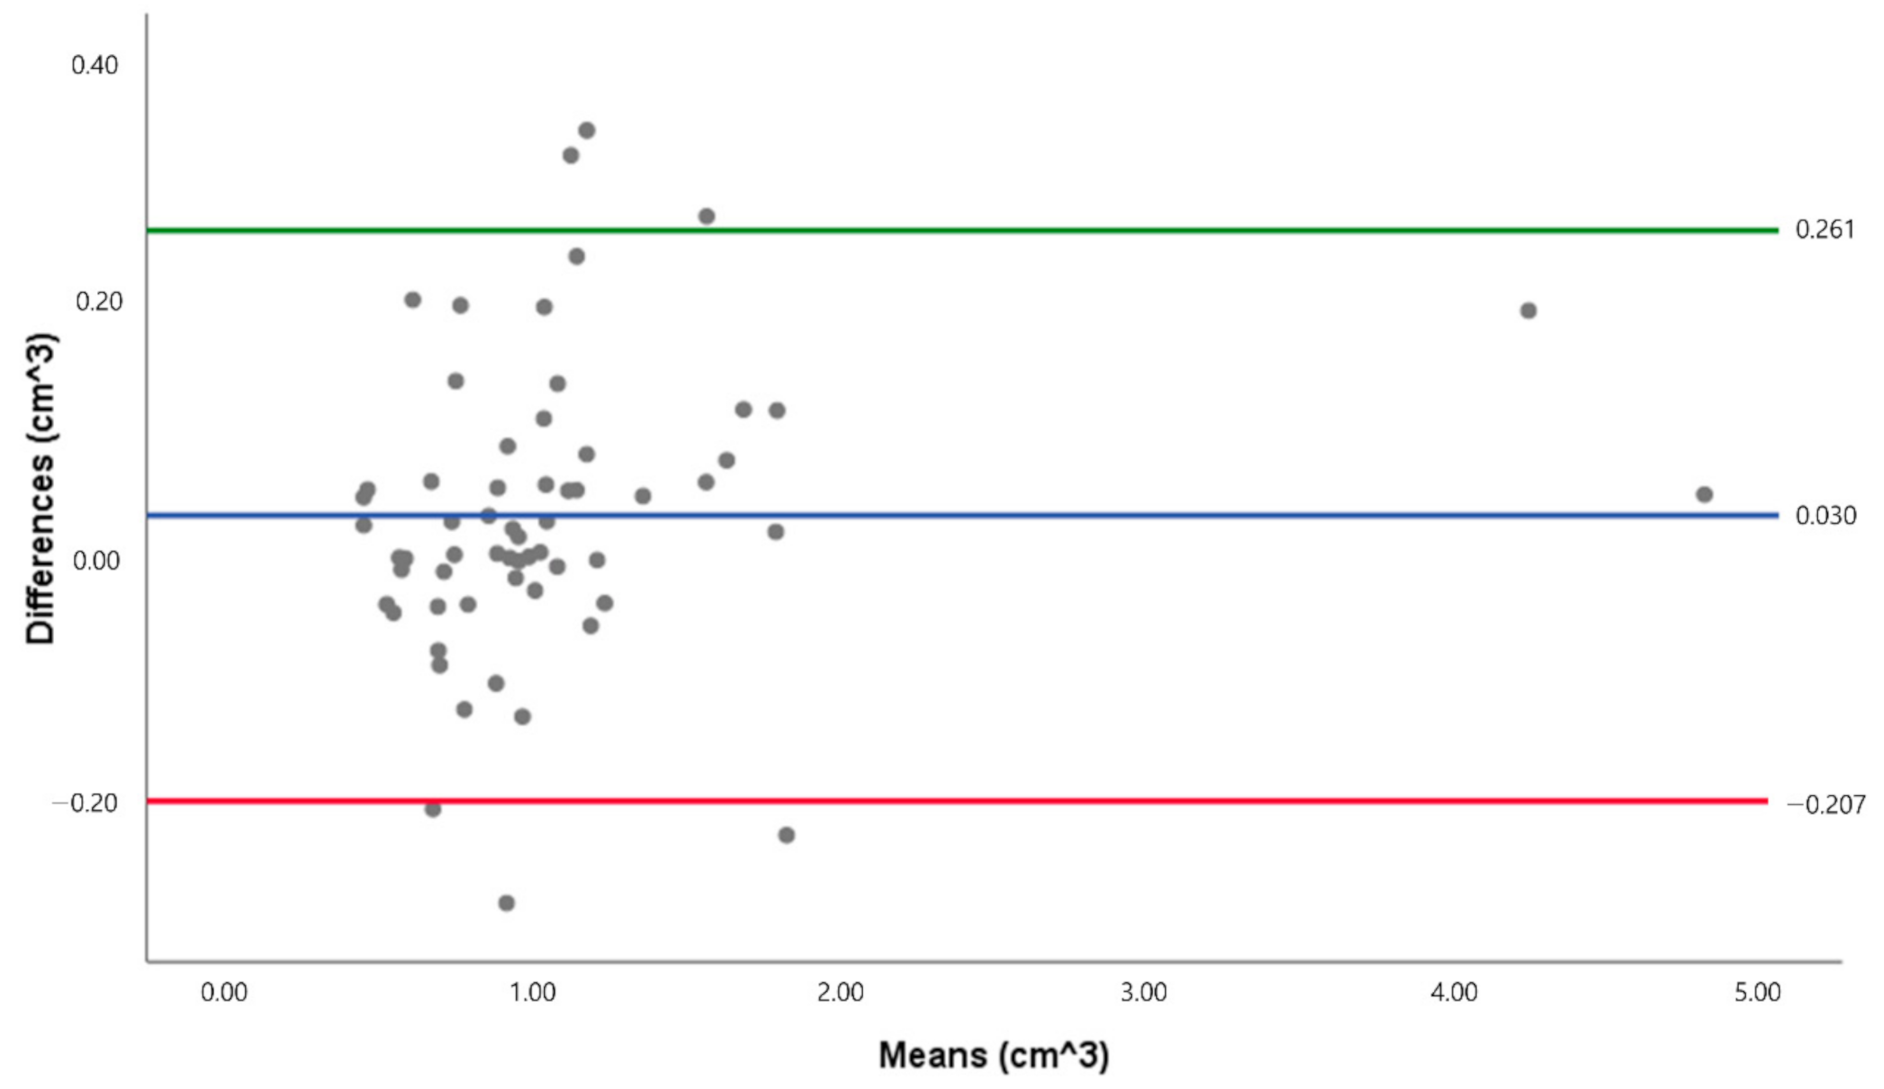
3.3. Linear Regression Scatter Plots and Bland-Altman Plot for the Total Volume Data Set

The total volume measured by deep learning was compared with the volume manually measured using regression analysis (Figure 5). The slopes of the two measurements were close to 1 and showed a linear regression correlation as r2 = 0.975, slope = 1.02, and p < 0.001. Bland-Altman plots and analyses were used to compare the total volume of the two methods, and the results are presented in Figure 6. The Bland-Altman plot comparing the level of agreement between manual and deep learning indicates an upper limit of agreement (0.261 cm3) and a lower limit of agreement (−0.207 cm3). The range of the 95% confidence interval was 0.468 cm3.

4. Discussion

In the medical field, many studies have used artificial intelligence via deep learning in radiology [29,30]. There are studies on fully automated airway segmentation of lungs with volumetric computed tomographic images using a convolutional neural network (CNN) [31] and on automatic segmentation and 3D reconstruction of inferior turbinate and maxillary sinus from otorhinolaryngology [32]. Due to the complex anatomical structure of the airway, there are difficulties in researching the airway using manual measurements, which is a time-consuming process, and entails inter-examiner error, intra-examiner error, and a lack of certainty because of the small differences on a gray scale [23]. For these reasons, automated measurement and analysis are necessary, but the fully auto-segmentation of the airway is challenging and a study of airway segmentation using deep learning in the area of oral and maxillofacial surgery has not previously been reported.
Therefore, in this study, we performed a fully automated segmentation of the airway using artificial intelligence for enabling faster and more practical measurement and analysis in clinical practice. The correlation between the coordinates and volumes measured manually and by the deep learning network were evaluated and compared. The distance between the coordinates of each of the five airway reference points was measured between 2.5 mm and 4.1 mm, and the difference between the measured volumes was 48.620 mm3 in the nasopharynx, 37.987 mm3 in the oropharynx, and 50.010 mm3 in the hypopharynx. The difference in total volume was observed to be 85.256 mm3. Therefore, it is considered that the correlation between each coordinate and volume showed good to excellent reliability.
In this study, the threshold is defined by the Otsu method [33], the binarized image is extracted, and deep learning performs fully automatic division of the airway and divides it into the nasopharynx, oropharynx, and hypopharynx parts through the reference plane.
The difference between the total volumes in this study was evaluated as an acceptable value at 0.46 cm3 when compared to the Torres et al. [25] study, which gave the difference between the water volume of an actual prototype and the volume on the CT software as 0.2 cm3 to 1.0 cm3. The difference in the volume of the oropharynx was measured as the smallest, which showed the same results as El et al. [34]. According to Alsufyani et al. [23], since the oropharynx airway is a completely empty space like a tube, it is straightforward to measure the volume. The more complex and narrow shape of the airway’s soft tissue is due to anatomical complexity, such as epiglottis. This has the highest error in volumetric measurements [35]. Therefore, it can be considered that a simpler anatomical structure will result in a smaller difference between the measurement methods.
When comparing the distance of each point, the result of this study is not clinically applicable. A clinically acceptable difference between the landmarks is approximately 2 mm, according to Lee et al. [36]. There are several reasons for a possible error, which include the limitation in the number of training data sets and the necessity for more precise data preparation, such as setting more reference points on each slice segmentation. In setting the reference points for precise training, the reference points were selected on the bony parts to reduce the error due to the variety of soft tissue shapes. This allows clear determination of the anatomical point aided by the large difference on a gray scale, and a simpler comparison of the relationship before and after surgery. Hence, this study applied the reference points of the Lee et al. study [28]. Nevertheless, in the present study, the distance of CV4 had a larger error, which may be due to the shape of the spine CV4 appearing in various ways in the sagittal plane compared to CV1 or CV2. It is necessary to set an additional reference point to define the hypopharynx that appears to be constant in the midsagittal plane.
The limitation of most airway segmentation research is possibly due to an inconsistent patient head position [23,27,37]. Since patients underwent CBCT in the natural head position in this study, errors may occur. It has been reported that the shape of the airway can vary greatly depending on the angle of the head [38]. However, as concluded in most research, it is not a significant error when comparing the volume of the airway rather than evaluating the volume itself [25]. When performing CBCT, the patient’s head position is consistently adjusted to a natural head position by the examiner through the head strap, chin support, and guide light. In addition, the natural head position has been proven to be reproducible [39], and, hence, there should be no major error when comparing. Due to breathing and tongue position, errors may occur in volumetric measurements [35,37]. Therefore, for each variable, controlled and consistent scanning is required. This study divided the airway volume using 5 points in the 2D mid-sagittal image. The accuracy of these points affects the accuracy of airway segmentation. Therefore, bigger data is needed for clinical application of our algorithm to raise accuracy of coordinate determination.
In the agreement analysis, according to Koo et al. [40], “Based on the 95% confident interval of the ICC estimate, values less than 0.5, between 0.5 and 0.75, between 0.75 and 0.90, and greater than 0.90 are indicative of poor, moderate, good, and excellent reliability, respectively.” In the present study, oropharynx, hypopharynx, total volume, PNS(y), CV1(y), CV2(x), and CV4(x) indicated excellent reliability, and all other variables indicated good reliability based on the Koo et al. report [40].
These results indicate that fully automatic segmentation of the airway is possible through training via deep learning of artificial intelligence. In addition, high correlation between manual data and deep learning data was estimated. To improve the accuracy, validity, and reliability of auto-segmentation, further data collection and optimum training with big data will be required for future clinical application. Furthermore, to raise the robustness of our algorithm, bigger data is needed for accurate coordinate determination. Transfer learning with other datasets, such as facial coordinates, can also be useful. We plan to develop more robust algorithms with bigger data.

5. Conclusions

In this study, using a manually positioned data set, fully automatic segmentation of the airway was possible with artificial intelligence by training a deep learning algorithm and a high correlation between manual data and deep learning data was estimated.
As the first study to utilize artificial intelligence to reach full auto-segmentation of the airway, this paper is meaningful in showing the possibility of a more accurate and quicker way of producing airway segmentation. For a future clinical application, the more robust algorithms with bigger and multiplex datasets are required.

Author Contributions

J.P. and J.H. carried out the analysis of data and prepared the manuscript. J.R. and I.N. helped in the collection and analysis of the data. S.-AK. helped the visualization and analysis of the data in a revised manuscript. B.-H.C. and S.-H.S. conceived of the study, participated in its design and coordination, and helped to draft the manuscript. J.-Y.L. designed the study and drafted the manuscript. All authors have read and agreed to the published version of the manuscript.

Funding

This research was supported by a grant of the Korea Health Technology R&D Project through the Korea Health Industry Development Institute (KHIDI), funded by the Ministry of Health & Welfare, Republic of Korea (grant number: HI19C0824).

Institutional Review Board Statement

The study was conducted according to the guidelines of the Declaration of Helsinki, and approved by the Institutional Review Board of Pusan National Dental Hospital (PNUDH-2021-008).

Informed Consent Statement

Patient consent was waived because of the retrospective nature of the study and the analysis used anonymous clinical data.

Data Availability Statement

The data presented in this study are openly available in Github at: https://github.com/JaeJoonHwang/airway_segmentation_using_key_point_prediction, accessed on 13 April 2021.

Conflicts of Interest

The authors declare no conflict of interest.

References

  1. Yu, K.H.; Beam, A.L.; Kohane, I.S. Artificial intelligence in healthcare. Nat. Biomed. Eng. 2018, 2, 719–731. [Google Scholar] [CrossRef] [PubMed]
  2. LeCun, Y.; Bengio, Y.; Hinton, G. Deep learning. Nature 2015, 521, 436–444. [Google Scholar] [CrossRef] [PubMed]
  3. Anwar, S.M.; Majid, M.; Qayyum, A.; Awais, M.; Alnowami, M.; Khan, M.K. Medical Image Analysis using Convolutional Neural Networks: A Review. J. Med. Syst. 2018, 42, 226. [Google Scholar] [CrossRef] [PubMed] [Green Version]
  4. El Naqa, I.; Haider, M.A.; Giger, M.L.; Ten Haken, R.K. Artificial Intelligence: Reshaping the practice of radiological sciences in the 21st century. Br. J. Radiol. 2020, 93, 20190855. [Google Scholar] [CrossRef] [PubMed]
  5. Fourcade, A.; Khonsari, R.H. Deep learning in medical image analysis: A third eye for doctors. J. Stomatol. Oral Maxillofac. Surg. 2019, 120, 279–288. [Google Scholar] [CrossRef] [PubMed]
  6. Cho, Y.S.; Cho, K.; Park, C.J.; Chung, M.J.; Kim, J.H.; Kim, K.; Kim, Y.K.; Kim, H.J.; Ko, J.W.; Cho, B.H.; et al. Automated measurement of hydrops ratio from MRI in patients with Meniere’s disease using CNN-based segmentation. Sci. Rep. 2020, 10. [Google Scholar] [CrossRef] [PubMed]
  7. De Water, V.R.; Saridin, J.K.; Bouw, F.; Murawska, M.M.; Koudstaal, M.J. Measuring Upper Airway Volume: Accuracy and Reliability of Dolphin 3D Software Compared to Manual Segmentation in Craniosynostosis Patients. J. Stomatol. Oral Maxillofac. Surg. 2014, 72, 139–144. [Google Scholar] [CrossRef] [PubMed]
  8. Alsufyani, N.A.; Hess, A.; Noga, M.; Ray, N.; Al-Saleh, M.A.Q.; Lagravere, M.O.; Major, P.W. New algorithm for semiautomatic segmentation of nasal cavity and pharyngeal airway in comparison with manual segmentation using cone-beam computed tomography. Am. J. Orthod. Dentofac. 2016, 150, 703–712. [Google Scholar] [CrossRef] [Green Version]
  9. Weissheimer, A.; de Menezes, L.M.; Sameshima, G.T.; Enciso, R.; Pham, J.; Grauer, D. Imaging software accuracy for 3-dimensional analysis of the upper airway. Am. J. Orthod. Dentofac. 2012, 142, 801–813. [Google Scholar] [CrossRef]
  10. Ruckschloss, T.; Ristow, O.; Berger, M.; Engel, M.; Freudlsperger, C.; Hoffmann, J.; Seeberger, R. Relations between mandible-only advancement surgery, the extent of the posterior airway space, and the position of the hyoid bone in Class II patients: A three-dimensional analysis. Br. J. Oral Maxillofac. Surg. 2019, 57, 1032–1038. [Google Scholar] [CrossRef]
  11. Ruckschloss, T.; Ristow, O.; Jung, A.; Roser, C.; Pilz, M.; Engel, M.; Hoffmann, J.; Seeberger, R. The relationship between bimaxillary orthognathic surgery and the extent of posterior airway space in class II and III patients—A retrospective three-dimensional cohort analysis. J. Oral Maxillofac. Pathol. 2021, 33, 30–38. [Google Scholar] [CrossRef]
  12. Kamano, E.; Terajima, M.; Kitahara, T.; Takahashi, I. Three-dimensional analysis of changes in pharyngeal airway space after mandibular setback surgery. Orthod. Waves 2017, 76, 1–8. [Google Scholar] [CrossRef]
  13. Jang, S.I.; Ahn, J.; Paeng, J.Y.; Hong, J. Three-dimensional analysis of changes in airway space after bimaxillary orthognathic surgery with maxillomandibular setback and their association with obstructive sleep apnea. Maxillofac. Plast. Reconstr. Surg. 2018, 40, 33. [Google Scholar] [CrossRef]
  14. Kim, S.C.; Min, K.; Jeong, W.S.; Kwon, S.M.; Koh, K.S.; Choi, J.W. Three-Dimensional Analysis of Airway Change After LeFort III Midface Advancement with Distraction. Ann. Plast. Surg. 2018, 80, 359–363. [Google Scholar] [CrossRef]
  15. Niu, X.W.; Di Carlo, G.; Cornelis, M.A.; Cattaneo, P.M. Three-dimensional analyses of short- and long-term effects of rapid maxillary expansion on nasal cavity and upper airway: A systematic review and meta-analysis. Orthod. Craniofac. Res. 2020, 23, 250–276. [Google Scholar] [CrossRef]
  16. Yamashita, A.L.; Iwaki, L.; Leite, P.C.C.; Navarro, R.D.; Ramos, A.L.; Previdelli, I.T.S.; Ribeiro, M.H.D.; Iwaki, L.C.V. Three-dimensional analysis of the pharyngeal airway space and hyoid bone position after orthognathic surgery. J. Craniomaxillofac. Surg. 2017, 45, 1408–1414. [Google Scholar] [CrossRef]
  17. Wen, X.; Wang, X.Y.; Qin, S.Q.; Franchi, L.; Gu, Y. Three-dimensional analysis of upper airway morphology in skeletal Class Ill patients with and without mandibular asymmetry. Angle Orthod. 2017, 87, 526–533. [Google Scholar] [CrossRef] [Green Version]
  18. Louro, R.S.; Calasans-Maia, J.A.; Mattos, C.T.; Masterson, D.; Calasans-Maia, M.D.; Maia, L.C. Three-dimensional changes to the upper airway after maxillomandibular advancement with counterclockwise rotation: A systematic review and meta-analysis. Int. J. Oral Maxillofac. Surg. 2018, 47, 622–629. [Google Scholar] [CrossRef]
  19. Tan, S.K.; Tang, A.T.H.; Leung, W.K.; Zwahlen, R.A. Three-Dimensional Pharyngeal Airway Changes After 2-Jaw Orthognathic Surgery with Segmentation in Dento-Skeletal Class III Patients. J. Craniofac. Surg. 2019, 30, 1533–1538. [Google Scholar] [CrossRef]
  20. Christovam, I.O.; Lisboa, C.O.; Ferreira, D.M.T.P.; Cury-Saramago, A.A.; Mattos, C.T. Upper airway dimensions in patients undergoing orthognathic surgery: A systematic review and meta-analysis. Int. J. Oral Maxillofac. Surg. 2016, 45, 460–471. [Google Scholar] [CrossRef]
  21. Bianchi, A.; Betti, E.; Tarsitano, A.; Morselli-Labate, A.M.; Lancellotti, L.; Marchetti, C. Volumetric three-dimensional computed tomographic evaluation of the upper airway in patients with obstructive sleep apnoea syndrome treated by maxillomandibular advancement. Br. J. Oral Maxillofac. Surg. 2014, 52, 831–837. [Google Scholar] [CrossRef] [PubMed]
  22. Stratemann, S.; Huang, J.C.; Maki, K.; Hatcher, D.; Miller, A.J. Three-dimensional analysis of the airway with cone-beam computed tomography. Am. J. Orthod. Dentofac. 2011, 140, 607–615. [Google Scholar] [CrossRef] [PubMed]
  23. Alsufyani, N.A.; Flores-Mir, C.; Major, P.W. Three-dimensional segmentation of the upper airway using cone beam CT: A systematic review. Dentomaxillofac. Radiol. 2012, 41, 276–284. [Google Scholar] [CrossRef] [PubMed] [Green Version]
  24. Chen, H.; van Eijnatten, M.; Wolff, J.; de Lange, J.; van der Stelt, P.F.; Lobbezoo, F.; Aarab, G. Reliability and accuracy of three imaging software packages used for 3D analysis of the upper airway on cone beam computed tomography images. Dentomaxillofac. Radiol. 2017, 46. [Google Scholar] [CrossRef]
  25. Torres, H.M.; Evangelista, K.; Torres, E.M.; Estrela, C.; Leite, A.F.; Valladares-Neto, J.; Silva, M.A.G. Reliability and validity of two software systems used to measure the pharyngeal airway space in three-dimensional analysis. Int. J. Oral Maxillofac. Surg. 2020, 49, 602–613. [Google Scholar] [CrossRef]
  26. Burkhard, J.P.M.; Dietrich, A.D.; Jacobsen, C.; Roos, M.; Lubbers, H.T.; Obwegeser, J.A. Cephalometric and three-dimensional assessment of the posterior airway space and imaging software reliability analysis before and after orthognathic surgery. J. Craniomaxillofac. Surg. 2014, 42, 1428–1436. [Google Scholar] [CrossRef]
  27. Zimmerman, J.N.; Lee, J.; Pliska, B.T. Reliability of upper pharyngeal airway assessment using dental CBCT: A systematic review. Eur. J. Orthodont. 2017, 39, 489–496. [Google Scholar] [CrossRef]
  28. Lee, J.Y.; Kim, Y.I.; Hwang, D.S.; Park, S.B. Effect of Maxillary Setback Movement on Upper Airway in Patients with Class III Skeletal Deformities: Cone Beam Computed Tomographic Evaluation. J. Craniofac. Surg. 2013, 24, 387–391. [Google Scholar] [CrossRef]
  29. Chan, H.P.; Samala, R.K.; Hadjiiski, L.M.; Zhou, C. Deep Learning in Medical Image Analysis. Adv. Exp. Med. Biol. 2020, 1213, 3–21. [Google Scholar] [CrossRef]
  30. Shen, D.; Wu, G.; Suk, H.I. Deep Learning in Medical Image Analysis. Annu. Rev. Biomed. Eng. 2017, 19, 221–248. [Google Scholar] [CrossRef] [Green Version]
  31. Yun, J.; Park, J.; Yu, D.; Yi, J.; Lee, M.; Park, H.J.; Lee, J.G.; Seo, J.B.; Kim, N. Improvement of fully automated airway segmentation on volumetric computed tomographic images using a 2.5 dimensional convolutional neural net. Med. Image Anal. 2019, 51, 13–20. [Google Scholar] [CrossRef]
  32. Kuo, C.F.J.; Leu, Y.S.; Hu, D.J.; Huang, C.C.; Siao, J.J.; Leon, K.B.P. Application of intelligent automatic segmentation and 3D reconstruction of inferior turbinate and maxillary sinus from computed tomography and analyze the relationship between volume and nasal lesion. Biomed. Signal Process Control 2020, 57, 19. [Google Scholar] [CrossRef]
  33. Otsu, N. Threshold Selection Method from Gray-Level Histograms. IEEE Trans. Syst. Man Cybern. 1979, 9, 62–66. [Google Scholar] [CrossRef] [Green Version]
  34. El, H.; Palomo, J.M.; Halazonetis, D.J. Measuring the airway in 3 dimensions: A reliability and accuracy study. Am. J. Orthod. Dentofac. 2010, 137, S50.e1–S50.e9. [Google Scholar] [CrossRef]
  35. Sutthiprapaporn, P.; Tanimoto, K.; Ohtsuka, M.; Nagasaki, T.; Iida, Y.; Katsumata, A. Positional changes of oropharyngeal structures due to gravity in the upright and supine positions. Dentomaxillofac. Radiol. 2008, 37, 130–135. [Google Scholar] [CrossRef]
  36. Lee, J.H.; Yu, H.J.; Kim, M.J.; Kim, J.W.; Choi, J. Automated cephalometric landmark detection with confidence regions using Bayesian convolutional neural networks. BMC Oral Health 2020, 20, 270. [Google Scholar] [CrossRef]
  37. Guijarro-Martinez, R.; Swennen, G.R.J. Cone-beam computerized tomography imaging and analysis of the upper airway: A systematic review of the literature. Int. J. Oral Maxillofac. Surg. 2011, 40, 1227–1237. [Google Scholar] [CrossRef]
  38. Muto, T.; Takeda, S.; Kanazawa, M.; Yamazaki, A.; Fujiwara, Y.; Mizoguchi, I. The effect of head posture on the pharyngeal airway space (PAS). Int. J. Oral Maxillofac. Surg. 2002, 31, 579–583. [Google Scholar] [CrossRef]
  39. Weber, D.W.; Fallis, D.W.; Packer, M.D. Three-dimensional reproducibility of natural head position. Am. J. Orthod. Dentofac. Orthop. 2013, 143, 738–744. [Google Scholar] [CrossRef]
  40. Koo, T.K.; Li, M.Y. A Guideline of Selecting and Reporting Intraclass Correlation Coefficients for Reliability Research. J. Chiropr. Med. 2016, 15, 155–163. [Google Scholar] [CrossRef] [Green Version]
Figure 1. Coordinate and plane determination in the midsagittal plane of the cone-beam computed tomography (CBCT) image.
Applsci 11 03501 g001
Figure 2. Airway segmentation process. (A) Binarization image. (B) Hole filled image after close operation. (C) Difference image between (A,B). (D) An image that erases the area outside the area where 5 reference points, and 1/4 and 3/4 of the inferior border are connected. (E) Segmented airway.
Applsci 11 03501 g002
Figure 3. (A) Example of manually pointed data and its volume segmentation. (B) Example of deep learning pointed data and its volume segmentation.
Applsci 11 03501 g003
Figure 4. Boxplots of the differences between manual analysis and deep learning analysis (N = 61). In the boxplots, ‘x’ within the box marks the mean of volume differences.
Applsci 11 03501 g004
Figure 5. Scatter plot of total volume measured between the manual of deep learning (r2 = 0.975, slope = 1.02, p < 0.001). The line indicates a linear regression graph. There is a strong correlation between the two methods (N = 61).
Applsci 11 03501 g005
Figure 6. Bland-Altman plot of the total volume data set. The green line indicates the upper limit of agreement, while the red line indicates the lower limit of agreement (N = 61).
Applsci 11 03501 g006
Table 1. Definition of reference points and planes for airway division. (Abbreviations: PNS, posterior nasal spine; VP, posterior point of vomer; CV1, 1st cervical vertebra; CV2, 2nd cervical vertebra; CV4, 4th cervical vertebra).
DefinitionExplanation
Reference Points
PNSMost posterior point of palate
VPMost posterior point of vomer
CV1Most anterior inferior point of anterior arch of atlas
CV2Most anterior inferior point of anterior arch of second vertebra
CV4Most anterior inferior point of anterior arch of fourth vertebra
Reference planes
PNS-Vp planeThe plane was perpendicular to the midsagittal plane passing through the PNS and the Vp.
CV1 planeThe plane was parallel to the natural head position plane passing through CV1.
CV2 planeThe plane was parallel to the natural head position plane passing through CV2.
CV3 planeThe plane was parallel to the natural head position plane passing through CV3.
CV4 planeThe plane was parallel to the natural head position plane passing through CV4.
Volume
NasopharynxFrom PNS-VP plane to CV1 plane
OropharynxFrom CV1 plane to CV2 plane
HypopharynxFrom CV2 plane to CV4 plane
Table 2. Measurements of the differences between manual analysis and deep learning analysis (N = 61).
AverageSD
Volume (mm3)
Nasopharynx48.62049.468
Oropharynx37.98743.289
Hypopharynx50.01057.891
Total volume85.25686.504
Distances between M and DL (mm)
PNS2.8171.806
VP2.8371.924
CV12.5712.028
CV22.8962.205
CV44.1562.379
Table 3. Agreement analysis of the volume and point via intra-class correlation coefficient (ICC) (Two-way random effects, absolute agreement, single rater/measurement) (N = 61).
VariablesICC95% CI
Lower LimitUpper Limit
Volume
Nasopharynx0.9120.8580.946
Oropharynx0.9840.9730.99
Hypopharynx0.9640.9410.978
Total volume0.9860.9770.992
Coordinate
PNS(x)0.9080.8520.944
PNS(y)0.9520.9210.971
Vp(x)0.9080.8420.946
Vp(y)0.9390.890.965
CV1(x)0.9290.8850.957
CV1(y)0.9560.9280.974
CV2(x)0.9630.9390.978
CV2(y)0.9240.8770.954
CV4(x)0.9530.9240.972
CV4(y)0.8680.790.919
Publisher’s Note: MDPI stays neutral with regard to jurisdictional claims in published maps and institutional affiliations.

