Abstract
This study assesses the electric current parameters and reports on the analysis of the associated degree of myocardial function during left ventricular assist device (LVAD) support. An assumption is made that there is a correlation between cardiac output and the pulsatility index of the pump electric current. The experimental study is carried out using the ViVitro Pulse Duplicator System with Sputnik LVAD connected. Cardiac output and cardiac power output are used as a measure of myocardial function. Different heart rates (59, 73, 86 bpm) and pump speeds (7600–8400 rpm in 200 rpm steps) are investigated. In our methodology, ventricular stroke volumes in the range of 30–80 mL for each heart rate at a certain pump speed were used to simulate different levels of contractility. The correlation of the two measures of myocardial function and proposed pulsatility index was confirmed using different correlation coefficients (values ≥ 0.91). Linear and quadratic models for cardiac output and cardiac power output versus pulsatility index were obtained using regression analysis of measured data. Coefficients of determination for CO and CPO models were in the ranges of 0.914–0.982 and 0.817–0.993, respectively. Study findings suggest that appropriate interpretation of parameters could potentially serve as a valuable clinical tool to assess myocardial therapy using LVAD infrastructure.
1. Introduction
Heart transplantation for end-stage heart failure patients who are not amenable to medical or surgical therapy remains the gold standard treatment. However, the lack of organ donors will always limit the availability of heart transplants for the majority of end-stage heart failure population. As an alternative, the use of mechanical circulatory support (MCS) devices increased in recent decades and became a valid treatment option [1].
Although the overall usage of continuous-flow (CF) left ventricular assist devices (LVADs) continues to increase, therapy management aspects remain challenging, with no consensus on well-defined assessment criteria, support duration, and particularly, explantation strategies [2,3,4,5,6,7]. In past decades, it was numerously reported that CF LVAD support can lead to cardiac recovery [3,4,5,8,9]. At the same time, the number of people under LVAD support increased dramatically during the last decade, and according to recent data, more than 70% of outcomes are the destination therapy patients [10]. As the technology advances, instrumentation for proper evaluation of ventricular function becomes crucial in developing LVAD treatment and explantation strategies for improving patients’ outcome.
In past decades, the development of automatic or physiological LVAD control methods was intensively carried out by many research groups. These methods are aimed to automatically regulate pump speed in response to changes occurring in the cardiovascular system (CVS) during support, and to changes in ventricular function in particular. Multiple reports on pulsatility measures of different pump characteristics (flow rate, pressure head, electric current, power consumption) proposed to implement automatic pump control strategies were provided [11,12,13,14,15,16]. Mainly, different indices of pump flow rate are used as a pulsatility measure [11,12,14,15,16]. Besides, the pulsatility index of pump motor current was used to determine the safety range of LVAD speed to avoid valve regurgitation and suction state of the ventricle during support [13]. Relations of pulsatility measures to residual ventricular contractility and preload were also shown in the listed reports.
Unfortunately, proposed methods of physiological control have a number of shortcomings impeding their actual use in clinical practice. Although the clinical implementation of physiological pump control remains an unsolved and complex task, there is still an opportunity to introduce a simpler additional noninvasive tool for clinical hemodynamic assessment in heart failure patients with LVADs implanted. Such tools are can be included in the LVAD controllers and providing medically clear parameters that evaluate myocardial function, which may be used along with other tools applied in clinics like echocardiography. It may also be utilized for outpatient monitoring of myocardial function, in particular for the detection of possible cardiac recovery. The development process of such tools can be started at the determination of the relationship between myocardial mechanical function and readily available LVAD intrinsic parameters, such as the pulsatility index of the pump electric current, since it was shown to have a relationship with left ventricular contractility [13,17].
In this study, we aim to assess the pulsatility of the pump electric current and report on the analysis of the associated degree of myocardial function during LVAD support. The main assumption is a correlation between the degree of myocardial function and the electric current pulsatility index. We represent an in-vitro study where the degree of myocardial function is determined by cardiac output (CO) and cardiac power output (CPO). CPO parameter was chosen as the most powerful noninvasively measured predictor of prognosis and mortality in patients with chronic and acute heart failure. CO parameter is a further simplification of CPO, due to their linear relationship [8,18,19,20].
The interpretation of the LVAD parameters related to the electric current may have a significant clinical predictive value for the assessment of myocardial function and potentially can be used as an extra 24/7 outpatient source of hemodynamic information. The proposed predictive tool may also be useful for monitoring the effectiveness of LVAD support and report the analysis of the associated degree of myocardial function during support, including possible recovery detection.
2. Materials and Methods
2.1. Experimental Setup and Device Description
The experimental study was carried out using the ViVitro Pulse Duplicator System (PDS, SD2001-1; ViVitro Inc., Victoria, BC, Canada) to stimulate various hemodynamic conditions for adults and pediatric patients. (Figure 1, with the Sputnik LVAD, an axial-flow blood pump with a nonpulsatile flow of up to 10 L/min, connected). The PDS consists of a hydraulic circuit based on the ViVitro Heart Model, the SuperPump pulsatile pump, an ultrasonic flow sensor (ME-11PXL Clamp-on Tubing Flow sensors; Transonic Systems, Ithaca, NY, USA), and the ViViTest data acquisition system.
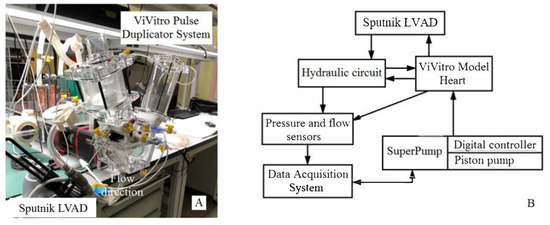
Figure 1.
Image (A) of ViVitro Pulse Duplicator System SD2001-1 with the Sputnik LVAD connected (B) and the block diagram.
The Sputnik LVAD features technical performance parameters which are comparable to the HeartMate II (Abbott Laboratories, Abbott Park, IL, USA) and the HeartAssist5 (Reliant Heart, Houston, TX, USA) VADs [21].
The SuperPump pulsatile pump is a digitally controlled hydraulic piston pump generating physiological cardiac flows. Digital control allows the operator to set the stroke volume (SV) of the ViVitro Model Heart, which generates the physiological cardiac output in the hydraulic circuit at a pre-set heart rate. The ViVitro Model Heart is an acrylic chamber divided into two parts (piston pump and hydraulic circuit) by the silicon membrane and is driven by the piston pump (SuperPump) to reproduce left ventricular contraction.
The hydraulic circuit of the circulatory mock loop consists of an aortic unit, including the aorta and aortic root, which are adjustable compliance chambers; a systemic vascular unit reproducing the physiological resistance of the peripheral circulation; and an atrial unit, which represents an open chamber with a fluid level corresponding to the atrial pressure. Aortic and mitral valves are represented by mechanical disk valves supplied by ViVitro in a standard package.
The ultrasonic flow sensor is connected to a signal converter to validate the flow measurements. The signal from the system, along with signals from three pressure sensors connected to the ViVitro Model Heart, aortic and atrial units, are all transmitted to the ViViTest data acquisition system. In combination with the ViViTest software, the system allows the operator to record and analyze the data of physiological flows and pressures in the hydraulic circuit, and also to adjust the control signal of the SuperPump. The waveform of the control signal can be chosen from the list of typical waveforms: FDA (Food and Drug Administration) waveform, triangle waveform, sine waveforms of different systole duration. Furthermore, there is an option to customize waveform according to certain applications. In the presented research, the FDA waveform for the SuperPump control signal was used.
There are several operation processes in the ViViTest software that acquire signals from sensors for 10 consecutive cardiac cycles, review and analyze acquired data, compare data of a series of trials, and calibrate the sensors. Data analysis proceeds sequentially from cycle 1 to 10. Pressure and flow waveforms are displayed along with crossover markers defining critical intervals during the cycle. Automatic algorithms calculate the start and end of the aortic and mitral valve pressure and flow cycles. Data dashboard includes maximum, minimum, mean, and back valve pressures; closing, leakage, and total regurgitation volumes for each valve and relative regurgitation in the percentage of total valve volume.
A glycerol-water mixture with a dynamic viscosity of 3.5 mPa·s at 22.0 °C was used in the hydraulic circuit to reproduce the blood viscosity of a patient with Sputnik LVAD implanted. In this study, we investigated different heart rates (HR), i.e., 59, 73, and 86 bpm, and pump speeds ranging from 7600 to 8400 rpm with 200 rpm-increment steps. This particular speed range was considered because it allows the pump blood flow rate to be maintained in the 1–7 L/min range. HR values were chosen based on the clinical data of patients with implanted LVADs [8]. Ventricular stroke volumes in the range of 30–80 mL for each heart rate value at a certain pump speed were used. It is consistent with gradually changing cardiac states from end-stage heart failure to a normal state, including recovery. Characteristics of each state were simulated according to clinical data reported in the recent work of Jakovljevic et al.
2.2. Investigated Parameters
Systolic, diastolic, and mean aortic pressures were obtained using the ViViTest software. Additionally, the mean aortic pressure was calculated using the following equation represented by Meaney et al. [22].
where and are the diastolic aortic pressure and the systolic aortic pressure, respectively.
Cardiac output and cardiac power output (CPO) were used as a measure of the degree of myocardial recovery. CPO is the hydraulic energy required by the heart to provide enough blood flow to the systemic circulation [9]. CO and CPO were calculated as follows [8]:
During experiments with the Sputnik LVAD, the electric current was acquired via the electronic control unit of the LVAD.
The pulsatility index (PI) of the Sputnik LVAD electric current was calculated as follows:
where , and are maximum, minimum, and mean values of the electric current averaged over all cardiac cycles during one simulated hemodynamic condition. The represented PI is calculated in the same way as similar to the PI of HeartMate II, which is automatically calculated by the device as the difference between the maximum and minimum pump power consumption divided by average pump power consumption averaged over 15 s [17,23,24]. Since electric current and power consumption are linearly related through stabilized supply voltage and averaging period of 15 s can correspond to a stable state of CVS, the analogy is evident.
2.3. Correlation between CVS and Pump Parameters
A block diagram of the LVAD biotechnical system is shown in Figure 2. It represents the following parameters: P1 and P2 are pressures in the left ventricle and aorta, respectively; Q1, Q2, and Q3 are the blood flow rates through the aortic valve, pump, and aorta, respectively; H represents the pressure head across the pump; I is the electric current measured in the motor windings; A is the external work of the left ventricle; and ω is the rotation speed of the pump set to continuous-flow mode.
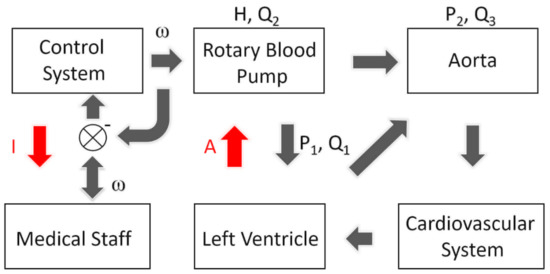
Figure 2.
LVAD biotechnical system. H, pressure head across the pump; Q1, aortic valve flow rate; Q2, pump flow rate; Q3, aortic flow rate to systemic circulation; P1, pump inlet pressure; P2, pump outlet pressure; ω, the rotation speed of the pump impeller; I, pump electric current measured in the motor windings; A, external work of the left ventricle. Red arrows indicate parameters under the study; black arrows indicate other parameters of circulation supported with LVAD.
Among the described parameters, it is necessary to highlight the following equations:
Control issues of the LVAD presented in Figure 2 include: (1) The discrepancy between the parameters that need to be controlled ensuring circulatory support (i.e., P1, P2, Q1, Q3); (2) the parameters generated by the continuous-flow rotary pump (H, Q2); and (3) the parameters that can be tracked and changed in real-time during LVAD support (I, ω). It was previously shown that there are ways to find correlations between different parameters using: (1) A ratio between the maximum flow acceleration and flow pulsatility at baseline pump speed as an alternative to a regression coefficient between the maximum flow acceleration and flow pulsatility at different pump speeds [25]; (2) the external work of the ventricle expressed by the area inside the P-V diagrams which correlates with the area inside dynamic H-Q curves [26]; or (3) energetic characteristics of LV-LVAD interaction [27]. Our hypothesis is that changes in the work (A) of the left ventricle affect the recorded parameter of the electric current (I). In particular, we assume that myocardial function may be evaluated by changing I.
In order to investigate the correlation between cardiac function and pulsatility index of the pump electric current, a comparison of cardiac output and cardiac power output characteristics vs. PI was performed. The obtained data was processed using univariate linear and nonlinear regression analysis.
3. Results
Figure 3 demonstrates the time chart of the Sputnik LVAD electric current measured at different CO levels with similar heart rates and LVAD speed levels. Different HRs and LVAD speed levels are given to highlight the change in pulsatility of electric current. LVAD speed levels correspond to the minimum, mean, and maximum values of the investigated speed range. Represented CO levels correspond to simulated states of initial LVAD support and significant myocardial recovery. A significant increase of the peak-to-peak amplitude of electric current with increasing CO can clearly be observed. At the same time, the mean electric current changes less significantly. This can be expressed as an overall rise in the electric current pulsatility. Therefore, possible prediction of recovery using the proposed PI of the electric current of the Sputnik LVAD can be supported by a visible correlation of CO to pulsatility.
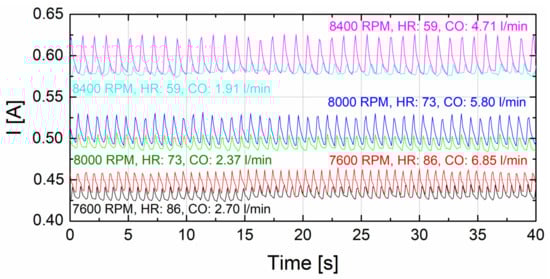
Figure 3.
Time chart of the Sputnik LVAD electric current at similar HRs and speed levels for the two different CO levels corresponding to the simulated states of initial LVAD support and significant myocardial recovery. LVAD speed levels (black and red curves for 7600 rpm; green and blue curves for 8000 rpm; turquoise and magenta curves for 8400 rpm) are the minimum, mean, and maximum speed values in the investigated range.
Statistical analysis of the measured data was performed to comprehensively evaluate this correlation. Table 1 and Table 2 represent the statistical data of correlation and regression analyses for different regression models of CO and CPO, respectively, versus pulsatility index of the Sputnik LVAD electric current, for three different heart rates.

Table 1.
Data of statistical analysis of different regression models for CO response.
Table 2.
Data of statistical analysis of different regression models for CPO response.
As one can see from the statistical data, regression analysis was performed for simple linear regression models and two types of quadratic models, which include and exclude the linear term. Statistical significance of the models was tested using F-test versus constant models for measured data sets. Moreover, Pearson’s correlation coefficient and Spearman’s rank correlation coefficient were calculated for each data set. Statistically significant and similar values of these coefficients suggest that investigated parameters are strongly correlated and can be either linear or nonlinear monotonic relationships.
Analysis of regression residuals was performed for all proposed regression models. Statistical hypotheses of normality, zero autocorrelation, and homoscedasticity for regression residuals were tested to approve or disapprove adequacy of the models. In fact, residuals were normally distributed and homoscedastic, but autocorrelated for all tested models. Therefore, the only concern was to obtain models with nonautocorrelated residuals implementing correction of data sets given that normality and homoscedasticity of residuals persists. Unfortunately, this concern was not satisfiable for any linear model with reasonable correction of a data set, implying that these models are inadequate for given data sets. Thus, all linear models represented were obtained for initial data sets, which are shown in Figure 4. On the contrary, all quadratic models represented were obtained for corrected data sets with evident outliers excluded from the fit. It should be noted that corrected data sets for quadratic models of CPO were reduced more significantly (3–8 outliers excluding) than for CO models (1–3 outliers excluding). However, residuals of all shown quadratic models were found to be normally distributed, nonautocorrelated and homoscedastic implying that these models are adequate for corrected data sets at least.
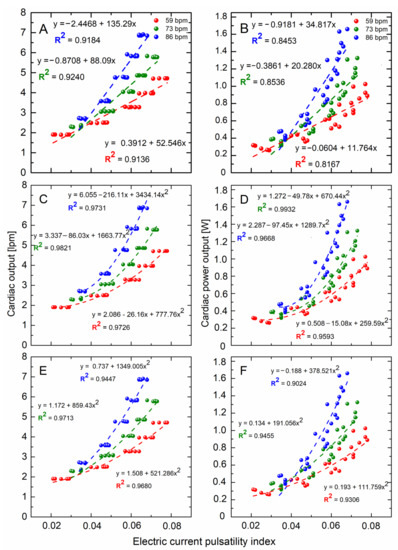
Figure 4.
Measured data sets and regression models of cardiac output (A,C,E) and cardiac power output (B,D,F) versus pulsatility index of the Sputnik LVAD electric current for three heart rate values—59 (red), 73 (green) and 86 (blue) bpm. Regression equations and coefficients of determination adjusted to the number of coefficients are given near the curves. Error bars correspond to the point size.
Statistical significance of regression coefficients can be explained in terms of p-values included in the presented statistical data. Thus, at the most common 5% significance level, all the coefficients are significant, except for constant terms in linear regression models for both CO and CPO at 59 bpm. Those terms can be called statistically less significant for the measured data sets, although the general significance of all obtained regression coefficients has to be discussed.
Initially measured data sets and finally obtained regression models of CO and CPO vs. PI for three different heart rate values (59, 73, and 86 bpm) are shown in Figure 4A,C,E and Figure 4B,D,F, respectively. Actual regression equations and coefficients of determination adjusted for the number of regression coefficients are given near the curves. Represented relationships tend to be strictly monotonic in the given range of PI, except for quadratic models of CPO with the linear term. Those relationships have an obvious local minimum at a certain value of PI closer to the left end of the range.
However, an increase in PI suggests an increase in cardiac output and CPO for any represented model at least over most of the PI range. Since the pump operating mode is not changed, it can be assumed that a change in myocardial function takes place. Moreover, Figure 4 shows that the slope of the linear regression curves and the tangent slope to quadratic curves increase with increasing heart rate. This may indicate a more explicit improvement in myocardial function for higher heart rates.
4. Discussion
Since it was shown that patients with end-stage heart failure can recover cardiac function with a combination of LVAD and medical therapies [4,6,8,9,20,25,28,29], an additional noninvasive tool for outpatient hemodynamic monitoring appears to be necessary. If a certain degree of myocardial function following LVAD implantation is assessed in clinics during the post-operative period, the ability to evaluate myocardial function noninvasively during the outpatient period is essential and should be addressed. Despite potential complications attributable to various discrepancies that may vary from mechanical aspects to electric (windings losses, rotor losses, friction loss, etc.), finding reliable correlations between parameters of different devices and hemodynamic parameters will be necessary. However, the precise estimation may be a limiting factor in this case. Nevertheless, provided that these estimations were performed in a correct and meticulous manner, it is possible to evaluate the correlation between the pulsatility index of pump electric current and myocardial function.
The use of the Sputnik LVAD was in the focus of represented experiments. The major goal was to determine the possibility of assessing the energetic parameters of the heart using the recorded pump electric parameters [20]. The assumption about the correlation between investigated parameters (CO vs. PI and CPO vs. PI) was confirmed by means of represented correlation and regression analyses. According to presented statistical data, quadratic models of both types are better fits for CO estimation using the proposed PI than linear ones. In terms of statistical significance, the best fits for CO in the given ranges of PI can be determined as quadratic models with the included linear term. Regression analysis of CPO models revealed almost the same trends in statistical significance.
However, concern on the physical nature of the investigated the relationships should be addressed to assume their expected form and compare it to the obtained models. At first, a monotonically increasing function for these relationships can be assumed as an expected form in the physiological range. It can be discussed separately whether this function should be strictly increasing or just nondecreasing. Since the coverage of the physiological range of contractility measures is out of doubt in this study, a further assumption is to suppose this function in a simple form. For this, presented forms of regression models were chosen. Secondly, if zero pulsatility of the pump electric current corresponds to zero pump support, it must be obvious that a certain positive level of contractility should be observed at this point. This positive contractility level can be determined as an actual contractility level of the unsupported left ventricle. For linear models, there is only one (linear CO model at 59 bpm) that estimates contractility level at zero pulsatility of the pump current with a positive value. Other linear models for both CO and CPO estimate this level with a negative value. Furthermore, with HR increasing, this negative estimate level significantly decreases. On the contrary, quadratic models with linear term significantly overestimate this contractility level, making it grow with increasing HR. As a mean, quadratic models with excluded linear term address this concern in a more or less appropriate manner for both CO and CPO responses, except for the only model of CPO at 86 bpm where this level is estimated as negative. Thus, quadratic models with the excluded linear terms can be suggested as the most appropriate for CO estimation using PI given their overall statistical significance and adequacy for measured data sets along with better conformity to the physical nature of the relationship.
Although the same considerations may be attributed to CPO estimation using PI, it should be noted that measured data sets were significantly corrected to eliminate autocorrelation of regression residuals. In fact, residual autocorrelation can be related to inappropriate choice of regression form, neglect of other possible significant factors, and cyclic recurrence of the measured data. Since the regression form can be approved by the presented models at least in the measured range, it may be suggested that other factors should be taken into account rather than just PI in case of CPO estimation. However, the presence of cyclic recurrence in the measured data sets should also be considered a limiting factor for CPO model adequacy.
Additionally, it should be noted that despite overestimation of statistical significance of the presented linear models, due to residual autocorrelation, they can be considered compatible to measured data sets in the given range of PI. Although they may provide a rougher estimate of contractility measures than quadratic models, it may be proposed as a sufficient noninvasive tool for outpatient monitoring of myocardial function for the initial indication of recovery process.
Although evaluation methods of the presented relationships can be utilized and included in the LVAD controller to provide a simple, noninvasive tool for outpatient hemodynamic monitoring, extensive research is needed to generalize this methodology for any RBP.
4.1. Applicability for Physiological Pump Control
In addition to the outpatient application, the proposed evaluation method of myocardial function has the potential to be utilized in the development of an algorithm for physiological pump control to automatically change and maintain pump speed at an optimal value for a current state of myocardial function. Numerous reports represent the application results of LVAD electric parameters for myocardial function assessment. For instance, Karantonis et al. reported on the noninvasive identification of regurgitant pump flow, ventricular ejection, nonopening of the aortic valve, and collapse of the ventricle wall [30]. Moreover, there are reports on controllers monitoring aortic valve opening [31], detecting the suction state of the ventricle [32], and based on physical activity level index [33]. Previously, an LVAD controller based on the use of pulsatility ratio of pump flow rate and pressure head was reported [14,15,16]. The pulsatility index of pump motor current was used to determine the safety range of LVAD speed to avoid valve regurgitation and suction state of the ventricle during support [13]. There is a report theoretically assessing the Starling-like pump controller and justifying the use of flow pulsatility as the measure of choice [12]. Besides, the method for cardiac contractility assessment using only pump flow and pump speed was reported [11].
All the listed control methods are representatives of physiological pump control, which is supposed to automatically optimize the pump speed in a safety range for a specific state of the patient’s CVS. However, these methods have certain shortcomings which do not allow us to use them in clinical practice. The main issue is that medical practitioners cannot rely on automatic algorithms based on not clearly understandable nonmedical parameters. Most control algorithms are non- or semiautomatic themselves, due to the need for manual selection of reference intrinsic parameters for a specific patient. It should be noted that the main parameters that need to be constantly evaluated under CF operating conditions are blood flow rate through the pump and pressure at the pump inlet (preload) and pump outlet (afterload) [34,35]. Other disadvantages are linked to methods of determination of these parameters, which are: (1) Direct measurement, and (2) estimation through indirect methods using readily available intrinsic LVAD parameters (e.g., pump speed and electric current or power consumption) to derive flow rate via a process model [7,36,37,38,39,40,41,42,43]. Direct measurement increases invasiveness which is not always necessary or available in long-term support. And the second approach has limitations in accuracy caused by the low system efficiency of rotary blood pumps (RBPs), which makes it difficult to assess the direct correlation between electric and hydraulic parameters of the system [7,42,43,44,45,46,47]. For instance, the maximum efficiency of CF RBP typically does not exceed 30 % [48,49,50,51]. Such a low efficiency can be explained by various energy losses in the whole system, i.e., electric, mechanical, and hydraulic losses [52,53]. Mainly, conversion of mechanical energy into hydraulic becomes low efficient, due to the substantially larger ratio between the clearance gap and the diameter of the impeller in miniaturized blood pumps compared to industrial pumps with large impellers. This inflicts higher energy losses compared to other loss types [54,55].
Our group has also deeply investigated the relationship between pump power consumption and blood flow rate [56]. This relationship was studied for two generations of CF RBPs: (1) The first generation of Sputnik LVAD that was successfully implemented into clinical practice [57,58], and (2) the second generation under development, which is aimed at miniaturization and reducing the risk of blood cell trauma [44]. The nonlinear relationship between blood flow rate and power consumption demonstrates that the minimum power consumption cannot be obtained at the point of zero flow in the pump [37]. The described relationship shows that estimation of the blood flow rate in axial pumps using indirect methods does not reliably determine the lower range values.
Furthermore, some physiological control methods lack consideration of errors in measurement or estimation of pulsatility measure, pump flow rate, or pressure head.
The represented pulsatility index is simply and readily available from an LVAD controller without any complex calculations and/or invasive measurements of hemodynamic parameters. CPO or CO parameters are commonly used by clinicians for evaluation of myocardial function and can be verified, if necessary, by noninvasive tools in clinics. And there is no need to manually select any reference parameters for the represented evaluation method. Therefore, the represented method can potentially overcome some of the common shortcomings of physiological control methods. However, this opportunity should be addressed in future work.
4.2. Study limitations
This in-vitro study has a number of limitations that should be noted. Firstly, the necessity of extensive research on the generalization of the represented methodology for any other RBP besides Sputnik LVAD should be addressed. Secondly, validation of results in a broad range of hemodynamic conditions should also be performed, as the PI may be affected by volume status, inotropic medications, or during exercise rather than myocardial recovery [17]. The possibility of mitral regurgitation (MR) was not considered, despite the clinically observed MR improvement following LVAD implantation in end-stage heart failure patients [7]. Besides, only the mechanical activity of the left ventricle specific for sinus rhythm was studied, and the electrophysiological measurements were not carried out. The reaction of the proposed method to simulated physical exercise with higher heart rates or tachycardia as a symptom of heart failure might be of interest. Frank–Starling mechanism was also not implemented in the ViVitro PDS for this study. Since ventricular contractility depends on both the sympathetic stimulation on the heart and the preload changes, the pulsatility index has also been shown to have a relationship with preload [12]. This inflicts another limitation that preload contribution into the pulsatility index was not considered in this study. Modification of the current experimental setup to mimic the right ventricle can help to validate the obtained data. Furthermore, in-vivo studies should be performed for the data validation.
Furthermore, the study lacks specificity/sensitivity analysis and evaluation of possible sources of error. Proposed relationships between myocardial function and pump electric current pulsatility may be related to other factors affecting the pump current. Finally, since the proposed evaluation methods require a sufficient increase in accuracy in view of a lack of clinical data, its relevance as a predictor of clinical performance remains to be proven.
5. Conclusions
Study findings suggest that a strong correlation of CO and CPO to PI parameter has the potential to be described using regression analysis. Proposed CO regression models were shown to have better performance in the investigated PI range than CPO models. Moreover, it was shown that quadratic models describe this correlation better than linear ones. Thus, proposed quadratic CO models should be considered the ones which may be used as a valuable clinical tool to noninvasively assess myocardial function and assist with strategies of patients’ management and device explantation. In addition, they may be used as an extra 24/7 outpatient source of hemodynamic information for initial detection of possible recovery.
The general methodology presented in this paper may be applied to any continuous-flow LVAD, provided the specific characteristics to compute the used index are known. Further work needs to address this generalization claim and test the method for different designs.
Author Contributions
D.V.T. conceived the research idea. D.V.T. and S.V.S. supervised and coordinated the research. D.V.T. and S.V.S. designed the pump. I.A.E. and A.A.P. collected the data and conducted the statistical expertise. D.V.T., and A.M. are responsible for the literature search. A.M., and D.V.T. wrote the manuscript with input from all authors. D.V.T., A.M., M.W., S.L. and J.H.K. performed the critical review of the article, All authors have read and agreed to the published version of the manuscript.
Funding
This work was financed by the Ministry of Science and Higher Education of the Russian Federation within the framework of state support for the creation and development of World-Class Research Centers “Digital biodesign and personalized healthcare” №075-15-2020-926 and Deutsche Forschungsgemeinschaft (DFG, Project 409796053).
Data Availability Statement
All the data used to support the findings of this study are available from the corresponding author upon request.
Conflicts of Interest
The authors declare no conflict of interest.
References
- Kirklin, J.K.; Pagani, F.D.; Kormos, R.L.; Stevenson, L.W.; Blume, E.D.; Myers, S.L.; Miller, M.A.; Baldwin, J.T.; Young, J.B.; Naftel, D.C. Eighth annual INTERMACS report: Special focus on framing the impact of adverse events. J. Heart Lung Transplant. 2017, 36, 1080–1086. [Google Scholar] [CrossRef] [PubMed]
- Kado, Y.; Miyamoto, T.; Fukamachi, K.; Karimov, J.H. Update on the management and associated challenges of adult patients treated with veno-arterial extracorporeal membrane oxygenation. Expert Rev. Med. Devices 2019, 16, 483–491. [Google Scholar] [CrossRef]
- Topkara, V.K.; Garan, A.R.; Fine, B.; Godier-Furnémont, A.F.; Breskin, A.; Cagliostro, B.; Yuzefpolskaya, M.; Takeda, K.; Takayama, H.; Mancini, D.M.; et al. Myocardial Recovery in Patients Receiving Contemporary Left Ventricular Assist Devices. Circ. Heart Fail. 2016, 9, e003157. [Google Scholar] [CrossRef] [PubMed]
- Frazier, O.H.; Baldwin, A.C.W.; Demirozu, Z.T.; Segura, A.M.; Hernandez, R.; Taegtmeyer, H.; Mallidi, H.; Cohn, W.E. Ventricular reconditioning and pump explantation in patients supported by continuous-flow left ventricular assist devices. J. Heart Lung Transplant. 2015, 34, 766–772. [Google Scholar] [CrossRef]
- Knierim, J.; Heck, R.; Pieri, M.; Schoenrath, F.; Soltani, S.; Stawowy, P.; Dreysse, S.; Stein, J.; Müller, M.; Mulzer, J.; et al. Outcomes from a recovery protocol for patients with continuous-flow left ventricular assist devices. J. Heart Lung Transplant. 2019, 38, 440–448. [Google Scholar] [CrossRef] [PubMed]
- Moscato, F.; Schima, H. Mechanical Circulatory Support in End-Stage Heart Failure; Montalto, A., Loforte, A., Musumeci, F., Krabatsch, T., Slaughter, M.S., Eds.; Springer International Publishing: Cham, Switzerland, 2017; ISBN 978-3-319-43381-3. [Google Scholar]
- Swetz, K.M.; Freeman, M.R.; Mueller, P.S.; Park, S.J. Clinical management of continuous-flow left ventricular assist devices in advanced heart failure. J. Heart Lung Transplant. 2010, 29, 1081. [Google Scholar] [CrossRef] [PubMed]
- Jakovljevic, D.G.; Yacoub, M.H.; Schueler, S.; MacGowan, G.A.; Velicki, L.; Seferovic, P.M.; Hothi, S.; Tzeng, B.-H.; Brodie, D.A.; Birks, E.; et al. Left Ventricular Assist Device as a Bridge to Recovery for Patients with Advanced Heart Failure. J. Am. Coll. Cardiol. 2017, 69, 1924–1933. [Google Scholar] [CrossRef] [PubMed]
- Hall, S.G.; Garcia, J.; Larson, D.F.; Smith, R. Cardiac power index: Staging heart failure for mechanical circulatory support. Perfusion 2012, 27, 456–461. [Google Scholar] [CrossRef] [PubMed]
- Teuteberg, J.J.; Cleveland, J.C.; Cowger, J.; Higgins, R.S.; Goldstein, D.J.; Keebler, M.; Kirklin, J.K.; Myers, S.L.; Salerno, C.T.; Stehlik, J.; et al. The Society of Thoracic Surgeons Intermacs 2019 Annual Report: The Changing Landscape of Devices and Indications. Ann. Thorac. Surg. 2020, 109, 649–660. [Google Scholar] [CrossRef]
- Naiyanetr, P.; Moscato, F.; Vollkron, M.; Zimpfer, D.; Wieselthaler, G.; Schima, H. Continuous assessment of cardiac function during rotary blood pump support: A contractility index derived from pump flow. J. Heart Lung Transplant. 2010, 29, 37–44. [Google Scholar] [CrossRef]
- Salamonsen, R.F.; Lim, E.; Gaddum, N.; AlOmari, A.-H.H.; Gregory, S.D.; Stevens, M.; Mason, D.G.; Fraser, J.F.; Timms, D.; Karunanithi, M.K.; et al. Theoretical Foundations of a Starling-Like Controller for Rotary Blood Pumps. Artif. Organs 2012, 36, 787–796. [Google Scholar] [CrossRef]
- Endo, G.; Araki, K.; Oshikawa, M.; Kojima, K.; Nakamura, K.; Matsuzaki, Y.; Onitsuka, T. A Safe Automatic Driving Method for a Continuous Flow Ventricular Assist Device Based on Motor Current Pulsatility:In Vitro Evaluation. ASAIO J. 2002, 48, 83–89. [Google Scholar] [CrossRef] [PubMed]
- Choi, S.; Boston, J.R.; Antaki, J.F. Hemodynamic Controller for Left Ventricular Assist Device Based on Pulsatility Ratio. Artif. Organs 2007, 31, 114–125. [Google Scholar] [CrossRef] [PubMed]
- Choi, S.; Boston, J.R.; Antaki, J.F. An investigation of the pump operating characteristics as a novel control index for LVAD control. Int. J. Control. Autom. Syst. 2005, 3, 100–108. [Google Scholar]
- Choi, S.; Antaki, J.E.; Boston, R.; Thomas, D. A sensorless approach to control of a turbodynamic left ventricular assist system. IEEE Trans. Control Syst. Technol. 2001, 9, 473–482. [Google Scholar] [CrossRef]
- Slaughter, M.S.; Pagani, F.D.; Rogers, J.G.; Miller, L.W.; Sun, B.; Russell, S.D.; Starling, R.C.; Chen, L.; Boyle, A.J.; Chillcott, S.; et al. Clinical management of continuous-flow left ventricular assist devices in advanced heart failure. J. Heart Lung Transplant. 2010, 29, S1–S39. [Google Scholar] [CrossRef] [PubMed]
- Cotter, G.; Williams, S.G.; Vered, Z.; Tan, L.B. Role of cardiac power in heart failure. Curr. Opin. Cardiol. 2003, 18, 215–222. [Google Scholar] [CrossRef] [PubMed]
- Mendoza, D.D.; Cooper, H.A.; Panza, J.A. Cardiac power output predicts mortality across a broad spectrum of patients with acute cardiac disease. Am. Heart J. 2007, 153, 366–370. [Google Scholar] [CrossRef] [PubMed]
- Jakovljevic, D.G.; George, R.S.; Donovan, G.; Nunan, D.; Henderson, K.; Bougard, R.S.; Yacoub, M.H.; Birks, E.J.; Brodie, D.A. Comparison of Cardiac Power Output and Exercise Performance in Patients with Left Ventricular Assist Devices, Explanted (Recovered) Patients, and Those With Moderate to Severe Heart Failure. Am. J. Cardiol. 2010, 105, 1780–1785. [Google Scholar] [CrossRef]
- Chiu, W.-C.; Girdhar, G.; Xenos, M.; Alemu, Y.; Soares, J.S.; Einav, S.; Slepian, M.; Bluestein, D. Thromboresistance Comparison of the HeartMate II Ventricular Assist Device with the Device Thrombogenicity Emulation-Optimized Heart Assist 5 VAD. J. Biomech. Eng. 2014, 136, 021014. [Google Scholar] [CrossRef]
- Meaney, E. Formula and nomogram for the sphygmomanometric calculation of the mean arterial pressure. Heart 2000, 84, 64. [Google Scholar] [CrossRef] [PubMed]
- Patel, S.R.; Jorde, U.P. Creating adequate pulsatility with a continuous flow left ventricular assist device. Curr. Opin. Cardiol. 2016, 31, 329–336. [Google Scholar] [CrossRef] [PubMed]
- Rangasamy, S.; Madan, S.; Saeed, O.; Goldstein, D.J.; Jorde, U.P.; Negassa, A.; Patel, S.R. Noninvasive Measures of Pulsatility and Blood Pressure During Continuous-Flow Left Ventricular Assist Device Support. ASAIO J. 2019, 65, 241–246. [Google Scholar] [CrossRef] [PubMed]
- Gupta, S.; Muthiah, K.; Woldendorp, K.; Robson, D.; Jansz, P.; Hayward, C.S. Derivation of indices of left ventricular contractility in the setting of continuous-flow left ventricular assist device support. Artif. Organs 2014, 38, 1029–1034. [Google Scholar] [CrossRef] [PubMed]
- Yokoyama, Y.; Kawaguchi, O.; Kitao, T.; Kimura, T.; Steinseifer, U.; Takatani, S. Prediction of the external work of the native heart from the dynamic H-Q curves of the rotary blood pumps during left heart bypass. Artif. Organs 2010, 34, 766–777. [Google Scholar] [CrossRef]
- Pugovkin, A.A.; Markov, A.G.; Selishchev, S.V.; Korn, L.; Walter, M.; Leonhardt, S.; Bockeria, L.A.; Bockeria, O.L.; Telyshev, D.V. Advances in Hemodynamic Analysis in Cardiovascular Diseases Investigation of Energetic Characteristics of Adult and Pediatric Sputnik Left Ventricular Assist Devices during Mock Circulation Support. Cardiol. Res. Pract. 2019, 2019, 1–15. [Google Scholar] [CrossRef]
- Hetzer, R.; Müller, J.; Weng, Y.; Wallukat, G.; Spiegelsberger, S.; Loebe, M. Cardiac recovery in dilated cardiomyopathy by unloading with a left ventricular assist device. Ann. Thorac. Surg. 1999, 68, 742–749. [Google Scholar] [CrossRef]
- Burkhoff, D.; Klotz, S.; Mancini, D.M. LVAD-Induced Reverse Remodeling: Basic and Clinical Implications for Myocardial Recovery. J. Card. Fail. 2006, 12, 227–239. [Google Scholar] [CrossRef]
- Karantonis, D.M.; Lovell, N.H.; Ayre, P.J.; Mason, D.G.; Cloherty, S.L. Identification and Classification of Physiologically Significant Pumping States in an Implantable Rotary Blood Pump. Artif. Organs 2006, 30, 671–679. [Google Scholar] [CrossRef]
- Granegger, M.; Masetti, M.; Laohasurayodhin, R.; Schloeglhofer, T.; Zimpfer, D.; Schima, H.; Moscato, F. Continuous Monitoring of Aortic Valve Opening in Rotary Blood Pump Patients. IEEE Trans. Biomed. Eng. 2016, 63, 1201–1207. [Google Scholar] [CrossRef]
- Vollkron, M.; Schima, H.; Huber, L.; Benkowski, R.; Morello, G.; Wieselthaler, G. Development of a suction detection system for axial blood pumps. Artif. Organs 2004, 28, 709–716. [Google Scholar] [CrossRef]
- Karantonis, D.M.; Lim, E.; Mason, D.G.; Salamonsen, R.F.; Ayre, P.J.; Lovell, N.H. Noninvasive Activity-based Control of an Implantable Rotary Blood Pump: Comparative Software Simulation Study. Artif. Organs 2010, 34, E34–E45. [Google Scholar] [CrossRef]
- Meki, M.; Wang, Y.; Sethu, P.; Ghazal, M.; El-Baz, A.; Giridharan, G. A Sensorless Rotational Speed-Based Control System for Continuous Flow Left Ventricular Assist Devices. IEEE Trans. Biomed. Eng. 2020, 67, 1050–1060. [Google Scholar] [CrossRef] [PubMed]
- Ferrari, M.; Kruzliak, P.; Spiliopoulos, K. An insight into short- and long-term mechanical circulatory support systems. Clin. Res. Cardiol. 2014, 104, 95–111. [Google Scholar] [CrossRef]
- Giridharan, G.A.; Skliar, M. Physiological Control of Blood Pumps Using Intrinsic Pump Parameters: A Computer Simulation Study. Artif. Organs 2006, 30, 301–307. [Google Scholar] [CrossRef]
- Pennings, K.A.M.A.; Martina, J.R.; Rodermans, B.F.M.; Lahpor, J.R.; Van De Vosse, F.N.; De Mol, B.A.J.M.; Rutten, M.C.M. Pump flow estimation from pressure head and power uptake for the heartassist5, heartmate II, and heartware vads. ASAIO J. 2013, 59, 420–426. [Google Scholar] [CrossRef]
- Ayre, P.J.; Lovell, N.H.; Woodard, J.C. Non-invasive flow estimation in an implantable rotary blood pump: A study considering non-pulsatile and pulsatile flows. Physiol. Meas. 2003, 24, 179–189. [Google Scholar] [CrossRef] [PubMed]
- Malagutti, N.; Karantonis, D.M.; Cloherty, S.L.; Ayre, P.J.; Mason, D.G.; Salamonsen, R.F.; Lovell, N.H. Noninvasive Average Flow Estimation for an Implantable Rotary Blood Pump: A New Algorithm Incorporating the Role of Blood Viscosity. Artif. Organs 2007, 31, 45–52. [Google Scholar] [CrossRef]
- Wakisaka, Y.; Okuzono, Y.; Taenaka, Y.; Chikanari, K.; Masuzawa, T.; Takano, H. Establishment of flow estimation for an implantable centrifugal blood pump. ASAIO J. 1997, 43, M659–M662. [Google Scholar] [CrossRef] [PubMed]
- Boës, S.; Thamsen, B.; Haas, M.; Daners, M.S.; Meboldt, M.; Granegger, M. Hydraulic Characterization of Implantable Rotary Blood Pumps. IEEE Trans. Biomed. Eng. 2019, 66, 1618–1927. [Google Scholar] [CrossRef]
- Pauls, J.P.; Stevens, M.C.; Bartnikowski, N.; Fraser, J.F.; Gregory, S.D.; Tansley, G. Evaluation of Physiological Control Systems for Rotary Left Ventricular Assist Devices: An In-Vitro Study. Ann. Biomed. Eng. 2016, 44, 2377–2387. [Google Scholar] [CrossRef]
- Wu, Y. Adaptive Physiological Speed/Flow Control of Rotary Blood Pumps in Permanent Implantation Using Intrinsic Pump Parameters. ASAIO J. 2009, 55, 335–339. [Google Scholar] [CrossRef]
- Telyshev, D.; Denisov, M.; Pugovkin, A.; Selishchev, S.; Nesterenko, I. The Progress in the Novel Pediatric Rotary Blood Pump Sputnik Development. Artif. Organs 2018, 42, 432–443. [Google Scholar] [CrossRef] [PubMed]
- Telyshev, D.; Denisov, M.; Markov, A.; Fresiello, L.; Verbelen, T.; Selishchev, S. Energetics of blood flow in Fontan circulation under VAD support. Artif. Organs 2020, 44, 50–57. [Google Scholar] [CrossRef] [PubMed]
- Porfiryev, A.; Markov, A.; Galyastov, A.; Denisov, M.; Burdukova, O.; Gerasimenko, A.Y.; Telyshev, D. Fontan Hemodynamics Investigation via Modeling and Experimental Characterization of Idealized Pediatric Total Cavopulmonary Connection. Appl. Sci. 2020, 10, 6910. [Google Scholar] [CrossRef]
- Rubtsova, E.; Markov, A.; Selishchev, S.; Karimov, J.H.; Telyshev, D. Mathematical modeling of the Fontan blood circulation supported with pediatric ventricular assist device. Comput. Methods Biomech. Biomed. Eng. 2021, 1–10. [Google Scholar] [CrossRef]
- Nguyen, D.Q.; Thourani, V.H. Third-Generation Continuous Flow Left Ventricular Assist Devices. Innovations 2010, 5, 250–258. [Google Scholar] [CrossRef]
- Loree, H.M.; Bourque, K.; Gernes, D.B.; Scott Richardson, J.; Poirier, V.L.; Barletta, N.; Fleischli, A.; Foiera, G.; Gempp, T.M.; Schoeb, R.; et al. The HeartMate III: Design and in vivo studies of a Maglev centrifugal left ventricular assist device. Artif. Organs 2001, 25, 386–391. [Google Scholar] [CrossRef]
- Pagani, F.D. Continuous-Flow Rotary Left Ventricular Assist Devices with “3rd Generation” Design. Semin. Thorac. Cardiovasc. Surg. 2008, 20, 255–263. [Google Scholar] [CrossRef] [PubMed]
- Tansley, G.; Vidakovic, S.; Reizes, J. Fluid dynamic characteristics of the VentrAssist rotary blood pump. Artif. Organs 2000, 24, 483–487. [Google Scholar] [CrossRef]
- Telyshev, D.V. A Mathematical Model for Estimating Physiological Parameters of Blood Flow through Rotary Blood Pumps. Biomed. Eng. 2020, 54, 163–168. [Google Scholar] [CrossRef]
- Masuzawa, T.; Osa, M.; Mapley, M. Motor design and impeller suspension. In Mechanical Circulatory and Respiratory Support; Gregory, S.D., Stevens, M.C., Fraser, J.F., Eds.; Academic Press: London, UK, 2018; pp. 335–377. ISBN 9780128104910. [Google Scholar]
- Boës, S. Hydraulic Characteristics and Flow-Field Related Hemocompatibility of Rotary Blood Pump Designs; ETH Zurich: Zürich, Switzerland, 2018. [Google Scholar]
- Smith, P.A.; Wang, Y.; Groß-Hardt, S.; Graefe, R. Hydraulic design. In Mechanical Crculatory and Respiratory Support; Gregory, S.D., Stevens, M.C., Fraser, J.F., Eds.; Academic Press: London, UK, 2018; pp. 301–334. ISBN 978-0-12-810491-0. [Google Scholar]
- Selishchev, S.V.; Telyshev, D.V. Optimisation of the sputnik-VAD design. Int. J. Artif. Organs 2016, 39, 407–414. [Google Scholar] [CrossRef] [PubMed]
- Selishchev, S.V.; Telyshev, D.V. Ventricular assist device sputnik: Description, technical features and characteristics. Trends Biomater. Artif. Organs 2015, 29, 207–210. [Google Scholar]
- Gautier, S.V.; Shevchenko, A.O.; Itkin, G.P.; Zakharevich, V.M.; Poptsov, V.N.; Drobyshev, A.A.; Telyshev, D.V. Artificial heart in Russia: Past, present, and future. Artif. Organs 2020, 53, aor.13860. [Google Scholar]
Publisher’s Note: MDPI stays neutral with regard to jurisdictional claims in published maps and institutional affiliations. |
© 2021 by the authors. Licensee MDPI, Basel, Switzerland. This article is an open access article distributed under the terms and conditions of the Creative Commons Attribution (CC BY) license (https://creativecommons.org/licenses/by/4.0/).