Next Article in Journal
A Hybrid Metaheuristics Parameter Tuning Approach for Scheduling through Racing and Case-Based Reasoning
Next Article in Special Issue
Safe Local Aerial Manipulation for the Installation of Devices on Power Lines: AERIAL-CORE First Year Results and Designs
Previous Article in Journal
Identifying the Primary Odor Perception Descriptors by Multi-Output Linear Regression Models
Previous Article in Special Issue
Development of Add-On Planar Translational Driving System for Aerial Manipulation with Multirotor Platform
 
 
Correction published on 12 January 2023, see Appl. Sci. 2023, 13(2), 1030.
Article

Mathematical Considerations for Unmanned Aerial Vehicle Navigation in the Magnetic Field of Two Parallel Transmission Lines

Faculty of Electrical Engineering and Computing, University of Zagreb, 10000 Zagreb, Croatia
*
Author to whom correspondence should be addressed.
Appl. Sci. 2021, 11(8), 3323; https://doi.org/10.3390/app11083323
Submission received: 9 March 2021 / Revised: 1 April 2021 / Accepted: 2 April 2021 / Published: 7 April 2021 / Corrected: 12 January 2023
(This article belongs to the Special Issue Aerial Robotics for Inspection and Maintenance)

Abstract

:
This publication deals with the navigation of unmanned aerial vehicles (UAVs) moving in the magnetic field of two long, straight, parallel conductors, which is of high interest for several new technical applications. How the position and orientation of the UAV can be calculated using a minimal number of only three three-axis magnetometers are discussed. It is shown that the angles can be determined without the knowledge of the conductor currents and the magnetic field equations, but only by combining the sensor measurements with the rotation matrix and exploiting a characteristic property of the magnetic field. Furthermore, different strategies were investigated to determine the respective sensor positions. An analytical solution was derived from the nonlinear magnetic field equations, which promises a low computational time. It is shown that for a given sensor, several solutions exist, from which the correct one has to be selected. Therefore, a specific detection method is introduced. Once the solution is known, the UAV location can be determined. Finally, the overall algorithm was tested by simulations far from and near the conductors with superimposed typical magnetic noise.

1. Introduction

Magnetic field-based navigation is an old discipline that had its beginnings in the 20th Century [1]. Magnetic fields have several advantages over other physical quantities. For example, unlike electromagnetic waves, they are not subject to multipath effects or fading because they do not reflect off surfaces. This allows for much higher accuracy. In addition, they are not attenuated when passing through magnetically neutral materials, making magnetic field-based navigation ideal for use between obstacles, at night, or in difficult weather conditions such as snow or fog. A large number of publications exist dealing with techniques for object navigation and localization. Depending on the application, they all use one or more distributed magnetic field sources that emit an alternating magnetic signal. This is usually sampled and measured by several sensors, which may be from different technologies. By combining these measurement data with the mathematical model of the source used, the position and orientation of the observed object are then determined. This can be divided into four different types of sources.
The first type is a simple rectangular or circular coil that typically has a large number of turns. It represents the basic element for the construction of more complex coil types and is often referred to as a dipole, since above a minimum distance from the winding, its magnetic field distribution can be described by the equations of a magnetic dipole. In various research projects [2,3,4,5,6], such as MILPS (magnetic indoor local positioning system), multiple coils mounted on walls are used to locate cell phones and robots in buildings or patients in hospitals. Other use cases include the navigation of medical instruments inside the human body [7] or the localization of an implantable transponder for intensity-modulated radiation therapy [8]. In addition, several projects have investigated how these coils can be used to locate trapped persons as quickly as possible [9,10,11,12]. These could be buried miners or avalanche victims, who can be found by the emitted signal from a small coil worn close to the body. Another interesting topic is the detection of buried landmines in old war zones, also known as humanitarian demining [13,14]. This involves the use of hand-held coils such as metal detectors. Finally, a new application has emerged with the advent of the electric vehicle age.
In the context of inductive charging, the receiver coil mounted on the underbody of the car must be positioned relatively precisely above the transmitter coil in the parking lot, as shown in Figure 1. Since this is very difficult for the driver to achieve, the MPPS (magnetic pulse positioning system) was developed in [15]. Here, the transmitting coil in the ground emits a low-frequency pulsed magnetic signal that allows precise localization by the vehicle in the sub-centimeter range.
The next two coil types consist of two or three base coils wound orthogonally to each other. An example of a three-axis magnetic field source is shown in Figure 2.
For two-axis sources, the coils carry phase quadrature currents that produce a rotating magnetic dipole [1,16,17]. Together with phase detection algorithms and amplitude evaluation, the object position and also the orientation can be determined. For three-axis sources, all source axes are successively excited with currents of the same frequency and phase. In this way, each axis generates an equivalent dipole of arbitrary orientation [18,19,20]. The three sensor responses are linearly independent and provide sufficient information to determine both the sensor position and its orientation.
The last type of source to be mentioned is a long wire with an alternating signal. In [21,22,23], its magnetic field was used to allow an underwater vehicle to locate and track a buried underwater cable.
Until now, however, no attention has been paid to magnetic sources consisting of two long parallel conductors. They enable many new useful engineering applications, especially when it comes to the realization of unmanned aerial vehicles (UAVs). For example, UAVs could autonomously perform inventory in warehouses. For this purpose, parallel guides can be attached to the floor or ceiling for navigation between shelves. In addition, UAVs could provide an inspection of rail systems efficiently when a current flows through them. Another interesting topic is the autonomous performance of inspection and assembly work around power line systems. This is exactly what was investigated in the Aerial-Core (https://aerial-core.eu/, accessed on 06.04.2021) project. One of the goals of the project was to develop a technology that will enable a UAV to perform (Figure 3) the placement of distance separators between power lines.
This is usually performed by workers who are exposed to very high electric and magnetic fields. Moreover, such a task requires a highly skilled helicopter pilot to keep the helicopter close to the power lines while a worker performs the installation. Therefore, the main objective of this work is to derive the equations for determining the position and orientation of a UAV moving through the magnetic field of two parallel conductors, thus enabling precise navigation of a UAV in close proximity to the power lines. We assumed that a UAV is equipped with visual and other sensors that are used both for navigating farther away from the lines and for approaching the lines.

2. Orientation and Localization Equations

2.1. System Overview

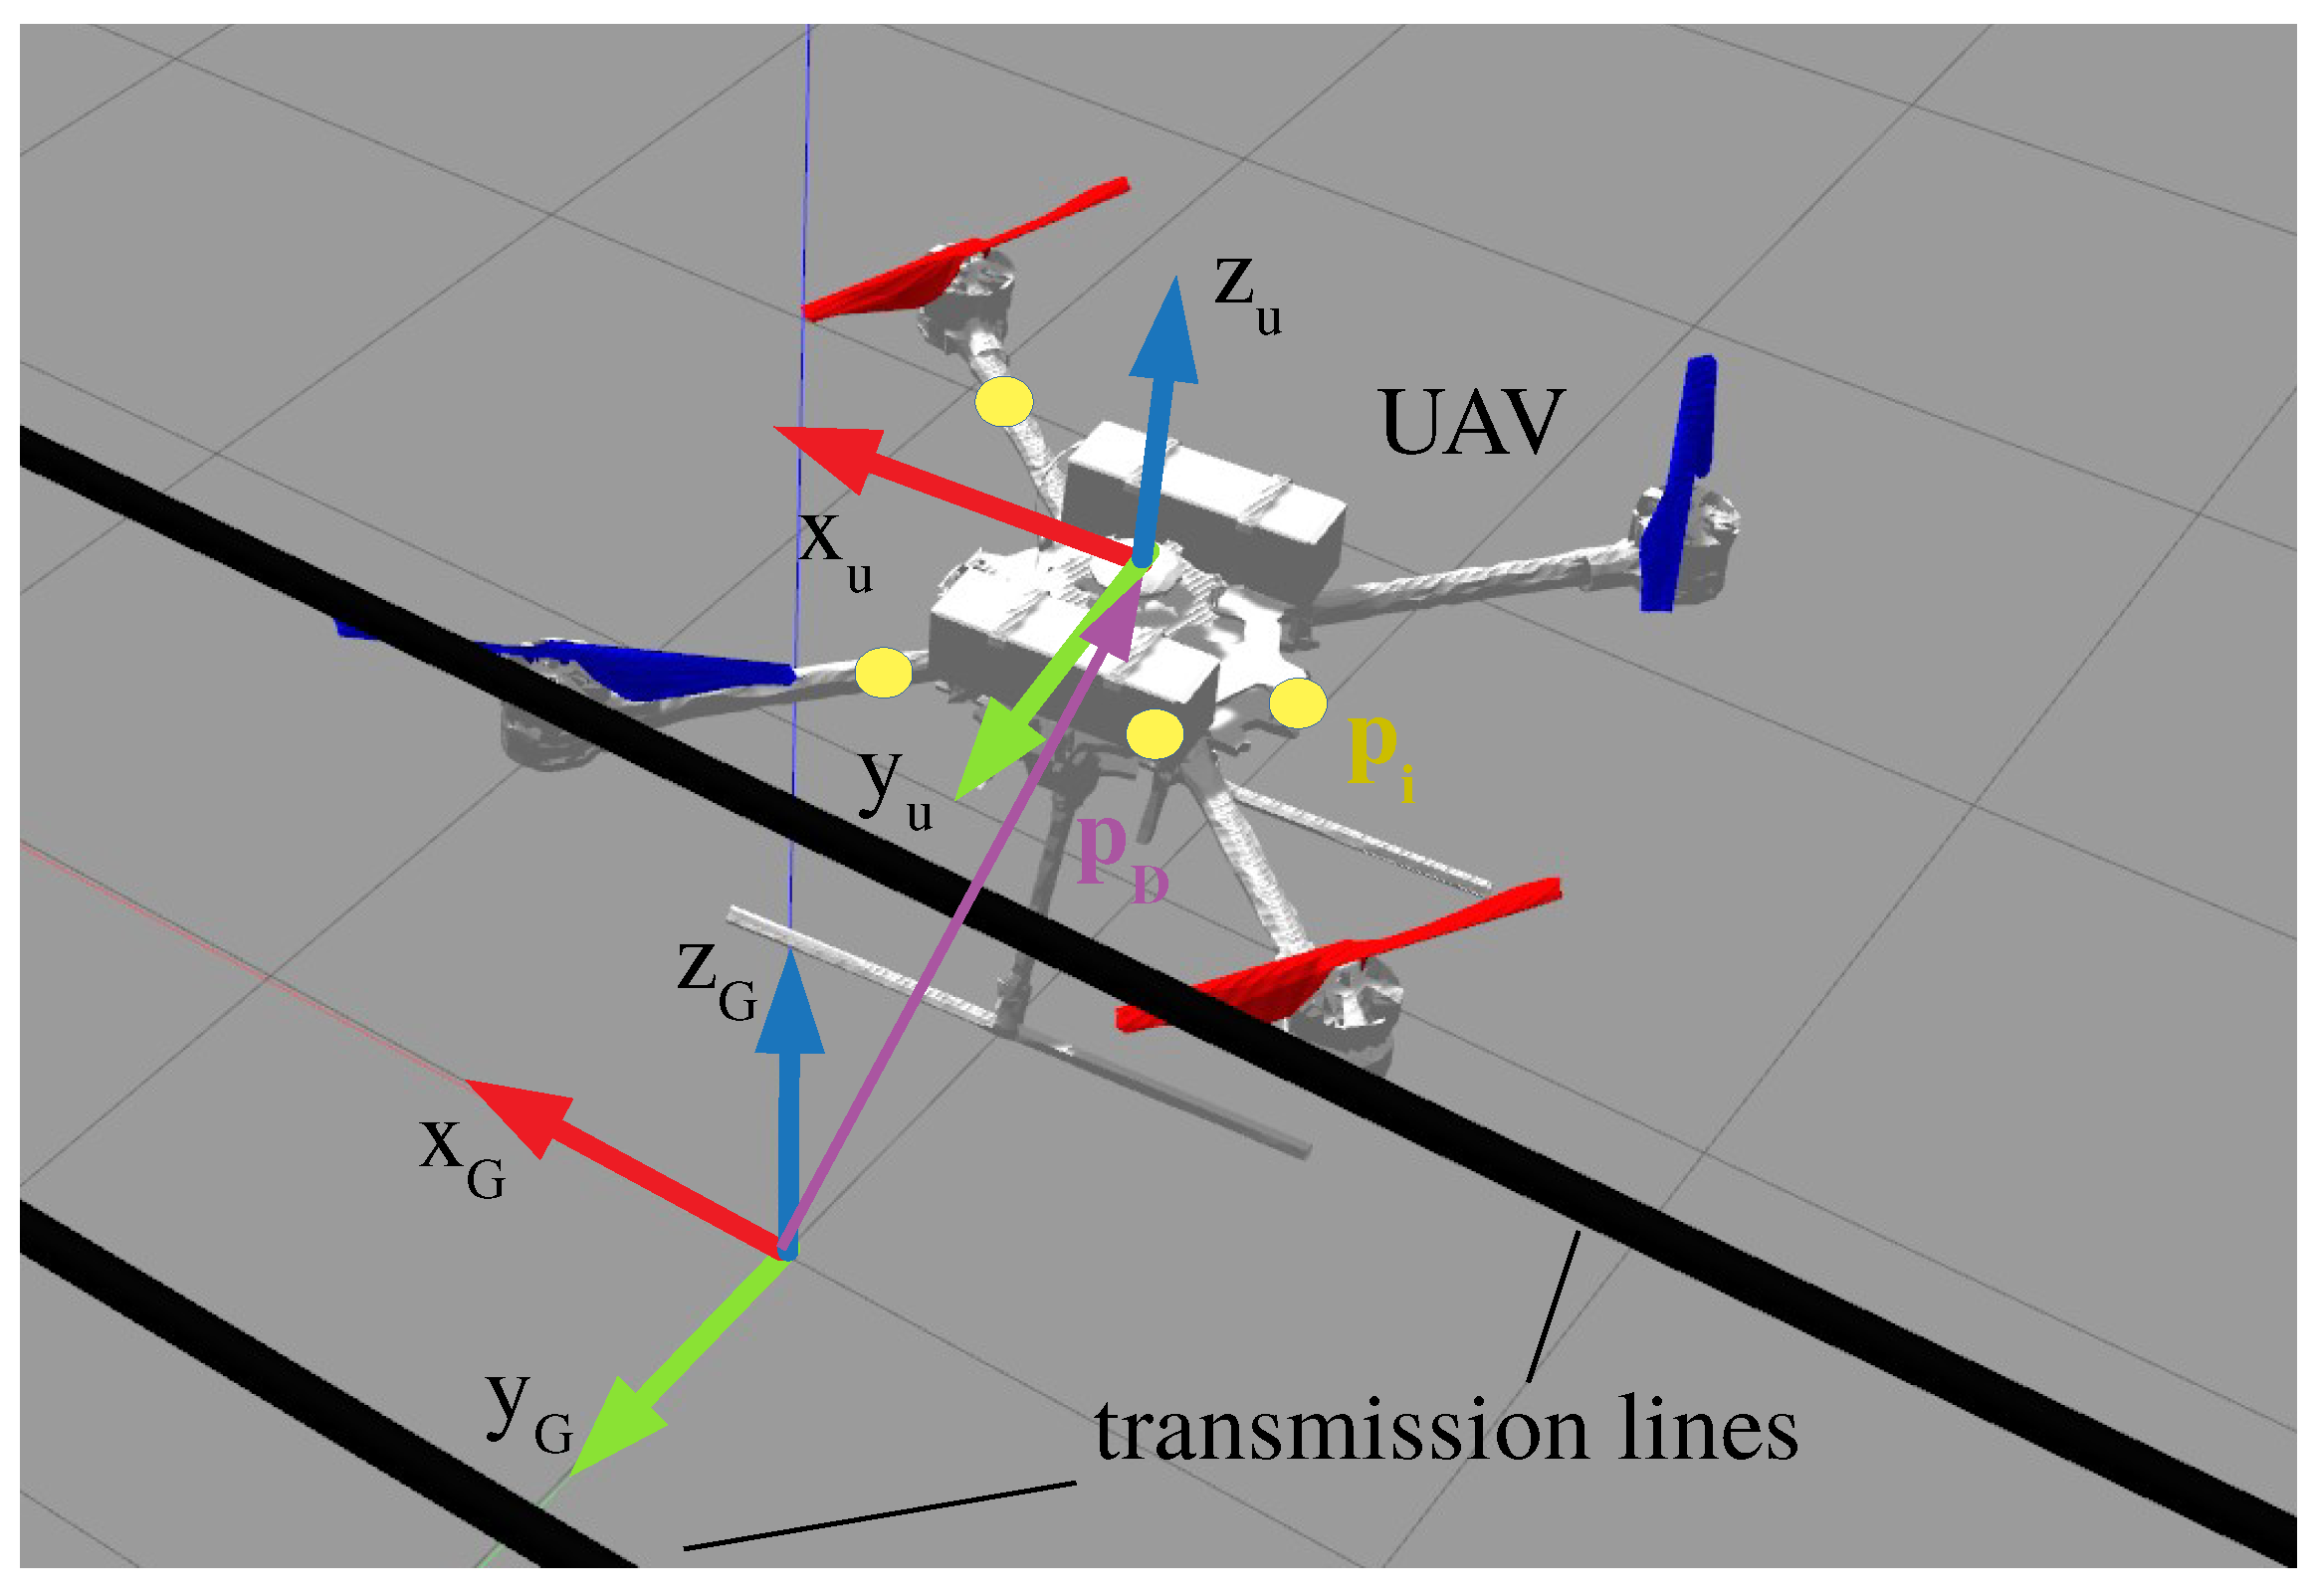
Figure 4 shows two parallel lines, which together form one phase of a three-phase power transmission system and a UAV flying in close proximity. The transmission lines lie in the x y -plane of the global coordinate frame { G } positioned exactly between the lines. For the purpose of sensing the magnetic field of the transmission lines, there are magnetometers mounted on the UAV, which are marked with yellow points.
The transmission lines of a single phase carry sinusoidal currents of fixed frequency and phase, which can be used to our advantage. They generate an alternating magnetic field, which allows static and low-frequency magnetic interference fields such as the Earth’s field to be canceled out. This is realized by a differential measurement of the amplitude of the magnetic signal. The calculation can be implemented in the time domain and is very efficient [24]. In addition, the system can be treated as a static field problem with constant currents. For simplicity, they are chosen as I in the following. The magnetic field thus generated can be calculated using the law of Biot–Savart for thin conductors. In general, transmission lines are not thin. However, as the distance from the lines increases, the magnetic flux density distribution approaches that of thin conductors relatively quickly:
B ( r ) = μ 0 4 π I ( r r ) × d s | r r | 3 .
The integration is executed only along the cables according to the arrangement in Figure 4, i.e., d s = ( d x , 0 , 0 ) T . Thus, from the cross-product in Equation (1), it immediately follows that:
B x = 0 , ( x , y , z ) T ,
which means that there is no field component in the direction parallel to the cables. Solving the integral for one cable and using the superposition principle, the remaining field components B y and B z can be determined. The total magnetic field equation with the transmission lines at ± y 0 is then:
B ( y , z ) = C 0 z z 2 + ( y + y 0 ) 2 + z z 2 + ( y y 0 ) 2 y + y 0 z 2 + ( y + y 0 ) 2 + y y 0 z 2 + ( y y 0 ) 2 , w i t h C = I μ 0 2 π ,
where C is a prefactor depending on the transmission line current.
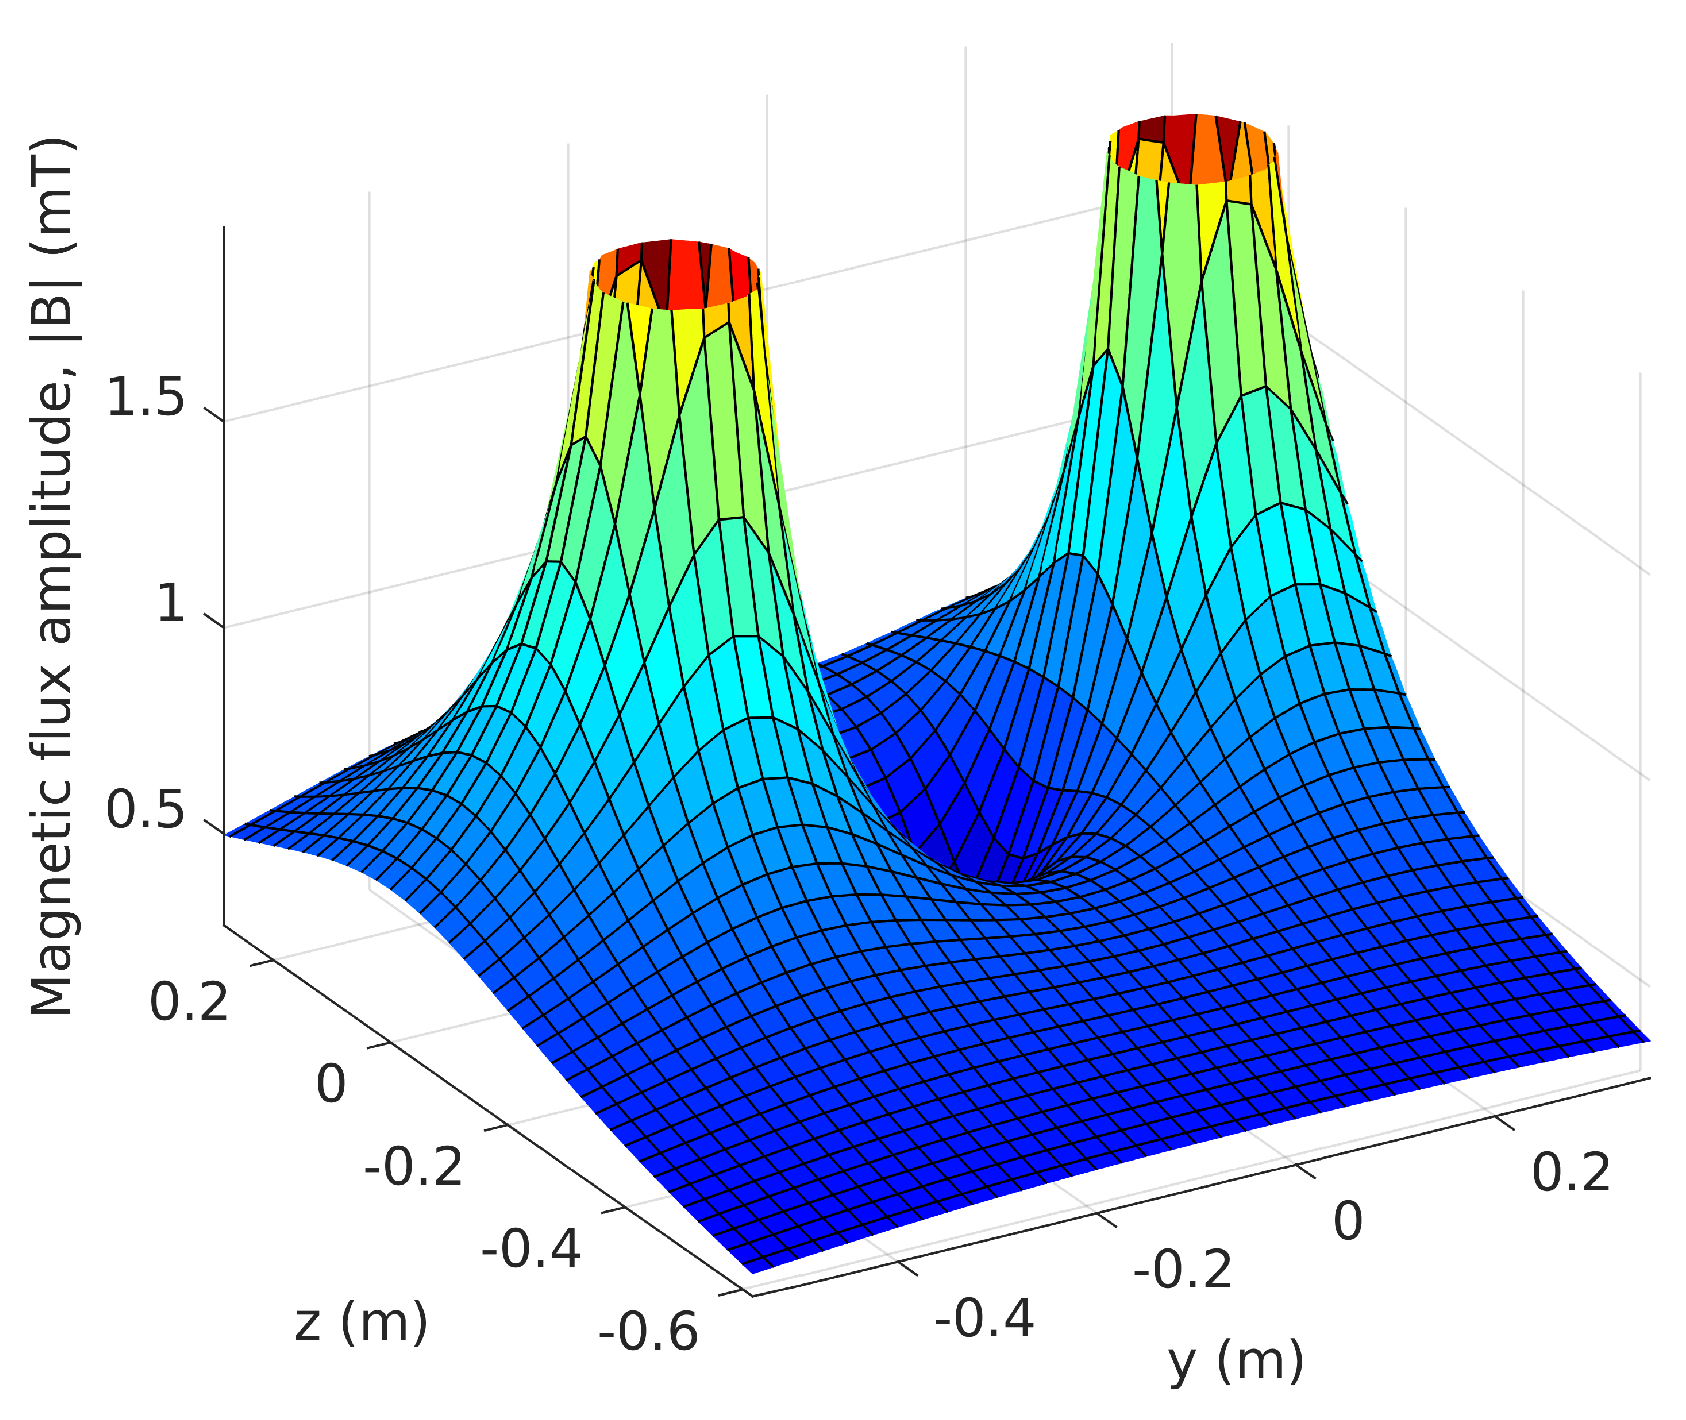
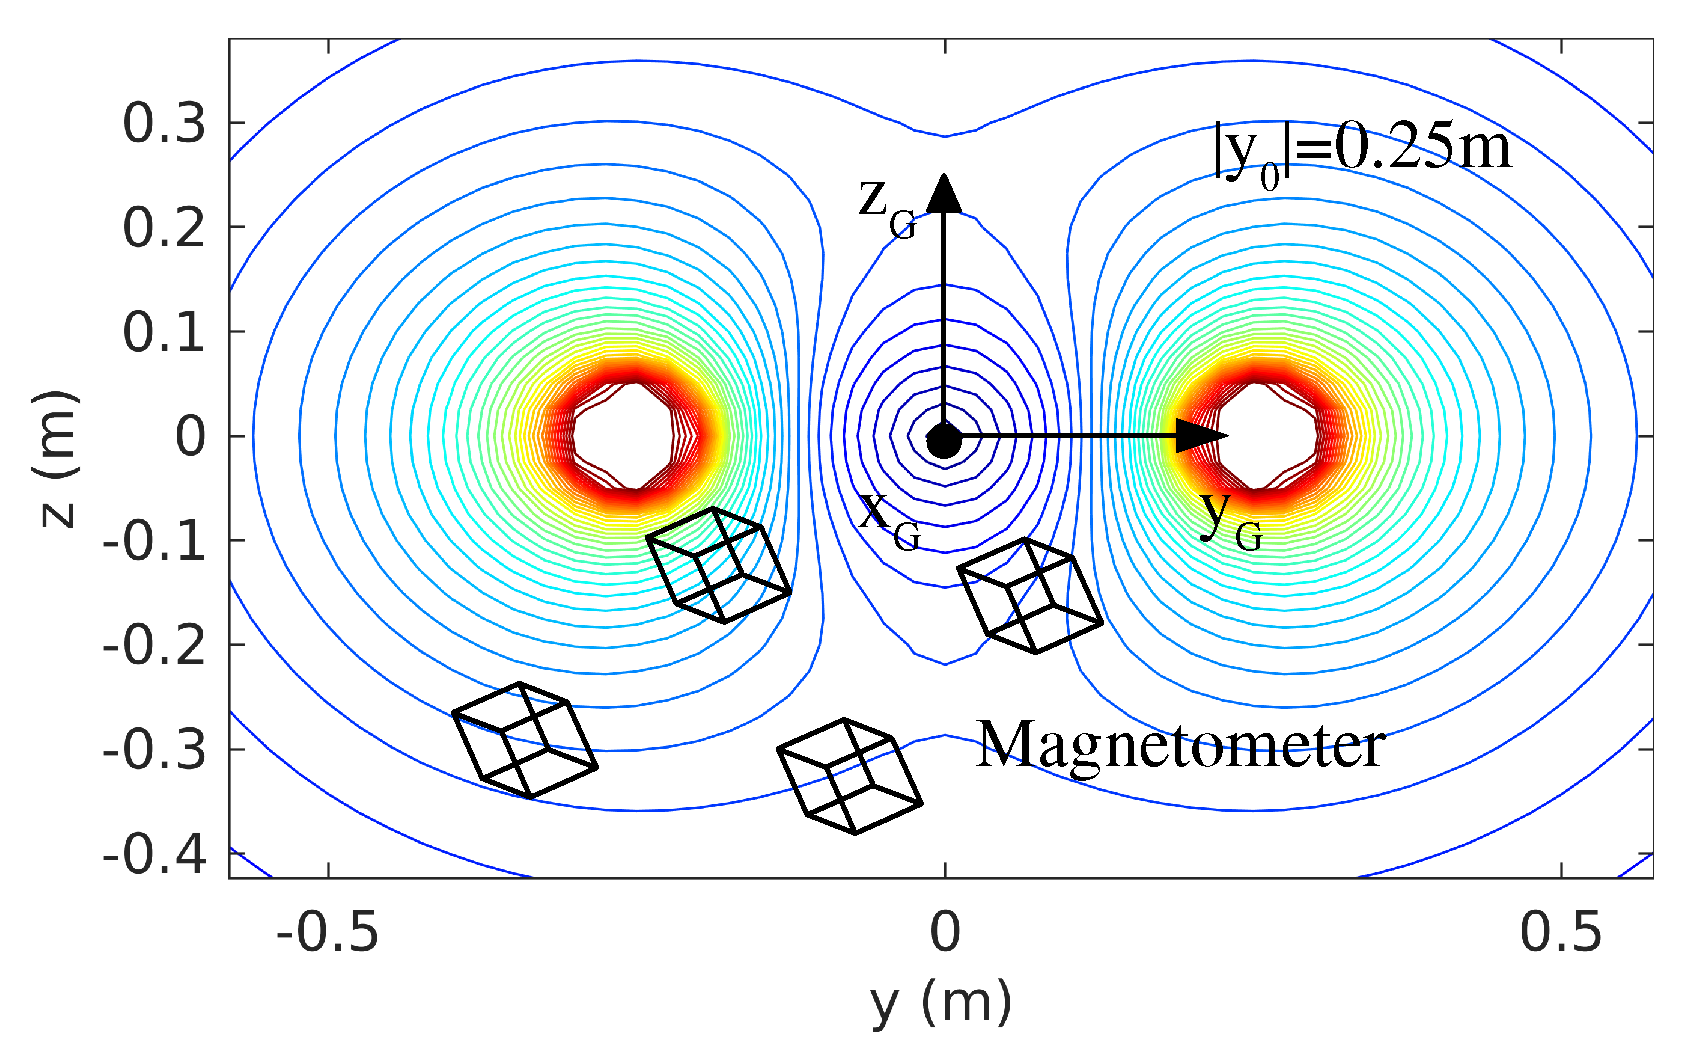
Figure 5 shows the signal amplitude | B ( y , z ) | around the transmission lines for I = 700 A and y 0 = 0.25 m. Figure 6 shows the locations of equal amplitude in the y z -plane expressed by isolines. The magnetic field contributions of the other two phases are neglected because the cables are typically at least 2 m apart.
The magnetic field-based navigation of a UAV requires that the UAV can sense the magnetic field in all spatial directions. It uses this information to determine its relative position and orientation with respect to the fixed position and orientation of the global coordinate frame { G } . The flight capabilities allow the UAV to achieve an arbitrary orientation by rotating the UAV’s body about the z- (blue), y- (green), and x-axes (red) of the local drone frame L u for the respective yaw, pitch, and roll angles α , β , and γ . The origin position of the local frame L u in { G } , denoted by p D , also represents the position of the UAV to be determined. The sensors have predefined positions p i 0 in L u , where the index i refers to a particular sensor. Moreover, each magnetometer has its own local coordinate frame L i . Then, their respective positions p i = ( x i , y i , z i ) T in { G } can be expressed using the rotation matrix R G L u ( α , β , γ ) = R x ( γ ) R y ( β ) R z ( α ) :
p i = R G L u ( α , β , γ ) p i 0 + p D ,
R z ( α ) = c α s α 0 s α c α 0 0 0 1 , R y ( β ) = c β 0 s β 0 1 0 s β 0 c β , R x ( γ ) = 1 0 0 0 c γ s γ 0 s γ c γ .
where s x and c x are abbreviations for s i n x and c o s x needed in the following. From Equation (3), it can be seen that the position of the UAV along the cables (x-direction) cannot be determined because the magnetic field does not provide sufficient information. Thus, only the projections of the magnetometers and the UAV frame origin in the y z -plane can be computed. The representation of the magnetic field v i measured by the i-th sensor at position p i expressed in { G } then becomes:
B ( p i ) = R G L u ( α , β , γ ) R L u L i v i ,
where R L u L i is the user-defined orientation of L i in the UAV body frame L u and R G L u is the orientation of L u in the global frame { G } . If L i is aligned with { G } , then it is R G L u R L u L i = I , where I is the identity matrix. In this case, the sensor measures exactly the magnetic field given by Equation (3), i.e., B ( p i ) = v i . The system of three equations in (5) establishes a relationship between the sensor measurement, sensor position, and UAV orientation. It is nonlinear and has five unknowns ( y i , z i , α , β , γ ) T , which are determined in the following sections.

2.2. Orientation Determination

In this section, the UAV angles α , β , and γ are derived. As will be shown below, the calculation is possible without knowledge of the field equation and the transmission line current. Three magnetometers were considered. For the following analysis, their corresponding equations were set up in matrix notation, where 0 3 × 3 is a 3 × 3 zero matrix:
B ( p 1 ) B ( p 2 ) B ( p 3 ) = R G L u R L u L 1 0 3 × 3 0 3 × 3 0 3 × 3 R G L u R L u L 2 0 3 × 3 0 3 × 3 0 3 × 3 R G L u R L u L 3 v 1 v 2 v 3 .
It is obvious that this system of equations is solvable since the rank of the matrix is nine, which is equal to the number of unknowns. In general, in addition to the three angles, each row provides two unknowns y i and z i . Now, the UAV’s yaw and pitch angles can be calculated directly from the two sensor measurements v l and v n and the zero field property (2). With this and the Cartesian unit vector e x , it follows from Equation (6) that:
0 = ( R G L u R L u L i v i ) · e x , i = l , n .
Obviously, this equation does not depend on the sensor positions or the choice of their local frames. Thus, they can be located anywhere on the UAV and have any local frame. However, to avoid additional transformations or computational effort, the sensor frames are aligned with the UAV body frame. Then, the equation system (7) becomes:
0 = c β c α v l x + c β s α v l y s β v l z 0 = c β c α v n x + c β s α v n y s β v n z
After division by c β and subsequent subtraction, t a n β can be eliminated. Solving the remaining equation for α leads to:
α = a t a n v l z v n x v l x v n z v l y v n z v l z v n y = a t a n ( v l × v n ) · e y ( v l × v n ) · e x
and further with A = t a n α to:
β = a t a n v n x + v n y A v n z A 2 + 1 = a t a n v l x + v l y A v l z A 2 + 1 .
Following the same approach to calculate the roll angle γ by using the zero field property does not lead to any result, since the analytic equation obtained is linearly dependent. The state of the art now is that the roll angle cannot be calculated analytically. On the one hand, it can be calculated numerically using Equation (5), which leads to a very complicated system of equations since it now additionally contains the sensor location, which is unknown. On the other hand, the roll angle can be measured by additional sensors, e.g., by an inertial measurement unit (IMU), which is present in almost all UAVs. In this case, the yaw and pitch angles calculated by Equations (9) and (10) can be used as correction information, since the IMU provides all three angles. For the following considerations in connection with the UAV position calculation, all three angles are assumed to be known, either through calculation or measurement.

2.3. Position Determination

In the previous section, it was shown that the UAV orientation and position computation can be decoupled into two independent problems. In doing so, it was shown how the UAV orientation can be computed using the zero field property and without knowledge of the transmission line currents or the magnetic field equation. This section now deals with the computation of the respective sensor positions p i , which are needed to finally determine the UAV position p D via Equation (4).
With the decoupling presented, the complexity of the equation system (6) can be greatly reduced, since by knowing the angles, the right side can be computed and becomes a simple real-numbered vector. With R G L u R L u L i v i = V i , the system becomes:
B ( p 1 ) B ( p 2 ) B ( p 3 ) = V 1 V 2 V 3 .
Obviously, the computation of the respective sensor positions is also decoupled. Thus, to obtain p D , it is sufficient to solve one of these rows in (11). Then, for a sensor i, the corresponding row is:
B ( p i ) = B y ( y i , z i ) B z ( y i , z i ) = V i y V i z = V i ,
which represents a system of two equations. The components B y and B z describe the magnetic field in two dimensions in { G } and were obtained by calculating the Biot–Savart integral (1). This means, on the one hand, that the two equations in (12) are linearly independent and theoretically allow the determination of the unknowns y i and z i . On the other hand, the equations are nonlinear, and the question arises whether it is possible to solve (12) analytically and, if so, how. In this context, there are several approaches, all of which were investigated in the context of this work. Since the following considerations are equally valid for all sensors, the subscript i is omitted for simplicity.
The first row in (12) can be solved for one coordinate y or z, which is then inserted into the second row to compute the other coordinate; and the same in reverse. However, solving B y = V y for z or B z = V z for y in the general form leads to extremely large solutions z ( y , V y ) and y ( z , V z ) , which contain root terms with eighth-order polynomials as arguments. The other two cases, i.e., solving B y = V y for y or B z = V z for z, lead to smaller solutions. For example, from the latter, the four solutions for z follow:
z ( y , V z ) = ± ± D ( y 2 , y ) + a ( y 2 , y ) , w i t h D = 1 V z 4 V z 2 y 2 y 0 2 4 C V z y y 0 2 + C 2 y 2 , a = y 0 2 y 2 + C y V z .
The result y ( z , V y ) has the same structure, but is not used, as the easiest final equation can be found by inserting (13) into B y 2 ( y , z ) = V y 2 . With D from (13), it becomes:
V z ( C y ± D ) 2 ( V z y 0 2 V z y 2 + C y ± D ) y 2 ( 2 V z y 0 2 + C y ± D ) 2 = V y 2 .
The equation can in principle be solved for y. However, no suitable substitution could be found, so that the root terms disappear, and at the same time, a polynomial of a smaller order than five is obtained. For example, after the substitution with E = C y ± D , unwanted y 2 expressions still remain in the equation. The square roots can also be eliminated by subsequent isolation and squaring. However, this leads to a high-order polynomial. In summary, it is difficult to impossible to derive an analytical solution only from the equation system (12). In this context, the idea is to consider the signal power as an additional equation. As will be shown in the next steps, its combination with (12) leads to a compact analytical solution, which is derived below: At a given position, the signal power can be calculated by taking the dot product of the corresponding sensor response V with itself. This must be equal to the dot product of B ( y , z ) with itself, leading to the following equation:
V · V = | V | 2 = B ( y , z ) · B ( y , z ) | V | 2 = 4 C 2 ( z 2 + y 2 ) z 4 + y 4 + ( 2 y 0 2 + 2 y 2 ) z 2 + y 0 4 2 y 2 y 0 2 .
The most simple equation is found by solving the formula for z 2 and inserting it into B z ( y , z ) = V z . For this, the two solutions for z 2 are obtained with P = | V | :
z 2 ( y , P ) = ± 2 y 2 y 0 2 C 2 y 0 2 P 2 + C 4 P 4 y 0 2 y 2 + 2 C 2 P 2 .
Next, with the positive solution of (16), the equation B z ( y , z 2 ( y , P ) ) = V z can be written as:
P 4 y y 0 2 + D ^ P 2 y + C 2 P 2 y C P 2 y 0 2 + 2 C D ^ + 2 C 3 = V z , w i t h D ^ = ( P 4 y 2 C 2 P 2 ) y 0 2 + C 4 .
Further, D ^ is isolated and squared, which leads to:
D ^ 2 = ( ( P 4 y C P 2 V z ) y 0 2 C 2 P 2 y + 2 C 3 V z ) 2 ( P 2 y 2 C V z ) 2 .
This eliminates the square root of D ^ . After re-substituting and transforming the equation, the position calculation is reduced to a root-finding problem of a fourth-order polynomial,
n = 0 4 a n y n = 0 , a 4 = P 8 y 0 2 , a 3 = 4 C P 6 V z y 0 2 , a 2 = P 8 y 0 4 + C 2 P 6 y 0 2 + 4 C 2 P 4 V z 2 y 0 2 , a 1 = 2 C P 6 V z y 0 4 2 C 3 P 4 V z y 0 2 , a 0 = C 2 P 4 V z 2 y 0 4 .
The general analytic root expressions of such a polynomial are extremely large. Therefore, it is important to make Equation (3) as simple as possible by placing the global coordinate frame exactly halfway between the transmission lines. In addition, the lines should be placed in the x y -plane parallel to the x-axis. Then, with the coefficients a n given in (17), the four large expressions for y are greatly reduced and become:
y = ± P 4 y 0 2 + 2 C 2 V z V z 2 P 2 + 2 C 2 V z 2 C 2 P 2 2 P 2 ± P 4 y 0 2 2 C 2 V z V z 2 P 2 + 2 C 2 V z 2 C 2 P 2 2 P 2 + C V z P 2 = S 2 P 2 + C V z P 2
where S represents the two square root addends. The same result is obtained for the negative solution of Equation (16). Now, in the next step, four different cases can be distinguished, all of which lead to a certain class of solutions.
(I) V y , V z 0 :
Theorem 1.
Two of the y-solutions in (18) can immediately be excluded, because they are complex.
Proof. 
V z | V | = P , V R 3 V z 2 P 2 C . With this, the above square root addends represented by S can be written as:
S = ± a + j b ± a j b , a = P 4 y 0 2 + ( 2 V z 2 P 2 ) C 2 , b = 2 C 2 V z P 2 V z 2 .
Next, the parameters r and φ are introduced as:
r = a 2 + b 2 , φ = t a n 1 b a + π .
Now, if the addends have a different sign S, this results in:
S = ± a + j b a j b = ± r e j φ 2 r e j φ 2 = ± 2 j r 1 2 j ( e j φ 2 e j φ 2 ) = ± 2 j r s i n φ 2 ,
whereby the e-expressions are obtained using Euler’s formula. □
Applying this procedure for the case of the same sign, the real-numbered and more compact expressions for y can be derived. Therefore, in a first step, S is determined:
S = ± a + j b ± a j b = ± r e j φ 2 ± r e j φ 2 = ± 2 r 1 2 ( e j φ 2 + e j φ 2 ) = ± 2 r c o s φ 2 .
The square root addends in Equation (18) represented by S can now be replaced by this result, leading to:
y 1 , 2 = S 2 P 2 + C V z P 2 = 1 P 2 ± r c o s φ 2 + C V z ,
with r and φ according to (20).
Theorem 2.
There exist two solutions | y 1 | | y 2 | . One each is in y < 0 and y > 0 , respectively.
Proof. 
The hypothesis is true if the absolute value of the square root addends in Equation (18) is always greater than C | V z | P 2 .
| ± ( a + j b + a j b ) | 2 P 2 > C | V z | P 2 | ( a + j b + a j b ) | 2 > ( 2 C | V z | ) 2 q l = a + j b a j b > 2 C 2 V z 2 a = q r .
Further, with a , b from (19), it follows for the left and right side:
q l = P 8 y 0 4 + ( 4 C 2 P 4 V z 2 2 C 2 P 6 ) y 0 2 + C 4 P 4 , q r = P 8 y 0 4 2 C 2 P 6 y 0 2 + C 4 P 4 , q l q r = 4 C 2 P 4 V z 2 y 0 2 > 0 .
(II) V y = 0 P = | V z | : In this case, the excluded complex solutions must also be considered, since they become real. Both give the same result y 3 . The two real solutions y 1 , 2 can again be obtained from (21) or from the general Equation (18).
y 1 , 2 = 1 V z 2 ( ± V z 4 y 0 2 + C 2 V z 2 + C V z ) , y 3 = C V z
| y 1 | | y 2 | | y 3 | . One of the solutions lies in the opposite half plane.
(III) V z = 0 P = | V y | : The solutions are obtained analogous to Case (II). | y 1 | = | y 2 | .
y 1 , 2 = ± V y 4 y 0 2 C 2 V y 2 V y 2 , y 3 = 0
(IV) V y = V z = 0 : If this case occurs, the sensor lies exactly in the origin of the global frame.
Once the corresponding y is determined, in a final step, z can be calculated from Equation (16):
z = ± ± 2 ( y 2 C 2 P 2 ) y 0 2 + C 4 P 4 y 0 2 y 2 + 2 C 2 P 2 ,
offering four possible z-solutions, all of which can be real-numbered. There are also situations where, for a given y, a subset of the z-solutions in (24) can become complex. Therefore, their use must be treated with caution, especially when the formulas are implemented on a microcontroller of a real UAV. A safer way is to check the arguments of the square roots. The argument of the outer square root can be written as:
A o = ± g + h , h = y 0 2 y 2 + 2 C 2 P 2 ,
where g is the inner square root expression. For all solutions y 1 , 2 , 3 obtained, g 0 holds, since they were obtained using the z 2 -expression (16). Thus, the argument of the inner square root does not need to be checked. In contrast, A o can become negative in general and should be checked to satisfy that the condition A o > 0 is fulfilled before applying the square root.

2.4. Selecting the Right Solution

Equation (24) yields four z-solutions for each y-solution of Cases (I)–(IV). Thus, depending on the case, there are up to twelve possible positions in the y z -plane for a given sensor. For navigation, it is necessary to know which of these points is the correct one. Finding it is the task of this subsection.
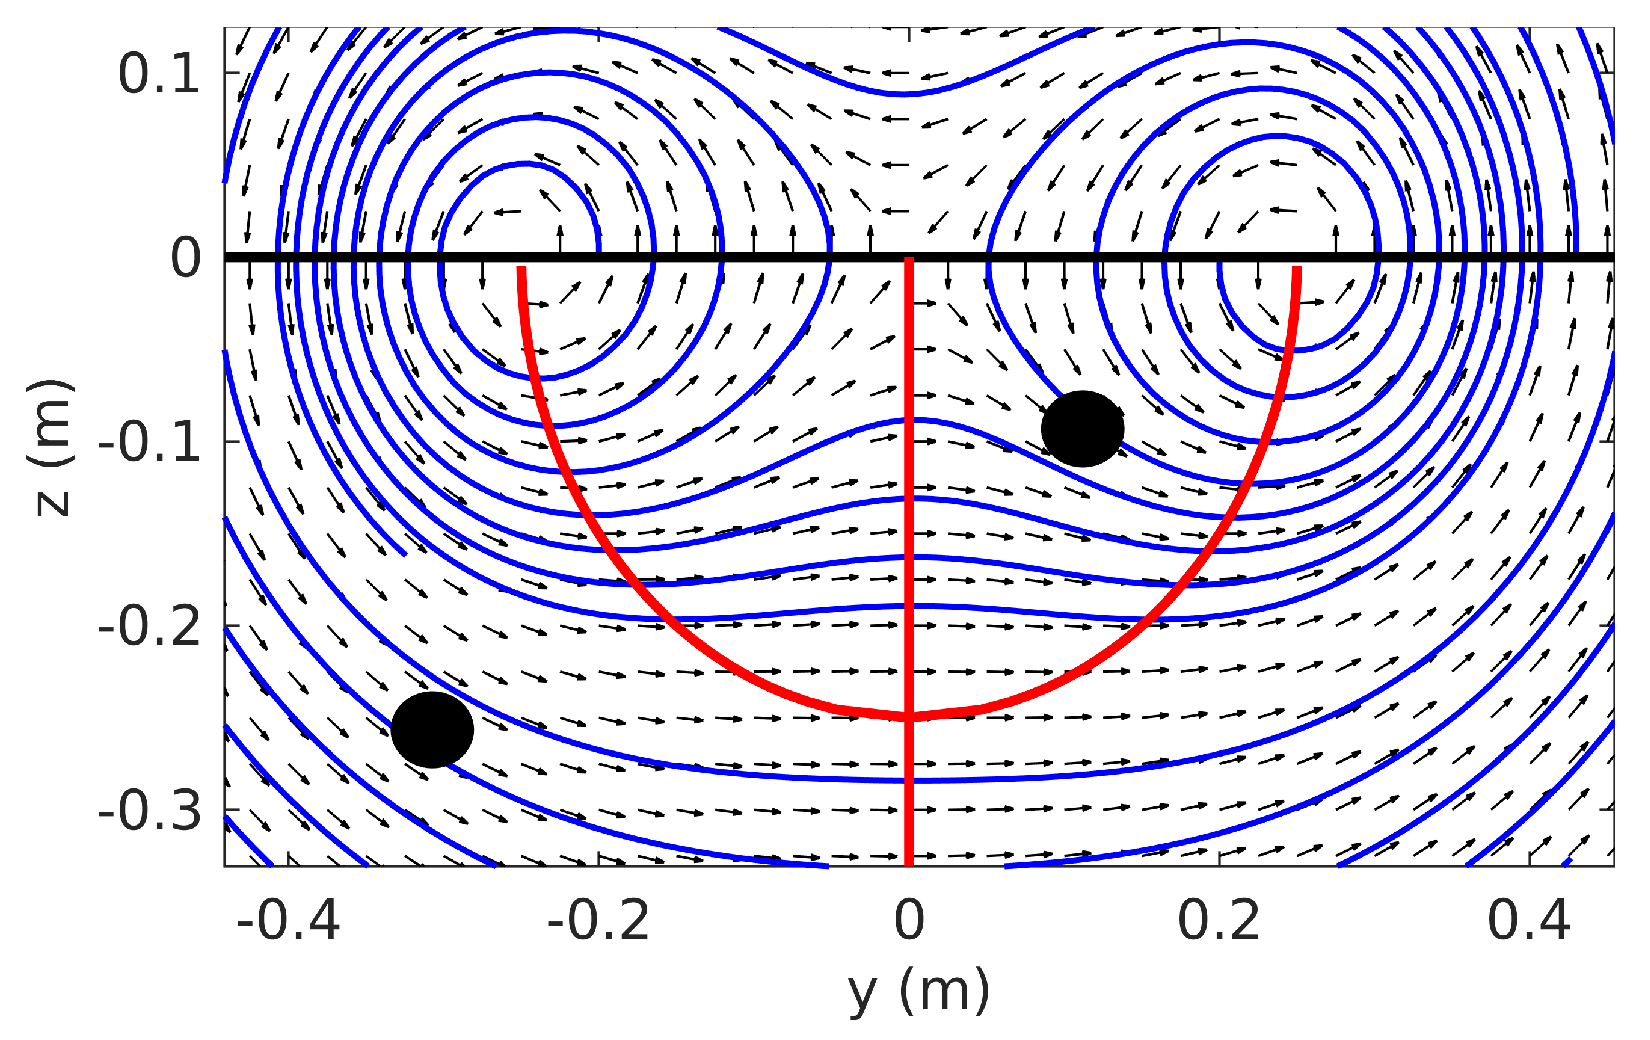
Now, in the first approach, the number of possible positions can be narrowed down by excluding Cases (II)–(IV). The reason for this is that they can only occur in very few locations and for a very short time during navigation, which extremely reduces their probability of occurrence. For example, the solutions of Case (II) all lie on the z-axis. In Case (III), one solution lies on the y-axis and the other two lie on a circle with a diameter equal to the distance between the transmission lines, i.e., 2 y 0 . This can be shown by computing the radius y 1 , 2 2 + | z 2 ( y 1 , 2 ) | , where y 1 , 2 comes from Equation (23) and z 2 comes from (16). The case with the lowest probability of occurrence is Case (IV), where the sensor is located directly at the origin. The locations of Cases (II)–(IV) are summarized in Figure 7 and shown as black and red lines. Since they are not relevant for navigation and only increase the implementation effort, they can be ignored. Thus, since only Case (I) is considered, eight possible positions for a single sensor remain, from which the correct one must still be selected.
In the next steps, it will be seen that six can be excluded. To do this, some constraints must be met. As explained in Section 2.1, the sinusoidal transmission line current can be considered as an equivalent constant current I, i.e., it never changes its direction. Furthermore, the UAV orientation must not exceed the definition range D from Section 2.2 with α , β , γ D = [ π 2 , π 2 ] . This would otherwise lead to ambiguities due to the symmetry of the magnetic field. The details concerning ambiguities are the subject of Section 3. Now, the idea is to investigate which of the eight remaining positions lead to a match with the sensor measurement V , i.e., which positions satisfy Equation (12).
Theorem 3.
Given a sensor k that measures V k = ( V k y , V k z ) T and has two y-solutions according to (21) in Case (I), for each of the two values, there are four associated z-solutions according to Equation (24). However, for each y, there is only one z-solution that leads to a match with V k , i.e., there are only two possible locations in the y z -plane where the sensor can lie.
Proof. 
Let y k be one of the two y-solutions. Then, it generates the four z-solutions, which in simplified notation are z n = ± ± g + h , g , h 0 . z n has two outer and two inner signs. Further, the B z -component in Equation (3) has a z 2 -addend in the nominator as the only z-dependency, so it can be written as B z ( y k , z 2 ) . Now, if for z l = ± g + h , it follows that:
B z ( y k , z l 2 ) = B z ( y k , g + h ) = V k z ,
then with g + h g + h :
V k z = B z ( y k , g + h ) B z ( y k , g + h ) ,
because B z ( y k , z 2 ) is strictly monotonous. This means, that only one of the inner signs of z n leads to a match with V k z . This fact is independent of the outer sign. Once the inner sign is known, similarly, the B y -component in Equation (3) can be analyzed. Therefore, let z m 2 = g + h lead to a match with V k z . Now, if B y ( y k , z m ) = V k y , then B y ( y k , z m ) is:
C ( z m ) z m 2 + ( y k + y 0 ) 2 + ( z m ) z m 2 + ( y k y 0 ) 2 = V k y .
As shown in the last step, only one of the outer signs of z n can be the correct one, leading to a match with V k y . □
In summary, there are only two possible locations for a single sensor so that Equation (12) is satisfied. With the constraints defined above, another fact follows from the proof. It is needed for the consideration of the ambiguities in Section 3.
Corollary 1.
The sign of V y of the sensor response V with respect to the global frame { G } depends only on the half plane z > 0 or z < 0 in which the sensor is located.
Consequently, both solutions are always in the same half plane. By Theorem 2, one lies in y < 0 and the other in y > 0 . An example is given in Figure 7, which shows the solutions as bold dots.
Since both points must be in areas with the same direction of the magnetic field lines to satisfy Equation (12), one is outside the circle and one is inside. Of the two remaining sensor positions that match V , one must still be excluded. By considering only a single sensor, it is impossible to determine the correct one. However, in the following, multiple sensors are considered instead, which provide much more information through which a whole set of correct sensor positions can be selected.
The idea is as follows. On the one hand, the user-defined positions p i 0 of N sensors form an original polygon in the y z -plane of the UAV frame L u . It has a fixed geometric structure S u like a fingerprint. On the other hand, the two positions p i 1 , 2 computed for each sensor can now be combined into 2 N polygons in the global frame { G } . Finally, the one that matches the structure S u is selected. Therefore, before comparison, each polygon must be transformed back to L u using Equation (4). However, this is not possible since the UAV position p D must already be known for this. One way around this problem is to choose a different reference point. For example, all polygons are shifted so that their upper left corner appears in the origin of { G } before comparison. What is important here is that the original polygon is first transformed to { G } . Its new geometric structure S G can be computed using the known UAV orientation and p i 0 via Equation (4) with p D = 0 . Then, its upper left corner is moved to the origin. The other polygons obtained from the sensor measurements are already representations with respect to { G } , so their upper left corner only needs to be shifted to the origin. The shift is allowed since it does not affect the polygon geometry. Finally, the comparison can be done using the least- squares estimation. Here, the deviation of the corresponding polygon nodes is squared and added up. The polygon with the smallest sum best fits S G and is selected. From each of its nodes, the UAV position p D can then finally be computed using Equation (4). It is recommended to place the sensors in the y z -plane of L u so that they span an area as large as possible. This allows for better polygon detection, since during the aerial manipulation, the roll and pitch angle of the UAV will typically have a rather small misalignment with respect to the global frame { G } . The polygon detection method proposed here was successfully tested. The implementation details and test results are presented in Section 4.

3. Ambiguities

3.1. Ambiguities Due to Field Symmetry

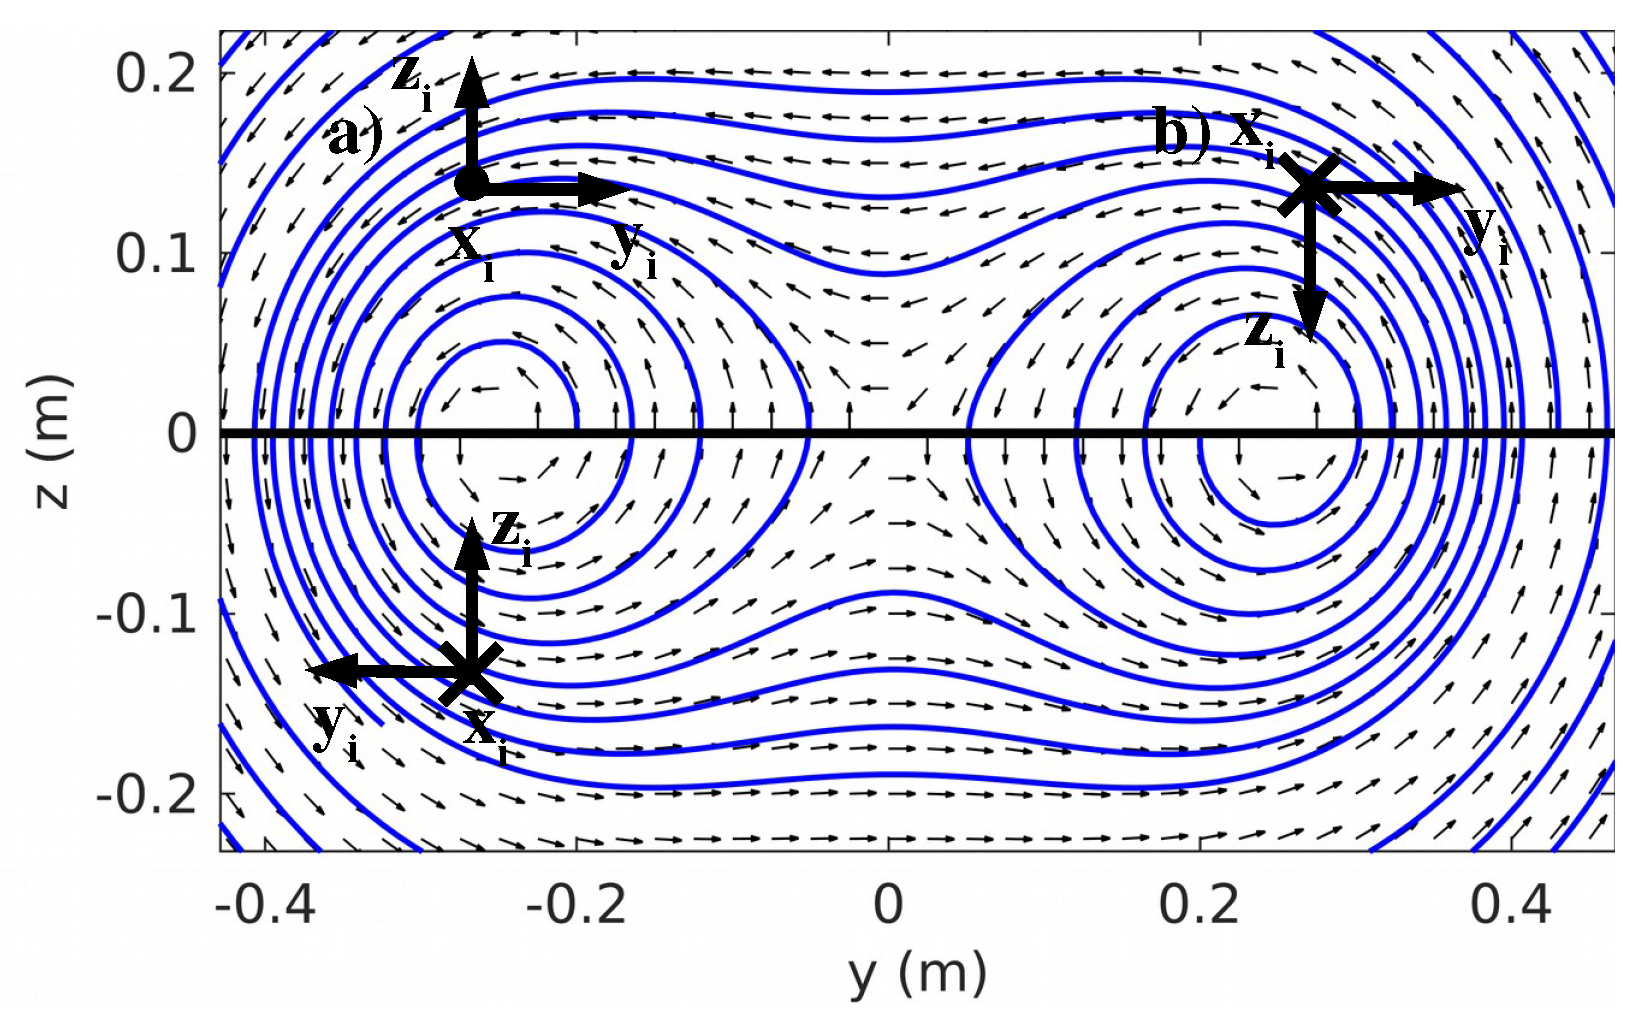
An ambiguity exists if all of the UAV’s sensors show the same output in at least two different locations. Under the condition of equivalent static transmission line current, several cases can be identified, which are shown in Figure 8.
In the lower left, the real position of the local frame L i of the i-th sensor is shown. The UAV can now change its flight direction and additionally be above the transmission line in Case (a). The sensor output would be the same. In Case (b), the whole UAV is rotated by angle π around the x-axis. Here, since the magnetic field is mapped to itself, the sensor will again measure the same. In this case, the UAV is flying on its back.

3.2. Ambiguities Due to Signal Symmetry

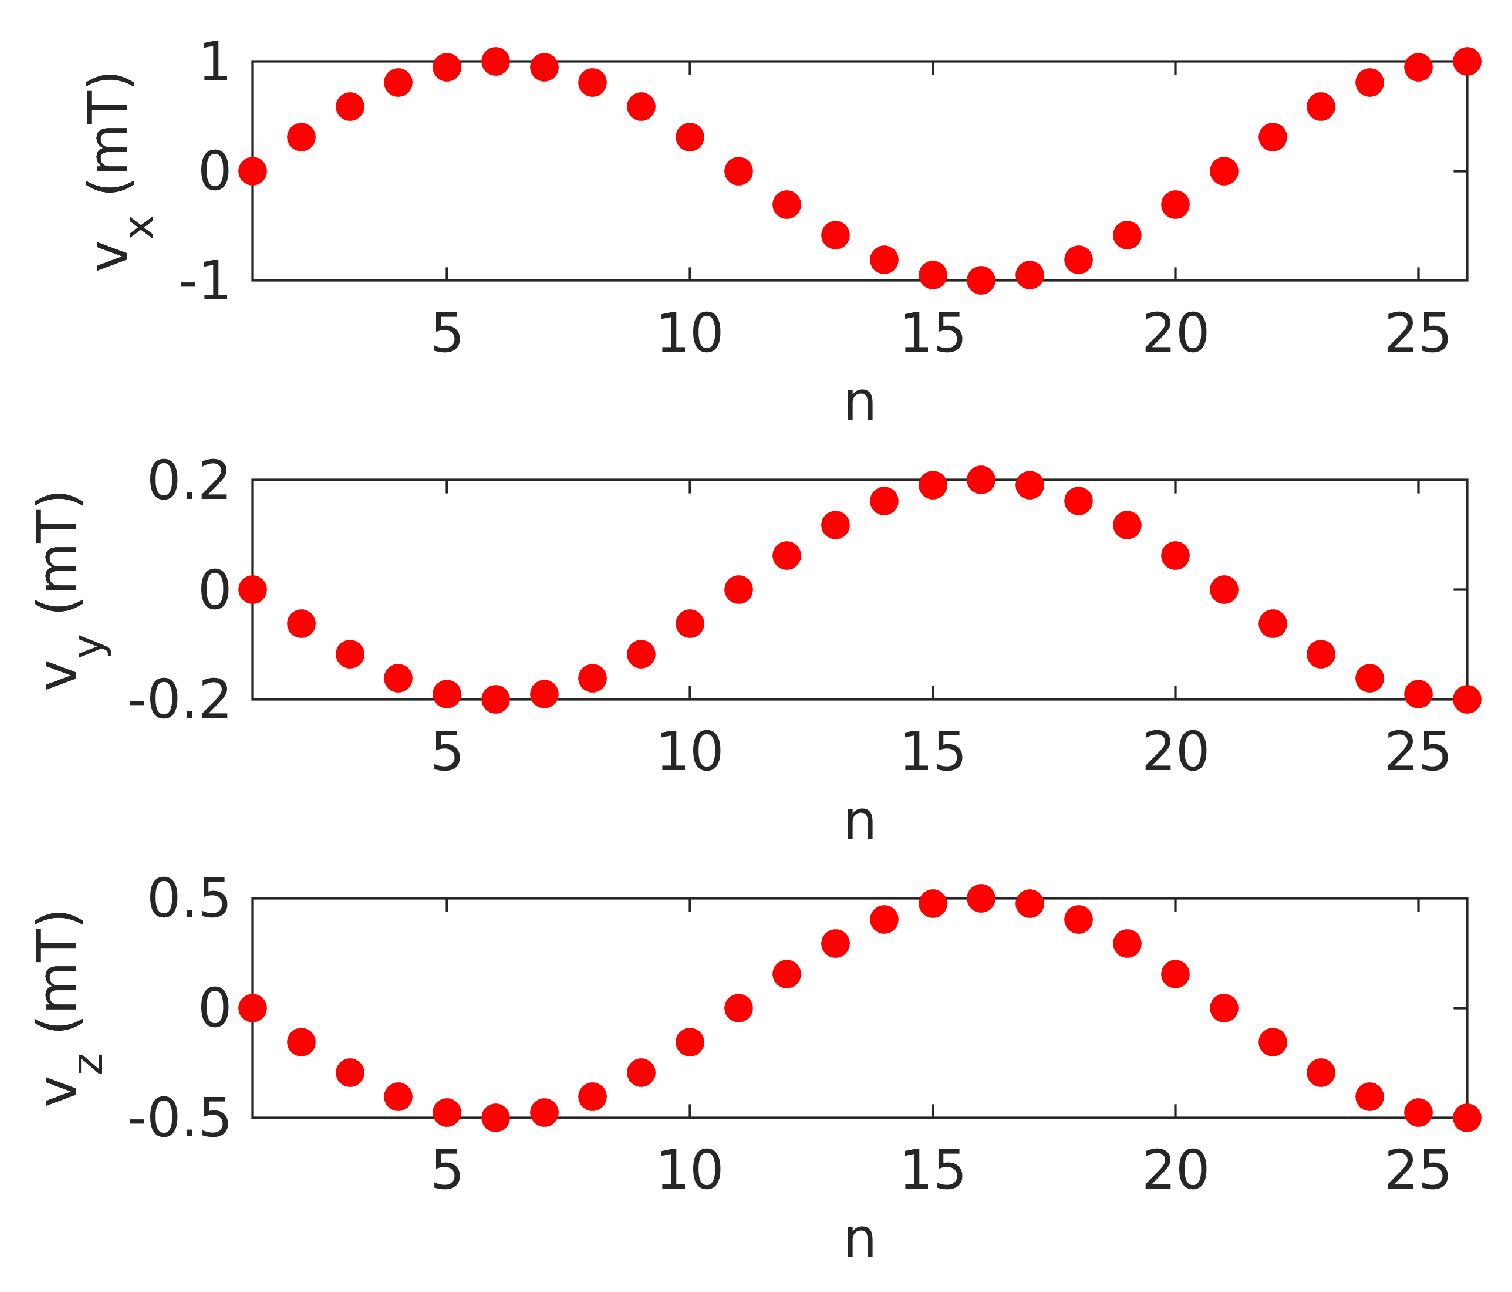
As introduced in Section 2.1, transmission lines carry an alternating current. In addition to improved filtering capabilities, this also introduces a number of ambiguities in navigation, as shown below. The magnitude and sign of the three field components measured by a three-axis magnetometer can be determined in the time domain from the samples. For this purpose, a method was proposed in [24], which is beyond the scope of the present paper. It is taken as given for the following considerations. For example, a sensor with the sample values depicted in Figure 9 would yield the measured value v = ( 1 m T , 200 μ T , 500 μ T ) T .
However, a half period later, the signals in Figure 9 appear shifted, and the signs of the individual field components change; i.e., the sensor now measures v . Since technically, only signal amplitudes are used, it is as if the equivalent static current I changes its direction every half period. A direct consequence of this fact follows from Corollary 1. Under the defined constraints in Section 2.4, it allows detecting whether the UAV is flying under or above the transmission lines, since the sign of the measured y-components V i y in the global frame depends only on which half plane z > 0 or z < 0 the sensors are located. However, since the direction of I changes cyclically, this is no longer possible without additional detection methods, since V i y also changes sign. Such a detection could be realized, for example, by comparing the signal energy of several sensors. This could exploit the fact that the closer the sensor is to the cables, the higher the energy is. However, this is beyond the scope of this paper. The fact that it is impossible to uniquely determine the sensor position can even be seen directly from Equation (21). It contains the prefactor C, which, as shown in (13), depends on the current; thus, it can be C > 0 or C < 0 , leading to different solutions. Furthermore, the whole approach proposed in Theorem 3 to narrow down the solutions no longer works.

3.3. Resolving the Ambiguities

If no additional electronic means are to be used, the ambiguities can be resolved as suggested in [15], where an electric vehicle approaches the inductive charging coil of a parking lot. In the case of using only two magnetometers, it never knows whether the coil is in front or behind it. The vehicle therefore assumes that the coil is always in front of it or that the driver is always moving ahead of the parking space. In the same way, concrete constraints for the navigation of a UAV must be defined and passed to it as a priori knowledge. These are:
  • The equivalent static current I always flows away from the UAV towards that end of the transmission line to which the UAV is looking; i.e., I > 0 C > 0 .
  • During the navigation, the UAV always remains under the transmission lines, i.e., in z < 0 .
  • The UAV angles never exceed the definition range D, so that α , β , γ D = [ π 2 , π 2 ] . This means that the UAV never makes large turns and never flies on its back.
Furthermore, a selection criterion for the measured values must be established. This is because, as mentioned earlier, the sign of the measurement v i of the sensor i changes with each half period. It must now be decided which is the correct one. The selection criterion can be derived from the above constraints. With C > 0 and z < 0 from Conditions (1) and (2), it follows from the right-hand rule that the magnetic field always has a positive y-component, i.e., B y ( y , z ) > 0 . This can also be shown directly with Equation (3). Moreover, according to Theorem 3, this circumstance never changes as long as the UAV remains in the half plane z < 0 and as long as Constraint (3) is not broken. Using Equation (5) and the Cartesian unit vector e y leads to the necessary selection criterion:
( R v i ) · e y > 0 .
If v i does not satisfy (27), v i does, and vice versa. Only one sign can be a match. Direct comparison of the signs of v i y and B y ( y i , z i ) is not allowed, since from B y ( y i , z i ) > 0 , v i y > 0 does not necessarily follow. The last point to be clarified is the orientation of the UAV. Since the rotation matrix in (27) is used, it must be ensured that the angles can be computed independently of the direction of I.
Theorem 4.
Given two sensors i and k with equally aligned local frames and fixed locations p i p k , as long as their measurement values v i and v k are obtained from the same signal period, the yaw angle α and pitch angle β are independent of the direction of the static current I.
Proof. 
Referenced to the same time interval containing a whole signal period, the sensors measure v i , v k 0 . Half a signal period later, when both measurements are calculated from the same new time interval and the sensors have not moved, the sign of the measurements is reversed. Then, the cross-product in Equation (9) for the yaw angle becomes v i × v k . Now, by applying the rule ( r a ) × b = a × ( r b ) = r ( a × b ) , it follows that:
v i × v k = ( 1 ) 2 ( v i × v k ) = v i × v k .
Since the direction of the static current obviously has no effect on the cross-product, the result for the yaw angle also remains unchanged. Flipping the signs of the field components in Equation (10) for the pitch angle leads to:
v k x v k y A v k z A 2 + 1 = v k x + v k y A v k z A 2 + 1 , A = t a n α .
The direction of the static current obviously also has no influence on the pitch angle. □
In summary, the sign of I does not affect the orientation as long as the measurements are referenced to the same time interval of the corresponding signal.

4. Simulation Results

In this section, the presented equations for determining the UAV position and orientation are tested in the context of a software-in-the-loop (SIL) simulation.

4.1. SIL Design and Test Procedure

The SIL simulation was implemented in MATLAB and cyclically ran through a specified flight trajectory created with the Gazebo tool. Each waypoint of the trajectory is represented by a vector ( y D , z D , α ^ , β ^ , γ ^ ) T , which describes the position and orientation of the local UAV frame L u with respect to the global frame { G } . From this, the SIL computes the positions of the virtual sensors i and the corresponding magnetic measurements v i with respect to the local sensor frame L i in each run. For this purpose, Equations (4) and (5) were used, where the rotation matrix was used according to the convention in Gazebo, i.e., R G L u ^ = R z T α ^ R y T β ^ R x T γ ^ . This corresponds to the transposed version of the definition used in this paper, i.e., R ^ G L U = ( R G L u ) T . In order for the angles α , β , and γ obtained in the test run to be compared later with the Gazebo angles α ^ , β ^ , and γ ^ , they must first be converted at the end of each run. This is done automatically by the SIL. To calculate the measured values v i , the SIL assumes that there is a transmission line system with the arrangement described in Section 2.1; i.e., the cables are in the x y -plane at y 0 and y 0 . The SIL then passes the computed v i as the input values to the test procedure, which verifies the entire method described in this publication. The test procedure uses the constraints defined in Section 3.3 for navigation as a priori knowledge. It is called cyclically from the SIL until all waypoints on the flight trajectory have been passed and is divided into the following steps:
  • Select the correct sign for the measurement values v i according to the selection criterion (27) (the SIL skips this step because it always calculates with the equivalent static current).
  • Calculate the UAV angles using Equations (9) and (10) for all possible sensor combinations and calculate the average. The results are α ¯ and β ¯ . The roll angle γ ¯ cannot be calculated and is assumed to be zero.
  • Filter out the outliers by applying the moving median filter to the last 10 calculated values of each angle.
  • Calculate the measurement values V i referred to the global frame { G } via
    V i = R G L u ( α ¯ , β ¯ , γ ¯ ) R L u L i v i from Equation (6). Calculate the signal powers P i = | V i | .
  • Calculate the y-coordinates y i 1 and y i 2 using Equation (21).
  • Select the correct signs in Equation (24) using Theorem 3 in order to reduce the amount of possible z-solutions and calculate the z-coordinates z i 1 and z i 2 .
  • Calculate the nodes p i , e of the original polygon referred to { G } . They are calculated from the user-defined sensor positions p i 0 in L u and the orientation of the UAV in { G } , i.e., p i , e = R G L u ( α ¯ , β ¯ , γ ¯ ) p i 0 . Shift the resulting polygon so that its upper left corner appears in the origin of { G } .
  • Calculate from the determined sensor positions p i 1 , 2 all possible polygons and shift them so that their upper left corner appears in the origin of { G } . The nodes of the k-th polygon are represented by p i , k .
  • Compare all polygons with the original one. Therefore, first calculate the sum U k of the least-squared errors of the corresponding polygon nodes with:
    U k = i = 1 N ( p i , e p i , k ) T ( p i , e p i , k ) ,
    where N is the number of nodes, respectively sensors. Choose the polygons of the two smallest sums. Finally, choose one out of these two whose perimeter most closely matches that of the original polygon.
  • Calculate the UAV position from the found polygon for each node using Equation (4), i.e.,
    p D , i = p i , k R G L u ( α ¯ , β ¯ , γ ¯ ) p i 0 .
    Take the average of all p D , i as the UAV position p D .
  • Filter out the outliers by applying the moving median filter to the last 10 calculated positions.
  • Convert the angles to Gazebo angles.
If the entire trajectory has been run through by the SIL, the specified and actual position are output graphically. The same goes for the angles. The software offers several configuration parameters. These are:
  • Strength of the current I
  • Position of the transmission lines ± y 0
  • Number of sensors
  • Sensor positions in L u
  • The SIL can simulate white noise that is superimposed on the magnetic measurements v i . For this, the standard deviation σ can be set.
  • The flight trajectory can be shifted in the y z -plane in order to test the algorithms, both close to and further away from the transmission lines.

4.2. Test Parameters

The test cases and the associated results are presented below. If not otherwise stated, the following configuration is used:
  • Transmission lines: y 0 = 0.25 m, I = 700 A
  • Two sensors aligned with L u . Their positions in L u are:
    p 1 = ( 0.05 m , 0.2 m , 0.05 ) T , p 2 = ( 0.05 m , 0.2 m , 0.05 ) T .
  • Two sensors rotated by 90 . Their positions in L u are:
    p 3 = ( 0.05 m , 0.2 m , 0.25 ) T , p 4 = ( 0.05 m , 0.2 m , 0.25 ) T .
In the previous publication [25], it was shown that the electric motor of a small 1:5 scale electric toy car can produce stray magnetic fields of several μT; especially when the vehicle accelerates. The reason for this is that inadequate magnetic shielding measures are often taken in technical installations. The supply lines of electronic components with high power requirements can therefore emit strong magnetic interference fields. Since the UAV was also equipped with several electric motors, the test cases were performed with different standard deviations σ of the white noise. A value of 1 μ T was assumed for the case of good shielding and 8 μ T for poorly shielded electric motors. These were realistic values based on the measurements in [25] and took into account that the UAV may have multiple electric motors.

4.3. Test Results

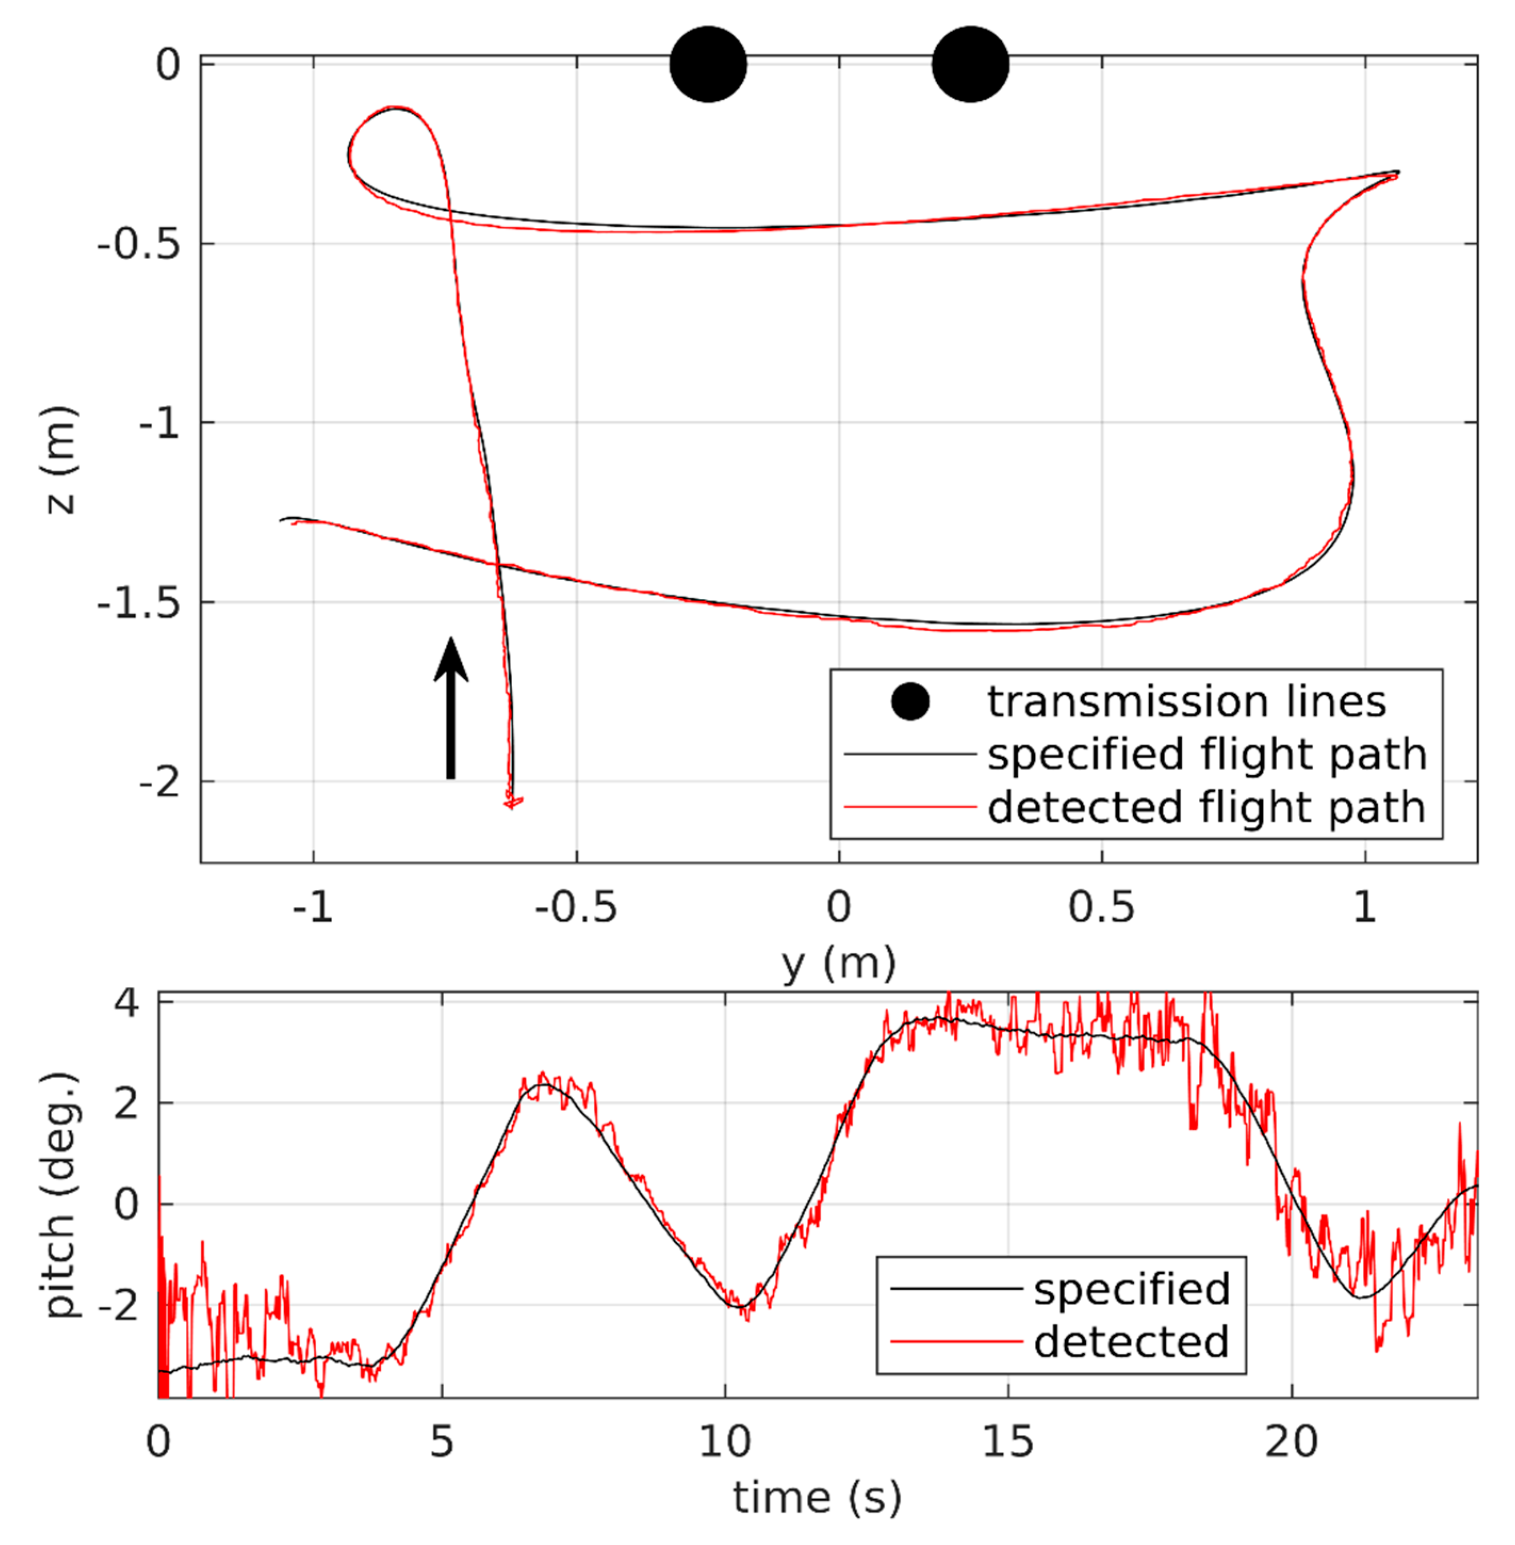
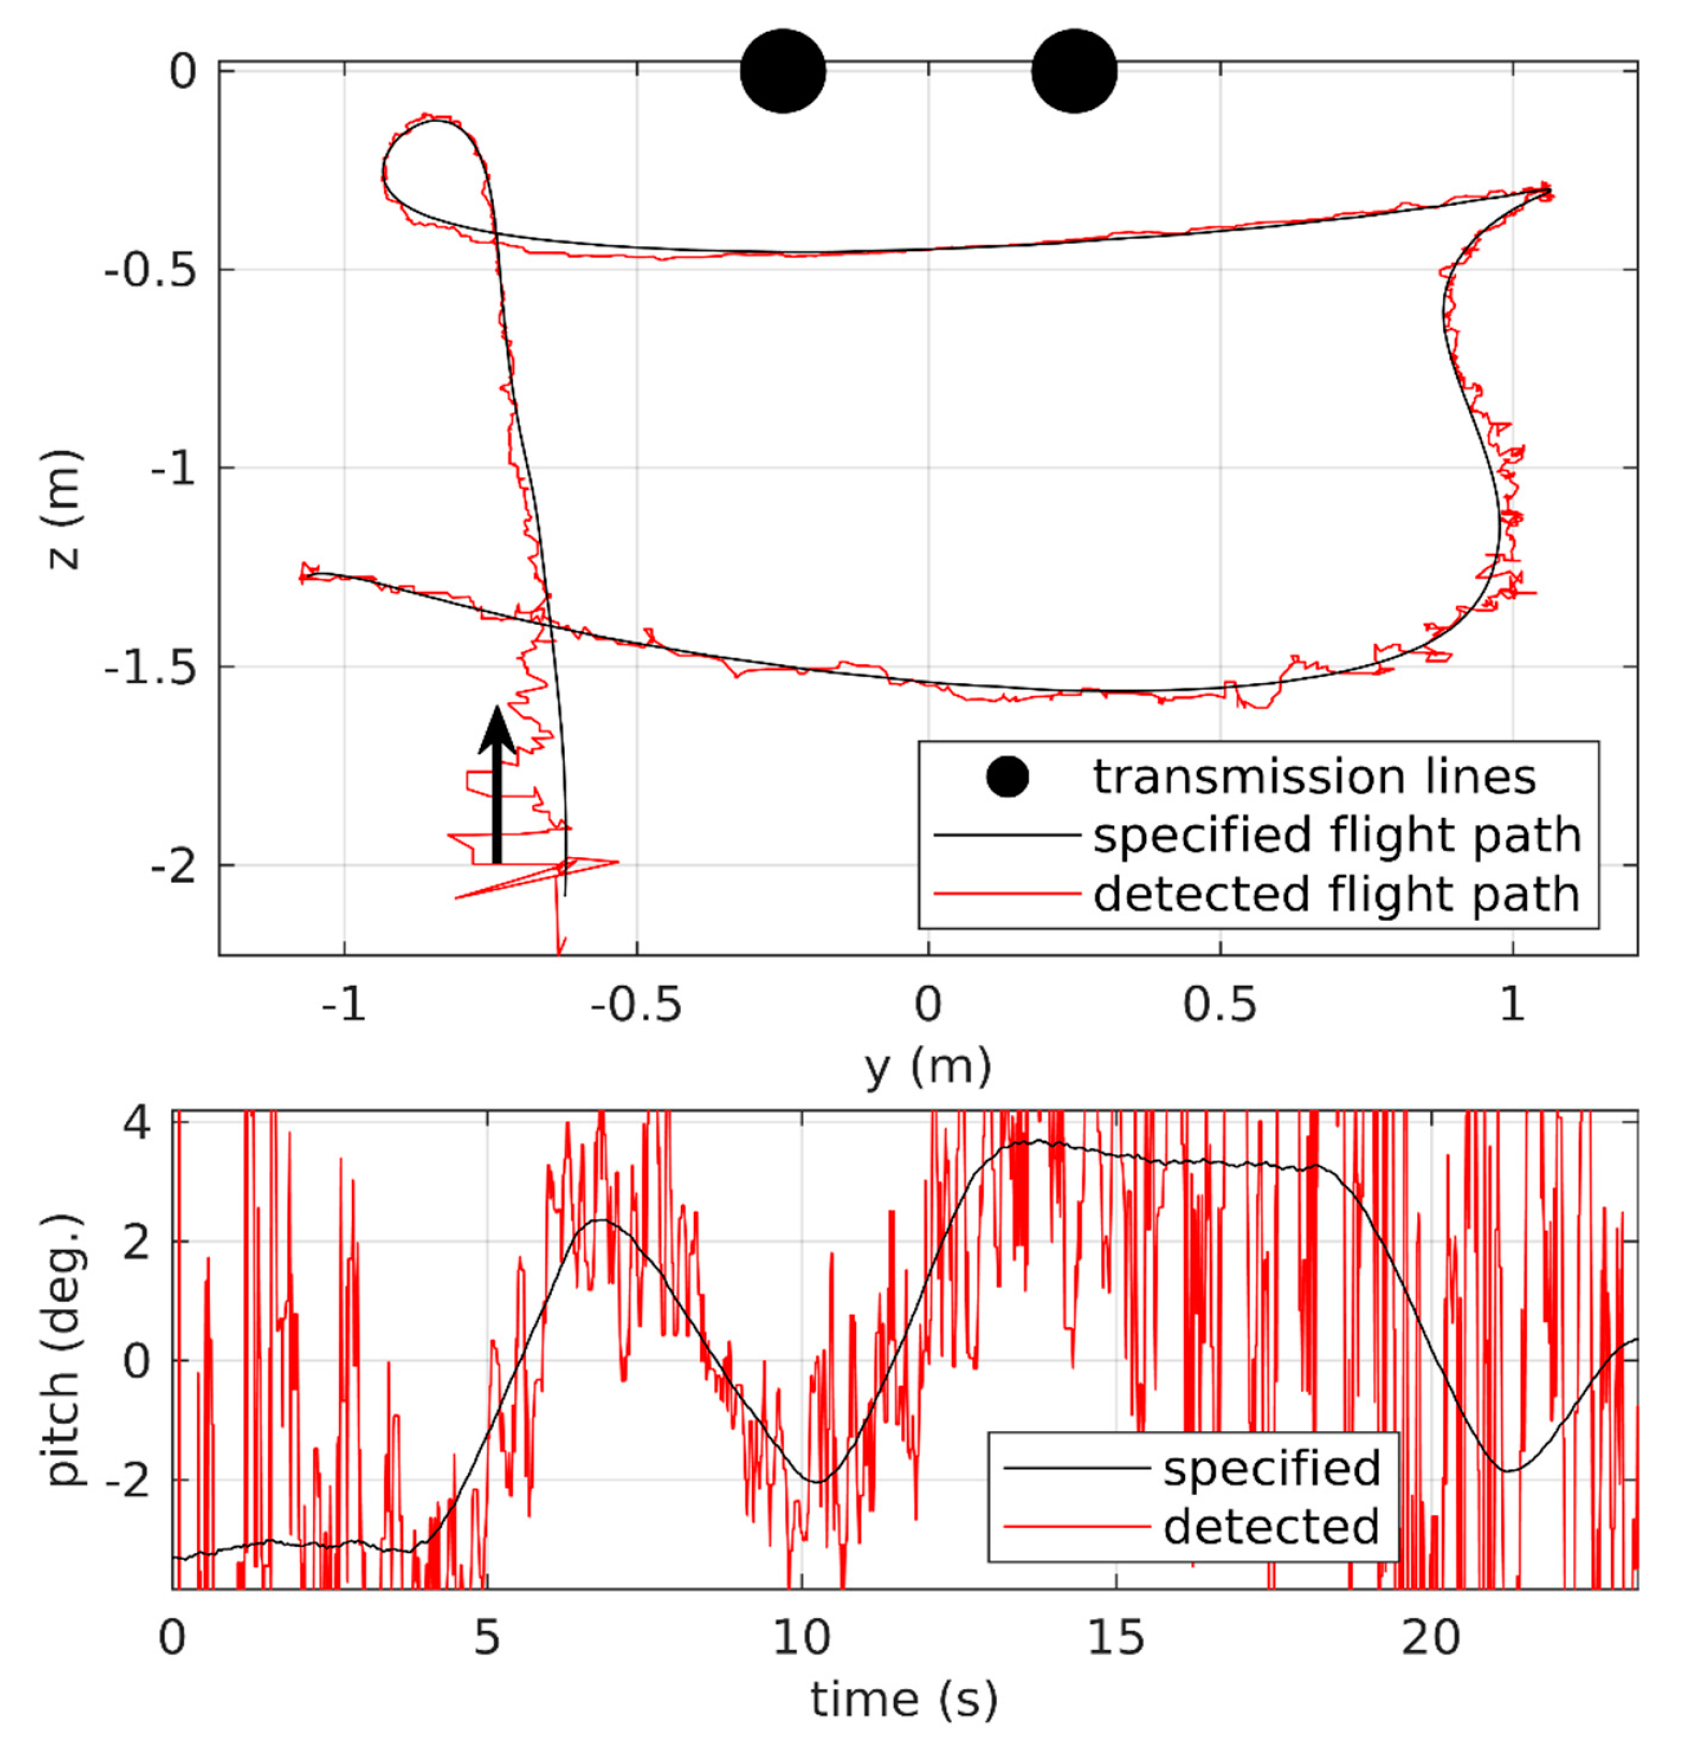
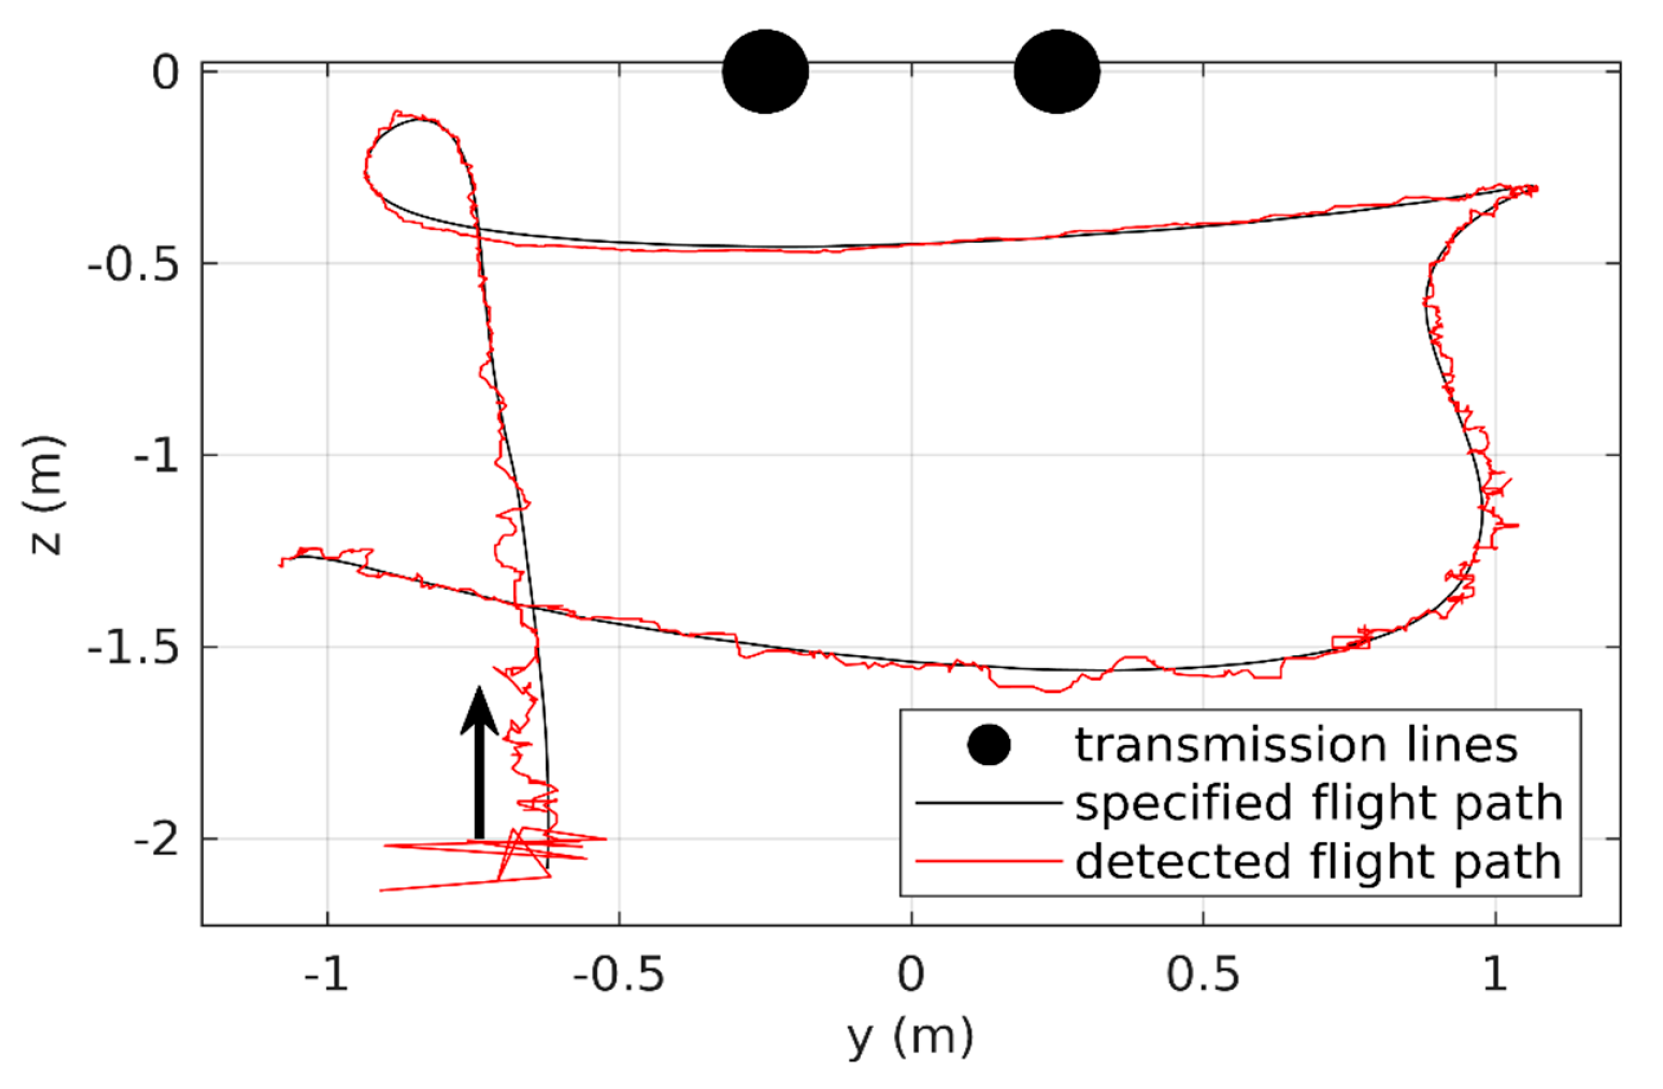
Figure 10 shows the localization results using the derived equations and the proposed polygon detection method.
The flight started at the arrow in the indicated direction, with the UAV flying one lap under the transmission lines. As was to be expected, good shielding allowed more precise navigation. The quality of localization was obviously very high with a magnetic noise standard deviation of σ = 1 μ T. The mean deviation from the specified flight path was 19 mm, with a maximum error of 61 mm. The standard deviation of the pitch angle error was 0.6°, and its mean was very close to zero, around −0.076°. Only the pitch angle is shown here as the yaw angle is of similar quality.
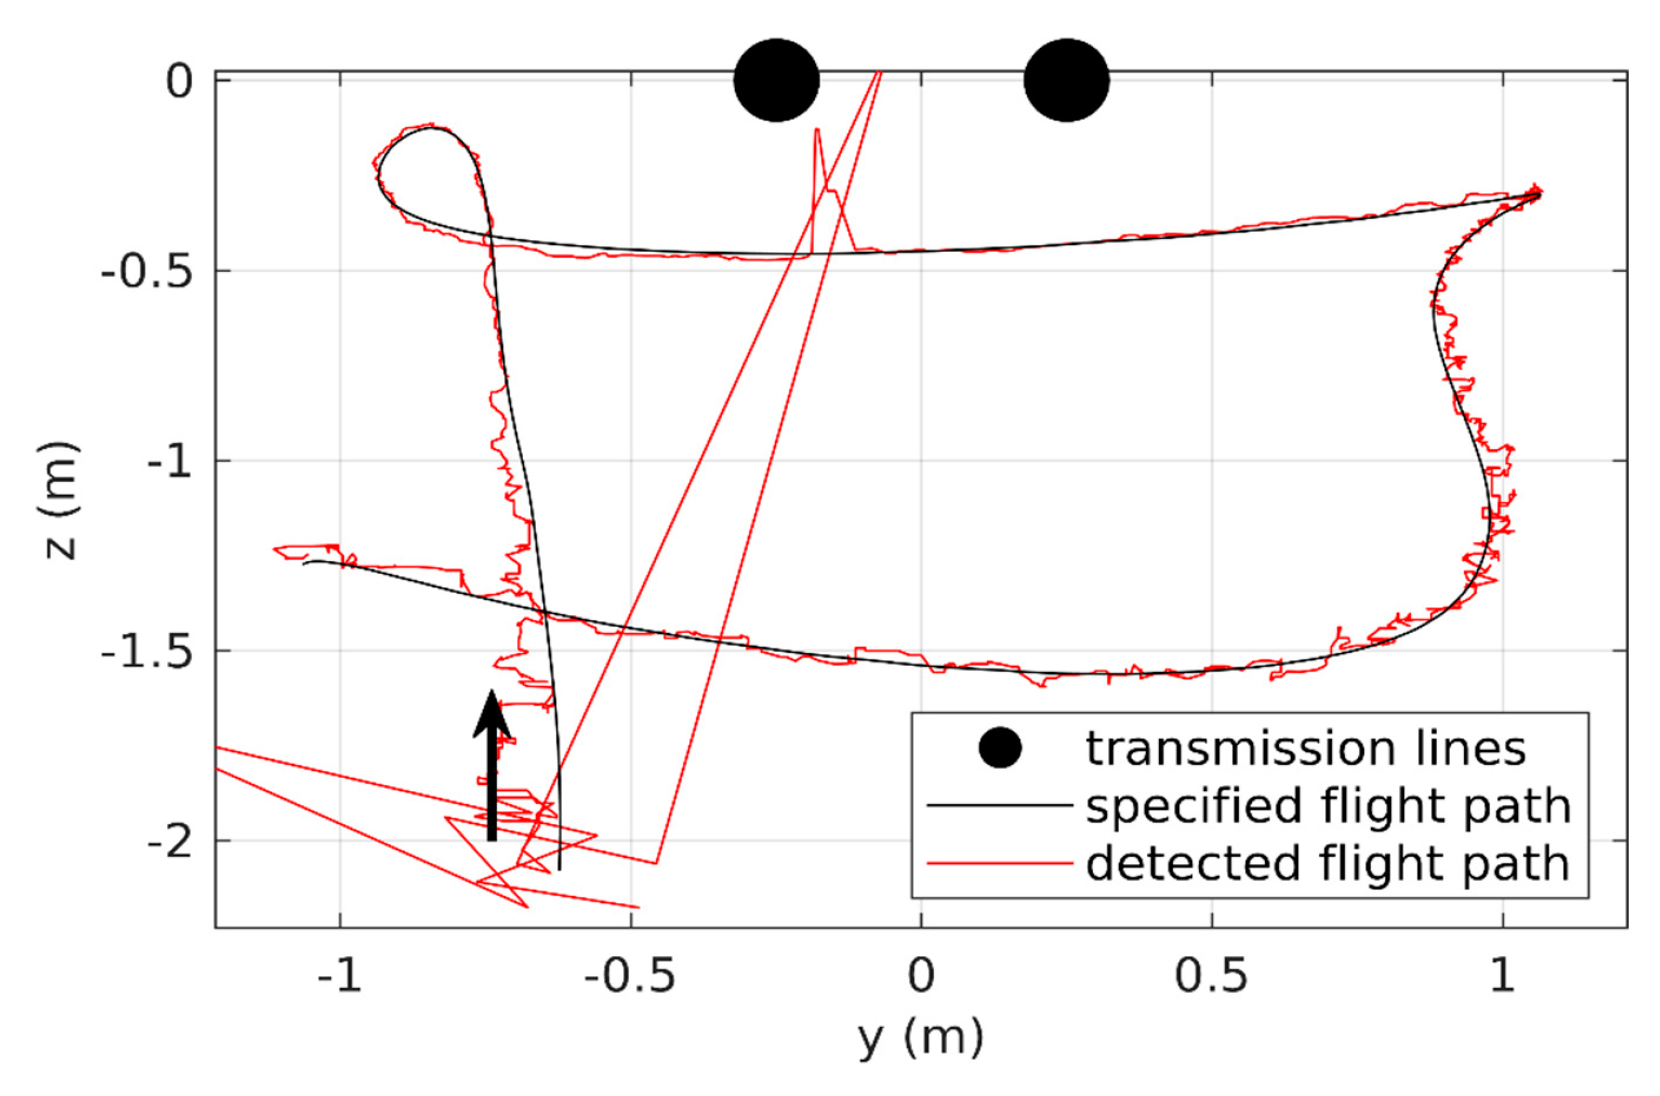
Figure 11 shows the localization results for the case where poorly shielded electrical drives in the UAV produce magnetic noise with a standard deviation of σ = 8 μ T.
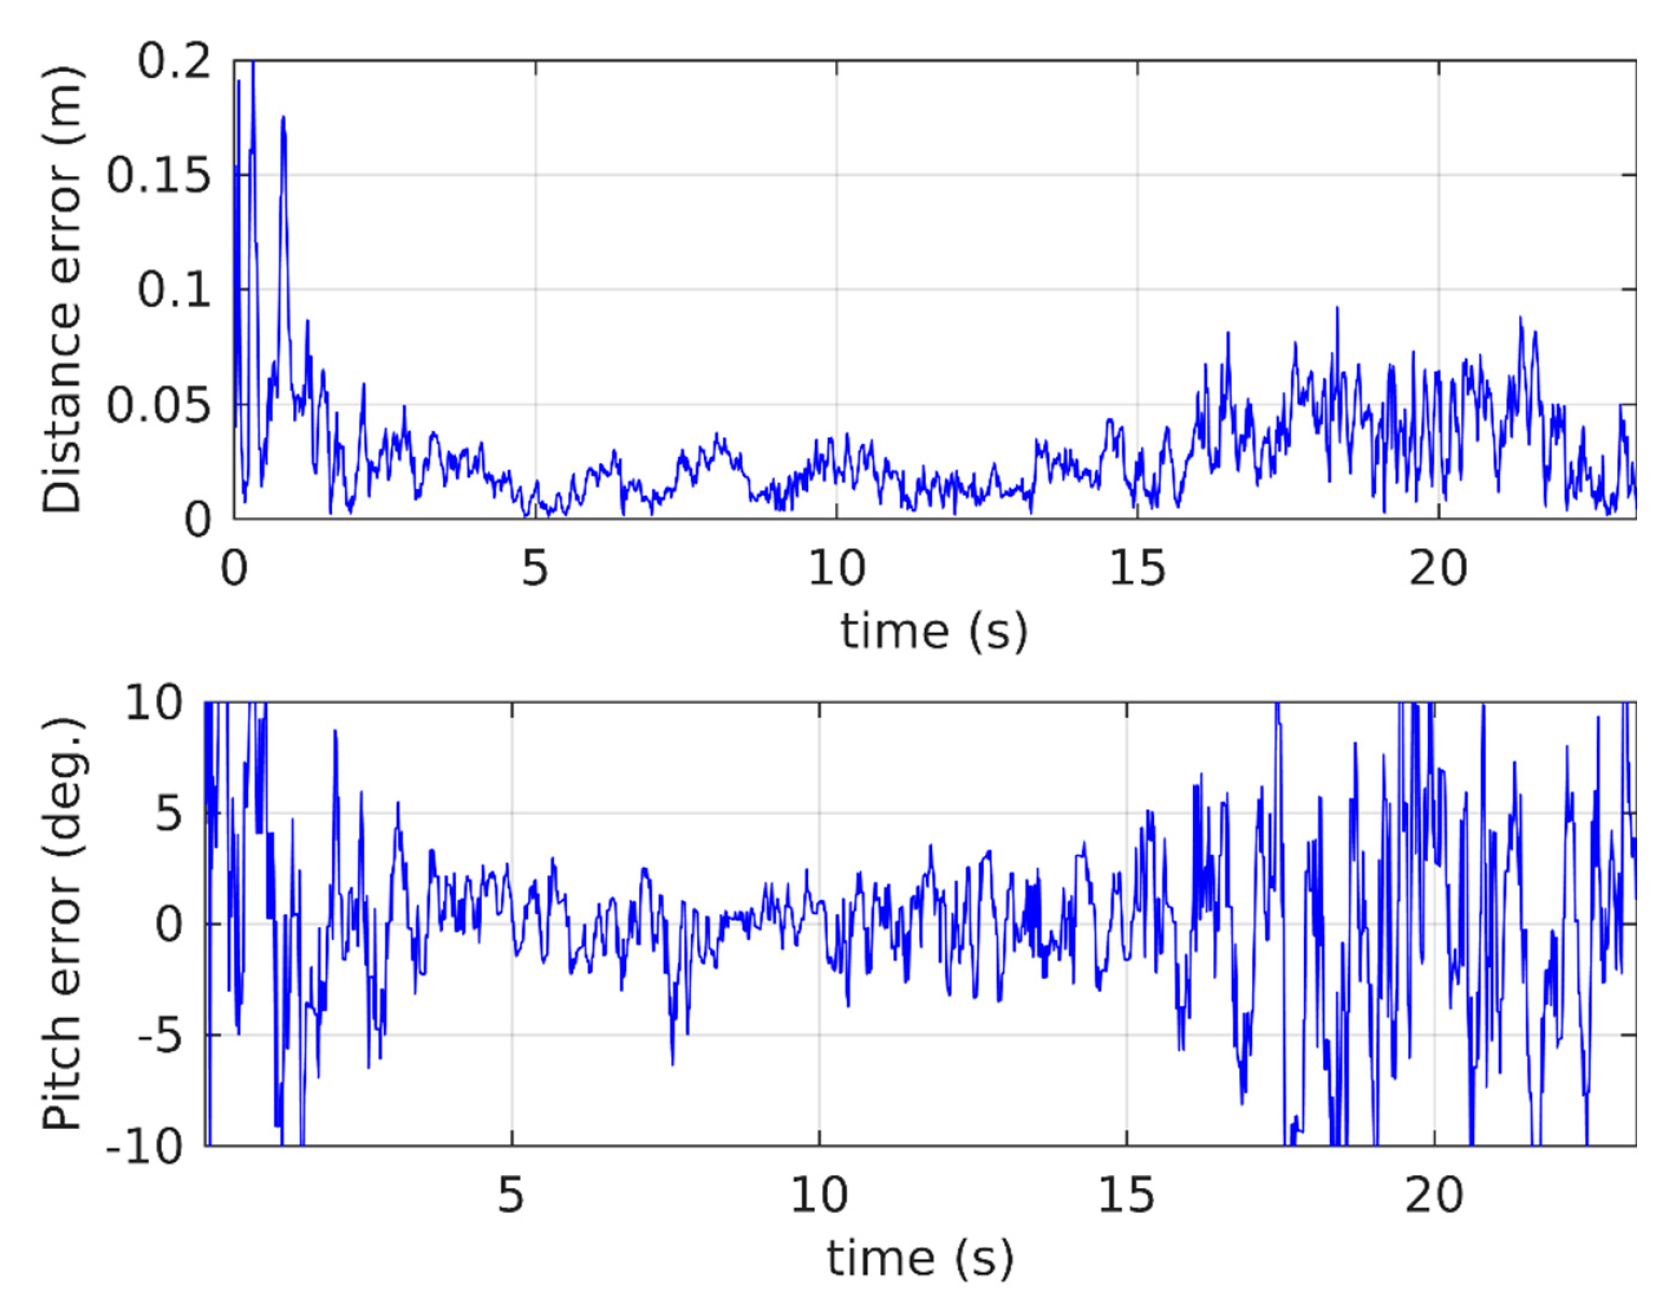
Despite the high magnetic interference, the navigation worked very well near the transmission lines due to the high signal-to-noise ratio (SNR). The deviations increased with greater distance from the transmission lines. Figure 12 shows the deviation from the specified flight path and the specified pitch angle for each waypoint.
The mean deviation from the specified flight path was 29 mm, where the maximum error was 204 mm. The mean deviation from the specified pitch angle was 0.15°, where the maximum error was 28.4°. The standard deviation of the pitch angle error was 4.4°.
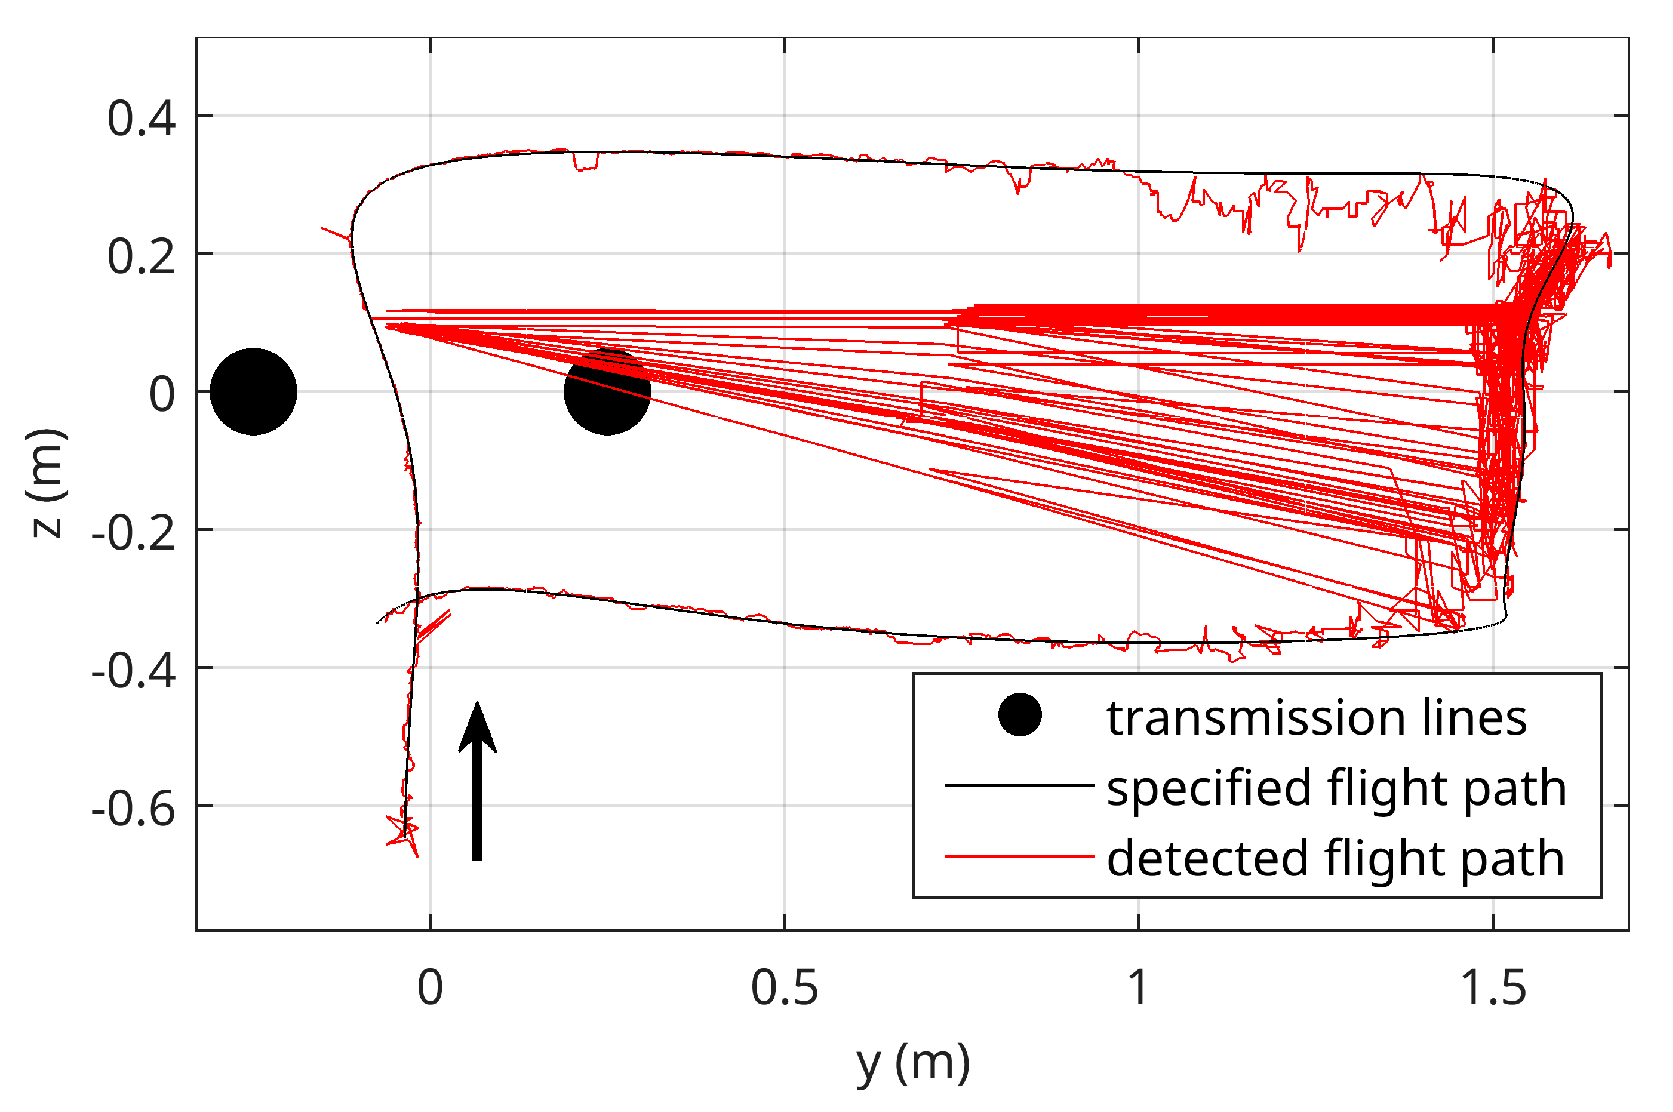
Figure 13 shows the localization results for the same noise standard deviation of σ = 8 μ T when only three sensors were used, i.e., Sensor 4 at p 4 was excluded.
The mean deviation from the specified flight path was 34 mm. In areas far from the transmission lines, as in this case, very strong outliers could occur occasionally, so that the maximum error was now about 2202 mm. The outliers occurred very frequently compared to the case with four sensors, as demonstrated by repeated experiments. These were not due to an incorrect calculation of the UAV position, but to an incorrect detection of the polygons. These were extremely distorted by the strong magnetic interference and could therefore hardly be distinguished from each other. This was to be expected, because the more sensors were used, the higher the noise immunity was. In practice, the UAV would carry out aerial manipulations in the vicinity of the transmission lines and would therefore be in an area with a high SNR. Therefore, it may also be possible to use only three sensors, as shown in Figure 14. The UAV started its flight near the transmission lines and then flew between the lines. Only when it then moved away did strong outliers occur. Repeated tests always led to the same result.
In the tests, a current of 700 A was assumed. It should be mentioned that the quality of the localization depended on the current strength in the transmission lines. This in turn depended on the per capita energy consumption of the residents, which may vary from city to city. Thus, for completeness, Figure 15 shows additionally the same case as Figure 10 with a low transmission line current of 100 A.

5. Discussion

As mentioned in Section 3.2, in a real transmission line system, it is difficult to detect whether the UAV is located below or above the cables without additional detection mechanisms. This is only possible in Figure 14 because the SIL calculated with a static equivalent current and was only used in the context of the tests.
In this paper, transmission lines were modeled as perfectly straight cables, which may not be the case in real-world circumstances. Transmission lines, for example, hang downward, thus forming more of a curved line. Even though the radius of this curve is very large, the influence on navigation accuracy should be investigated in a further work. In UAV indoor navigation applications, this problem does not occur because the cables are shorter and can be routed to fit the straight line model.
Furthermore, the magnetic field contributions of the other two phases of the three-phase system were neglected, since they are typically at least 2 m away from the phase under consideration. This should also be investigated in more detail in a further study in the context of transmission line navigation.
Finally, the magnetometers should be as far away as possible from ferromagnetic materials that may be in the UAV; otherwise, they may affect the sensor readings.

6. Conclusions

In this work, it was demonstrated that UAV navigation is possible in the magnetic field of two long parallel conductors. In this context, equations were derived to be able to calculate the UAV’s yaw and pitch angle analytically. It was shown that only two magnetometers are needed for this purpose and that neither the current nor the magnetic field equations need to be known. Furthermore, it was shown that combining the magnetic field equation with the magnetic energy equation leads to analytical solutions for the calculation of the sensor position. This results in 16 possible positions for a single sensor, from which the correct one must be determined. For this purpose, theorems were derived, which can be used to exclude 14 of the 16. The last two remaining positions are not distinguishable. However, it was shown that considering multiple sensors allows a whole set of correct positions to be selected. Here, the positions were combined into a number of polygons in the y z -plane, from which the one most similar to the original polygon was selected. This can be determined from the known orientation and the user-defined sensor positions in the local UAV frame. This ultimately led to a unique determination of the correct sensor positions and hence the UAV position. All equations, as well as the polygon selection method were successfully verified for different noise.

Author Contributions

Investigation, D.M.; methodology, D.M.; software, D.M.; validation, D.M.; writing—original draft preparation, D.M.; writing—review and editing, Z.K., S.B.; visualization, D.M.; supervision, S.B., Z.K.; project administration, S.B. All authors read and agreed to the published version of the manuscript.

Funding

The project AERIAL COgnitive integrated multi-task Robotic system with Extended operation range and safety (Aerial-Core) received funding by the European Union’s Horizon 2020 research and innovation program under grant agreement No. 871479.

Institutional Review Board Statement

Not applicable.

Informed Consent Statement

Not applicable.

Data Availability Statement

Not applicable.

Acknowledgments

I would like to thank my colleague Filip Zorić who generated the test flight data in Gazebo and thus supported the tests.

Conflicts of Interest

The authors declare no conflict of interest.

Abbreviations

The following abbreviations are used in this manuscript:
SNRsignal-to-noise ratio
UAVunmanned aerial vehicle

References

  1. Kalmus, H.P. A New Guiding and Tracking System. Ire Trans. Aerosp. Navig. Electron. 1962, ANE-9, 7–10. [Google Scholar] [CrossRef]
  2. Prigge, E.A.; How, J.P. Signal architecture for a distributed magnetic local positioning system. IEEE Sensors J. 2004, 4, 864–873. [Google Scholar] [CrossRef]
  3. Blankenbach, J.; Norrdine, A. Position estimation using artificial generated magnetic fields. In Proceedings of the IPIN International Conference on Indoor Positioning and Indoor Navigation, Zurich, Switzerland, 15–17 September 2010; pp. 1–5. [Google Scholar]
  4. Blankenbach, J.; Norrdine, A.; Hellmers, H. A robust and precise 3D indoor positioning system for harsh environments. In Proceedings of the 2012 International Conference on Indoor Positioning and Indoor Navigation (IPIN), Sydney, Australia, 13–15 November 2012; pp. 1–8. [Google Scholar] [CrossRef]
  5. Hellmers, H.; Eichhorn, A.; Norrdine, A.; Blankenbach, J. Indoor localisation for wheeled platforms based on IMU and artificially generated magnetic field. In Proceedings of the 2014 Ubiquitous Positioning Indoor Navigation and Location Based Service (UPINLBS), Corpus Christi, TX, USA, 20–21 November 2014; pp. 255–264. [Google Scholar] [CrossRef]
  6. Pasku, V.; Angelis, A.D.; Dionigi, M.; Angelis, G.D.; Moschitta, A.; Carbone, P. A Positioning System Based on Low-Frequency Magnetic Fields. IEEE Trans. Ind. Electron. 2016, 63, 2457–2468. [Google Scholar] [CrossRef]
  7. Plotkin, A.; Paperno, E. 3-D magnetic tracking of a single subminiature coil with a large 2-D array of uniaxial transmitters. IEEE Trans. Magn. 2003, 39, 3295–3297. [Google Scholar] [CrossRef]
  8. Loke, W.; Choi, T.; Maleki, T.; Papiez, L.; Ziaie, B.; Jung, B. Magnetic Tracking System for Radiation Therapy. IEEE Trans. Biomed. Circuits Syst. 2010, 4, 223–231. [Google Scholar] [CrossRef] [PubMed]
  9. Olsen, R.G.; Farstad, A.J. Electromagnetic Direction Finding Experiments for Location of Trapped Miners. IEEE Trans. Geosci. Electron. 1973, 11, 178–185. [Google Scholar] [CrossRef]
  10. Wait, J. Electromagnetic Induction Technique for Locating a Buried Source. IEEE Trans. Geosci. Electron. 1971, 9, 95–98. [Google Scholar] [CrossRef]
  11. Caffey, T.W.H.; Romero, L. Locating a Buried Magnetic Dipole. IEEE Trans. Geosci. Remote. Sens. 1982, GE-20, 188–192. [Google Scholar] [CrossRef]
  12. Pinies, P.; Tardos, J.D. Fast localization of avalanche victims using sum of Gaussians. In Proceedings of the 2006 IEEE International Conference on Robotics and Automation (ICRA), Orlando, FL, USA, 15–19 May 2006; pp. 3989–3994. [Google Scholar] [CrossRef]
  13. Vasić, D.; Ambruš, D.; Bilas, V. Analytical modelling of soil effects on electromagnetic induction sensor for humanitarian demining. J. Phys. Conf. Ser. 2013, 450, 012052. [Google Scholar] [CrossRef]
  14. Ambruš, D.; Vasić, D.; Bilas, V. Innovating on top of I&M fundamentals for safer humanitarian demining. IEEE Instrum. Meas. Mag. 2020, 23, 35–41. [Google Scholar] [CrossRef]
  15. Martinović, D. Precise Vehicle Alignment by Eliminating the Distortion of the Pulsed Magnetic Flux Density Distribution of a Charging Coil. Doctoral Thesis, University of Stuttgart, Stuttgart, Germany, 2017. [Google Scholar]
  16. Paperno, E.; Sasada, I.; Leonovich, E. A new method for magnetic position and orientation tracking. IEEE Trans. Magn. 2001, 37, 1938–1940. [Google Scholar] [CrossRef]
  17. Song, S.; Hu, C.; Li, B.; Li, X.; Meng, M.Q. An Electromagnetic Localization and Orientation Method Based on Rotating Magnetic Dipole. IEEE Trans. Magn. 2013, 49, 1274–1277. [Google Scholar] [CrossRef]
  18. Raab, F.H.; Blood, E.B.; Steiner, T.O.; Jones, H.R. Magnetic Position and Orientation Tracking System. IEEE Trans. Aerosp. Electron. Syst. 1979, AES-15, 709–718. [Google Scholar] [CrossRef]
  19. Raab, F.H. Quasi-Static Magnetic-Field Technique for Determining Position And Orientation. IEEE Trans. Geosci. Remote. Sens. 1981, GE-19, 235–243. [Google Scholar] [CrossRef]
  20. Jinglan, T.; Shuang, S.; Xiaojing, W.; Tingfang, Y.; Chao, H.; Meng, M.Q. An improved method and algorithm for electromagnetic localization. In Proceedings of the 2011 IEEE International Conference on Information and Automation, Shenzhen, China, 6–8 June 2011; pp. 406–411. [Google Scholar] [CrossRef]
  21. Ito, Y.; Kato, N.; Kojima, J.; Takagi, S.; Asakawa, K.; Shirasaki, Y. Cable tracking for autonomous underwater vehicle. In Proceedings of the IEEE Symposium on Autonomous Underwater Vehicle Technology (AUV’94), Cambridge, MA, USA, 19–20 July 1994; pp. 218–224. [Google Scholar] [CrossRef]
  22. Xiang, X.; Yu, C.; Niu, Z.; Zhang, Q. Subsea Cable Tracking by Autonomous Underwater Vehicle with Magnetic Sensing Guidance. Sensors 2016, 16, 1335. [Google Scholar] [CrossRef] [PubMed]
  23. Yu, C.; Xiang, X.; Lapierre, L.; Zhang, Q. Robust Magnetic Tracking of Subsea Cable by AUV in the Presence of Sensor Noise and Ocean Currents. IEEE J. Ocean. Eng. 2018, 43, 311–322. [Google Scholar] [CrossRef]
  24. Martinović, D.; Binz, C.; Reuss, H.C. Magnetic Field based Localization of the Charging Coil using Trilateration. In Autoreg 2015—VDI-Berichte 2233; VDI Verlag GmbH: Düsseldorf, Germany, 2015; pp. 129–140. [Google Scholar]
  25. Hisung, M.; Martinović, D.; Reuss, H.C. Feasibility study on the basis of a prototype for automated vehicle positioning in inductive charging process. In Proceedings of the 19. Internationales Stuttgarter Symposium; Springer Fachmedien: Wiesbaden, Germany, 2019; pp. 667–678. [Google Scholar] [CrossRef]
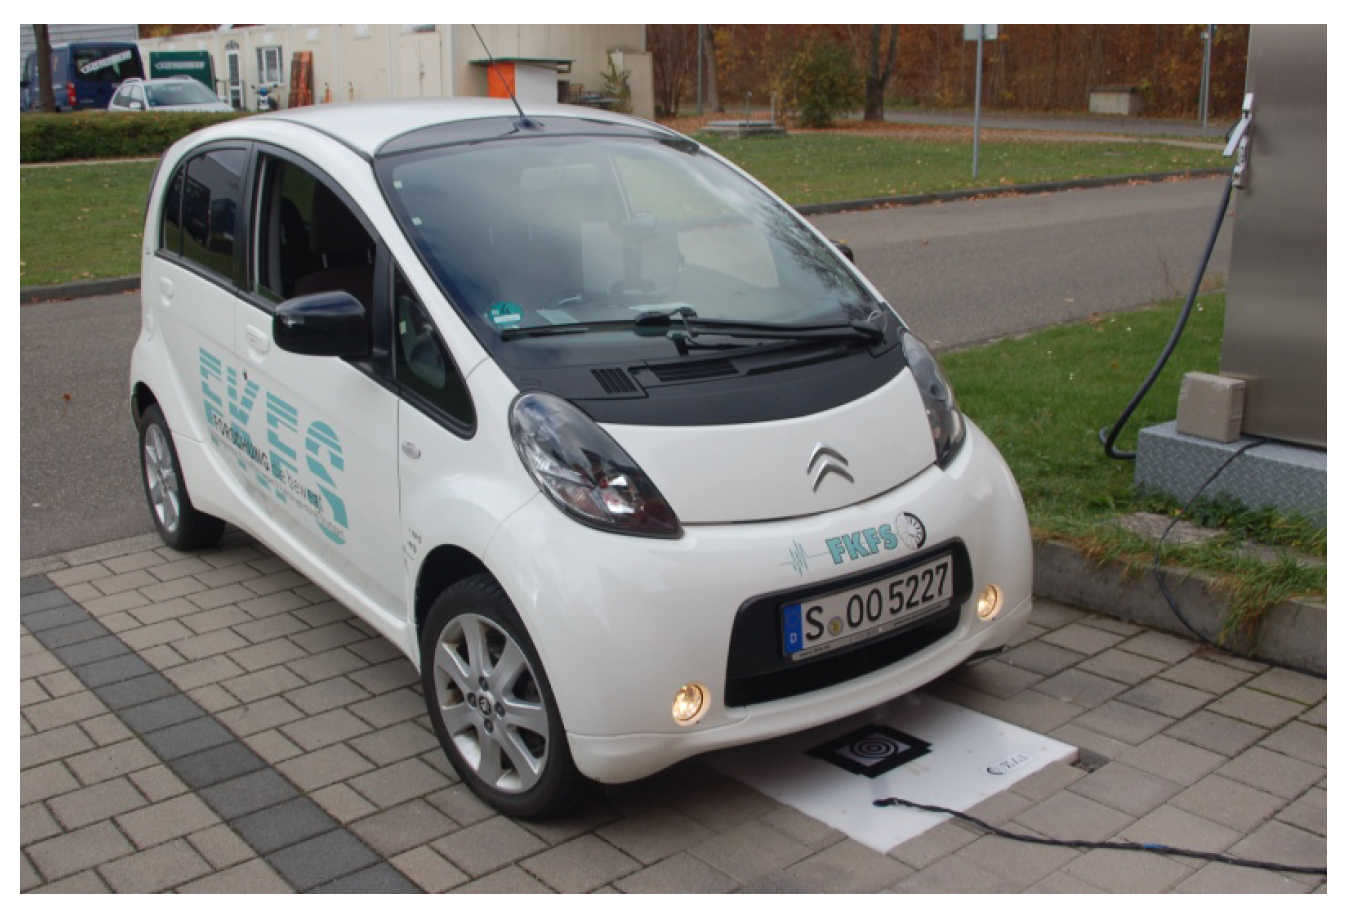
Figure 1. Navigation using a one-axis coil [15].
Applsci 11 03323 g001
Figure 2. Principle of a three-axis coil.
Applsci 11 03323 g002
Figure 3. Distance separator for transmission lines.
Applsci 11 03323 g003
Figure 4. System overview. Global frame and UAV frame.
Applsci 11 03323 g004
Figure 5. Signal power around the transmission lines.
Applsci 11 03323 g005
Figure 6. Isolines of the magnetic field describing equal power.
Applsci 11 03323 g006
Figure 7. Two remaining positions of a sensor.
Applsci 11 03323 g007
Figure 8. Ambiguities due to field symmetry.
Applsci 11 03323 g008
Figure 9. Sample values of a magnetometer.
Applsci 11 03323 g009
Figure 10. Localization quality, good shielding: σ = 1   μ T.
Applsci 11 03323 g010
Figure 11. Localization quality, poor shielding: σ = 8   μ T.
Applsci 11 03323 g011
Figure 12. Path and pitch angle errors, poor shielding: σ = 8 μT.
Applsci 11 03323 g012
Figure 13. Localization quality, three sensors, σ = 8   μ T.
Applsci 11 03323 g013
Figure 14. Localization quality close to the transmission lines and far away, three sensors, σ = 8 μ T.
Applsci 11 03323 g014
Figure 15. Localization quality in the case of low transmission line current of 100 A, four sensors, σ = 1 μ T.
Applsci 11 03323 g015
Publisher’s Note: MDPI stays neutral with regard to jurisdictional claims in published maps and institutional affiliations.