Article

High Intensity Training Increases Muscle Area Occupied by Type II Muscle Fibers of the Multifidus Muscle in Persons with Non-Specific Chronic Low Back Pain: A Pilot Trial

1
Rehabilitation Research Center, Faculty of Rehabilitation Sciences, Hasselt University, Agoralaan Building A, 3590 Diepenbeek, Belgium
2
Biomedical Research Institute, Faculty of Medicine and Life Sciences, Hasselt University, Agoralaan Building C, 3590 Diepenbeek, Belgium
*
Author to whom correspondence should be addressed.
Appl. Sci. 2021, 11(8), 3306; https://doi.org/10.3390/app11083306
Submission received: 14 March 2021 / Revised: 2 April 2021 / Accepted: 6 April 2021 / Published: 7 April 2021
(This article belongs to the Special Issue Musculoskeletal Rehabilitation)

Abstract

:
Low back pain is a prevalent musculoskeletal disorder with high disability. Although exercise therapy is an important part of the multidisciplinary treatment of non-specific chronic low back pain (NSCLBP), the impact of exercise therapy on muscle morphology of the paraspinal muscles is largely unknown. The main aim of this study is to evaluate the effects of a high intensity training (HIT) program on muscle fiber characteristics of the multifidus (MF) and the erector spinae (ES) musculature in persons with NSCLBP and to compare these results with the effects of a moderate intensity training (MIT) program, which is used as a control group. In total, 38 participants with NSCLBP were randomly assigned to a HIT or MIT intervention group. Participants performed a 12-week training program. At baseline and after the training program, biopsy samples from the lumbar MF and ES were obtained. Muscle fiber characteristics were analyzed by immunofluorescence. For the ES, no significant changes were found in muscle fiber CSA and distribution of muscle fiber types in response to a training program at moderate or at high intensity. For the MF, a significant higher muscle area occupied by type II muscle fibers, referred to as the relative cross-sectional area (RCSA), was found in the HIT group. Based on muscle fiber characteristics in biopsy samples, a HIT program of 12 weeks seems to result in a more glycolytic profile in the MF.

1. Introduction

Low back pain is a highly prevalent musculoskeletal disorder that affects at least 80% of all individuals at least once in their lifetime [1]. Although most cases of low back pain resolve within 8–12 weeks, in a subset of patients the pain becomes chronic as it persists longer than 12 weeks. Chronic low back pain has a lifetime prevalence of 23% and is often associated with multiple influencing factors which complexes its management [2]. This chronic and complex condition leads to a loss of productivity, high levels of work absenteeism and as such high direct and indirect healthcare costs [3,4]. Only in a small percentage (<15%) of all patients with chronic low back pain, the pain can be attributed to a specific underlying disease or pathology. The majority of the patients are, therefore, categorized as nonspecific chronic low back pain (NSCLBP), in which the cause remains unknown [1]. Several lumbar structures might be the source of the pain, but clinical tests do not reliably attribute the pain to those structures [2]. One of these structures are the paraspinal muscles that play an important role in stabilizing the lumbar spine [5].
There is accumulating evidence that NSCLBP is associated with paraspinal muscle dysfunction, such as altered movement control, postural control, body awareness, decreased muscle strength and self-assessed functional disability [6,7,8,9,10,11]. Muscle dysfunction is often the result of muscle degeneration which is characterized by two main macroscopic signs: muscle atrophy and fatty infiltration. Several studies have documented a smaller anatomical cross-sectional area (CSA) [6,8,9] and an increase in fat content [6,11] of the paraspinal muscles. Morphological changes to the paraspinal muscles can impair spinal stability which might contribute to causing/maintaining NSCLBP [12]. Evidence on muscle fiber characteristics at a microscopic level in low back pain is scarce and conflicting. According to Crossman et al., 2004, there were no differences in muscle fiber type distribution between persons with NSCLBP and healthy controls (HC) [13], while Agten et al., 2020 showed that persons with NSCLBP have a more oxidative muscle fiber type profile compared to HC [14].
An important feature that affects muscle morphology and muscle (dys)function is exercise training [15]. Surprisingly and although exercise therapy plays an important role in the multidisciplinary treatment of NSCLBP, the overall treatment effects remain low [16]. Several training methods are used in the treatment of NSCLBP, including training protocols that aim to recruit the lumbar paraspinal muscles by using core stability and endurance training. These exercise therapies focus on strengthening and decreasing the fatigability of these muscles [17,18,19]. Since slow-contracting muscle fibers are more resistant to fatigue, exercise training to decrease fatiguability might result in a more oxidative and slow-contracting muscle fiber profile [20,21,22]. However, Agten et al., 2020 [14] showed that paraspinal muscles of persons with NSCLBP are represented with a more oxidative and slow-contracting profile. Furthermore, it has been shown that exercise therapy at low or moderate intensity in NSCLBP rehabilitation programs could be insufficient to have therapeutic effects [16,23], while a high intensity training (HIT) program consisting of cardiorespiratory interval, general resistance and core muscle training has been shown to have greater improvements on reducing disability and increasing exercise capacity [24]. This improvement in disability and increased exercise capacity might be the result of morphological changes in the paraspinal muscles. Changes in macroscopic morphological muscle characteristics after exercise programs for low back pain are rarely observed [18,25,26,27]. Only studies who used high intensity strengthening exercise protocols have reported a consistent increase in CSA of the paraspinal muscles, especially the lumbar multifidus muscle [18,28,29]. However, these studies did not investigate the effect on microscopic muscle fiber characteristics. Hormones with anabolic properties can stimulate protein synthesis or downgrade protein degradation, and hence, lead to an increase in muscle size through a variety of downstream pathways [30]. Insuline-like growth factor 1 (IGF-1) is regulated by an anabolic hormone, growth hormone (GH) and enhances protein synthesis, and thus, an increase in muscle CSA [30,31]. Previous research has shown that IGF-1 serum levels are decreased in chronic pain [32]. Long-term exercise therapy can elevate resting IGF-1 serum levels [33,34].
Therefore, the main goal of this pilot study was to evaluate the effects of a HIT program, consisting of a combined cardiorespiratory, general full body resistance and core muscle training protocol, on muscle fiber type characteristics of the lumbar multifidus (and erector spinae) in persons with NSCLBP and to compare these results with the effects of a similar training protocol at moderate intensity, which is used as a control group. We hypothesize that there would be an increase in muscle fiber size combined with a shift towards a more glycolytic muscle profile in the ES and MF after HIT. Since IGF-1 can enhance protein synthesis, and hence, can stimulate the increase in muscle fiber size, we expected elevated IGF-1 serum levels after HIT.

2. Materials and Methods

Subjects
Persons with NSCLBP were recruited by local advertisement. Subjects with NSCLBP, between 25–60 years of age and able to speak and understand Dutch, were included. NSCLBP was defined as pain localized below the costal margin and above the inferior gluteal folds not attributable to a recognizable, known specific pathology (e.g., infection, tumor, osteoporosis, fracture, structural deformity, radicular syndrome or cauda equina syndrome) and persisting for at least 12 weeks. Subjects were excluded if they underwent invasive surgery of the lumbar spine, had co-morbidities (e.g., paresis and/or sensory disturbances by neurological causes, diabetes mellitus, rheumatoid arthritis), had a musculoskeletal disorder other than NSCLBP that could affect the correct execution of the therapy program, were pregnant, had ongoing compensation claims and/or work disability >6 months, had followed an exercise program in the past 3 months or were not able to attend regular therapy appointments. All interested subjects were invited for an intake session. They were informed about all the aspects of the study, in- and exclusion criteria were evaluated and a study-specific screening form concerning red flags for low back pain rehabilitation was filled out under the supervision of the study physician. All subjects gave their informed consent for inclusion before they participated in the study. This randomized controlled trial is part of a larger project that evaluates the effects of training intensity and training mode in NSCLBP rehabilitation, which was registered at clinicaltrials.gov (accessed on 6 April 2021) as NCT02786316. The study was performed at the REVAL Rehabilitation Research Center of Hasselt University (Diepenbeek, Belgium). In the larger project, 147 persons with NSCLBP were screened for eligibility between October 2016 and March 2019. Of these, 41 did not meet the inclusion criteria and six were not able to start the therapy program due to conflicting job schedules or commuting problems and were not further included. As such, 100 participants were included, of which 38 were randomly assigned to one of the two intervention groups evaluated in this analysis. A comprehensive research design flowchart is displayed in Figure 1. This project was approved by the Ethical Committee of Hasselt University and Jessa Hospital Hasselt under protocol name 15.142/REVA15.14 and complies with the Declaration of Helsinki.
Randomization and blinding
Participants were randomized into an experimental group and a control group by sealed, opaque, sequentially numbered envelopes containing the allocated group for the participant. These envelopes were picked by an independent research assistant, not involved in the study, to ensure concealment of allocation. The experimental group performed a HIT program, while the control group performed a moderate intensity training (MIT) program, comparable to usual care [23,35]. Blinding of the participants and caregivers was not possible due to the nature of the exercise therapy. To limit the performance bias of the participants, the study was explained as “a comparison between different modes of exercise therapy in which equal progression could be expected in all groups.”
Interventions
Participants of both groups followed a 12-week training program (2/w, 1.5 h/session). The 24 individual training sessions were organized at REVAL (Hasselt University, Diepenbeek, Belgium) under supervision of a physiotherapist of the research team. A standardized follow-up of all participants was assured by using a manual with protocols, explanation of the exercises and definitions of progression. Both groups performed a protocol consisting of cardiorespiratory training, general resistance training and core muscle training according to a protocol of Verbrugghe et al., 2019 [24]. The experimental group (hereafter referred to as HIT-group) performed all exercises at high intensity. The cardiorespiratory training consisted of an interval training protocol on a cycle ergometer. The interval training consisted of five 1-min bouts (110 repetitions per minute at 100% VO2max workload), with 1 min of active rest (75 repetitions per minute at 50% VO2max workload) in between. The high intensity cycling bouts increased every two sessions by 10 s, up to 1 min 50 s after 12 sessions. The active recovery time remained constant at 1 min. The protocol was repeated from session 13 to 24 but with an updated workload. The general resistance training consisted of three upper body and three lower body exercises executed on fitness equipment. In the first sessions, the exercises were explained by the physiotherapist and a one-repetition maximum (1RM) test was performed. In the following sessions, one set of a maximum of 12 repetitions were performed at 80% of 1RM for each exercise. The workload was progressively increased to ensure a HIT. Core muscle training consisted of six core exercises. In the first sessions, the exercises were explained and participants were educated to activate specific or isolated core muscles (m. multifidus, mm. glutei, m. transversus abdominis). In the following sessions, participants performed one set of 10 repetitions of a 10 s static hold. The participants were encouraged to hold the last repetition as long as possible. Exercise difficulty was progressively increased. The control group (hereafter referred to as MIT-group) performed all exercises at moderate intensity. The cardiorespiratory training consisted of a continuous training protocol on a cycle ergometer. The training program started with 14 min of cycling at continuous workload (90 repetitions per minute at 60% VO2max workload). Duration increased every two sessions with 1 min 50 s up to 22 min 40 s after 12 sessions. The protocol was repeated from session 13 to 24 but with an updated workload. General resistance exercises and core muscle training were identical to the experimental group, except for the intensity. For the general resistance training, one set of 15 repetitions were executed at 60% of 1RM. For the core muscle training, one set of 10 repetitions of a 10 s static hold were done. Exercises remained the same; only the time of a static hold was increased each six sessions.
Primary outcomes:
Biopsy sampling
Muscle samples were obtained from the right erector spinae (ES) and multifidus (MF) muscle at the level of spinous process vertebra L4 according to the procedure of Agten et al., 2018 [36] in the week before the start of the intervention and in the week after the end of the intervention. These muscle samples were obtained while the participant was in prone position with a small amount of lumbar flexion. First, the puncture site was determined by ultrasound as the point of separation between ES and MF. This site was locally anesthetized (Xylocaine 1% ®) before the skin was incised over a length of 2 mm. The thoracolumbar fascia was pierced with a coaxial needle, through which the biopsy needles were inserted. Afterwards, a muscle sample of the ES was obtained by a biopsy needle that was directed laterally. A muscle sample of the MF was obtained by a second biopsy needle that was directed medially. Both muscle samples were removed from the needle and placed on a piece of cork. Samples covered with optimum-cutting temperature compound (Tissue-Tek®) were frozen in precooled isopentane and stored in −80 °C until further analysis. All samples were given a unique identification code.
Immunohistochemistry
Serial transverse sections (10 µm) were cut with a microtome (CM1900 Cryostat; Leica Microsystems, Machelen, Belgium). Myosin Heavy Chains (MHC) were identified by using an immunofluorescence staining, based on the protocol of Bloemberg and Quadrilatero 2012 [37]. Sections were air dried at room temperature for 20 min and incubated with 10% normal goat serum to block autofluorescence. Afterwards, the sections were incubated with primary antibodies specific to MHC I (BA-F8; 1/50), MHC IIA (SC-71; 1/500) and MHC IIX (6H1; 1/50) (Development Studies Hybridoma Bank, Iowa City, IA, USA) and with a primary antibody specific to laminin (ab11575; 1/200) (Abcam, Cambridge, UK) for two hours at room temperature. The incubation with the conjugated secondary antibodies lasted 1 h at room temperature. Secondary antibodies (Alexa Fluor 350; 1/500, Alexa Fluor 488; 1/500, Alexa Fluor 555; 1/500 and Alexa Fluor 532, 1/500) were purchased from Life Technologies Inc., Ulm, Germany. In the end, sections were covered with coverslips using ProLong Gold antifade reagent (Life Technologies Inc., Ulm, Germany).
Muscle fiber typing and morphometry
Stained sections were photographed at 10× magnification using a fluorescent microscope (EL6000; Leica). Muscle fiber size (µm2) and muscle fiber type (I, I/IIa, IIa IIa/x, IIx) of each muscle fiber were manually determined with AxioVision from Zeiss®. Based on these two measurements, the relative cross-sectional area (RCSA) was calculated. RCSA is an important structural characteristic that defines the functional capacity of a skeletal muscle [
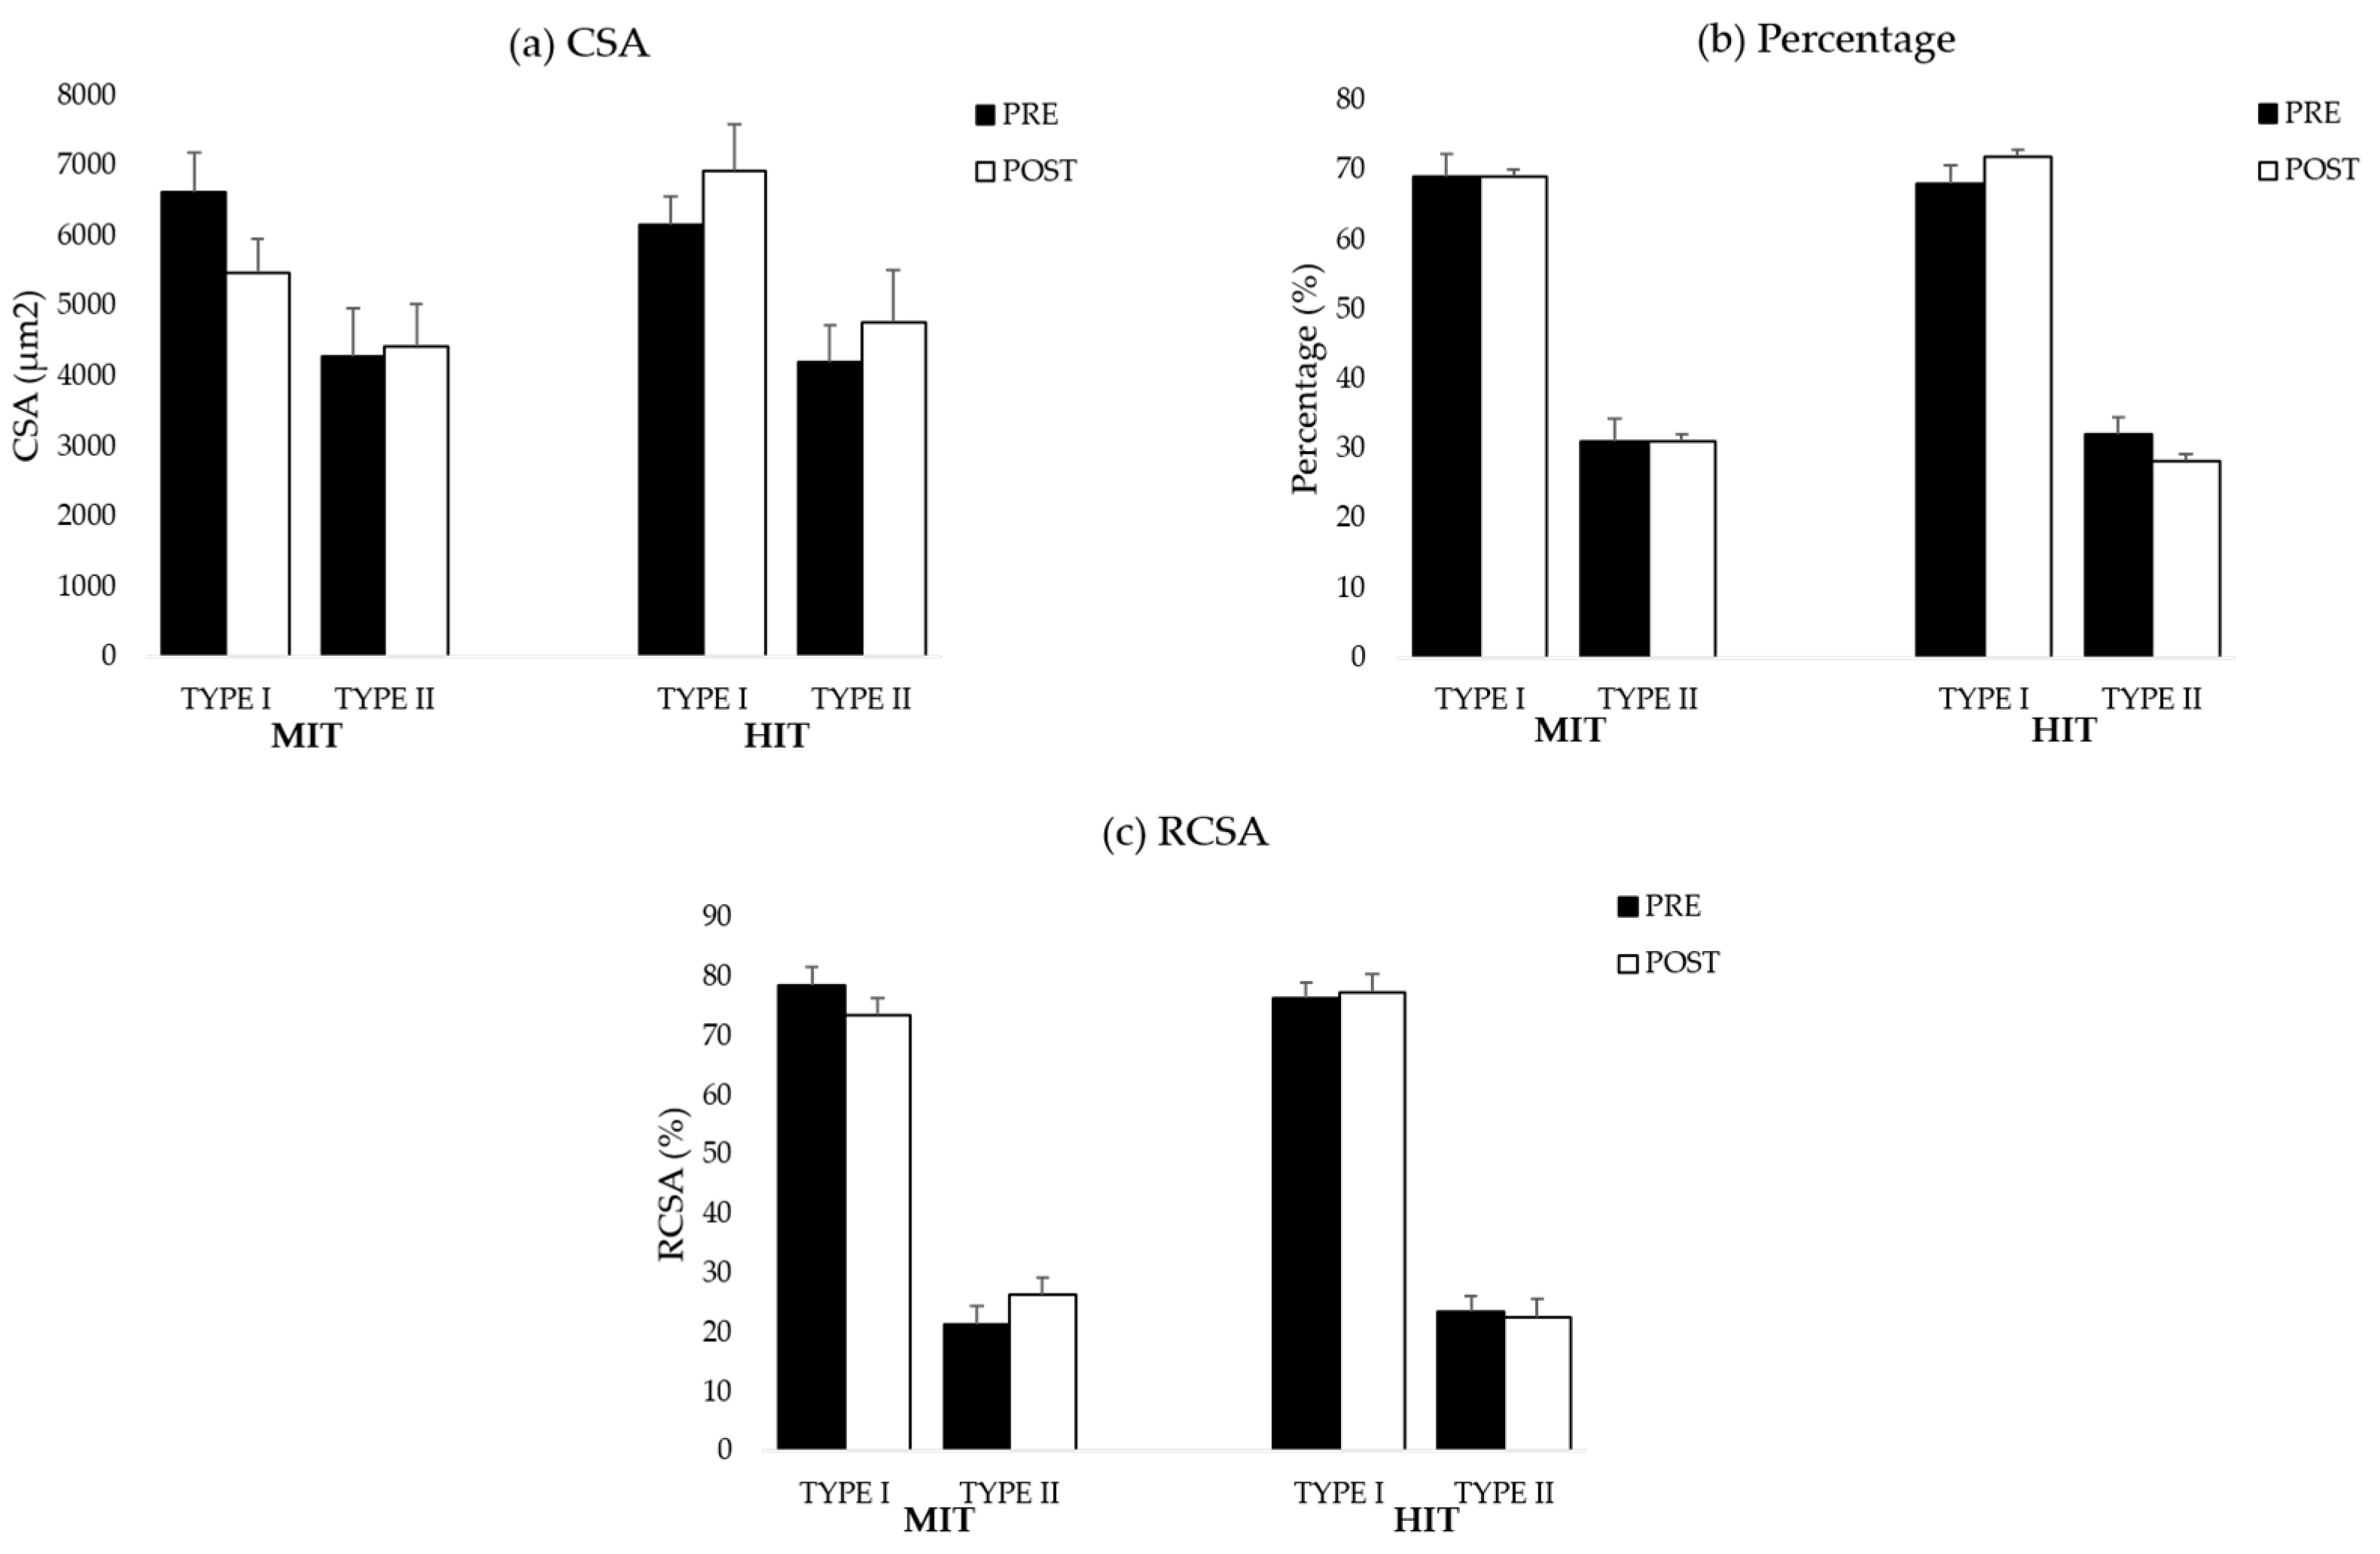
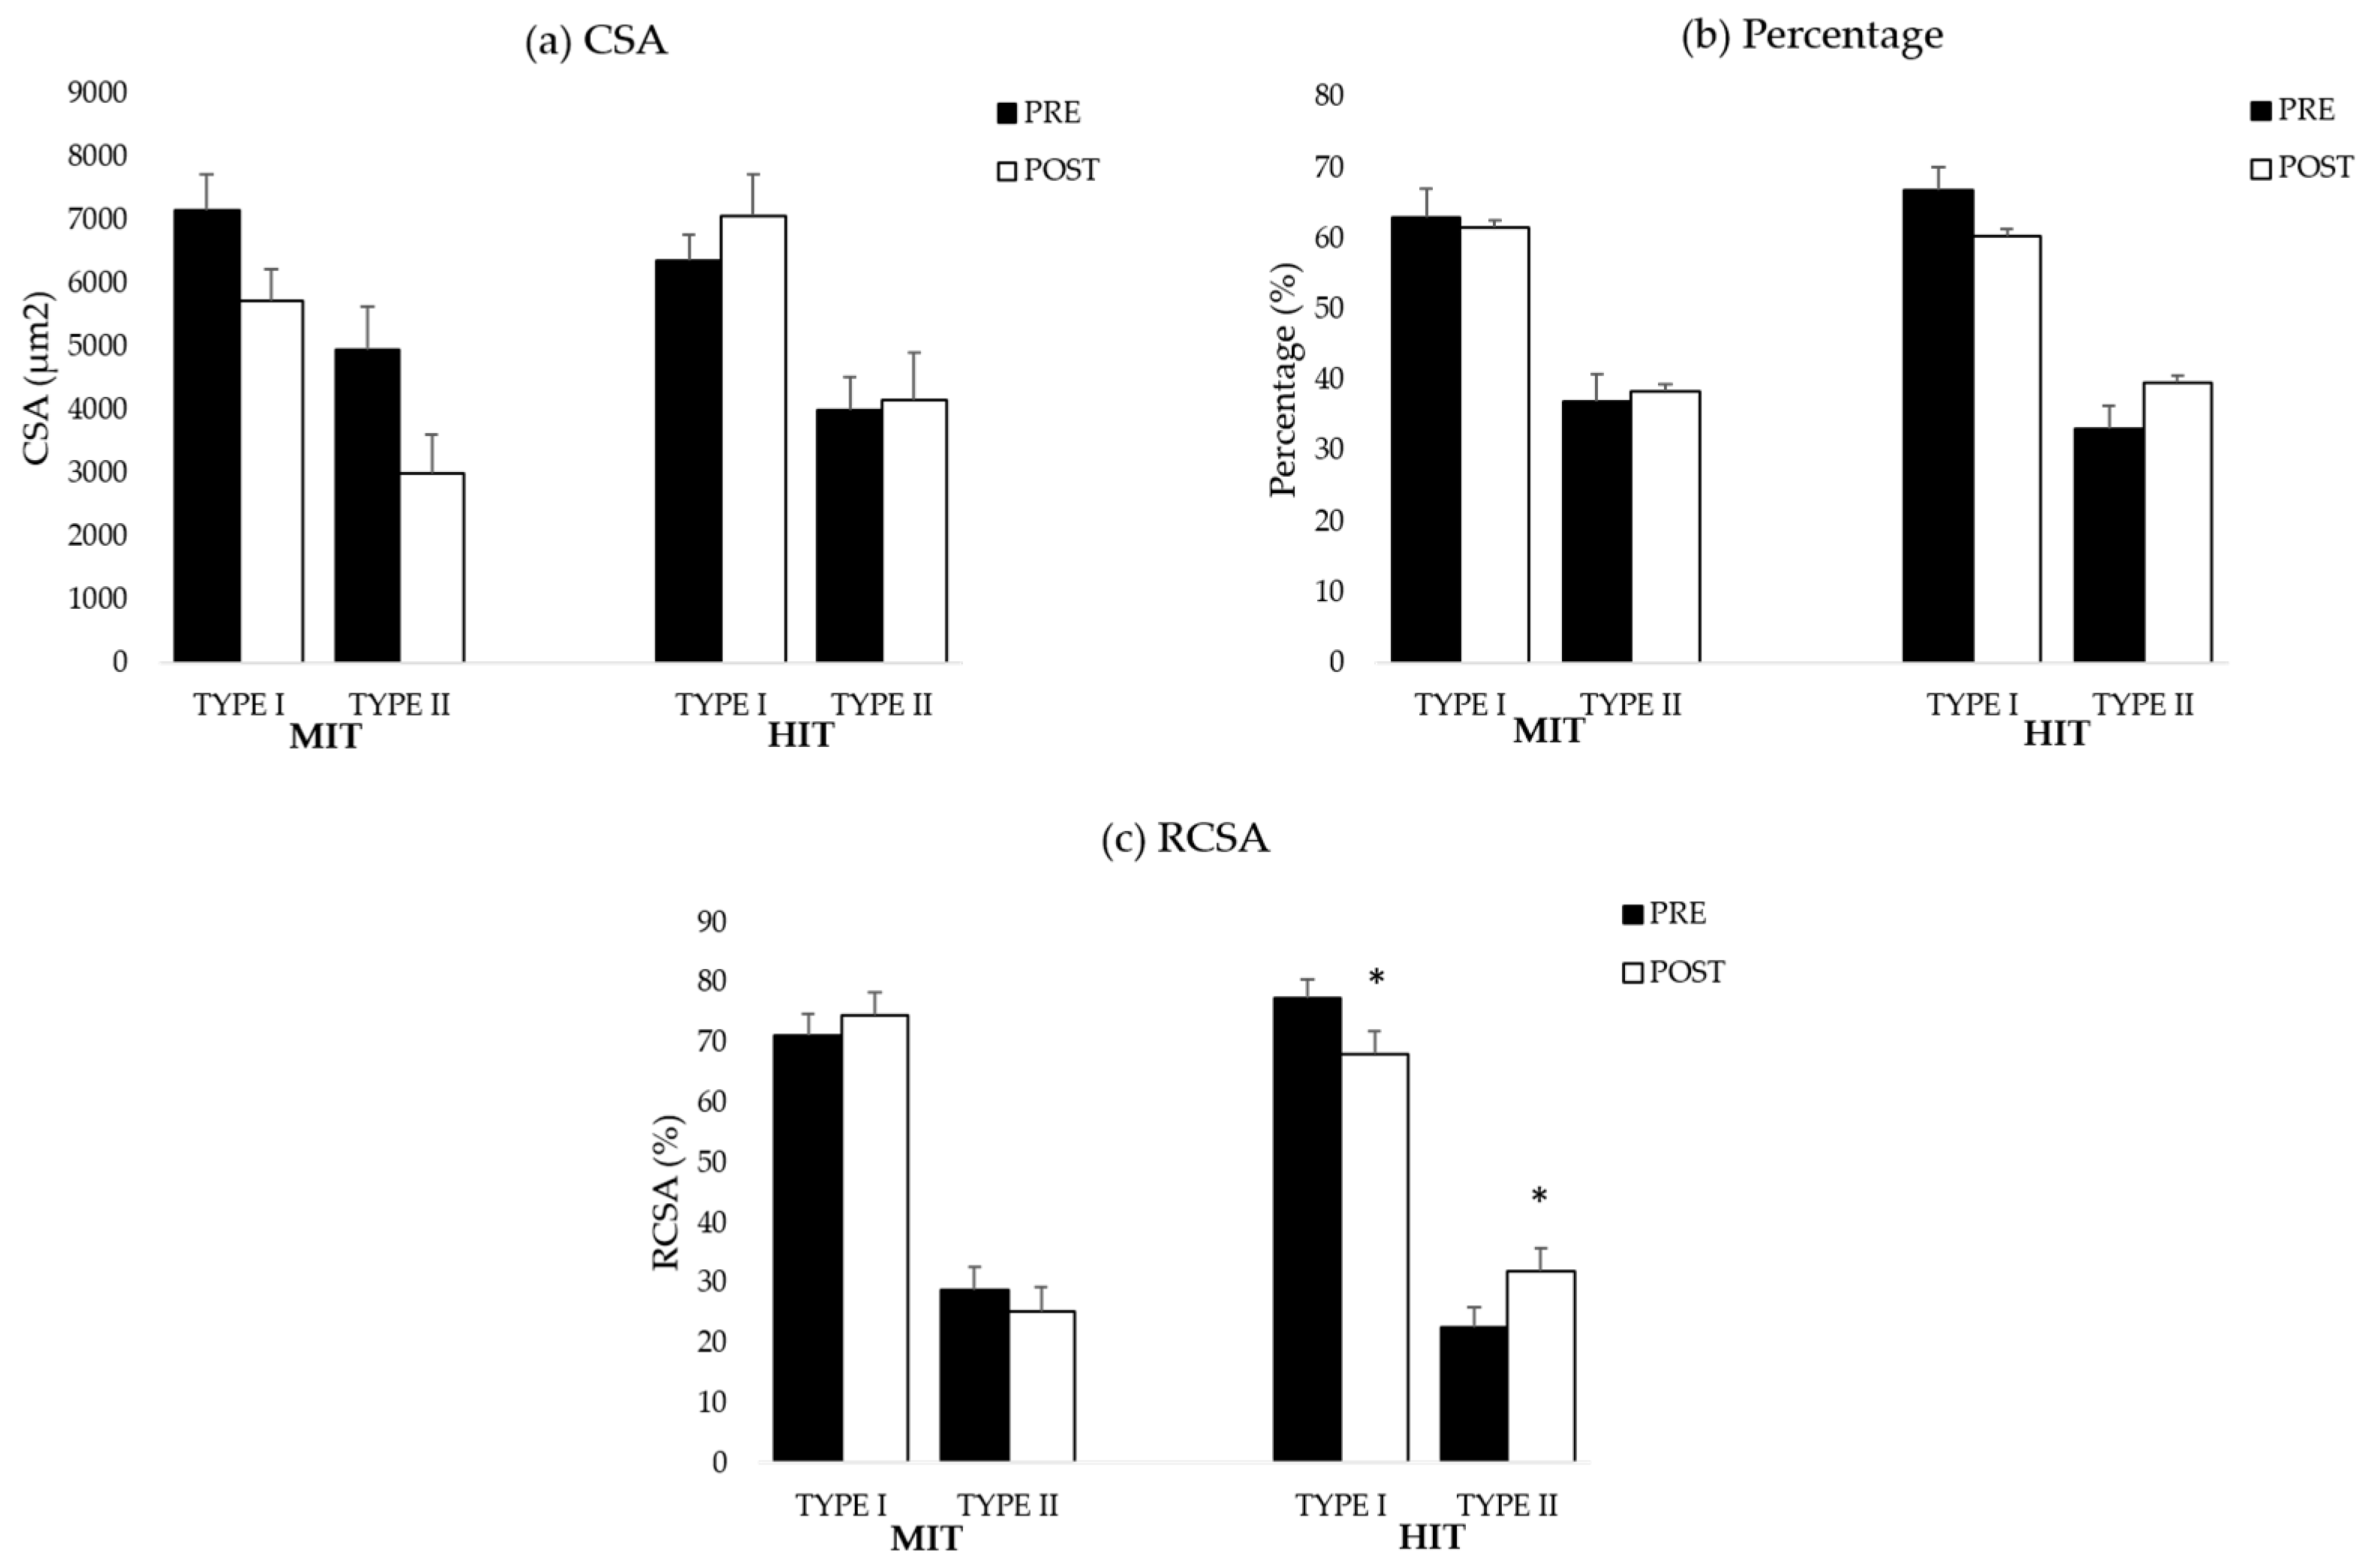
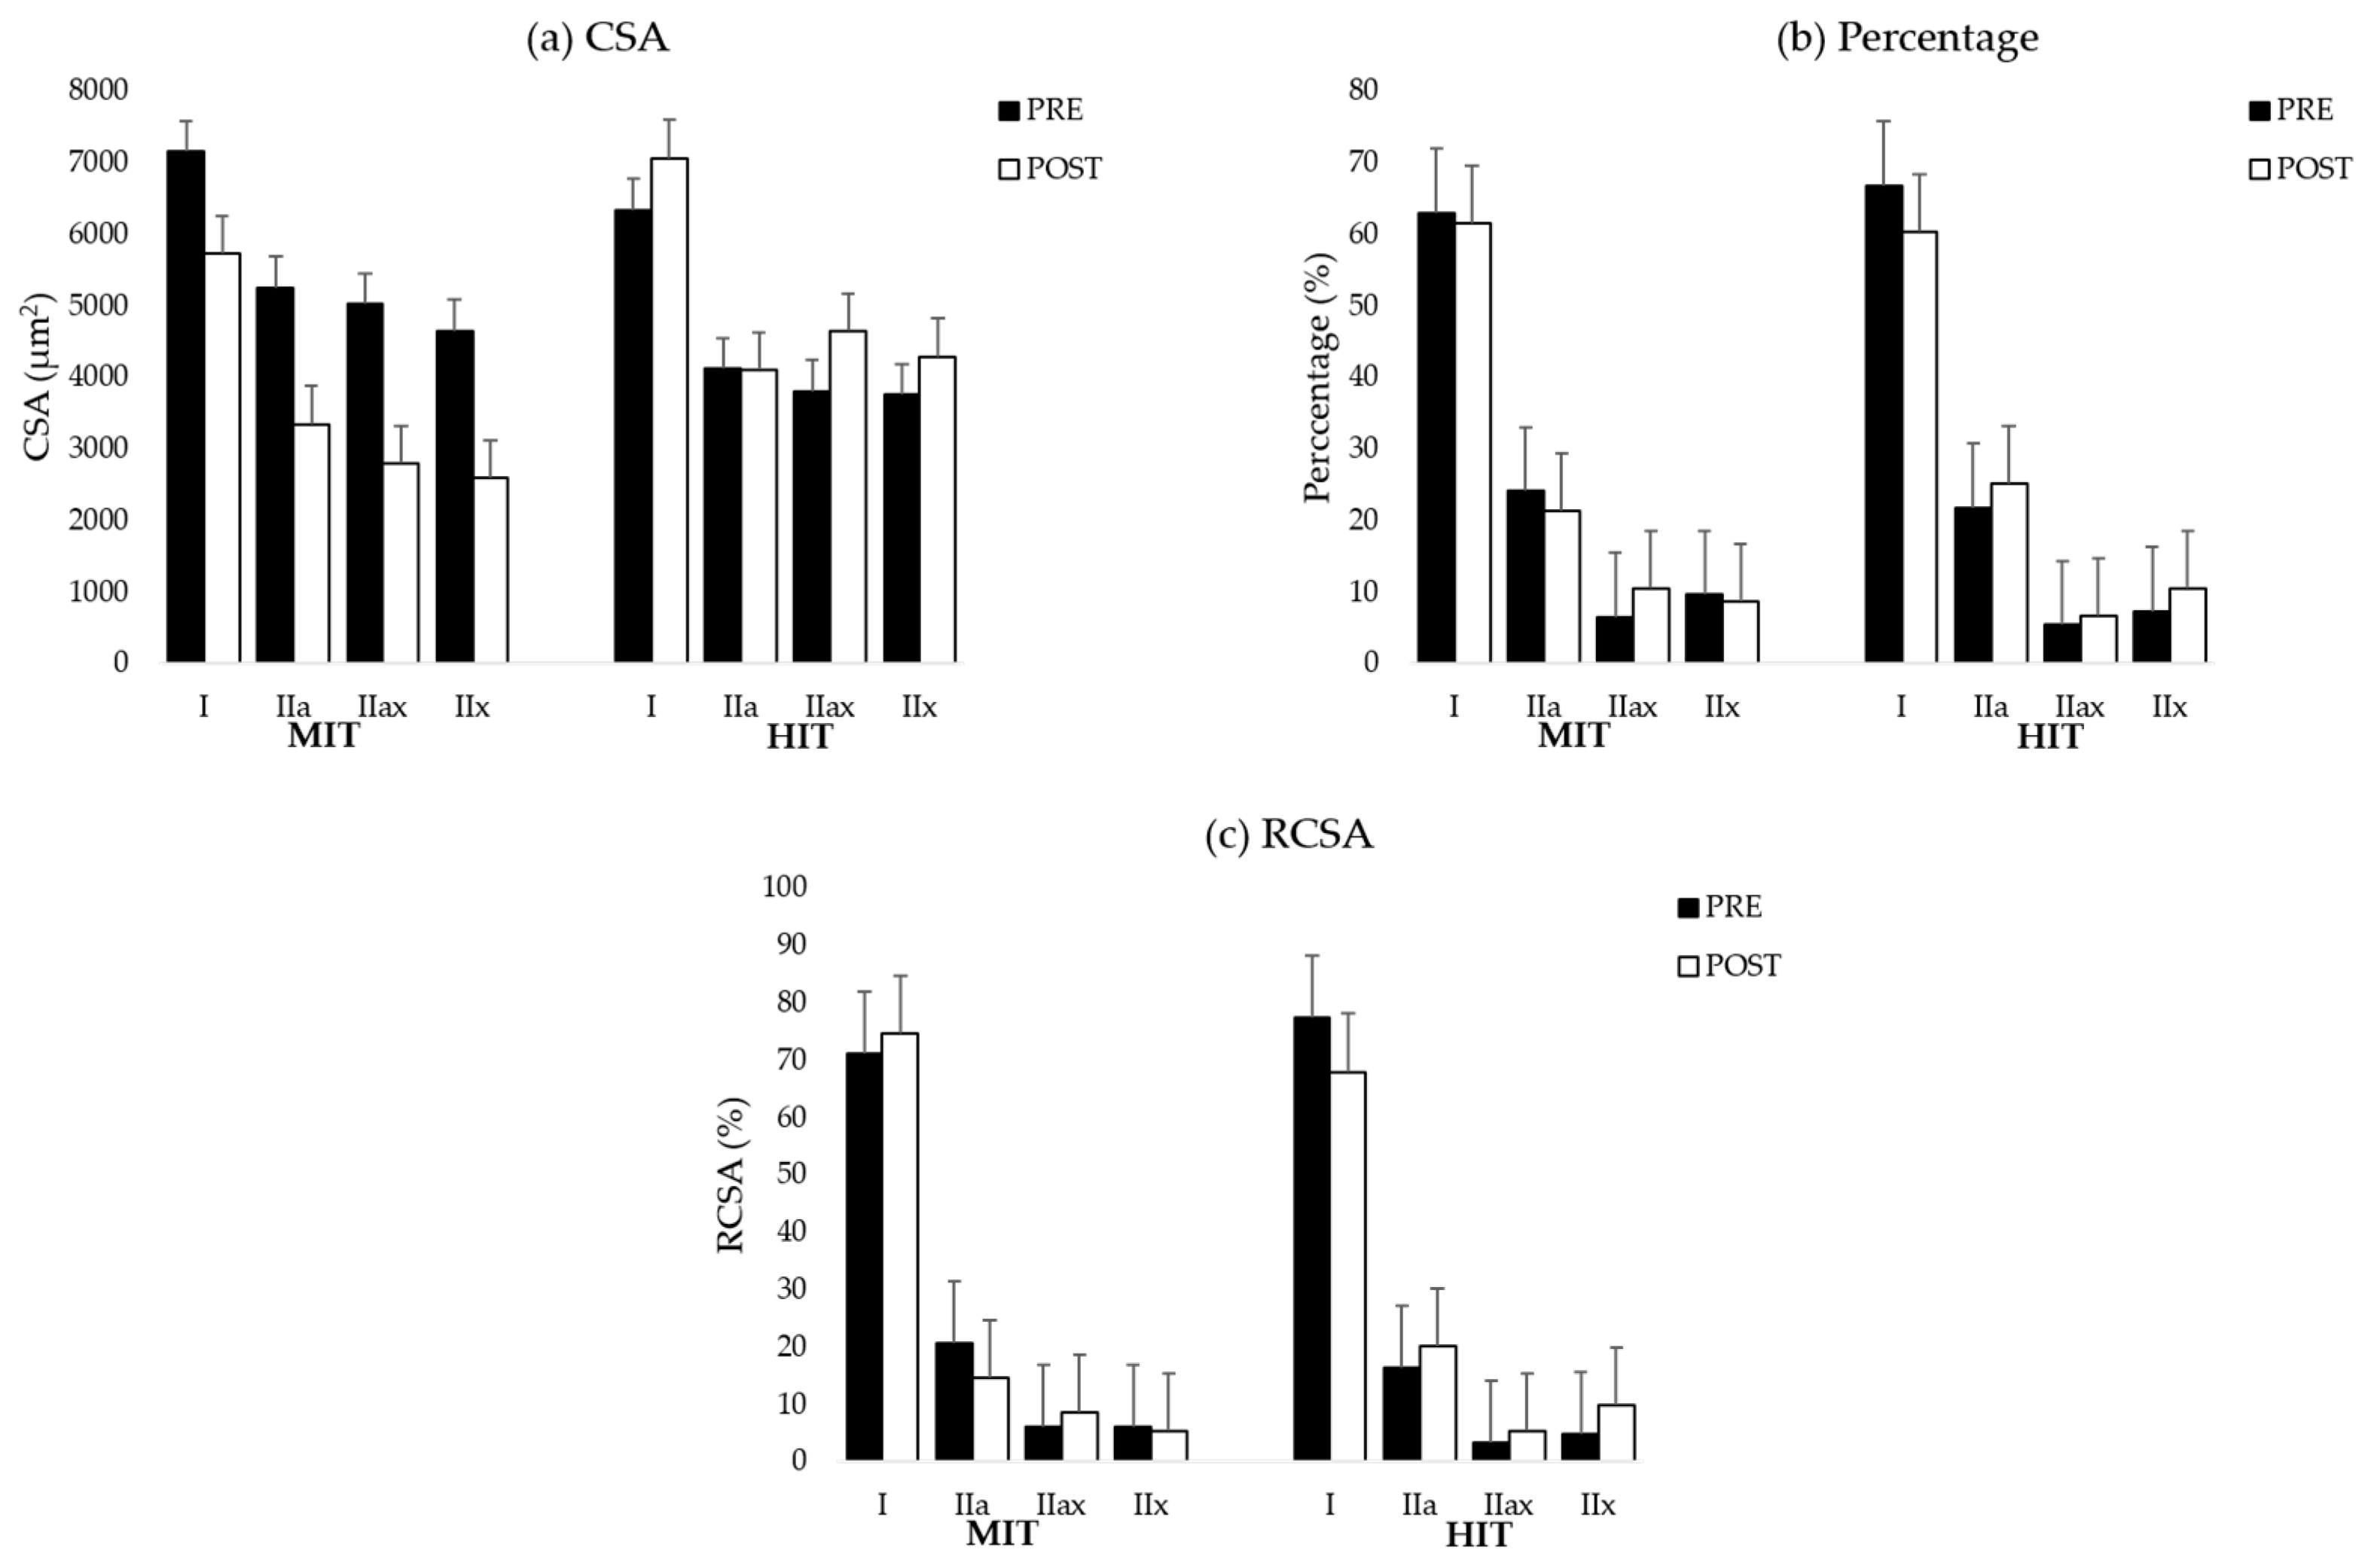
38]. For the analysis and to reach sufficient power, all type II fibers within each sample were pooled. Muscle fiber type I/IIa was not found in the samples. The graphs for all muscle fiber types are shown in Figure A1 (ES) and Figure A2 (MF) and detailed values are shown in Table A1, Table A2 and Table A3 (ES) and Table A4, Table A5 and Table A6 (MF). To analyze a representative sample of the entire muscle, on average, 220 ± 75 muscle fibers were counted in the biopsy samples obtained from the ES and 228 ± 84.51 in the biopsy samples collected from the MF.
Secondary outcomes:
Demographic data
The following demographic data were collected before the start of the intervention: age (years), gender, length (cm) and weight (kg). BMI was calculated. The following clinical characteristics were collected before the start of the intervention with standardized questionnaires: physical activity (by the Physical Activity Scale for Individuals with Physical Disabilities (PASIPD)) and pain (by the Numeric Pain Rating Score (NPRS)).
Blood collection, processing and hormone analysis
Venous resting blood samples were obtained from the participants. Blood samples were allowed to clot at room temperature for at least 30 min and centrifuged at 400 g for 10 min. After centrifugation, serum was aliquoted into microfuge tubes and stored at −80 °C by the University Biobank Limburg (UBiLim) until further analysis. Serum samples were analyzed for human GH and IGF-1 by electrochemiluminescence (Roche Diagnostics Cobas E801 Immunoassay analyser; Roche) in the clinical laboratory of the Jessa Hospital (Hasselt, Belgium).
Data analysis
JMP® Pro 14.1.0 software (SAS Institute Inc., Cary, NC, USA, 1989–2007) was used for data analysis. Data samples for age, length, weight, BMI, PASIPD and NPRS were analyzed with the Wilcoxon rank sum test. Gender differences were analyzed using a Chi-square test.
Primary and secondary outcomes were analyzed using JMP® Pro 14.1.0 software (SAS Institute Inc., Cary, NC, USA, 1989–2007). For the muscle fiber characteristics, a mixed model analysis of variance (ANOVA) was performed with timepoint x intervention group interaction. When the interaction effect was significant, a post-hoc student t-test was performed to assess changes over time. By using this statistical model, missing data were estimated. Normality of the data was checked using the normal quartile plots calculated from the conditional residuals. For the hormone serum levels, a signed rank test was performed. Significance was set at 5% point with a confidence interval of 95%.

3. Results

3.1. Participants

In total, 38 participants were included in the study (HIT: n = 19; MIT: n = 19). However, biopsy samples were obtained in a subgroup. Technical issues during the muscle biopsy procedure or during the analysis of the samples resulted in an inclusion of 33 participants whose muscle samples of the ES were analyzed (16 in the MIT group, 17 in the HIT group), and 28 participants whose muscle samples of the MF were analyzed (13 in the MIT group, 15 in the HIT group). The different intervention groups had similar anthropometric and clinical characteristics at baseline (p > 0.05). An overview of patient characteristics is displayed for the whole cohort. There was no significant difference between the subgroup from whom muscle biopsy samples were obtained and the whole cohort from which they were drawn for any of the parameters described in Table 1.

3.2. Muscle Fiber Characteristics of the ES

There were no significant changes in muscle fiber CSA, percentage and RCSA of the ES muscle after 12 weeks of exercise training in both intervention groups (Figure 2a–c). Detailed values for the mixed model ANOVA are displayed in Appendix A Table A1, Table A2 and Table A3.

3.3. Muscle Fiber Characteristics of the MF

3.3.1. CSA

For the MF, there were no significant changes in muscle fiber size in both intervention groups (Figure 3a).

3.3.2. Muscle fiber type percentage

There were no significant changes in the muscle fiber type percentage in both intervention groups (Figure 3b).

3.3.3. RCSA

After 12 weeks of training at high intensity (HIT group), there was a significant decrease in RCSA of type I muscle fibers (p = 0.0252) and an increase in RCSA of type II muscle fibers (p = 0.0269). These changes were not found in the MIT group (Figure 3c).
Detailed values for the mixed model ANOVA are displayed in Appendix A, Table A4, Table A5 and Table A6.
Serum hormone levels
There were no significant changes in IGF-1 serum levels after 12 weeks of training in both groups. In the HIT group, there was a significant decrease in GH serum levels after the exercise training program, while no changes were found in the MIT group.

4. Discussion

This pilot study evaluated changes in paraspinal muscle fiber characteristics in response to a combined training program consisting of a cardiorespiratory, general full body resistance and core muscle training protocol at different intensities (high intensity vs. moderate intensity). We hypothesized that there would be an increase in muscle fiber size combined with a shift towards a more glycolytic muscle profile in the ES and MF after HIT. However, our data demonstrate that biopsy samples of the MF of participants in the HIT group have a larger muscle area occupied by type II fibers (higher RCSA) in response to the training program. In contrast to our hypothesis, we found that on average, muscle biopsies of the ES and MF did not demonstrate increased muscle fiber CSA in both intervention groups.
Muscle fiber characteristics
Participants in both intervention groups of this randomized controlled trial showed improved back muscle strength, without differences between groups [24]. Despite this increased back muscle strength, our data could not demonstrate significant changes in muscle fiber CSA. According to our knowledge, there are only two studies that have investigated the effect of exercise training on muscle fiber characteristics in patients with low back pain: Käser et al. [39], who focused on the ES, and Rissanen et al. [40], who investigated the MF. Our results are in line with the study of Käser et al., who also found no differences in the muscle fiber size of the ES [39] in response to different low to moderate intense exercise programs, although there was an increase in back muscle strength [41]. In contrast, Rissanen et al. [40] found an increase in the size of type II muscle fibers of the MF after a three-month high intensity training. A possible explanation for these differences is that the type II muscle fibers were atrophic at baseline in the study of Rissanen et al. [40], while in our study [14] and the study of Käser et al. [39], the muscle fiber CSA was comparable to those of healthy controls. Since it is well known that atrophic muscle fibers are more prone to muscle fiber hypertrophy induced by exercise training, this could explain the increase in muscle fiber size of type II fibers in the study of Rissanen et al. [40]. The increase in muscle strength could result from a higher proportional area occupied by type II muscle fibers, since these fibers produce greater force [42,43]. Rissanen et al. [40] found no differences in muscle fiber type distribution for the MF after a three-month training program at high intensity and Käser et al. [39] found no differences in muscle fiber type distribution for the ES after low to moderated exercise programs. These results are in line with our results, since we could also not demonstrate significant changes in muscle fiber distribution. However, our results showed that a training program at high intensity resulted in an increase in RCSA of type II muscle fibers, while these changes were not found after a training program at moderate intensity. This increase in RCSA of type II fibers results in a shift towards a more glycolytic profile. During resistance training, motor units, and hence muscle fibers, are recruited according to the ‘size-principle.’ Smaller motor units are associated with type I fibers, while larger motor units are associated with type II fibers. According to the ‘size-principle,’ type I muscle fibers are recruited at lower intensity exercises and type II muscle fibers at high intensity exercises [44]. Therefore, training at high intensity increases the muscle area occupied by type II fibers. This might explain why we could only find an increase in RCSA of type II after HIT.
There are two other mechanisms that could contribute to an increased muscle strength while the muscle fiber size remains stable. First, there may be an increase in myofibrillar density. As such, the number of cross-bridges, acting in parallel to generate a contraction, increases independently of any increase in muscle fiber [45]. A second mechanism to explain an improvement in muscle strength, without an increase in muscle fiber CSA, suggests that the force generated by each cross-bridge would increase [45]. However, these mechanisms are difficult to investigate on a microscopic level.
At baseline, we demonstrated that biopsy samples of the paraspinal muscles contain less glycolytic muscle fibers compared to healthy controls [14]. This suggests that a 12-week combined training program, consisting of a cardiorespiratory, general full body resistance and core muscle training protocol at high intensity could counteract the muscle fiber shift that was observed in NSCLBP, at least for the MF. Although Ekstrom et al. [46] stated that the MF and ES were activated similarly during core muscle exercises, Arokoski et al. [47] demonstrated higher activation of the MF compared to the ES during core muscle training. In addition, in our core muscle training protocol, participants were educated in the first sessions on isolated activation of the MF to minimize compensatory muscle work during the exercises. This might have resulted in a higher activation of the MF compared to the ES, which warrants the conclusion that muscle fiber adaptations in response to HIT would probably be more apparent in the MF.
Interrelationships between muscle fiber alterations and clinical improvements after training
Participants of this randomized controlled trial showed improvements in disability, exercise capacity and pain in both intervention groups. The improvements in disability and exercise capacity were greater in participants in the HIT group compared to the participants in the MIT group [24]. This implies that rehabilitation of participants with NSCLBP would reduce pain and disability, with a greater effect for rehabilitation at high intensity. Despite these clinical improvements, we could only demonstrate a muscle fiber shift towards a more glycolytic (type II) profile in the MF in response to HIT. As training at moderate intensity provided lower effect sizes for clinical outcomes [24] and did not result in changes in muscle fiber characteristics, the physiological effects of the increased intensity could have caused the increased effectiveness. However, no other changes in muscle morphology, such as muscle fiber hypertrophy, could be observed. A possible explanation for the lack of changes in muscle fiber CSA could be the fact that participants in our study were recruited by local advertisement. This type of advertisement may have attracted a group of participants who are more than average physically active in daily life, which might correlate with the fact that we could not observe a difference in muscle fiber CSA between healthy controls and persons with NSCLBP [14]. However, this hypothesis cannot be substantiated, because physical activity was not measured. The clinical improvements in the HIT group of our previous study (within the same cohort) exceeded clinically relevant cutoff values, which underlines the clinical importance of treatment effects [24]. It is unknown if these positive effects of HIT remain after cessation of the training; therefore, it is important that future studies address the long-term effects of HIT.
Hormone levels
Our study demonstrated no changes in IGF-1 serum levels after a 12-week training protocol, while there was a decrease in GH after a training period at high intensity. Several studies have found that serum GH levels increase acutely after a single exercise bout [48,49,50]. However, the effect of a longer training period on GH serum levels is not very clear. Traditionally, no long-term changes in resting GH after a training period are reported [51,52,53,54,55]. However, GH serum levels were significantly elevated immediately after exercise, but returned to normal levels one to two hours after exercise [30]. The results of the present study must be interpreted carefully, since we only measured resting GH serum levels. Most studies have measured at multiple timepoint and investigated the GH response to training. The pulsatile and circadian pattern of GH secretion make it more difficult to interpret one timepoint measures.
IGF-1 serum level is much more stable, and therefore, a better functional measurement of the GH-IFG-1 axis. IGF-1 is regulated by GH and might enhance protein synthesis, and hence, an increase in muscle CSA [31]. No change in resting IGF-1 serum levels have been reported in short term training programs [54,55]. However, long-term studies have shown elevations in resting IGF-1 levels [33,34]. Furthermore, the resting IGF-1 concentrations were also higher in trained men compared to untrained men [56]. Our study protocol consisted of a 12-week training program, which might be too short to find elevated IGF-1 serum levels, since the changes in serum IGF-1 are typically increased after 4–6 months of training and not yet after 3 months [33,34]. These unchanged levels of IGF-1 warrant the finding that we did not find an increase in muscle fiber CSA.
Limitations of the study
The results of this study must be interpreted carefully, since we only studied muscle fiber characteristics on a microscopical level in muscle samples taken by a fine-needle biopsy technique. Therefore, our results cannot directly affirm that there is no paraspinal muscle hypertrophy in response to a combined training protocol at all, neither at moderate intensity nor at high intensity. Since skeletal muscle hypertrophy can reside in the connective tissue (connective tissue hypertrophy), the myofibril (myofibrillar hypertrophy) or the sarcoplasm (sarcoplasmic hypertrophy), additional molecular analyses are needed to make a statement about a possible muscle hypertrophy [57]. Additionally, by using biopsy samples, there will always be some variation in the muscle fiber characteristics between different sampling sites in a muscle. If only one biopsy samples was obtained from a single muscle, at least 100 muscle fibers should be analyzed to achieve a representative sample for the entire muscle and to minimize sampling errors [58]. In our study, the mean number of fibers analyzed was 220 ± 75 for the ES and 228 ± 84.51 for the MF, which should be adequate for valid statistical conclusions. The intramuscular and interindividual variability of muscle fiber composition is relatively high, which makes it difficult to make firm conclusions only with result of muscle fiber characteristics. The heterogeneity of the persons with NSCLBP in our study and the relatively small sample size make it difficult to generalize the present findings to the average person with NSCLBP. Therefore, these results can be used as pilot data to think about the effect of training on paraspinal muscle fiber characteristics and optimize treatment strategy for NSCLBP.

5. Conclusions

This was the first study to investigate the differences between the effect of a combined training program at moderate or at high intensity on paraspinal muscle fiber characteristics. Under the conditions of the present study, a 12-week HIT program consisting of cardiorespiratory interval, general resistance and core muscle training could counteract the muscle fiber shift in the MF that was observed in low back pain. Training at moderate intensity did not induce a muscle fiber shift, which might suggest that the physiological effects of increased intensity could have caused the increased effectiveness. Future studies should focus on the long-term effects of HIT on both muscle fiber characteristics, as well as on clinical outcomes.

Author Contributions

B.O.E., A.T., J.V., S.S., F.V. and A.A. contributed to the conception and methodology of the study. J.V., S.S. and A.A. contributed to data acquisition. A.A., S.S. and F.V. contributed to data analysis. A.A. was a major contributor to writing the original draft. B.O.E., S.S., J.V., A.T. and F.V. contributed to reviewing and editing the manuscript. Supervision was performed by B.O.E., A.T. and F.V. All authors have read and agreed to the published version of the manuscript.

Funding

This research received no external funding.

Institutional Review Board Statement

The study was conducted according to the guidelines of the Declaration of Helsinki and approved by the Ethical Committee of Hasselt University and Jessa Hospital Hasselt under protocol name 15.142/REVA15.14 (date of approval: 10 February 2016).

Informed Consent Statement

Informed consent was obtained from all subjects involved in the study.

Data Availability Statement

The data presented in this study are available on request from the corresponding author.

Conflicts of Interest

The authors declare no conflict of interest.

Appendix A

Figure A1. Results of the mixed model analysis of variances. Figure A1 displays the results for (a) the cross-sectional area (CSA) in µm2, (b) the fiber type number in % and (c) the relative cross-sectional area (RCSA) in % between baseline and after 12 weeks of training for both groups within the erector spinae muscle for all muscle fiber subtypes. Black graphs represent pre-values; white values represent post-values. Values are represented as means ± standard error.
Applsci 11 03306 g0a1
Figure A2. Results of the mixed model analysis of variances. Figure A1 displays the results for (a) the cross-sectional area (CSA) in µm2, (b) the fiber type number in % and (c) the relative cross-sectional area (RCSA) in % between baseline and after 12 weeks of training for both groups within the multifidus muscle for all muscle fiber subtypes. Black graphs represent pre-values; white values represent post-values. Values are represented as means ± standard error.
Applsci 11 03306 g0a2
Table A1. Results of the mixed model analysis of variances for the cross-sectional area of the erector spinae.
MIT GroupPRE±SEPOST±SEp-Value
CSA type I6621.86566.865467.27483.12No interaction *
CSA type II4273.85684.004419.10601.08No interaction *
  • CSA type IIa
4688.29711.354477.11634.93
  • CSA type IIax
3749.95857.834528.62652.59
  • CSA type IIx
3779.72812.484811.41812.48
HIT GroupPRE±SEPOST±SEp-Value
CSA type I6146.60411.636930.21655.74No interaction *
CSA type II4198.96527.334761.42753.31No interaction *
  • CSA type IIa
4455.83564.924834.64767.25
  • CSA type IIax
4540.34618.623840.93943.45
  • CSA type IIx
4081.75595.854596.701145.46
Values are displayed as mean (in µm2) and standard error (SE). PRE: before the start of the 12-week intervention; POST: after the end of the 12-week intervention; CSA: cross-sectional area. * no significant interaction was found, no post-hoc test.
Table A2. Results of the mixed model analysis of variances for the percentage of the erector spinae.
MIT GroupPRE±SEPOST±SEp-Value
% type I69.053.2969.052.89No interaction *
% type II30.953.2930.952.89No interaction *
  • % type IIa
17.012.5018.022.15
  • % type IIax
8.891.756.561.38
  • % type IIx
10.762.3710.252.37
HIT GroupPRE±SEPOST±SEp-Value
% type I68.042.5371.803.63No interaction *
% type II31.962.5328.203.63No interaction *
  • % type IIa
19.551.8418.652.88
  • % type IIax
6.271.267.991.92
  • % type IIx
9.611.813.553.05
Values are displayed as mean (in %) and standard error (SE). PRE: before the start of the 12-week intervention; POST: after the end of the 12-week intervention. * no significant interaction was found, no post-hoc test.
Table A3. Results of the mixed model analysis of variances for the relative cross-sectional area of the erector spinae.
MIT GroupPRE±SEPOST±SEp-Value
RCSA type I78.683.0573.502.85No interaction *
RCSA type II21.323.0426.502.84No interaction *
  • RCSA type IIa
13.032.3514.532.01
  • RCSA type IIax
6.341.505.621.18
  • RCSA type IIx
7.042.029.572.02
HIT GroupPRE±SEPOST±SEp-Value
RCSA type I76.312.6377.323.14No interaction *
RCSA type II23.592.6322.593.13No interaction *
  • RCSA type IIa
14.601.7214.162.72
  • RCSA type IIax
4.301.805.541.65
  • RCSA type IIx
7.031.573.142.56
Values are displayed as mean (in %) and standard error (SE). PRE: before the start of the 12-week intervention; POST: after the end of the 12-week intervention; RCSA: relative cross-sectional area. * no significant interaction was found, no post-hoc test.
Table A4. Results of the mixed model analysis of variances for the cross-sectional area of the multifidus.
MIT GroupPRE±SEPOST±SEp-Value
CSA type I7158.88686.075728.19736.73No interaction *
CSA type II4935.29563.182997.95607.57No interaction *
  • CSA type IIa
5258.13550.383346.37582.53
  • CSA type IIax
5021.66751.792791.90751.79
  • CSA type IIx
4651.15774.152594.31718.46
HIT GroupPRE±SEPOST±SEp-Value
CSA type I6342.86556.087066.21814.24No interaction *
CSA type II3984.34451.674148.86679.05No interaction *
  • CSA type IIa
4125.27459.844097.39618.50
  • CSA type IIax
3808.58642.594646.30946.16
  • CSA type IIx
3755.41574.674289.79845.52
Values are displayed as mean (in µm2) and standard error (SE). PRE: before the start of the 12-week intervention; POST: after the end of the 12-week intervention; CSA: cross-sectional area. * no significant interaction was found, no post-hoc test.
Table A5. Results of the mixed model analysis of variances for the percentage of the multifidus.
MIT GroupPRE±SEPOST±SEp-Value
% type I63.053.9461.524.17No interaction *
% type II36.953.9438.484.17No interaction *
  • % type IIa
24.143.3721.423.60
  • % type IIax
6.492.0710.422.07
  • % type IIx
9.652.668.682.42
HIT GroupPRE±SEPOST±SEp-Value
% type I66.893.2960.314.41No interaction *
% type II33.113.2939.694.41No interaction *
  • % type IIa
21.812.7625.223.91
  • % type IIax
5.421.696.762.77
  • % type IIx
7.281.8710.603.03
Values are displayed as mean (in %) and standard error (SE). PRE: before the start of the 12-week intervention; POST: after the end of the 12-week intervention. * no significant interaction was found, no post-hoc test.
Table A6. Results of the mixed model analysis of variances for the relative cross-sectional area of the multifidus.
MIT GroupPRE±SEPOST±SEp-Value
RCSA type I71.143.7074.633.840.3832 #
RCSA type II28.933.7125.353.860.3757 #
  • RCSA type IIa
20.553.2814.573.48
  • RCSA type IIax
6.081.198.631.19
  • RCSA type IIx
6.201.995.311.82
HIT GroupPRE±SEPOST±SEp-Value
RCSA type I77.343.2068.003.880.0252 #
RCSA type II22.693.2131.993.900.0269 #
  • RCSA type IIa
16.322.7320.153.68
  • RCSA type IIax
3.291.165.221.23
  • RCSA type IIx
4.751.449.932.21
Values are displayed as mean (in %) and standard error (SE). PRE: before the start of the 12-week intervention; POST: after the end of the 12-week intervention. # significant interaction, student t-test post hoc.

References

  1. Airaksinen, O.; Brox, J.I.; Cedraschi, C.; Hildebrandt, J.; Klaber-Moffett, J.; Kovacs, F.; Mannion, A.F.; Reis, S.; Staal, J.B.; Ursin, H.; et al. Chapter 4. European guidelines for the management of chronic nonspecific low back pain. Eur. Spine J. 2006, 15 (Suppl. 2), S192–S300. [Google Scholar] [CrossRef] [Green Version]
  2. Balague, F.; Mannion, A.F.; Pellise, F.; Cedraschi, C. Non-specific low back pain. Lancet 2012, 379, 482–491. [Google Scholar] [CrossRef] [Green Version]
  3. Gore, M.; Sadosky, A.; Stacey, B.R.; Tai, K.S.; Leslie, D. The burden of chronic low back pain: Clinical comorbidities, treatment patterns, and health care costs in usual care settings. Spine 2012, 37, E668–E677. [Google Scholar] [CrossRef] [Green Version]
  4. Dagenais, S.; Caro, J.; Haldeman, S. A systematic review of low back pain cost of illness studies in the United States and internationally. Spine J. Off. J. N. Am. Spine Soc. 2008, 8, 8–20. [Google Scholar] [CrossRef] [PubMed]
  5. Mannion, A.F. Fibre type characteristics and function of the human paraspinal muscles: Normal values and changes in association with low back pain. J. Electromyogr. Kinesiol. Off. J. Int. Soc. Electrophysiol. Kinesiol. 1999, 9, 363–377. [Google Scholar] [CrossRef]
  6. Chan, S.T.; Fung, P.K.; Ng, N.Y.; Ngan, T.L.; Chong, M.Y.; Tang, C.N.; He, J.F.; Zheng, Y.P. Dynamic changes of elasticity, cross-sectional area, and fat infiltration of multifidus at different postures in men with chronic low back pain. Spine J. Off. J. N. Am. Spine Soc. 2012, 12, 381–388. [Google Scholar] [CrossRef]
  7. Danneels, L.A.; Vanderstraeten, G.G.; Cambier, D.C.; Witvrouw, E.E.; De Cuyper, H.J. CT imaging of trunk muscles in chronic low back pain patients and healthy control subjects. Eur. Spine J. 2000, 9, 266–272. [Google Scholar] [CrossRef] [PubMed] [Green Version]
  8. Hides, J.; Gilmore, C.; Stanton, W.; Bohlscheid, E. Multifidus size and symmetry among chronic LBP and healthy asymptomatic subjects. Man. Ther. 2008, 13, 43–49. [Google Scholar] [CrossRef] [PubMed]
  9. Wallwork, T.L.; Stanton, W.R.; Freke, M.; Hides, J.A. The effect of chronic low back pain on size and contraction of the lumbar multifidus muscle. Man. Ther. 2009, 14, 496–500. [Google Scholar] [CrossRef] [PubMed]
  10. Kamaz, M.; Kiresi, D.; Oguz, H.; Emlik, D.; Levendoglu, F. CT measurement of trunk muscle areas in patients with chronic low back pain. Diagn. Interv. Radiol. 2007, 13, 144–148. [Google Scholar]
  11. Kjaer, P.; Bendix, T.; Sorensen, J.S.; Korsholm, L.; Leboeuf-Yde, C. Are MRI-defined fat infiltrations in the multifidus muscles associated with low back pain? BMC Med. 2007, 5, 2. [Google Scholar] [CrossRef] [PubMed] [Green Version]
  12. Goubert, D.; Oosterwijck, J.V.; Meeus, M.; Danneels, L. Structural Changes of Lumbar Muscles in Non-specific Low Back Pain: A Systematic Review. Pain Physician 2016, 19, E985–E1000. [Google Scholar]
  13. Crossman, K.; Mahon, M.; Watson, P.J.; Oldham, J.A.; Cooper, R.G. Chronic low back pain-associated paraspinal muscle dysfunction is not the result of a constitutionally determined “adverse” fiber-type composition. Spine 2004, 29, 628–634. [Google Scholar] [CrossRef]
  14. Agten, A.; Stevens, S.; Verbrugghe, J.; Timmermans, A.; Vandenabeele, F. Biopsy samples from the erector spinae of persons with nonspecific chronic low back pain display a decrease in glycolytic muscle fibers. Spine J. 2020, 20, 199–206. [Google Scholar] [CrossRef]
  15. Frontera, W.R.; Ochala, J. Skeletal muscle: A brief review of structure and function. Calcif. Tissue Int. 2015, 96, 183–195. [Google Scholar] [CrossRef]
  16. Van Middelkoop, M.; Rubinstein, S.M.; Verhagen, A.P.; Ostelo, R.W.; Koes, B.W.; van Tulder, M.W. Exercise therapy for chronic nonspecific low-back pain. Best Pract. Res. Clin. Rheumatol. 2010, 24, 193–204. [Google Scholar] [CrossRef]
  17. Pillastrini, P.; Ferrari, S.; Rattin, S.; Cupello, A.; Villafañe, J.H.; Vanti, C. Exercise and tropism of the multifidus muscle in low back pain: A short review. J. Phys. Sci. 2015, 27, 943–945. [Google Scholar] [CrossRef] [PubMed] [Green Version]
  18. Danneels, L.A.; Vanderstraeten, G.G.; Cambier, D.C.; Witvrouw, E.E.; Bourgois, J.; Dankaerts, W.; De Cuyper, H.J. Effects of three different training modalities on the cross sectional area of the lumbar multifidus muscle in patients with chronic low back pain. Br. J. Sports Med. 2001, 35, 186–191. [Google Scholar] [CrossRef] [PubMed] [Green Version]
  19. Coulombe, B.J.; Games, K.E.; Neil, E.R.; Eberman, L.E. Core Stability Exercise Versus General Exercise for Chronic Low Back Pain. J. Athl. Train. 2017, 52, 71–72. [Google Scholar] [CrossRef]
  20. Caiozzo, V.J. Plasticity of skeletal muscle phenotype: Mechanical consequences. Muscle Nerve 2002, 26, 740–768. [Google Scholar] [CrossRef] [PubMed]
  21. Schiaffino, S.; Reggiani, C. Molecular diversity of myofibrillar proteins: Gene regulation and functional significance. Physiol. Rev. 1996, 76, 371–423. [Google Scholar] [CrossRef] [PubMed]
  22. Scott, W.; Stevens, J.; Binder-Macleod, S.A. Human skeletal muscle fiber type classifications. Phys. Ther. 2001, 81, 1810–1816. [Google Scholar] [CrossRef]
  23. Searle, A.; Spink, M.; Ho, A.; Chuter, V. Exercise interventions for the treatment of chronic low back pain: A systematic review and meta-analysis of randomised controlled trials. Clin. Rehabil. 2015, 29, 1155–1167. [Google Scholar] [CrossRef]
  24. Verbrugghe, J.; Agten, A.; Stevens, S.; Hansen, D.; Demoulin, C.B.O.E.; Vandenabeele, F.; Timmermans, A. Exercise Intensity Matters in Chronic Nonspecific Low Back Pain Rehabilitation. Med. Sci. Sports Exerc. 2019, 51, 2434–2442. [Google Scholar] [CrossRef]
  25. Danneels, L.A.; Cools, A.M.; Vanderstraeten, G.G.; Cambier, D.C.; Witvrouw, E.E.; Bourgois, J.; de Cuyper, H.J. The effects of three different training modalities on the cross-sectional area of the paravertebral muscles. Scand. J. Med. Sci. Sports 2001, 11, 335–341. [Google Scholar] [CrossRef] [PubMed]
  26. Willemink, M.J.; van Es, H.W.; Helmhout, P.H.; Diederik, A.L.; Kelder, J.C.; van Heesewijk, J.P. The effects of dynamic isolated lumbar extensor training on lumbar multifidus functional cross-sectional area and functional status of patients with chronic nonspecific low back pain. Spine 2012, 37, E1651–E1658. [Google Scholar] [CrossRef] [Green Version]
  27. Mooney, V.; Gulick, J.; Perlman, M.; Levy, D.; Pozos, R.; Leggett, S.; Resnick, D. Relationships between myoelectric activity, strength, and MRI of lumbar extensor muscles in back pain patients and normal subjects. J. Spinal Disord. 1997, 10, 348–356. [Google Scholar] [CrossRef]
  28. Kliziene, I.; Sipaviciene, S.; Klizas, S.; Imbrasiene, D. Effects of core stability exercises on multifidus muscles in healthy women and women with chronic low-back pain. J. Back Musculoskelet. Rehabil. 2015, 28, 841–847. [Google Scholar] [CrossRef]
  29. Shahtahmassebi, B.; Hebert, J.J.; Stomski, N.J.; Hecimovich, M.; Fairchild, T.J. The effect of exercise training on lower trunk muscle morphology. Sports Med. 2014, 44, 1439–1458. [Google Scholar] [CrossRef] [PubMed]
  30. Kraemer, W.J.; Ratamess, N.A.; Hymer, W.C.; Nindl, B.C.; Fragala, M.S. Growth Hormone(s), Testosterone, Insulin-Like Growth Factors, and Cortisol: Roles and Integration for Cellular Development and Growth With Exercise. Front. Endocrinol. 2020, 11, 33. [Google Scholar] [CrossRef] [PubMed]
  31. Brabant, G.; Wallaschofski, H. Normal levels of serum IGF-I: Determinants and validity of current reference ranges. Pituitary 2007, 10, 129–133. [Google Scholar] [CrossRef] [PubMed]
  32. Xu, J.; Casserly, E.; Yin, Y.; Cheng, J. A Systematic Review of Growth Hormone in Pain Medicine: From Rodents to Humans. Pain Med. 2020, 21, 21–31. [Google Scholar] [CrossRef]
  33. Koziris, L.P.; Hickson, R.C.; Chatterton, R.T., Jr.; Groseth, R.T.; Christie, J.M.; Goldflies, D.G.; Unterman, T.G. Serum levels of total and free IGF-I and IGFBP-3 are increased and maintained in long-term training. J. Appl. Physiol. 1999, 86, 1436–1442. [Google Scholar] [CrossRef]
  34. Marx, J.O.; Ratamess, N.A.; Nindl, B.C.; Gotshalk, L.A.; Volek, J.S.; Dohi, K.; Bush, J.A.; Gómez, A.L.; Mazzetti, S.A.; Fleck, S.J.; et al. Low-volume circuit versus high-volume periodized resistance training in women. Med. Sci. Sports Exerc. 2001, 33, 635–643. [Google Scholar] [CrossRef]
  35. Meng, X.G.; Yue, S.W. Efficacy of aerobic exercise for treatment of chronic low back pain: A meta-analysis. Am. J. Phys. Med. Rehabil. 2015, 94, 358–365. [Google Scholar] [CrossRef] [PubMed]
  36. Agten, A.; Verbrugghe, J.; Stevens, S.; Boomgaert, L.B.O.E.; Timmermans, A.; Vandenabeele, F. Feasibility, accuracy and safety of a percutaneous fine-needle biopsy technique to obtain qualitative muscle samples of the lumbar multifidus and erector spinae muscle in persons with low back pain. J. Anat. 2018, 233, 542–551. [Google Scholar] [CrossRef]
  37. Bloemberg, D.; Quadrilatero, J. Rapid determination of myosin heavy chain expression in rat, mouse, and human skeletal muscle using multicolor immunofluorescence analysis. PLoS ONE 2012, 7, e35273. [Google Scholar] [CrossRef] [PubMed]
  38. Mannion, A.F.; Dumas, G.A.; Cooper, R.G.; Espinosa, F.J.; Faris, M.W.; Stevenson, J.M. Muscle fibre size and type distribution in thoracic and lumbar regions of erector spinae in healthy subjects without low back pain: Normal values and sex differences. J. Anat. 1997, 190 Pt 4, 505–513. [Google Scholar] [CrossRef]
  39. Käser, L.; Mannion, A.F.; Rhyner, A.; Weber, E.; Dvorak, J.; Müntener, M. Active therapy for chronic low back pain: Part 2. Effects on paraspinal muscle cross-sectional area, fiber type size, and distribution. Spine 2001, 26, 909–919. [Google Scholar] [CrossRef]
  40. Rissanen, A.; Kalimo, H.; Alaranta, H. Effect of intensive training on the isokinetic strength and structure of lumbar muscles in patients with chronic low back pain. Spine 1995, 20, 333–340. [Google Scholar] [CrossRef] [PubMed]
  41. Mannion, A.F.; Taimela, S.; Müntener, M.; Dvorak, J. Active therapy for chronic low back pain part 1. Effects on back muscle activation, fatigability, and strength. Spine 2001, 26, 897–908. [Google Scholar] [CrossRef] [PubMed]
  42. Tesch, P.; Karlsson, J. Isometric strength performance and muscle fibre type distribution in man. Acta Physiol. Scand. 1978, 103, 47–51. [Google Scholar] [CrossRef] [PubMed]
  43. Young, A. The relative isometric strength of type I and type II muscle fibres in the human quadriceps. Clin. Physiol. 1984, 4, 23–32. [Google Scholar] [CrossRef]
  44. Pearson, S.J.; Hussain, S.R. A review on the mechanisms of blood-flow restriction resistance training-induced muscle hypertrophy. Sports Med. 2015, 45, 187–200. [Google Scholar] [CrossRef]
  45. Fitts, R.H.; Widrick, J.J. Muscle mechanics: Adaptations with exercise-training. Exerc. Sport Sci. Rev. 1996, 24, 427–473. [Google Scholar] [CrossRef]
  46. Ekstrom, R.A.; Osborn, R.W.; Hauer, P.L. Surface electromyographic analysis of the low back muscles during rehabilitation exercises. J. Orthop. Sports Phys. 2008, 38, 736–745. [Google Scholar] [CrossRef] [PubMed]
  47. Arokoski, J.P.; Kankaanpää, M.; Valta, T.; Juvonen, I.; Partanen, J.; Taimela, S.; Lindgren, K.A.; Airaksinen, O. Back and hip extensor muscle function during therapeutic exercises. Arch. Phys. Med. Rehabil. 1999, 80, 842–850. [Google Scholar] [CrossRef]
  48. Nindl, B.C.; Kraemer, W.J.; Hymer, W.C. Immunofunctional vs. immunoreactive growth hormone responses after resistance exercise in men and women. Growth Horm. IGF Res. 2000, 10, 99–103. [Google Scholar] [CrossRef]
  49. Wallace, J.D.; Cuneo, R.C.; Bidlingmaier, M.; Lundberg, P.A.; Carlsson, L.; Boguszewski, C.L.; Hay, J.; Healy, M.L.; Napoli, R.; Dall, R.; et al. The response of molecular isoforms of growth hormone to acute exercise in trained adult males. J. Clin. Endocrinol. Metab. 2001, 86, 200–206. [Google Scholar] [CrossRef]
  50. McCall, G.E.; Grindeland, R.E.; Roy, R.R.; Edgerton, V.R. Muscle afferent activity modulates bioassayable growth hormone in human plasma. J. Appl. Physiol. 2000, 89, 1137–1141. [Google Scholar] [CrossRef]
  51. Stokes, K.A.; Nevill, M.E.; Cherry, P.W.; Lakomy, H.K.; Hall, G.M. Effect of 6 weeks of sprint training on growth hormone responses to sprinting. Eur. J. Appl. Physiol. 2004, 92, 26–32. [Google Scholar] [CrossRef]
  52. Sasaki, H.; Morishima, T.; Hasegawa, Y.; Mori, A.; Ijichi, T.; Kurihara, T.; Goto, K. 4 weeks of high-intensity interval training does not alter the exercise-induced growth hormone response in sedentary men. Springerplus 2014, 3, 336. [Google Scholar] [CrossRef] [PubMed] [Green Version]
  53. Mangine, G.T.; Hoffman, J.R.; Gonzalez, A.M.; Townsend, J.R.; Wells, A.J.; Jajtner, A.R.; Beyer, K.S.; Boone, C.H.; Miramonti, A.A.; Wang, R.; et al. The effect of training volume and intensity on improvements in muscular strength and size in resistance-trained men. Physiol. Rep. 2015, 3. [Google Scholar] [CrossRef] [PubMed] [Green Version]
  54. Kraemer, W.J.; Häkkinen, K.; Newton, R.U.; Nindl, B.C.; Volek, J.S.; McCormick, M.; Gotshalk, L.A.; Gordon, S.E.; Fleck, S.J.; Campbell, W.W.; et al. Effects of heavy-resistance training on hormonal response patterns in younger vs. older men. J. Appl. Physiol. 1999, 87, 982–992. [Google Scholar] [CrossRef] [Green Version]
  55. McCall, G.E.; Byrnes, W.C.; Fleck, S.J.; Dickinson, A.; Kraemer, W.J. Acute and chronic hormonal responses to resistance training designed to promote muscle hypertrophy. Can. J. Appl. Physiol. Rev. Can. Physiol. Appl. 1999, 24, 96–107. [Google Scholar] [CrossRef] [PubMed]
  56. Rubin, M.R.; Kraemer, W.J.; Maresh, C.M.; Volek, J.S.; Ratamess, N.A.; Vanheest, J.L.; Silvestre, R.; French, D.N.; Sharman, M.J.; Judelson, D.A.; et al. High-affinity growth hormone binding protein and acute heavy resistance exercise. Med. Sci. Sports Exerc. 2005, 37, 395–403. [Google Scholar] [CrossRef] [Green Version]
  57. Haun, C.T.; Vann, C.G.; Roberts, B.M.; Vigotsky, A.D.; Schoenfeld, B.J.; Roberts, M.D. A Critical Evaluation of the Biological Construct Skeletal Muscle Hypertrophy: Size Matters but So Does the Measurement. Front. Physiol. 2019, 10, 247. [Google Scholar] [CrossRef] [Green Version]
  58. Lexell, J.; Taylor, C.C. Variability in muscle fibre areas in whole human quadriceps muscle: How to reduce sampling errors in biopsy techniques. Clin. Physiol. 1989, 9, 333–343. [Google Scholar] [CrossRef]
Figure 1. CONSORT flowchart of the research design. MIT: moderate intensity training; HIT: high intensity training; ES: erector spinae; MF: multifidus.
Applsci 11 03306 g001
Figure 2. Results of the mixed model analysis of variances. Figure 2 displays the results for (a) the cross sectional area (CSA) in µm2, (b) the fiber type number in % and (c) the relative cross-sectional area (RCSA) in % between baseline and after 12 weeks of training for both groups within the erector spinae (ES) muscle. Black graphs represent the pre-values; white values represent the post-values. Values are represented as means ± standard error. For the MIT group, 16 subjects were analyzed; for the HIT group, 17 subjects were analyzed.
Applsci 11 03306 g002
Figure 3. Results of the mixed model analysis of variances. Figure 3 displays the results for (a) the cross sectional area (CSA) in µm2, (b) the fiber type number in % and (c) the relative cross-sectional area (RCSA) in % between baseline and after 12 weeks of training for both groups within the multifidus (MF) muscle. Black graphs represent the pre-values; white values represent the post-values. Values are represented as means ± standard error. * indicates a significant difference between both groups. For the MIT group, 13 subjects were analyzed; for the HIT group, 15 subjects were analyzed.
Applsci 11 03306 g003
Table 1. Anthropometric data.
MIT (n = 19)HIT (n = 19)p-Value
Age (yr) *43.56 ± 11.1544.67 ± 8.760.9369
Gender (f:m) #13:613:61.0000
Length (m) *1.70 ± 0.101.72 ± 0.090.4197
Weight (kg) *74.93 ± 13.4675.49 ± 16.590.9369
BMI (kg/m2) *25.90 ± 3.6425.36 ± 0.980.4018
PASIPD *15.25± 11.6316.14 ± 10.850.7041
NPRS *5.61 ± 1.755.64 ± 1.380.9361
MIT: moderate intensity training; HIT: high intensity training; PASIPD: physical activities scale for individuals with physical disabilities, NPRS: numeric pain rating score. * Wilcoxon signed rank test. # Chi-square test.
Publisher’s Note: MDPI stays neutral with regard to jurisdictional claims in published maps and institutional affiliations.

