Article

A Metawindow with Optimised Acoustic and Ventilation Performance

1
Acoustics Group, School of Architecture, University of Sheffield, Sheffield S10 2TN, UK
2
Institute of High Performance Computing, A*Star, Singapore 138632, Singapore
3
Shenzhen Campus, School of Aeronautics and Astronautics, Sun Yat-Sen University, Shenzhen 518107, China
4
Institute for Environmental Design and Engineering (IEDE), The Bartlett, University College London, London WC1H 0NN, UK
*
Author to whom correspondence should be addressed.
Appl. Sci. 2021, 11(7), 3168; https://doi.org/10.3390/app11073168
Submission received: 28 January 2021 / Revised: 12 March 2021 / Accepted: 16 March 2021 / Published: 2 April 2021
(This article belongs to the Special Issue Acoustic Metamaterials and Acoustic Foams: Recent Advances)

Abstract

:

Featured Application

A new AMM window simultaneously allows a tunable dual performance of natural ventilation and noise mitigation.

Abstract

Crucial factors in window performance, such as natural ventilation and noise control, are generally conceived separately, forcing users to choose one over the other. To solve this dualism, this study aimed to develop an acoustic metamaterial (AMM) ergonomic window design to allow noise control without dependence on the natural ventilation duration and vice versa. First, the finite element method (FEM) was used to investigate the noise control performance of the acoustic metawindow (AMW) unit, followed by anechoic chamber testing, which also served as the validation of the FEM models. Furthermore, FEM analysis was used to optimise the acoustic performance and assess the ventilation potential. The numerical and experimental results exhibited an overall mean sound reduction of 15 dB within a bandwidth of 380 to 5000 Hz. A good agreement between the measured and numerical results was obtained, with a mean variation of 30%. Therefore, the AMW unit optimised acoustic performance, resulting in a higher noise reduction, especially from 50 to 500 Hz. Finally, most of the AMW unit configurations are suitable for natural ventilation, and a dynamic tuned ventilation capacity can be achieved for particular ranges by adjusting the window’s ventilation opening. The proposed designs have potential applications in building acoustics and engineering where natural ventilation and noise mitigation are required to meet regulations simultaneously.

1. Introduction

Facade insulation to reduce outdoor noise, provisions for ventilation, and overheating mitigation have been commonly considered disconnected in building design development. Strategies involving building features to control these different systems have been developed with entirely separated approaches [1]. Conventional windows, for example, allow visual connection with the outdoors, natural ventilation, and partial acoustics isolation when closed; however, the way these mechanisms work forces the users to choose one function and to exclude the other, and, of course, neither choice is conducive to indoor comfort [2,3,4]. So far, researchers have used several methodologies to overcome both problems by using, for example, mechanical ventilation [5] and active or passive noise control systems [6,7,8,9,10,11,12,13,14]. The latter consume less energy and can be built through several features within the window, such as perforated panels [7,15,16], porous materials [17,18,19], or acoustic metamaterials (AMMs) [20,21,22,23,24,25].
AMMs, in particular, are artificially engineered composite structures with unique acoustic properties derived from the use of modern engineering and physics as they are unlikely to be found in natural materials. Their range of application includes sound absorption [23], noise attenuation [26], acoustic wave manipulation [27], asymmetric acoustic wave propagation [28], acoustic energy harvesting [29], acoustic holography [30], and topological acoustics [31]. Among these, applications to combine noise control with air transmission have received considerable attention from acousticians. Recently they have focused on methods such as resonant-based acoustic meta-absorbers [15,32], subwavelength coiled channel metamaterials [33,34], and a combination of labyrinthine AMMs with porous materials, such as foam and cotton [22]. However, due to their bulky and visually invasive geometrical nature, complex geometries, or relatively narrow bandwidth, they sometimes limit architectural choices, such that the design of thin and visually pleasant metastructures embedded in window systems remains a challenge.
In this study, an acoustic metawindow (AMW) unit for broadband noise control (50 to 5000 Hz) and natural ventilation is presented, and its performance is examined numerically and experimentally. Firstly, since our previous study numerically tested the feasibility of a metacage [35], the ergonomic adaptation of the window is investigated in order to determine the most regular window shape [3] with the closest noise control properties to the previous model [35]. This is not of immediate determination since the previous paper highlighted that acoustic properties are strictly related to the 3D geometry [35]. In this model, the AMM system is incorporated in the window frame space for noise reduction and ventilation, while the central area allows a visual connection between the outdoor and indoor environment. Secondly, the acoustic performance of the AMW unit is investigated experimentally to show the validity of the design. Through the experimental results, our developed numerical model is validated. Thirdly, the influence of geometrical components and parameters is investigated to determine the optimal design setup for the AMW unit in a wider frequency range. A combination of multiple perforations–cavities of different configurations further leads to realising a higher bandwidth noise control range. Finally, the ventilation performance of the AMW unit needs to be investigated, including the acoustically optimised models. The finite element method (FEM) is used for the acoustic and computational fluid dynamic (CFD) analysis, while experimental measurements are set to validate the 3D-printed unit’s acoustic performance.

2. Materials and Methods

The AMW unit’s validity is first numerically determined and then experimentally investigated to demonstrate whether the AMW unit design is performative from an acoustic perspective. The window prototype’s experimental measurements have been run in the anechoic chamber of the acoustics laboratory in the Department of Mechanical Engineering of the National University of Singapore (NUS).

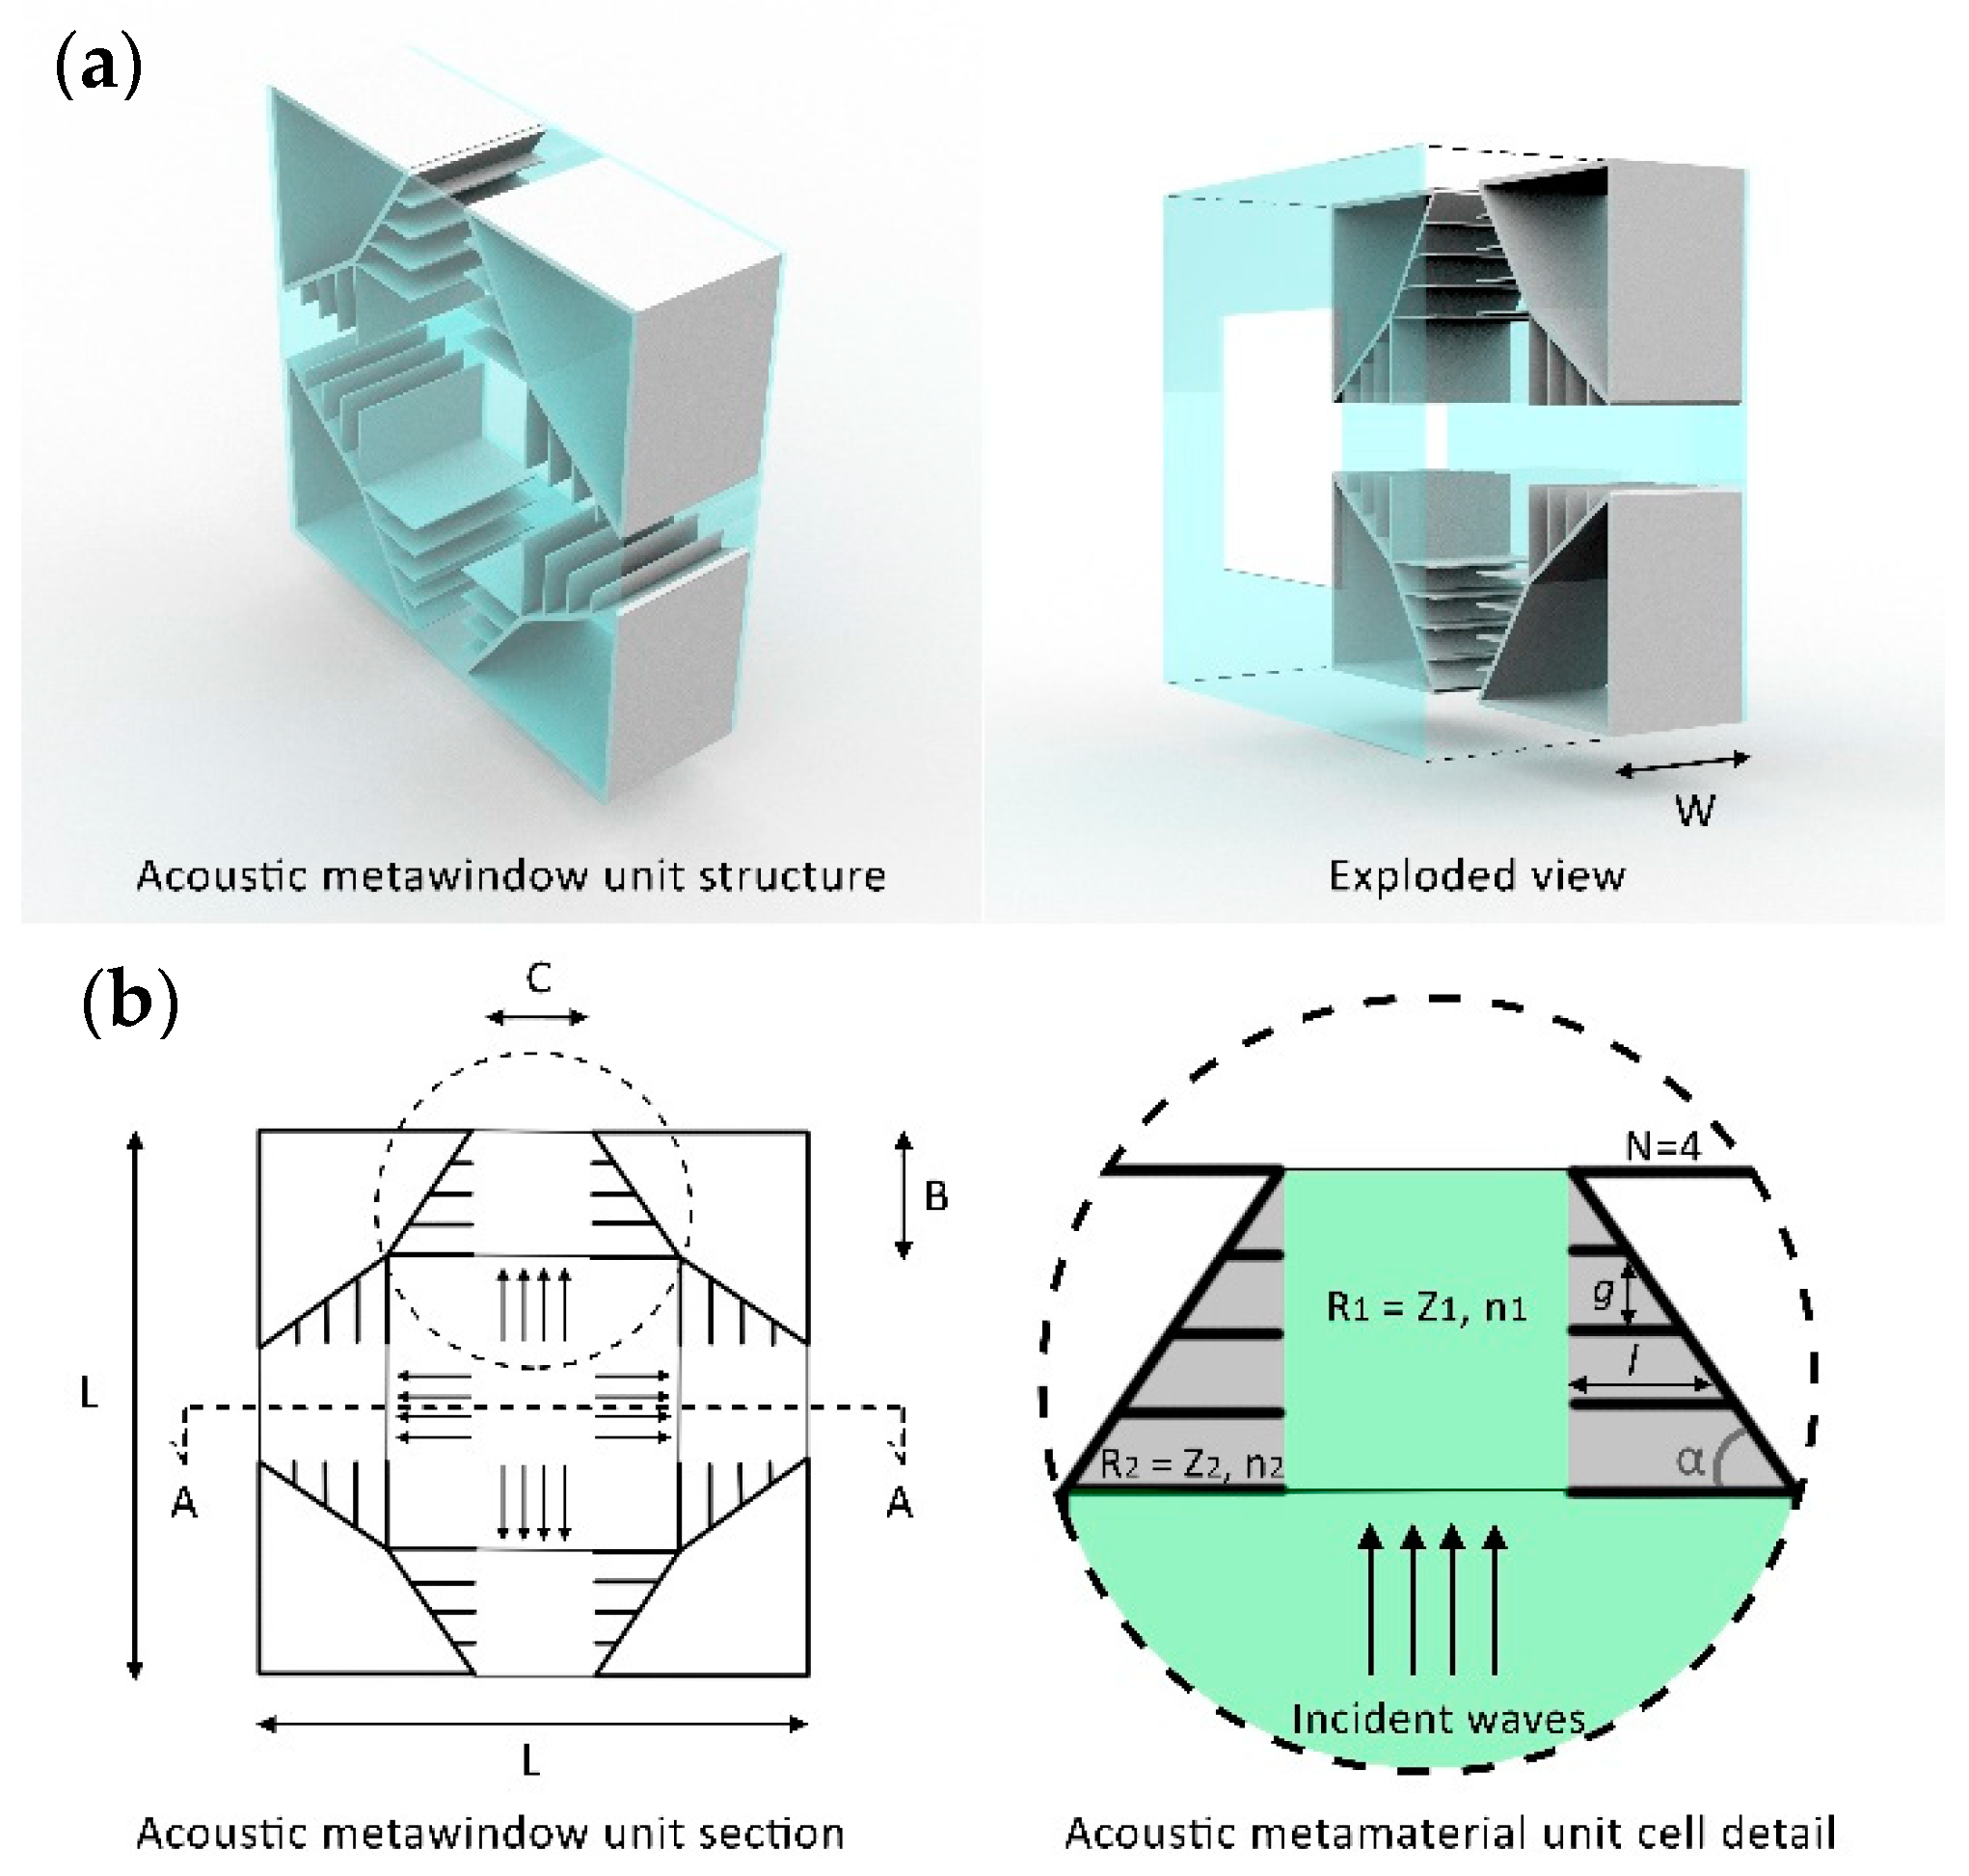
2.1. Analytical Considerations on the Geometrical Adaptation

This work focuses on an AMW unit consisting of a cubic main body of volumetric dimensions 0.4 × 0.4 × 0.13 m with an embedded AMM system in the window frame space, as shown in Figure 1a. Each unit cell consists of a number (N) of resonance cavities. The air gap (g) and length (l) of each cavity are dependent on the inclination (α) (Figure 1b). The tailoring of the inner structure creates local resonances in order to form a stopband. The unit cell can be considered a waveguide attached to periodic scatterers in the lateral direction for flow exit. Inspired by the acoustic black hole effect, the theoretical wave propagation in this specific system generates an acoustic stopband related to the resonant tubular array [36]. More details about the simulation results and theoretical analyses can be found in our previous publication [35]. The adaptation to a more ergonomic and common design is required for real application as a building feature. Following the analytical analysis from the previous acoustic metacage model [35], a specific impedance (Z1,2) and refractive index (n1,2) related to the different geometrical areas (Region 1 = R1 and Region 2 = R2) of the AMW unit are considered (see Figure 1b). Due to the contrast in the two regions’ refractive indices, the sound waves passing through the AMM unit cell experience an out-of-phase condition, and this phenomenon is proved regardless of the sound wave angle of incidence for any value of n. This physical principle is verified for the AMW unit, and the preliminary numerical analysis confirms it: the AMW unit design can be used as an omnidirectional sound barrier for all-angle incoming waves.

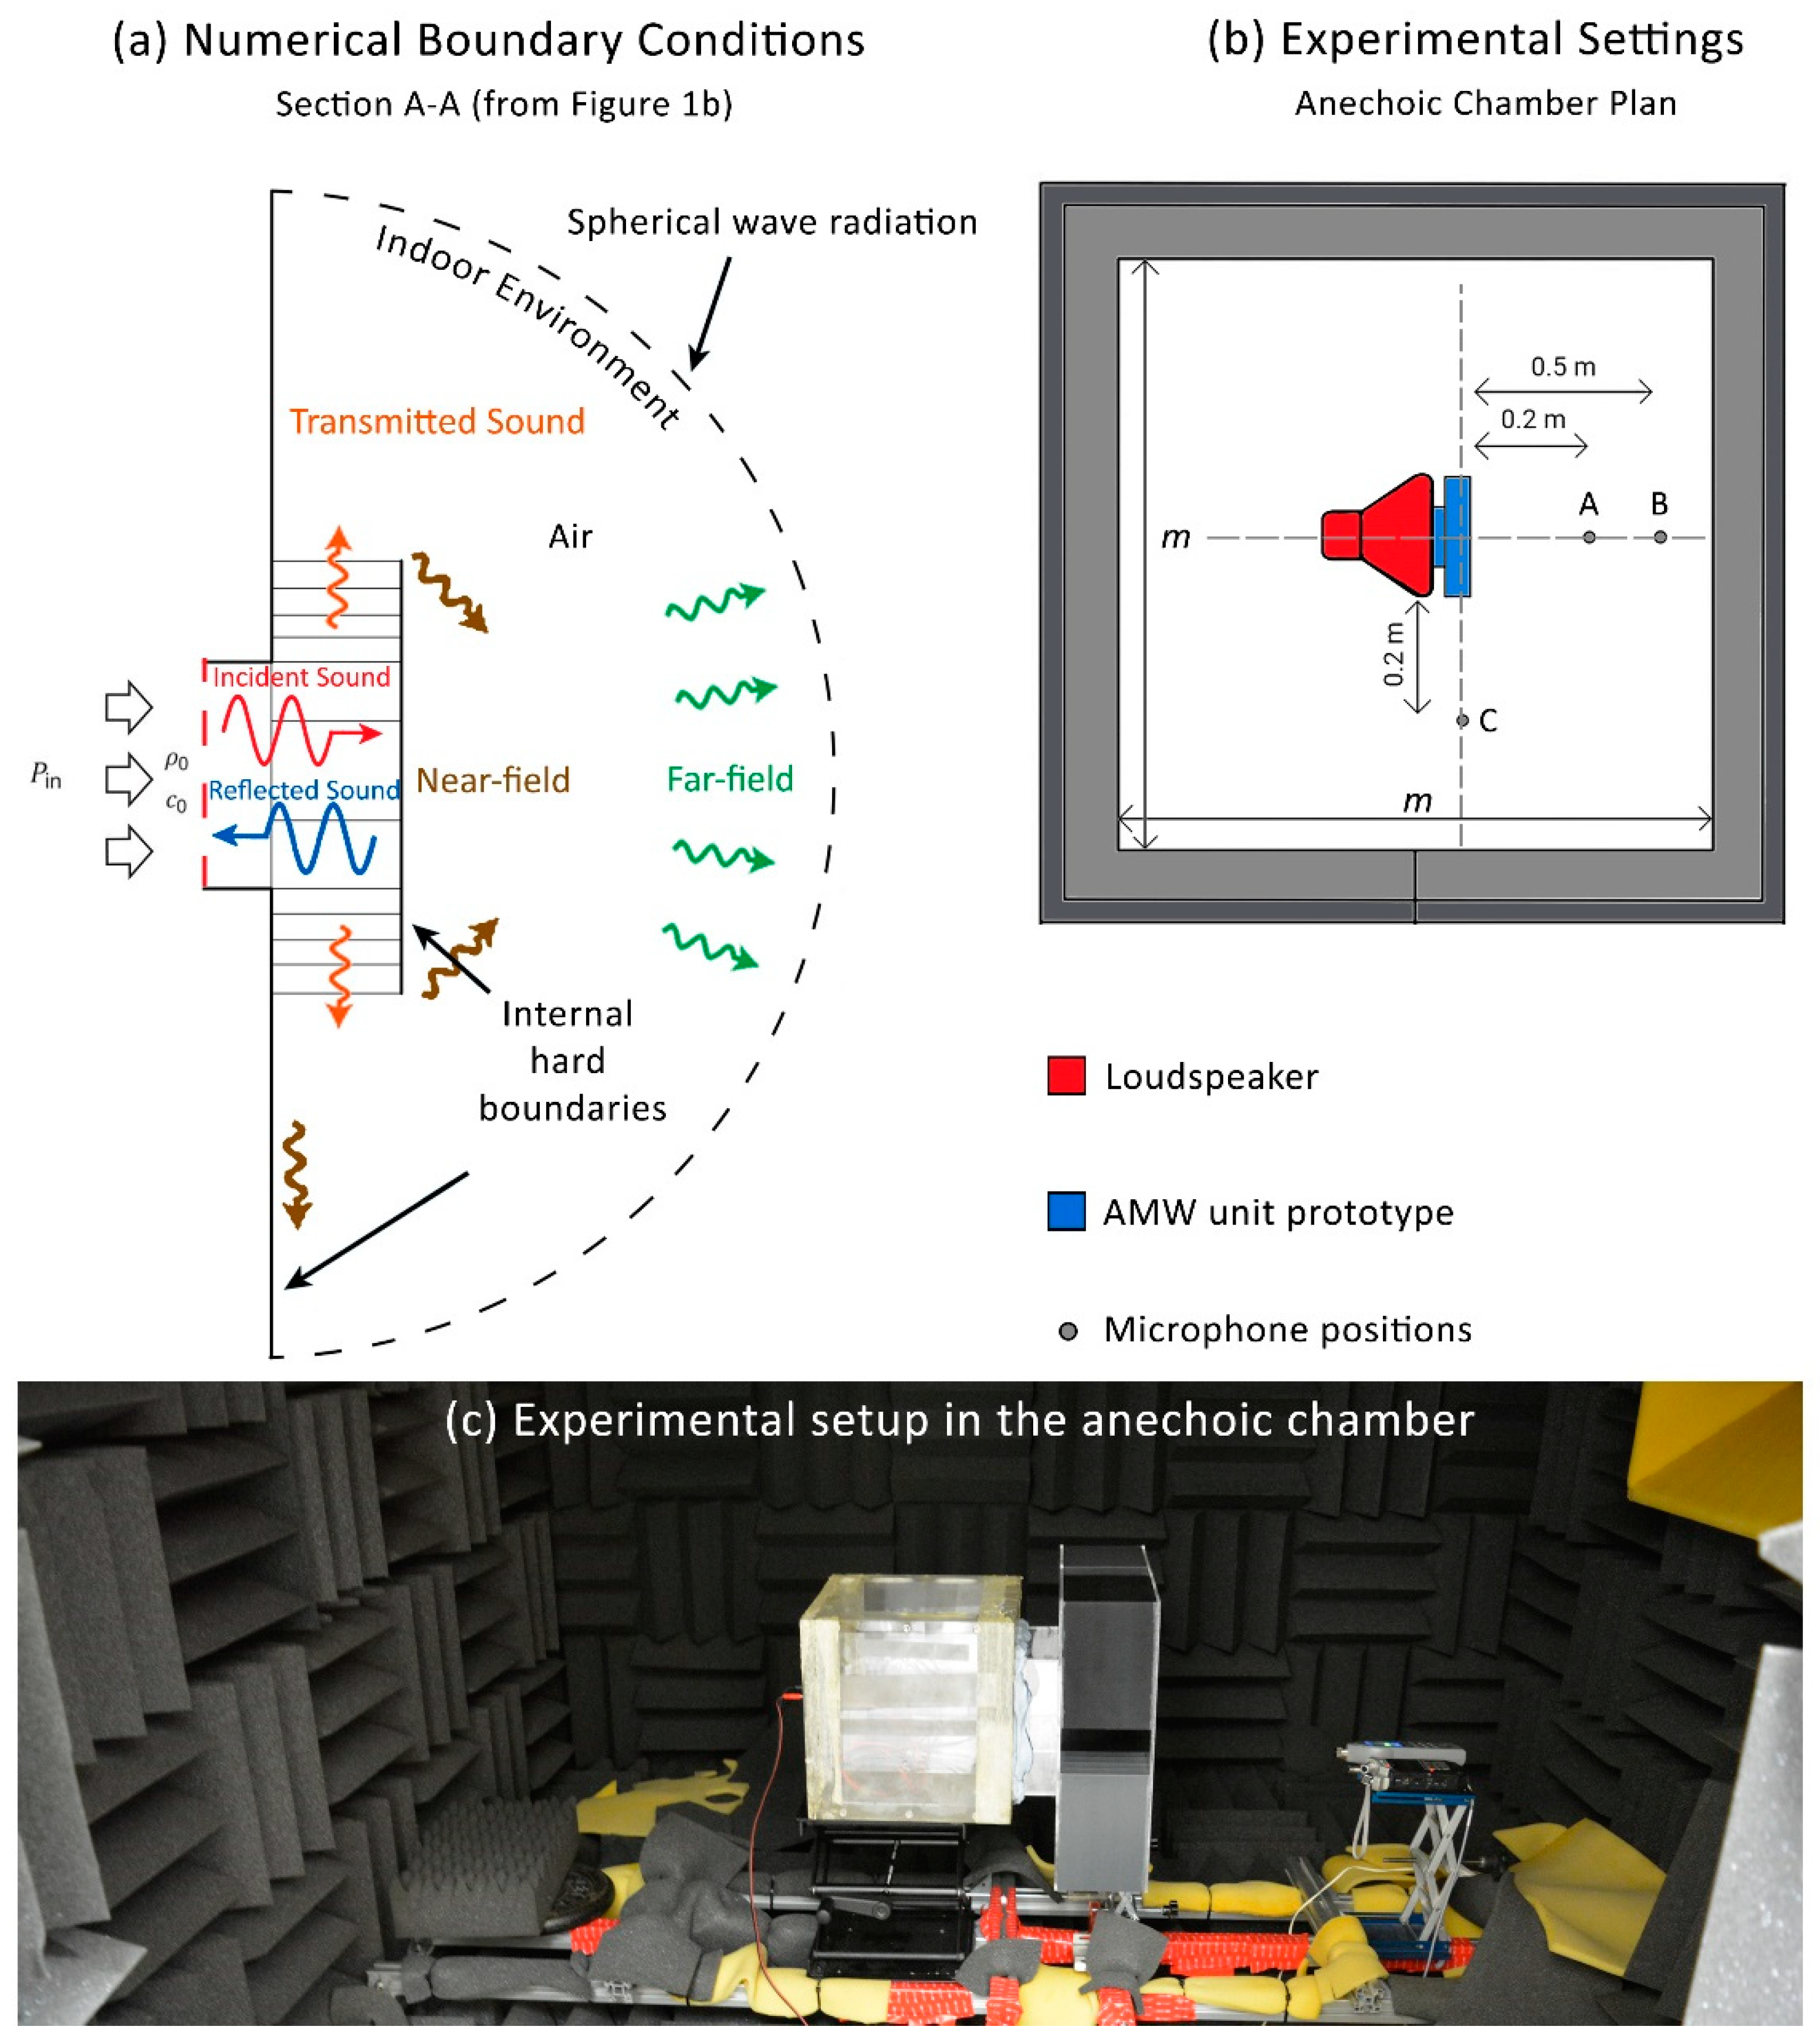
2.2. Numerical Analysis Setup

For the first stage, namely the numerical simulation, the FEM model is used. The 3D domain is filled with air, where air density (ρ = 1.215 kg/m3) and sound speed (c = 343 m/s) at room temperature (T = 20 °C) are used. The outdoor boundary is characterised by a plane wave radiating towards the receiving environment with a pressure amplitude of 1 Pa and an airspeed of the sound of 343 m/s, as shown in Figure 2a. The simulation study is performed using frequency domain analysis covering 300 to 5000 Hz with a step size of 100 Hz. The lower bound of the frequency range is limited by the anechoic chamber’s cut-off frequency of 300 Hz used in the experimental analysis. As it can be seen from the geometrical characterisation and measures in Figure 1, the 3D model is complex, and the required mesh size to reach 5000 Hz is 343/6/5000 = 0.011 m. Such fine mesh results in very computationally intensive models. For this reason, a slightly coarse minimum mesh size of 0.023 m is used, which has no problem in meeting the convergence criterion. The simulation accuracy is later validated experimentally.
The acoustic performance is evaluated by measuring the insertion loss (IL) at three receiving points (A, B, and C), respectively, where A and B are in front of the AMW unit surface (0.2 and 0.5 m away) and C is at the side of it (0.2 m away) (Figure 2b). The choice of these three specific points instead of a wider spatially averaged pressure level on the radiating side is mainly due to the lack of sound power measurement equipment.
The IL is calculated by the difference between the sound pressure level (SPL) at each of these points with and without the AMW unit applied. Therefore, the IL of the AMW unit is calculated as
I L A M W = S P L w o A M W S P L w A M W   ( dB )
where:
  • S P L w o A M W = A-weighted SPL of experimental configuration without the AMW unit (dB);
  • S P L w A M W = A-weighted SPL of experimental configuration with the AMW unit (dB).

2.3. Experimental Setup and Equipment

The AMW unit is fabricated following the same dimensions of the numerical analysis model (Figure 1) by using 3D-printed polylactic acid (PLA; material properties: E = 1.28 GPa, ρ = 1210 kg/m3, and n = 0.36), with fused deposition modelling technology (3D printer Fortus 350) (white geometry in Figure 1a). Moreover, a FusionPro laser cutter (by Epilog Laser) is used to cut transparent acrylic panels (of thickness 5 mm and 2 mm) to build the rest of the AMW unit (transparent part in Figure 1a). The unit is placed at the centre of a small anechoic chamber (inner dimensions of 2 × 2 × 2 m; cut-off frequency is about 300 Hz). The AMW unit is attached on the outdoor side with a loudspeaker coupled with a power amplifier FRS 10 WP 8 OHM No. 2101 by VISATON (frequency range from 90 to 19,000 Hz and input power of 25 W) connected to the computer of the laboratory, as shown in Figure 2c. The model is fixed to the loudspeaker to avoid any sound leakage from the two systems’ junction. The SPL is measured at the same three positions, A, B, and C (Figure 2b), using a sound level meter with a built-in Fast Fourier Transform (FFT) analyser (Aihua AWA6228). The IL is calculated following Equation (1).

2.4. Acoustic Numerical Optimisation

The further broadband numerical analysis concerning the acoustic optimisation follows the same boundary conditions described before. The numerical characterisation study of the AMW unit is performed due to the agreement of the numerical and experimental methods for the IL calculation of such an AMM window system and the need for acoustic performance improvements on the lower frequency range. The AMM unit’s resonance volume is extended, and its impact on the AMW unit broadband performance (10–5000 Hz) is investigated. The inner panels of the AMM unit cells are perforated according to two different perforation ratios and two perforated panel positions, and the related IL is compared to the original AMW unit. The perforation ratio is calculated with the ratio between the whole inner panel area and the perforated area. The single perforation hole has a diameter of 0.006 m. Moreover, to define the additional contribution of such perforations and the consequent increase of the resonating volume behind the AMM unit, a series of additional numerical analyses are carried out, which demonstrate the impact of such perforations over the lack of panels at the same position within the AMM unit.
The final numerical computational fluid dynamic analysis on the ventilation potential of the AMW unit and its optimised versions follow the same geometrical setup for the acoustic analysis, and more details can be found below.

2.5. Computational Fluid Dynamic (CFD) Analysis Setup

The numerical ventilation analysis is used to assess the AMW unit: its initial geometrical model (the one also tested through experiments) and its acoustically optimised versions. A turbulent flow is set on the commercial software Comsol Multiphysics by using the Rans method with the k-ε turbulence model in order to calculate the environmental pressure drop ( Δ p ) caused by the different airflow velocities passing through the AMW unit models. The k-ε turbulent flow is used to simulate the mean flow characteristics for turbulent flow conditions. The Δ p is calculated considering the wall where the AMW unit is positioned and the wall and interior wall, with no slip, of the AMW unit itself. The 3D domain is filled with air, where the air density (ρ = 1.215 kg/m3) at room temperature (T = 20 °C) is used, while the inlet velocity is set from the inlet surface and characterised by a maximum of 1.132 m/s and a minimum of 0.5 m/s. The inlet surface is the same, which before was representing the loudspeaker (or outdoor environmental noise) role, and the maximum normal wind velocity flow is set according to Asfour and Gadi criteria [37], depending on the height above the ground (20 m) and the room height (3 m). As our current study only focuses on sufficient natural ventilation under low-Mach-number flow (typically below 0.1), the flow-induced noise is considered weak [38] and should not deteriorate the overall sound reduction performance. Moreover, due to the dimensions of the AMM unit cavities (g = 0.024 m and l = 0.066, 0.05, and 0.033 m), the conditions for the development of Rossiter tones may only develop on the shallowest cavity, since g / l 1 [39]. An outlet flow condition of 101.325 Pa is assigned to the indoor environment semi-spherical boundary to simulate the standard environmental indoor pressure. The geometric boundaries are the same as the acoustic FEM model, excluding the sphere radius, which is 0.72 m (1.44 m in diameter) and falls within the assumption of a 3 m room height for Asfour and Gadi criteria [37]. Regarding the mesh size for this 3D study, this is characterised by a maximum element size of 0.115 m and a minimum element size of 0.0144 m, with more refinements for the regions where turbulence is expected to happen (especially at, and in the proximity of, corners within the AMW unit structure). The study is run by a stationary solver, for which the CFD analysis is dependent on pressure (p) and velocity (velocity, u, and velocity field components, u, v, and w).

3. Results

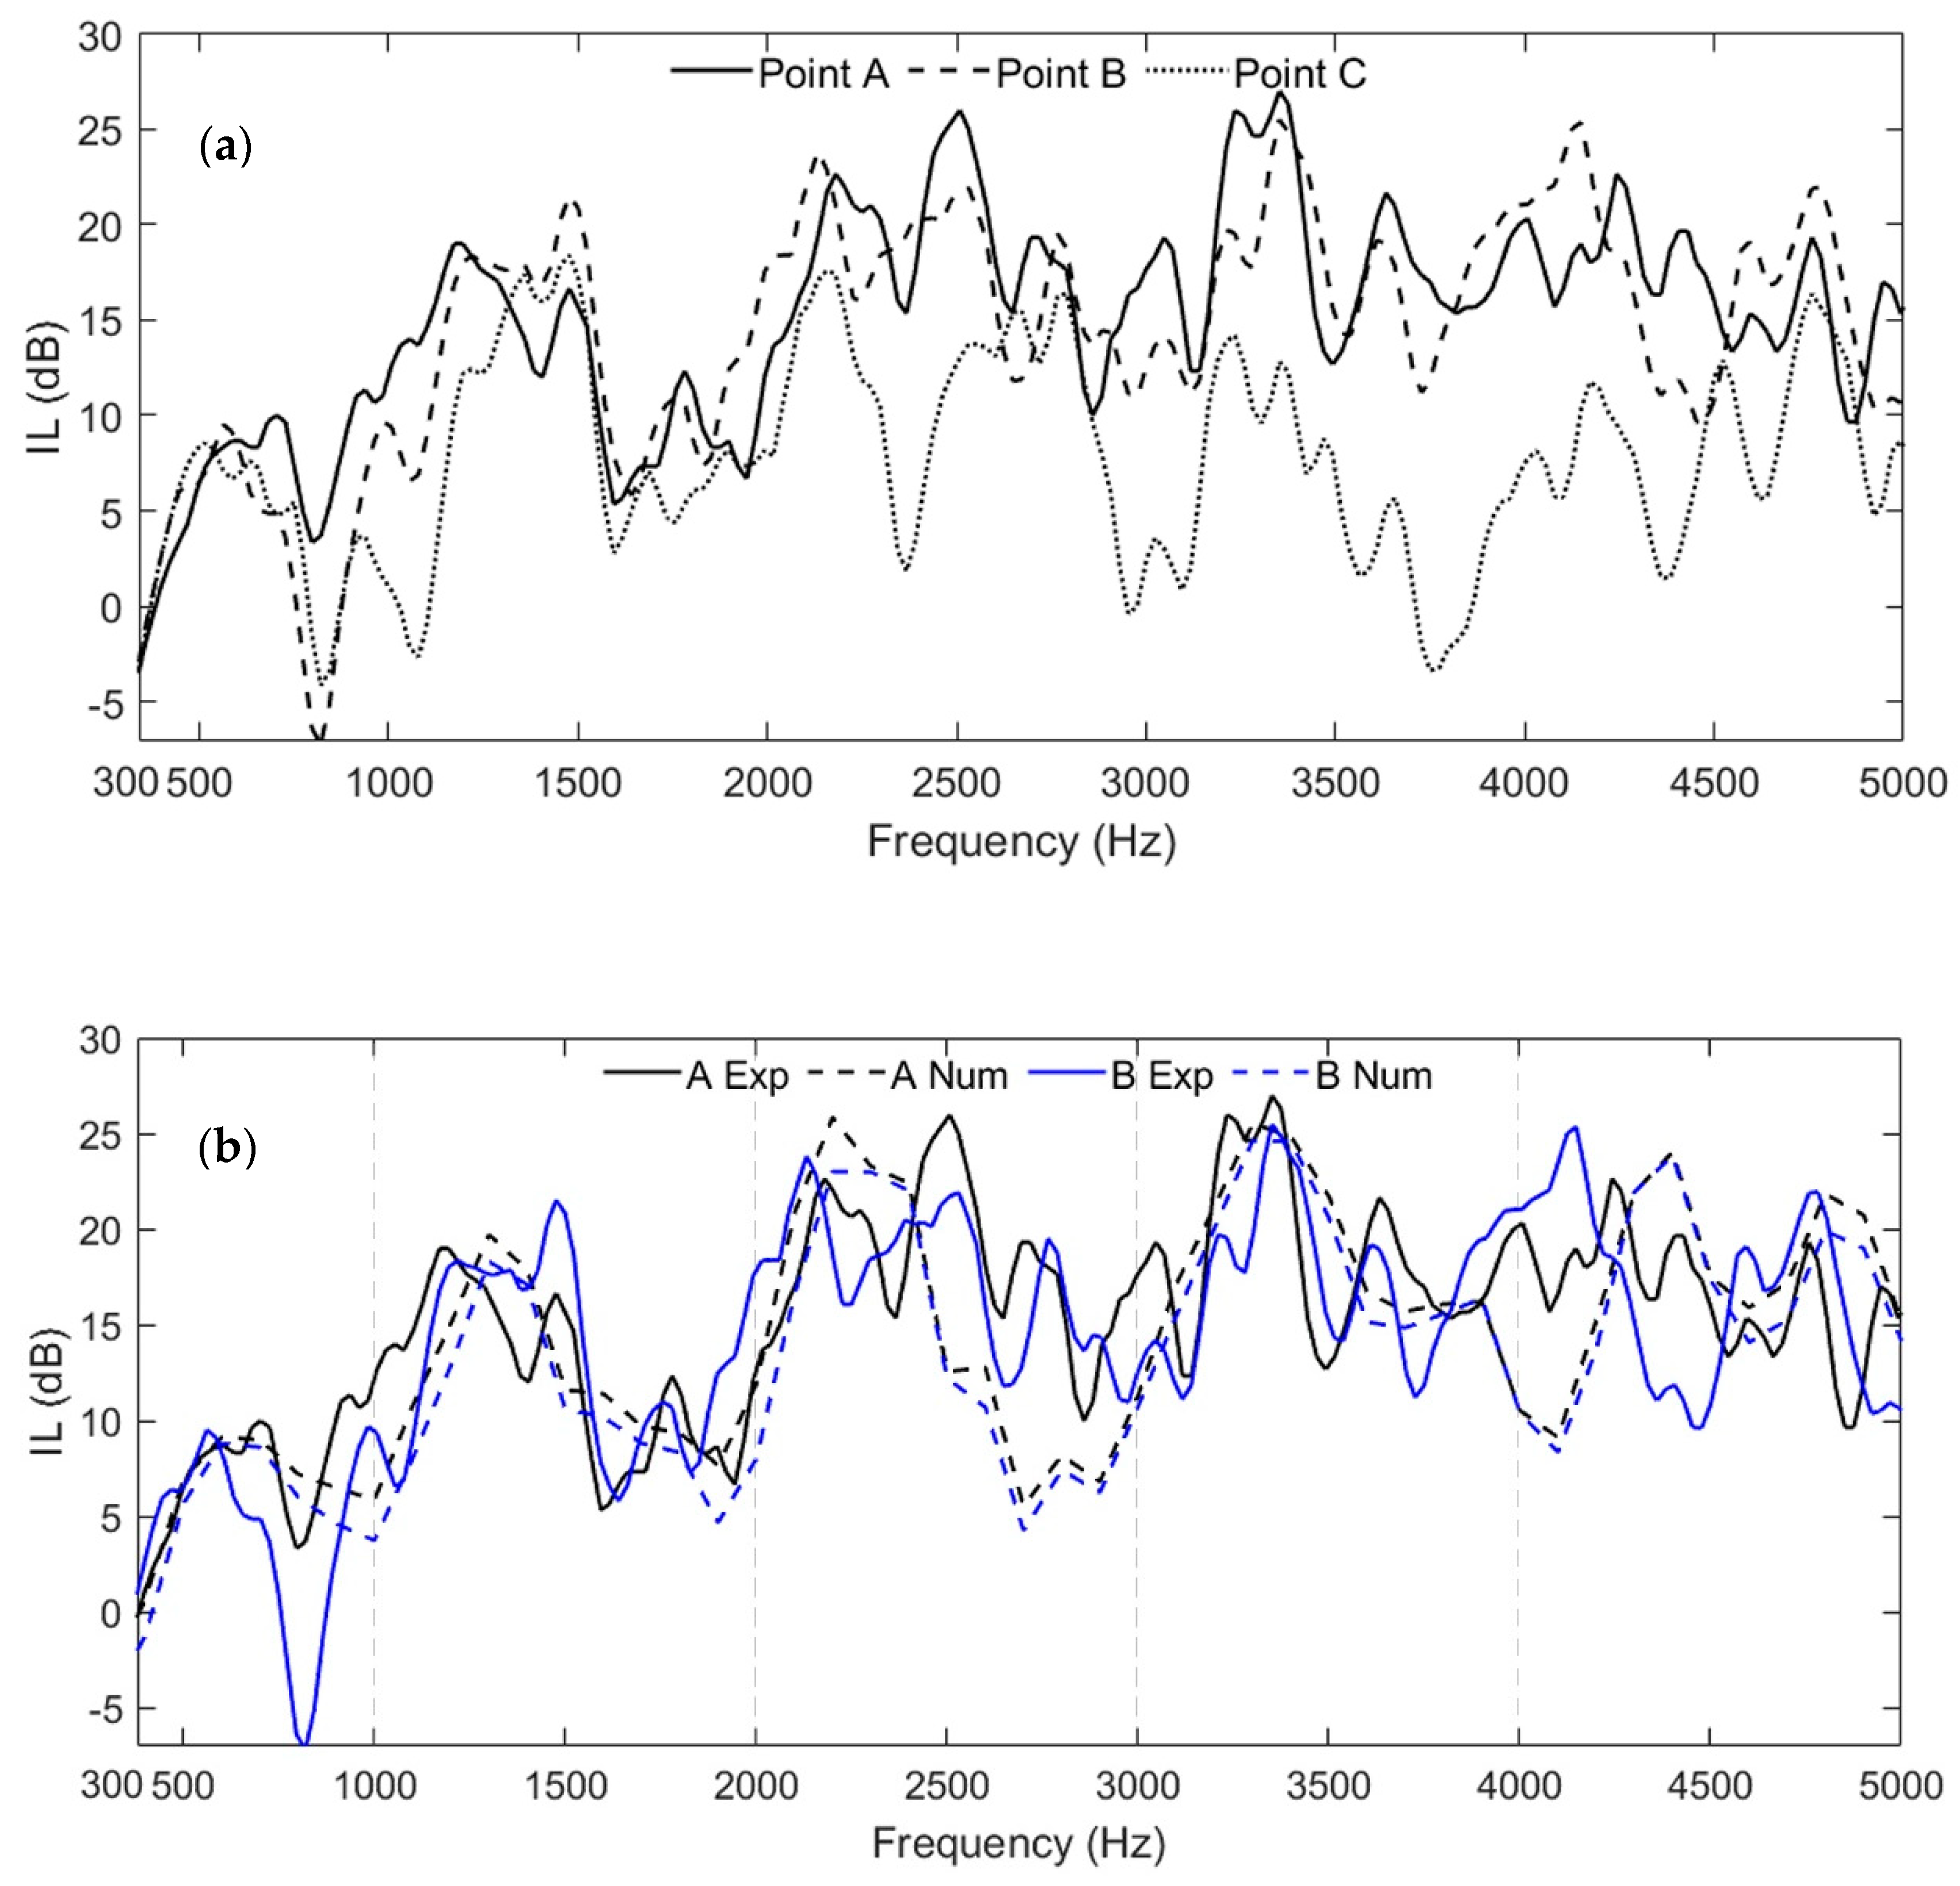
3.1. Acoustic Performance Based on Experimental Measurement

3.1.1. AMW Unit Performance According to Different User Position

Figure 3 shows the experimental study results, highlighting interesting correlations between the microphone’s position and the consecutive IL in relation to the AMW unit’s performance. For example, in Figure 3a, the IL graph shows dome-like behaviour typical of the sound reduction pattern of expansion acoustic ducts [40]. The peaks become lower as the position axis angle goes from perpendicular to parallel in relation to the AMW unit application plane (see Figure 2b for spatial reference). This, in turn, reduces the IL from a mean value of 11.9 dB at Point A and 10.8 dB at Point B to a mean value of 2.7 dB at Point C. This difference is noticeable in the high-frequency range (2000–5000 Hz). A smaller difference of an average 1.1 dB is also shown between the IL results of Points A and B, showing that the AMW unit performs better when the user is placed on the perpendicular axis (i.e., in front of the window) rather than on the parallel one.

3.1.2. AMW Unit Performance on the Lower Frequency Range (500–1000 Hz)

It is also important to notice that in the frequency range below 380 Hz and between 700 and 900 Hz, the IL related to Point B goes below zero. Since the sound wave that passes through the AMW unit is then refracted through the four openings on the window frame, such a configuration might originate new noise sources characterised by a different mode that varies in the space. Therefore, the IL dips measured in Points B and C are probably due to a superposition of the sound wave’s low-frequency component when it exits from the four openings on the window frame. For this reason, the measurements for Point B show there is such a low dip between 700 and 900 Hz, whereas the graph shows that for Point A (IL(A)) the dip is much higher (IL(A − B) = 10.6 dB). Generally, excluding the frequency range of 700–900 Hz for IL(B), the sound wave pressure level on a broad frequency range from 300 to 5000 Hz is shown to be significantly affected by the AMW unit system.

3.1.3. Determination of the Coefficient of Variation for the Validation of the Numerical Method through the Experimental Results

The numerical method is validated through experimental results in terms of IL and about each measurement point. IL slopes are observed with their characterising peaks and dips in terms of the coefficient of variation (CV) according to the frequency range:
C V = R M S 1 R M S 2 × 100   ( % )
where the root mean square ( R M S 1 2 ) expresses the measure of the magnitude of the IL values and is used to determine the standard deviation and mean between the numerical and experimental results:
R M S 1 = i = 1 N I L N u m , i I L E x p , i 2 N
where:
  • R M S 1 = RMS to determine the standard deviation;
  • I L N u m , i = IL calculated from the numerical method (dB);
  • I L E x p , i = IL calculated from the experimental method (dB);
  • N = sample size.
R M S 2 = i = 1 N I L E x p , i 2 N
where:
  • R M S 2 = RMS to determine the mean.
The CV is the standard deviation ratio to the mean and shows the variability of the population’s mean. Therefore, the higher the CV, the greater the dispersion of the RMS.
Figure 3b compares the IL results at Points A and B from the experimental measurement and the numerical simulation. In the graphs, six peaks distributed along the frequency range are possibly highlighted (see Figure 3b). The simulation curve captures the main variation trend and the occurrence of IL peaks well. The CV, as defined in Equation (2), is used to evaluate the correspondence between the experiment and the simulation. Table 1 shows the values of CV in the subdivided frequency ranges. A generally good agreement between the numerical and experimental results can be found within the broad frequency range: the CV is always below 40%, excluding CV (B) at low frequencies (300–1000 Hz).
The discrepancies between the experimental and simulation curves can possibly be attributed to a few reasons. First, the simulation’s frequency step size is much wider than that used in the experiment, mainly limited by the heavy computation cost. Therefore, the simulation is used to capture the IL’s magnitude and its variation behaviour while neglecting the frequency fluctuations. Second, the experimental setup slightly differs from the numerical model, mainly in the sound source condition and the IL evaluation points. In the numerical simulation, a plane wave is assumed to impinge on the AMW unit, partially reflected back and partially transmitted through the structure. The IL is then calculated from the results with/without the AMW unit. In the experiments, however, the AMW unit is attached to a loudspeaker, which forms a much more complicated system than the assumed plane wave incidence. The reflected waves cannot exit freely from the inlet duct, and the measured IL can possibly couple with some loudspeaker characteristics, such as the resonances of the membrane, cavity, and so forth. Meanwhile, the IL is evaluated at two selected points, although, ideally, the IL could be measured by the overall reduction of the radiated sound power level, which could further improve the correlation accuracy. Third, the AMW unit prototype made of acrylic panels may vibrate during IL measurement, and the simulation does not consider this structural sound transmission path. The relatively small anechoic chamber and geometric imperfections during prototype fabrication may also lead to some errors. Generally, the simulation and experiment’s general correspondence is acceptable, which allows the use of the model for some parametric studies.

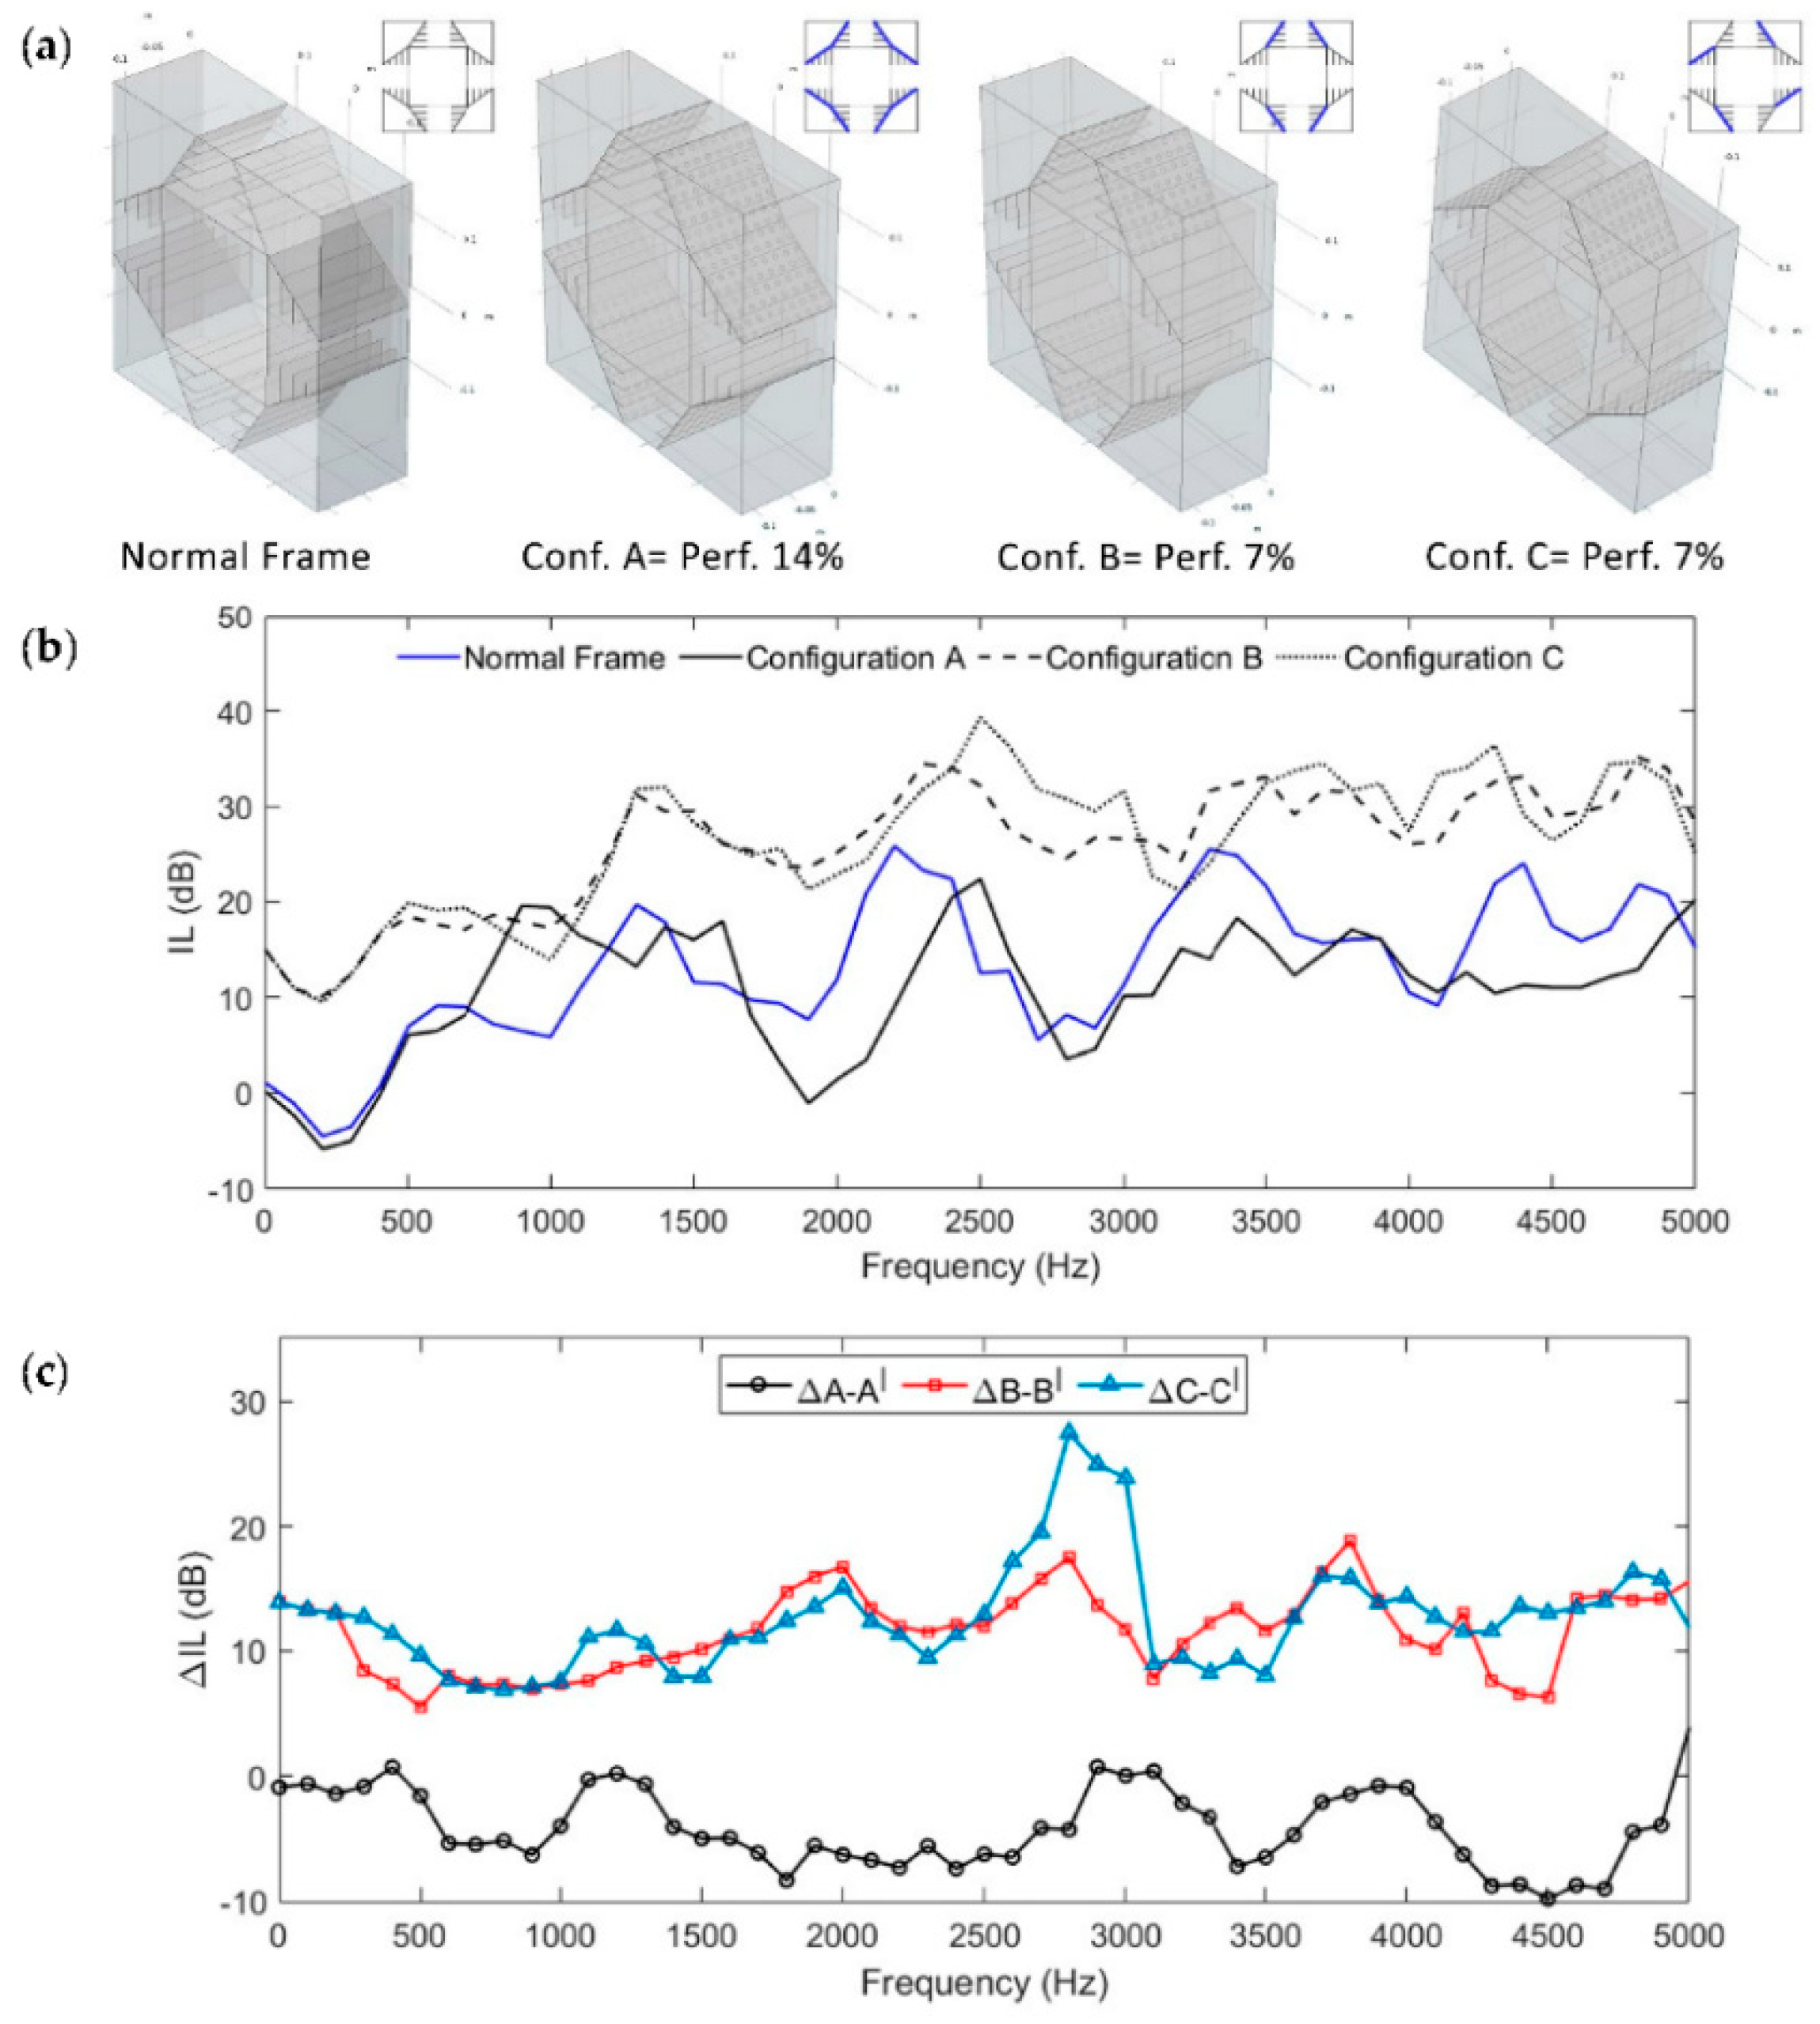
3.2. Broadband Potential Optimisation of the AMW Unit’s Acoustic Performance

A further broadband potential optimisation of the AMW unit’s acoustic performance is investigated next. The numerical characterisation study of the AMM unit is indeed performed due to the numerical and experimental method agreement for the IL calculation of such an AMM window system and the need for acoustic performance improvements on the lower frequency range. The resonating volume extension through the perforation of AMM unit cell panels is investigated to reach a resonance that affects the low-frequency bandwidth wavelength. The study this time is performed within a frequency range of 10–5000 Hz. As a comparison, three models with different perforation percentages and dispositions are studied and compared to the IL performance of the original frame model concerning Point A measurements. Only the inner sides of the frame’s corners are modified accordingly with a 14% or 7% perforation ratio (where the percentage is calculated with the ratio between the whole inner panel area and the perforated area). As illustrated in Figure 4a, Configuration A (with 14% of perforation of the area of the overall panels) has a resonating volume of 13.85 × 10⁻⁴ m3. Configuration B has 7% of perforation on the panels belonging to 2/4 of the same AMM units, while Configuration C has 7% of the overall panel area’s perforation applied on one panel of each AMM unit. In these two last models (B and C), the resonating volume reaches 15.40 × 10⁻⁴ m3, and the perforated panels within the AMW unit geometry are placed differently to investigate whether the perforation position is a determinant parameter for the AMW unit IL.
Figure 4b shows that the IL performance of the acoustically optimised Configurations B and C improves from 50 to 5000 Hz, with an average increase of 11 dB from the original frame window model. This is because the resonant volume is increased significantly and can control the wavelength of lower frequency bandwidths. The IL curve in Figure 4b also shows that for Configuration A there is no significant difference with the normal frame performance except for a significant average improvement of 5 dB in the frequency range of 700–1200 Hz. Consequently, such a small resonance volume addition does not improve the AMW unit performance significantly on broadband. Therefore, Configurations B and C work more efficiently when compared to either the original configuration or Configuration A, because they allow the AMM unit to have the biggest resonating volume, showing that the perforation percentage is a crucial factor for the design of such an AMM window, especially at low frequencies (50–800 Hz) where they reach an IL average of 15 dB. On the other hand, it is important to note that the perforated panels’ disposition does not seem crucial, meaning that the IL’s most influencing parameter is the additional resonant volume (and therefore the panels’ perforation percentage).
Furthermore, since an additional characterisation of the geometry has been introduced in the AMW unit, it is fundamental to assess that the contribution of the original AMM unit cell (see Figure 1b), especially focusing on the cavities, is still in place. For this reason, another numerical analysis is conducted by removing the unit cell panels from the internal sound hard boundaries by the perforation for each configuration (A, B, and C) and calling them A′, B′, and C′. Then the difference between the IL of Configurations A, B, and C and the IL of A′, B′, and C′ is calculated as ∆A-A′= ILA − ILA′ and so on (see Figure 4c). This schematic proves that the resonance coupling of flanks and corners is especially visible for Δ B-B′ and Δ C-C′, where the IL’s positive value shows an efficient combination of the two acoustic techniques where the contribution of the flanks is still visible.

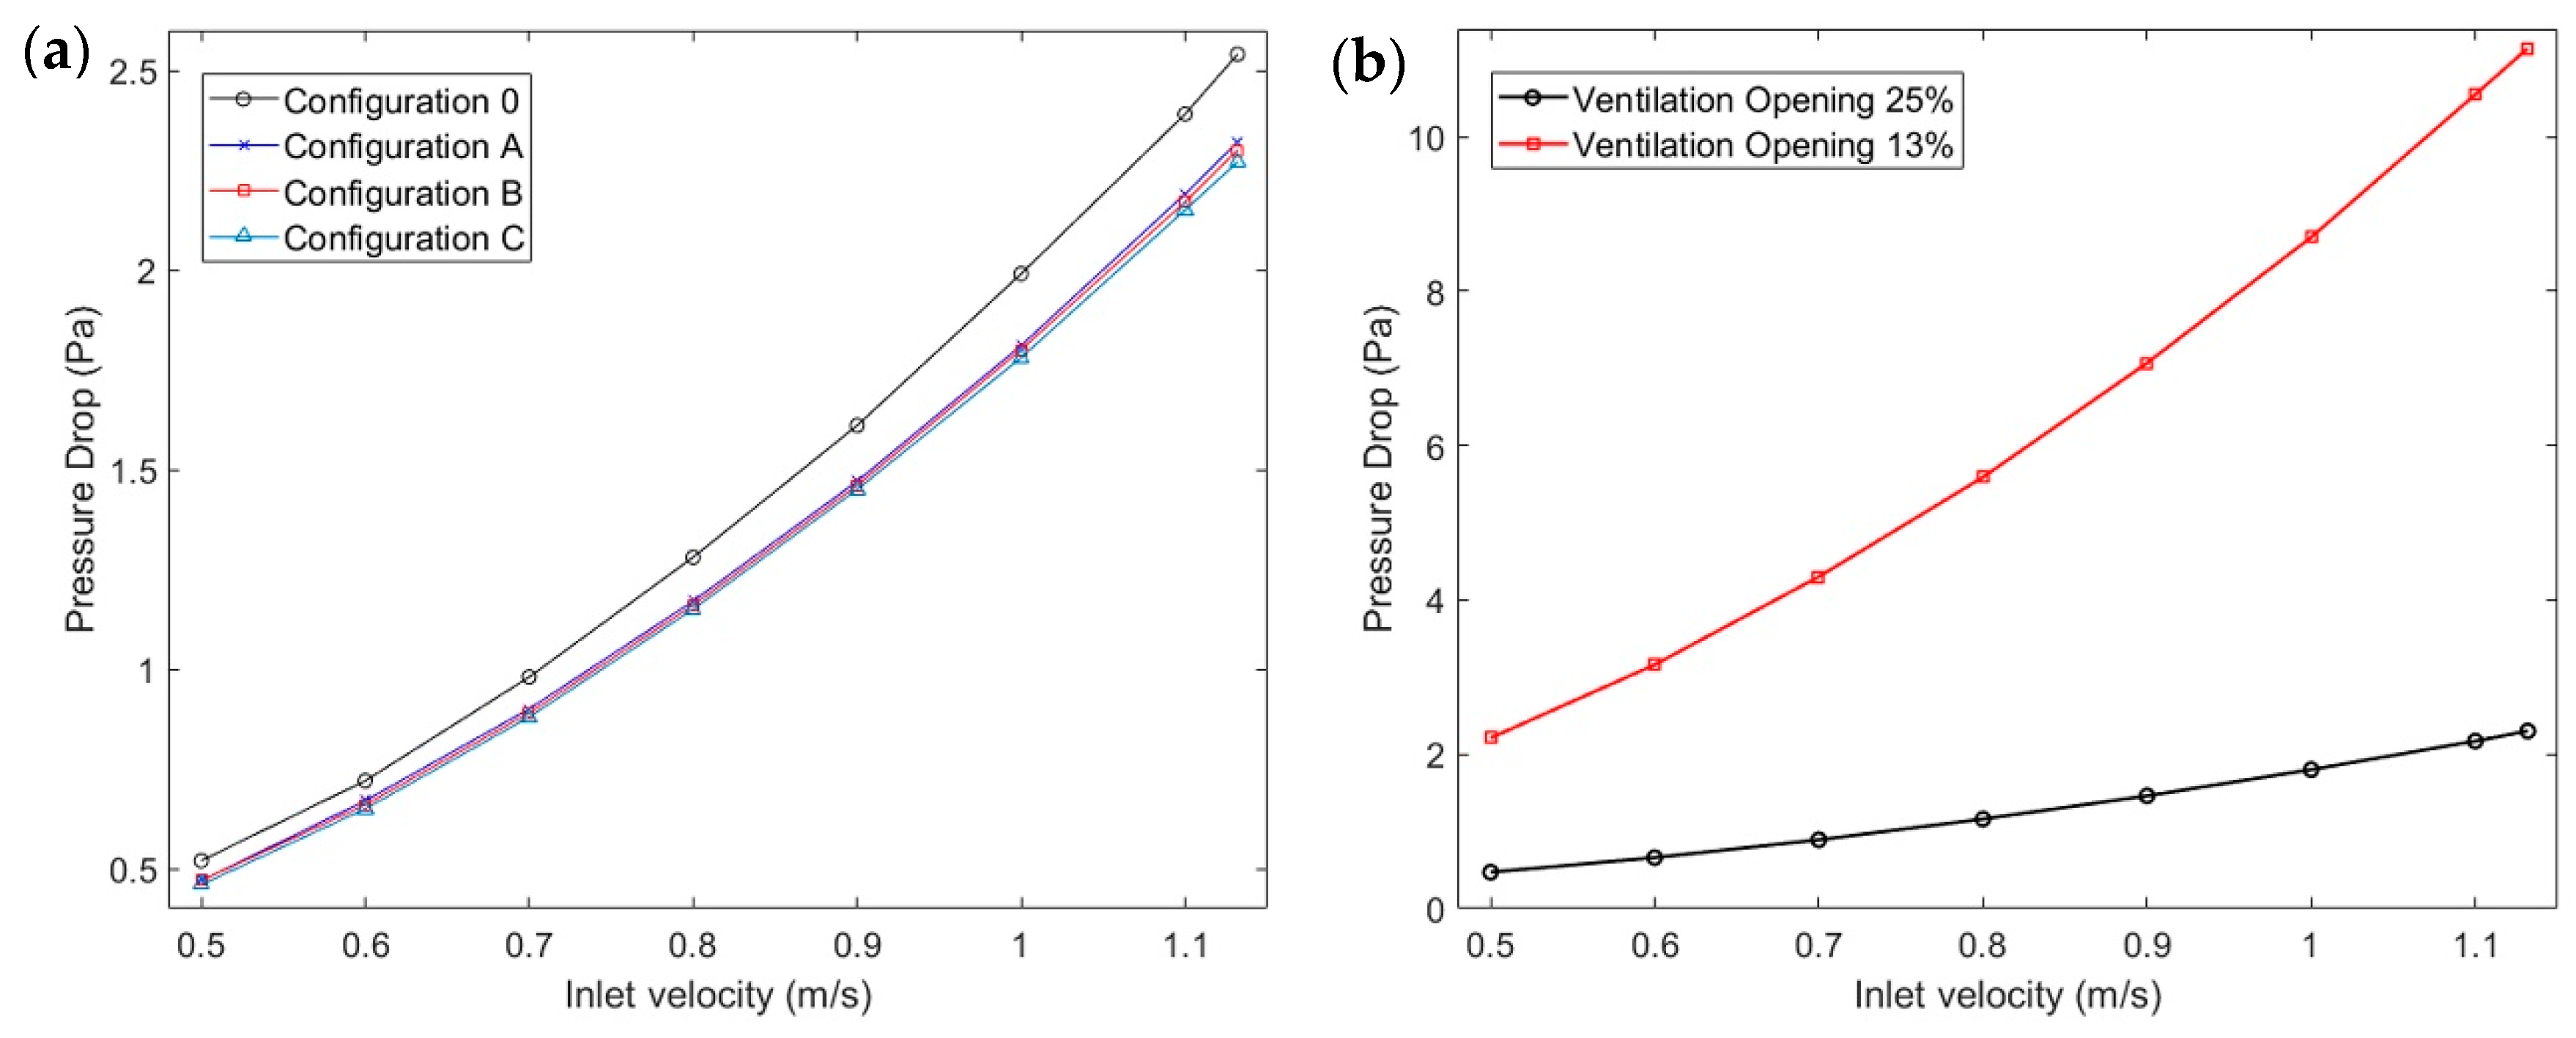
3.3. Integrated Optimisation of Acoustics and Ventilation

The proposed configurations’ ventilation performance is finally numerically investigated through a FEM computational fluid dynamic (CFD) model. In the numerical analysis, the air is set to flow through each configuration, and the corresponding responses are analysed for different inlet velocities and different ventilation opening percentages. Figure 5a shows the pressure drop against inlet air velocities for different AMW unit configurations, while Figure 5b shows the same parameter results for Configuration B for different airflows and different percentages of ventilation opening. An increase in the required pressure differential across the AMW unit is observed proportionally to the increasing flow rate. Moreover, a higher pressure drop results from an AMW unit with a 13% ventilation opening, demonstrating that the smaller ventilation openings offer high airflow resistance due to the static airflow resistance. This is because the static airflow resistance, σ f , is indirectly proportional to the ventilation opening ( σ f = 8 η / ψ 0.5 d v 2 , where η is the dynamic viscosity of the fluid, ψ is the percentage of the opening, and d v is the opening diameter) [11]. It is evident that as d v becomes smaller, σ f increases rapidly, and due to buoyancy forces results in a high pressure drop ( Δ P = σ f v a , where v a is the airflow velocity) across the AMW unit [41]. Consequently, most of the AMW unit configurations are suitable for natural ventilation, and a dynamic tuned ventilation capacity can be achieved for particular ranges by adjusting the window’s ventilation opening.
It is worth mentioning that this study is intended to present a preliminary evaluation of the ventilation and acoustic performance of the AMW unit, where the effect of flow-induced noise is neglected. As the AMW unit structure comprises cavities along the flow path, Rossiter tones may occur aerodynamically. Previous studies have investigated the effect of low-Mach-number flow (below 0.1) on a similar system comprising cavities and perforations and have found that the maximum deviation between no flow and Mach 0.1 is around 10 dB, mainly at the attenuation peak [42]. Therefore, as ventilation only requires a very low flow speed, the current simplification by neglecting aerodynamic noise is considered to be reasonable. The results in the absence of flow could also set a baseline for future comparisons with the flow.

4. Conclusions

In this study, we designed a metawindow unit system and examined the acoustic and ventilation performance numerically and (for the acoustic part) experimentally. Both numerical and experimental results showed a significant IL within a frequency range of 300 to 5000 Hz, and the agreement between them was proved. Acoustic optimisation was numerically investigated by extending the resonant volume, including in all the corner areas. Two of the new configurations (B and C) showed significantly reduced noise on a broad frequency range of 50 to 5000 Hz. They are specifically more effective on a low-frequency range within 50–1000 Hz, where they improve the original model’s performance by an average of 15 dB. They also seem to be acoustically improved from Configuration A, making the panels’ perforation percentage crucial. The ventilation performance was also assessed, and it was proved that most of the AMW unit configurations are suitable for natural ventilation and that the ventilation capacity can be tuned according to different ranges by adjusting the window’s ventilation opening.
While the significant results in the acoustic and ventilation analyses showed advantages over standard ventilation AMMs (such as effective long-term natural ventilation combined with customised broadband noise reduction), further optimisation steps might clarify whether this mechanism can be applied to different window shapes and dimensions or wider environmental settings with different inlet flow conditions and room characterisation.

Author Contributions

Conceptualisation, G.F. and X.Y.; methodology, G.F., X.Y., Z.L., F.C., and J.K.; software, G.F. and X.Y.; validation, G.F., X.Y., and Z.L.; formal analysis, G.F.; investigation, G.F.; resources, G.F. and Z.L.; data curation, G.F. and X.Y.; writing—original draft preparation, G.F.; writing—review and editing, G.F., X.Y., Z.L., F.C., and J.K.; visualisation, G.F.; supervision, F.C. and J.K.; project administration, G.F.; funding acquisition, X.Y., Z.L., F.C., and J.K. All authors have read and agreed to the published version of the manuscript.

Funding

Gioia Fusaro was supported by the University of Sheffield and the Institute of High Performance Computing (IHPC, part of A*STAR) through the ARAP Programme. Zhenbo Lu was supported by the Department of Science and Technology of Guangdong Province (2019QN01G064).

Institutional Review Board Statement

Not applicable.

Informed Consent Statement

Not applicable.

Data Availability Statement

The data that support the findings of this study are available from the corresponding author upon reasonable request.

Conflicts of Interest

The authors declare no conflict of interest.

References

  1. Harvie-Clark, J.; Chilton, A.; Conlan, N.; Trew, D. Assessing noise with provisions for ventilation and overheating in dwellings. J. Build. Serv. Eng. Res. Technol. 2019, 40, 263–273. [Google Scholar] [CrossRef]
  2. Public Health England. Review and Update of Occupancy Factors for UK Homes. 2018. Available online: www.gov.uk/phe (accessed on 5 November 2019).
  3. Fusaro, G.; Kang, J. Participatory approach to draw ergonomic criteria for window design. Int. J. Ind. Ergon. 2021, 82, 103098. [Google Scholar] [CrossRef]
  4. Tang, S.K. A review on natural ventilation-enabling façade noise control devices for congested high-rise cities. Appl. Sci. 2017, 7, 175. [Google Scholar] [CrossRef] [Green Version]
  5. Du, L.; Lau, S.K.; Lee, S.E.; Danzer, M.K. Experimental study on noise reduction and ventilation performances of sound-proofed ventilation window. Build. Environ. 2020, 181, 107105. [Google Scholar] [CrossRef]
  6. Lam, B.; Shi, D.; Belyi, V.; Wen, S.; Gan, W.S.; Li, K.; Lee, I. Active control of low-frequency noise through a single top-hung window in a full-sized room. Appl. Sci. 2020, 10, 6817. [Google Scholar] [CrossRef]
  7. Kang, J.; Brocklesby, M.W. Feasibility of applying micro-perforated absorbers in acoustic window systems. Appl. Acoust. 2005, 66, 669–689. [Google Scholar] [CrossRef]
  8. Asdrubali, F.; Buratti, C. Sound intensity investigation of the acoustics performances of high insulation ventilating windows integrated with rolling shutter boxes. Appl. Acoust. 2005, 66, 1088–1101. [Google Scholar] [CrossRef]
  9. Waddington, D.C.; Oldham, D.J. The prediction of airflow-generated noise in mechanical ventilation systems. Indoor Built Environ. 2000, 9, 111–117. [Google Scholar] [CrossRef]
  10. Harvie-Clark, J.; Conlan, N.; Wei, W.; Siddall, M. How loud is too loud? noise from domestic mechanical ventilation systems. Int. J. Vent. 2019, 18, 303–312. [Google Scholar] [CrossRef]
  11. Wang, X.; Luo, X.; Yang, B.; Huang, Z. Ultrathin and durable open metamaterials for simultaneous ventilation and sound reduction Cite. Appl. Phys. Lett. 2019, 115, 171902. [Google Scholar] [CrossRef]
  12. Kang, J.; Li, Z. Numerical simulation of an acoustic window system using finite element method. Acta Acust. United Acust. 2007, 93, 152–163. [Google Scholar]
  13. De Salis, M.H.F.; Oldham, D.J.; Sharples, S. Noise control strategies for naturally ventilated buildings. Build. Environ. 2002, 37, 471–484. [Google Scholar] [CrossRef]
  14. Lam, B.; Shi, D.; Gan, W.S.; Elliott, S.J.; Nishimura, M. Active control of broadband sound through the open aperture of a full-sized domestic window. Sci. Rep. 2020, 10, 1–8. [Google Scholar] [CrossRef] [PubMed]
  15. Carbajo, J.; Mosanenzadeh, S.G.; Kim, S.; Fang, N.X. Sound absorption of acoustic resonators with oblique perforations. Appl. Phys. Lett. 2020, 116, 054101. [Google Scholar] [CrossRef]
  16. Pan, L.; Martellotta, F. A parametric study of the acoustic performance of resonant absorbers made of micro-perforated membranes and perforated panels. Appl. Sci. 2020, 10, 1581. [Google Scholar] [CrossRef] [Green Version]
  17. Tsukamoto, Y.; Tomikawa, Y.; Sakagami, K.; Okuzono, T.; Maikawa, H.; Komoto, Y. Experimental assessment of sound insulation performance of a double window with porous absorbent materials its cavity perimeter. Appl. Acoust. 2020, 165, 107317. [Google Scholar] [CrossRef]
  18. Zhou, Y.; Li, D.; Li, Y.; Hao, T. Perfect acoustic absorption by subwavelength metaporous composite. Appl. Phys. Lett. 2019, 115, 093503. [Google Scholar] [CrossRef]
  19. Li, D.; Jiang, Z.; Li, L.; Liu, X.; Wang, X.; He, M. Investigation of acoustic properties on wideband sound-absorber composed of hollow perforated spherical structure with extended tubes and porous materials. Appl. Sci. 2020, 10, 8978. [Google Scholar] [CrossRef]
  20. Yu, X. Design and in-situ measurement of the acoustic performance of a metasurface ventilation window. Appl. Acoust. 2019, 152, 127–132. [Google Scholar] [CrossRef]
  21. Li, L.J.; Zheng, B.; Zhong, L.M.; Yang, J.; Liang, B.; Cheng, J.C. Broadband compact acoustic absorber with high-efficiency ventilation performance. Appl. Phys. Lett. 2018, 113, 103501. [Google Scholar] [CrossRef]
  22. Kumar, S.; Lee, H.P. Labyrinthine acoustic metastructures enabling broadband sound absorption and ventilation. Appl. Phys. Lett. 2020, 116, 134103. [Google Scholar] [CrossRef]
  23. Yang, M.; Sheng, P. An Integration Strategy for Acoustic Metamaterials to Achieve Absorption by Design. Appl. Sci. 2018, 8, 1247. [Google Scholar] [CrossRef] [Green Version]
  24. Jiménez, N.; Groby, J.-P.; Pagneux, V.; Romero-García, V. Iridescent Perfect Absorption in Critically-Coupled Acoustic Metamaterials Using the Transfer Matrix Method. Appl. Sci. 2017, 7, 618. [Google Scholar] [CrossRef]
  25. Zhang, J.; Romero-García, V.; Theocharis, G.; Richoux, O.; Achilleos, V.; Frantzeskakis, D.J. Dark solitons in acoustic transmission line metamaterials. Appl. Sci. 2018, 8, 1186. [Google Scholar] [CrossRef] [Green Version]
  26. Gritsenko, D.; Paoli, R. Theoretical optimisation of trapped-bubble-based acoustic metamaterial performance. Appl. Sci. 2020, 10, 5720. [Google Scholar] [CrossRef]
  27. Park, J.; Lee, D.; Rho, J. Recent advances in non-traditional elastic wave manipulation by macroscopic artificial structures. Appl. Sci. 2020, 10, 547. [Google Scholar] [CrossRef] [Green Version]
  28. Li, Y.; Liang, B.; Gu, Z.M.; Zou, X.Y.; Cheng, J.C. Unidirectional acoustic transmission through a prism with near-zero refractive index. Appl. Phys. Lett. 2013, 103, 053505. [Google Scholar] [CrossRef]
  29. Qi, S.; Assouar, B. Acoustic energy harvesting based on multilateral metasurfaces. Appl. Phys. Lett. 2017, 111, 243506. [Google Scholar] [CrossRef]
  30. Xie, Y.; Shen, C.; Wang, W.; Li, J.; Suo, D.; Popa, B.I.; Jing, Y.; Cummer, S.A. Acoustic Holographic Rendering with Two-dimensional Metamaterial-based Passive Phased Array. Sci. Rep. 2016, 6, 1–6. [Google Scholar] [CrossRef]
  31. Zhang, Z.; Wei, Q.; Cheng, Y.; Zhang, T.; Wu, D.; Liu, X. Topological Creation of Acoustic Pseudospin Multipoles in a Flow-Free Symmetry-Broken Metamaterial Lattice. Phys. Rev. Lett. 2017, 118, 1–6. [Google Scholar] [CrossRef] [PubMed]
  32. Chen, S.; Fan, Y.; Fu, Q.; Wu, H.; Jin, Y.; Zheng, J.; Zhang, F. A Review of Tunable Acoustic Metamaterials. Appl. Sci. 2018, 8, 1480. [Google Scholar] [CrossRef] [Green Version]
  33. Wu, F.; Xiao, Y.; Yu, D.; Zhao, H.; Wang, Y.; Wen, J. Low-frequency sound absorption of hybrid absorber based on micro-perforated panel and coiled-up channels. Appl. Phys. Lett. 2019, 114, 151901. [Google Scholar] [CrossRef]
  34. Yu, X.; Lu, Z.; Cheng, L.; Cui, F. On the sound insulation of acoustic metasurface using a sub-structuring approach. J. Sound Vib. 2017, 401, 190–203. [Google Scholar] [CrossRef]
  35. Fusaro, G.; Yu, X.; Kang, J.; Cui, F. Development of metacage for noise control and natural ventilation in a window system. Appl. Acoust. 2020, 170, 107510. [Google Scholar] [CrossRef]
  36. Guasch, O.; Arnela, M.; Sánchez-Martín, P. Transfer matrices to characterize linear and quadratic acoustic black holes in duct terminations. J. Sound Vib. 2017, 395, 65–79. [Google Scholar] [CrossRef]
  37. Asfour, O.S.; Gadi, M.B. A comparison between CFD and Network models for predicting wind-driven ventilation in buildings. Build. Environ. 2007, 42, 4079–4085. [Google Scholar] [CrossRef]
  38. Zhu, W.J.; Shen, W.Z.; Sørensen, N. High-order numerical simulations of flow-induced noise. Int. J. Numer. Methods Fluids 2010, 66, 17–37. [Google Scholar] [CrossRef]
  39. Delprat, N. Rossiter’s formula: A simple spectral model for a complex amplitude modulation process? Phys. Fluids 2006, 18, 071703. [Google Scholar] [CrossRef]
  40. Selamet, A.; Ji, Z.L. Acoustic Attenuation Performance of Circular Expansion Chambers with Extended Inlet/Outlet. J. Sound Vib. 1999, 223, 197–212. [Google Scholar] [CrossRef]
  41. Stinson, M.R.; Champoux, Y. Propagation of sound and the assignment of shape factors in model porous materials having simple pore geometries. J. Acoust. Soc. Am. 1992, 91, 685–695. [Google Scholar] [CrossRef]
  42. Allam, S.; Abom, M. A New Type of Muffler Based on Microperforated Tubes. J. Vib. Acoust. 2011, 133. [Google Scholar] [CrossRef]
Figure 1. (a) Schematic representation of the AMW unit structure (left) with an exploded view (right) where W is the acoustic metawindow (AMW) unit width (W = 0.13 m). (b) Details of the AMW unit and a unit cell, including their geometries and dimensions. Here, L (L = 0.4 m) and W are the AMW unit constants, length and width, respectively. The characterising measurements of the ventilation cavities are respectively B = 0.095 m and C = 0.067 m. Other geometrical parameters are the number of space cavities (N), length of each cavity (l), rotation angle (α), and channel air gap (g) (i.e., distance between one flank and the other), and their dimensions are N = 4; l = 0.066, 0.05, 0.033, and 0.016 m; α = 55°; and g = 0.024 m. This geometrical configuration of the AMW unit and the related measures specified here are used for the numerical and experimental analyses.
Applsci 11 03168 g001
Figure 2. (a) Schematic of boundary conditions used in numerical acoustics simulations; (b) 2D representation of experimental settings with m = 2 m being the length of the anechoic chamber’s inner area; (c) photograph of the experimental setup in the anechoic chamber.
Applsci 11 03168 g002
Figure 3. (a) Experimental analysis results in terms of IL related to measurement points A, B, and C. (b) Comparison of IL results related to the numerical and experimental studies on Points A and B. Six peaks are distributed along the overall range, where the first is between 300 and 1000 Hz, the second between 1000 and 2000 Hz, the third between 2000 and 3000 Hz, the fourth between 3000 and 4000 Hz, and the fifth and sixth between 4000 and 5000 Hz.
Applsci 11 03168 g003
Figure 4. (a) Sketches of the upgraded AMW unit models through the perforation of the side panels of the AMM unit frame (the position of the perforated panels is shown in the section schematic with thicker blue lines); (b) IL numerical comparison between the original AMW unit model and the perforated ones (A–C); (c) contribution assessment of the flanks in combination with the resonant volume extension (through perforation).
Applsci 11 03168 g004
Figure 5. Pressure drop against inlet air velocities for (a) different AMW unit configurations and (b) Configuration B with different percentages of ventilation opening.
Applsci 11 03168 g005
Table 1. CV value calculated between the numerical results and the experimental results of specific frequency ranges.
Frequency Ranges (Hz)
300–10001000–20002000–30003000–40004000–5000
CV (A)36.34%28.05%39.55%22.63%28.62%
CV (B)89.45%33.07%32.97%21.80%39.92%
Publisher’s Note: MDPI stays neutral with regard to jurisdictional claims in published maps and institutional affiliations.

