Article

Monte-Carlo-Based Estimation of the X-ray Energy Spectrum for CT Artifact Reduction

Imec-Vision Lab, Department of Physics, University of Antwerp, 2610 Antwerp, Belgium
*
Author to whom correspondence should be addressed.
Appl. Sci. 2021, 11(7), 3145; https://doi.org/10.3390/app11073145
Submission received: 9 March 2021 / Revised: 26 March 2021 / Accepted: 26 March 2021 / Published: 1 April 2021
(This article belongs to the Special Issue Nondestructive Testing (NDT): Volume II)

Abstract

:
Beam hardening and scattering effects can seriously degrade image quality in polychromatic X-ray CT imaging. In recent years, polychromatic image reconstruction techniques and scatter estimation using Monte Carlo simulation have been developed to compensate for beam hardening and scattering CT artifacts, respectively. Both techniques require knowledge of the X-ray tube energy spectrum. In this work, Monte Carlo simulations were used to calculate the X-ray energy spectrum of FleXCT, a novel prototype industrial micro-CT scanner, enabling beam hardening and scatter reduction for CT experiments. Both source and detector were completely modeled by Monte Carlo simulation. In order to validate the energy spectra obtained via Monte Carlo simulation, they were compared with energy spectra obtained via a second method. Here, energy spectra were calculated from empirical measurements using a step wedge sample, in combination with the Maximum Likelihood Expectation Maximization (MLEM) method. Good correlation was achieved between both approaches, confirming the correct modeling of the FleXCT system by Monte Carlo simulation. After validation of the modeled FleXCT system through comparing the X-ray spectra for different tube voltages inside the detector, we calculated the X-ray spectrum of the FleXCT X-ray tube, independent of the flat panel detector response, which is a prerequisite for beam hardening and scattering CT artifacts.

1. Introduction

Interest in modeling and/or characterizing an X-ray energy spectrum of a modern X-ray instrument highly depends on its specific application. For X-ray micro-CT applications, information on the X-ray energy spectrum can be used to compensate for artifacts that arise due to interaction of photons with the object being scanned, such as beam hardening [1] or scatter artifacts [2,3]. Aside from that, knowledge on the X-ray tube spectrum can also be used to mitigate artifacts that arise due to flat-field correction [4] or to discriminate between different materials present within the object [5]. Moreover, the spectrum of the X-ray source is a mandatory input in several cases: (1) for polychromatic CT reconstructions [6,7], (2) when a physical simulator is used to replicate a CT-system in order to study a particular aspect related to interactions of photons with the object [8,9] and (3) for X-ray dose estimation [10].
Since the invention of the first modern X-ray tube in 1916 [11], the estimation of the spectral composition of the emitted X-ray radiation has been investigated and addressed in many ways. The difficulty in measuring the generated radiation mainly arises from the common usage of energy-integrating detectors and lack of information about the energy response of the detector. Energy-resolving detectors, such as cadmium telluride [12] and cadmium zinc telluride [13], require a fine control of environmental conditions and cannot be directly utilized since they suffer from charge trapping, charge sharing and/or limited count rate, resulting in pile-up effects [14]. Overall, precise direct experimental measurement of the X-ray spectrum is challenging and requires special equipment, which is only available in some laboratories. In addition, the X-ray spectrum measured by this method includes the detector energy response, which is not suitable for applications such as CT artifact reduction techniques.
Monte Carlo simulation can be used as a valuable alternative for direct experimental measurement to estimate the X-ray spectrum of an X-ray imaging system inside the detector, provided that the simulation model is validated. In addition, using Monte Carlo simulation, it is also possible to calculate the emitted X-ray energy spectrum in front of the tube, independent of the detector energy response. In recent years, a large number of researchers have used Monte Carlo simulation for calculating X-ray energy spectra [15,16,17,18], but to our knowledge, studies that validate the simulation results with empirical data remain scarce. The main objective of this study is proposing a validated Monte Carlo based approach to calculate the required X-ray energy spectrum for beam hardening and scattering CT artifact reduction using polychromatic reconstruction algorithms [6,19] and scatter pattern estimation methods [20,21], respectively.

2. Materials and Methods

In Section 2.1, FleXCT [22], a novel prototype industrial micro-CT scanner, is modeled by Monte Carlo simulation. In order to validate the obtained X-ray energy spectra, an experimental technique using Maximum Likelihood Expectation Maximization (MLEM) was implemented (Section 2.2). When using the MLEM method, only the estimation of the X-ray spectrum inside the detector is possible; therefore, as a first step, X-ray spectra for different tube voltages were calculated inside the detector. After validation of the modeled FleXCT system (Section 3), the X-ray spectrum was calculated in front of the FleXCT’s X-ray tube, independent of the flat panel detector response (Section 2.1.2 and Section 3). The proposed approach is explained in detail in the following sections.

2.1. Monte Carlo Simulation

2.1.1. Calculation of X-ray Spectrum Inside the Flat Panel Detector

Monte Carlo simulation is a powerful tool for modeling X-ray/gamma radiation based imaging and measuring systems [23,24,25,26,27,28,29,30]. In this work, the X-ray tube and flat panel detector of the FleXCT system were modeled using Monte Carlo N-Particle (MCNP) code, version X [31]. The FleXCT system covers a wide energy range (20–230 kV), which allows analyzing a wide variety of samples from low absorbing materials (e.g., biological samples, polymers) to dense materials (e.g., stone, rock, metals) [22]. Its X-ray tube (X-ray WorX GmbH, Germany) is a reflection-based type and consists of an electron source (cathode), a tiled Tungsten target (anode) and a 1 mm beryllium window, as depicted in Figure 1. The incident angle between the electron beam and the anode is 43°.
The flat panel detector was modeled as a 3-layered rectangular uniform plate (see Figure 1). The simulated flat panel detector consists of a carbon layer (750 µm thickness), a polyethylene layer (250 µm thickness) and a gadolinium oxysulfide (GadOx, Gd2O2S:Tb) scintillator layer. The simulated GadOx scintillator layer has a thickness of 250 µm and a density of 4.8 g/cm3 (58% GadOx powder with a density of 7.34 g/cm3 and 42% epoxy glue with a density of 1.23 g/cm3). The incident X-ray radiation interacts with the GadOx scintillator and is converted into visible light; the carbon and polyethylene layers are used to protect the scintillator layer of the flat panel detector against visible light and mechanical damage. A silicon layer was included in the model to consider the backscattering photons from the electronics behind the detector. The X-ray energy spectrum was calculated inside the GadOx scintillator layer in an area in the center of the beam using photon energy deposition pulse height tally (*F8:P) and energy bin (E8) cards using the MCNP code. All simulations were performed with low statistical error (less than 0.01) using the STOP card in the input file of MCNP code. The calculated X-ray spectra inside the flat panel detector obtained by simulations in this section were compared with the empirically measured X-ray data using the MLEM method, which is detailed in Section 2.2.

2.1.2. Calculation of the Emitted X-ray Spectrum

For beam hardening and scattering artifact reduction methods, it is required that the X-ray energy spectrum be independent from the flat panel energy response. Therefore, after validation of the modeled FleXCT system including the X-ray tube and flat panel (see Section 3, “Results and Discussion”), the X-ray tube of the FleXCT scanner was simulated and the emitted X-ray energy spectrum was calculated in front of the target just after the beryllium window, using a point detector (tally type F5). The model used for calculating the tube spectrum for 2 different cases is shown in Figure 2: (1) for tube voltage of 230 kV and without any external filter (see Figure 2a), and (2) for tube voltage of 230 kV and with a 1 mm copper filter (see Figure 2b).

2.2. Maximum Likelihood Expectation Maximization Method (MLEM)

2.2.1. Theory and Mathematical Calculations

To validate the Monte Carlo simulation results, the MLEM method was used. MLEM is a mathematical optimization method that can be applied to the reconstruction of the X-ray energy spectrum inside the flat panel detector from transmission measurements of the X-ray radiation through an object with known shape and material composition [32,33,34,35]. The object usually used for this purpose is a so-called “step wedge” phantom, which is composed of a uniform material with different steps, each with a different thickness. Such a sample allows us to write down a discrete system of linear integral equations on the X-ray absorption through the object. When solved, it provides the unknown energy bins that compose the original X-ray spectrum of the source.
The polychromatic X-ray image formation can be described as follows:
I ( x ,   L r ,   ϵ ) = I 0 ϵ m i n ϵ m a x D ( ϵ ) S ( ϵ   ) e x p   (   L r μ ( x ,   ϵ ) d x )   d ϵ
with I ( x ,   L r ,   ϵ ) the measured X-ray photon intensity at a detector pixel r , L r the path length from the source to that detector pixel, I 0   the total measured X-ray intensity without a sample, ϵ the energy of the X-rays, D ( ϵ ) the detector response function, S ( ϵ ) the normalized source spectrum, μ ( x ,   ϵ ) the attenuation coefficient at location x and energy ϵ . By discretizing the spectrum and defining W ( ϵ ) = I 0 D ( ϵ ) S ( ϵ ) , one obtains:
p ( x ,   L r ) = e = 1 E w ( e ) e x p   (   L r μ ( x ,   e ) d x )
where e is number of energy bin. Since the composition and dimensions of the step wedge are known, we can create a simulated polychromatic projection of the step wedge, p ˜ , using this model for any estimated spectrum w ˜ . If the step wedge has N   total steps and we denote the thickness of the n t h step as l n , then we have:
p n =   e = 1 E w ( e ) e x p   (   l n   μ ( e ) )
with p n the measurement through the n t h step, assuming parallel beam projections, and μ ( ϵ ) the attenuation coefficient of the material of the step wedge at energy e . When defining A e n as:
A e n =   e x p   (   l n   μ ( e ) )
the following linear system of equations needs to be solved for the unknown spectrum w :
p n = e = 1 E w ( e ) A e n
The matrix A can be precalculated based on the available data on material and phantom dimensions. The MLEM method is then applied to solve the linear system. This method has a multiplicative update step which guarantees positivity of all coefficients [32]. The k t h iteration step of the MLEM method is then provided by:
w k ( e ) = w k 1 ( e ) n A e n p n e A e n w k 1 ( e ) n A e n
Note that this method cannot fit to characteristic lines, since the update step cannot introduce discontinuities, and, as such, these have to already be present in the initial guess ( w 0 ).

2.2.2. Experiments

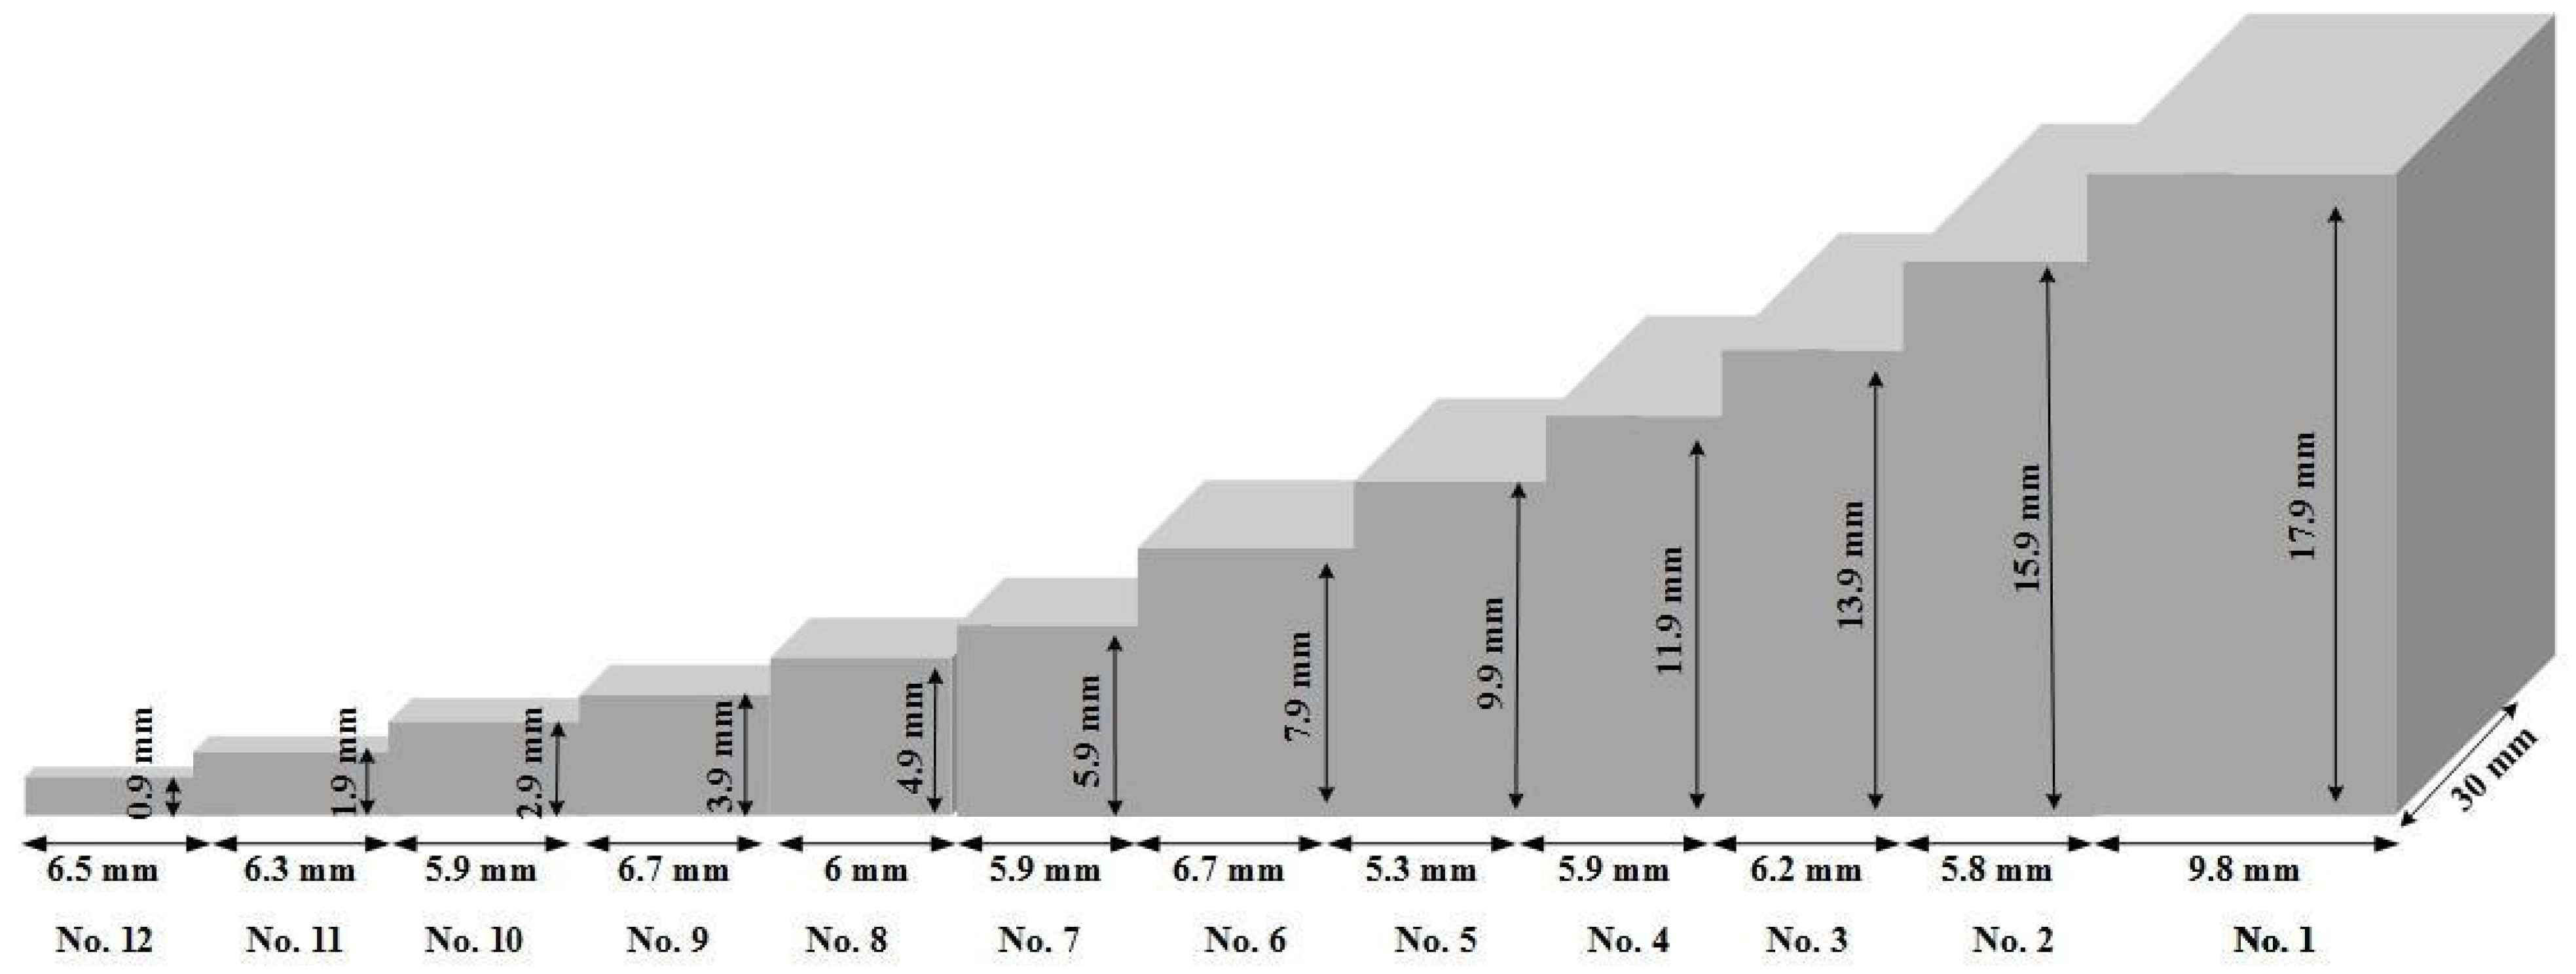
In order to provide the required data for the MLEM method, an experimental setup was established to scan a polyvinyl chloride (PVC) step wedge using FelXCT, a micro tomography imaging system. It is worth mentioning that X-ray micro tomography imaging systems have been widely used for a variety of applications [19,36,37,38]. A geometric sketch of the step wedge is shown in Figure 3.
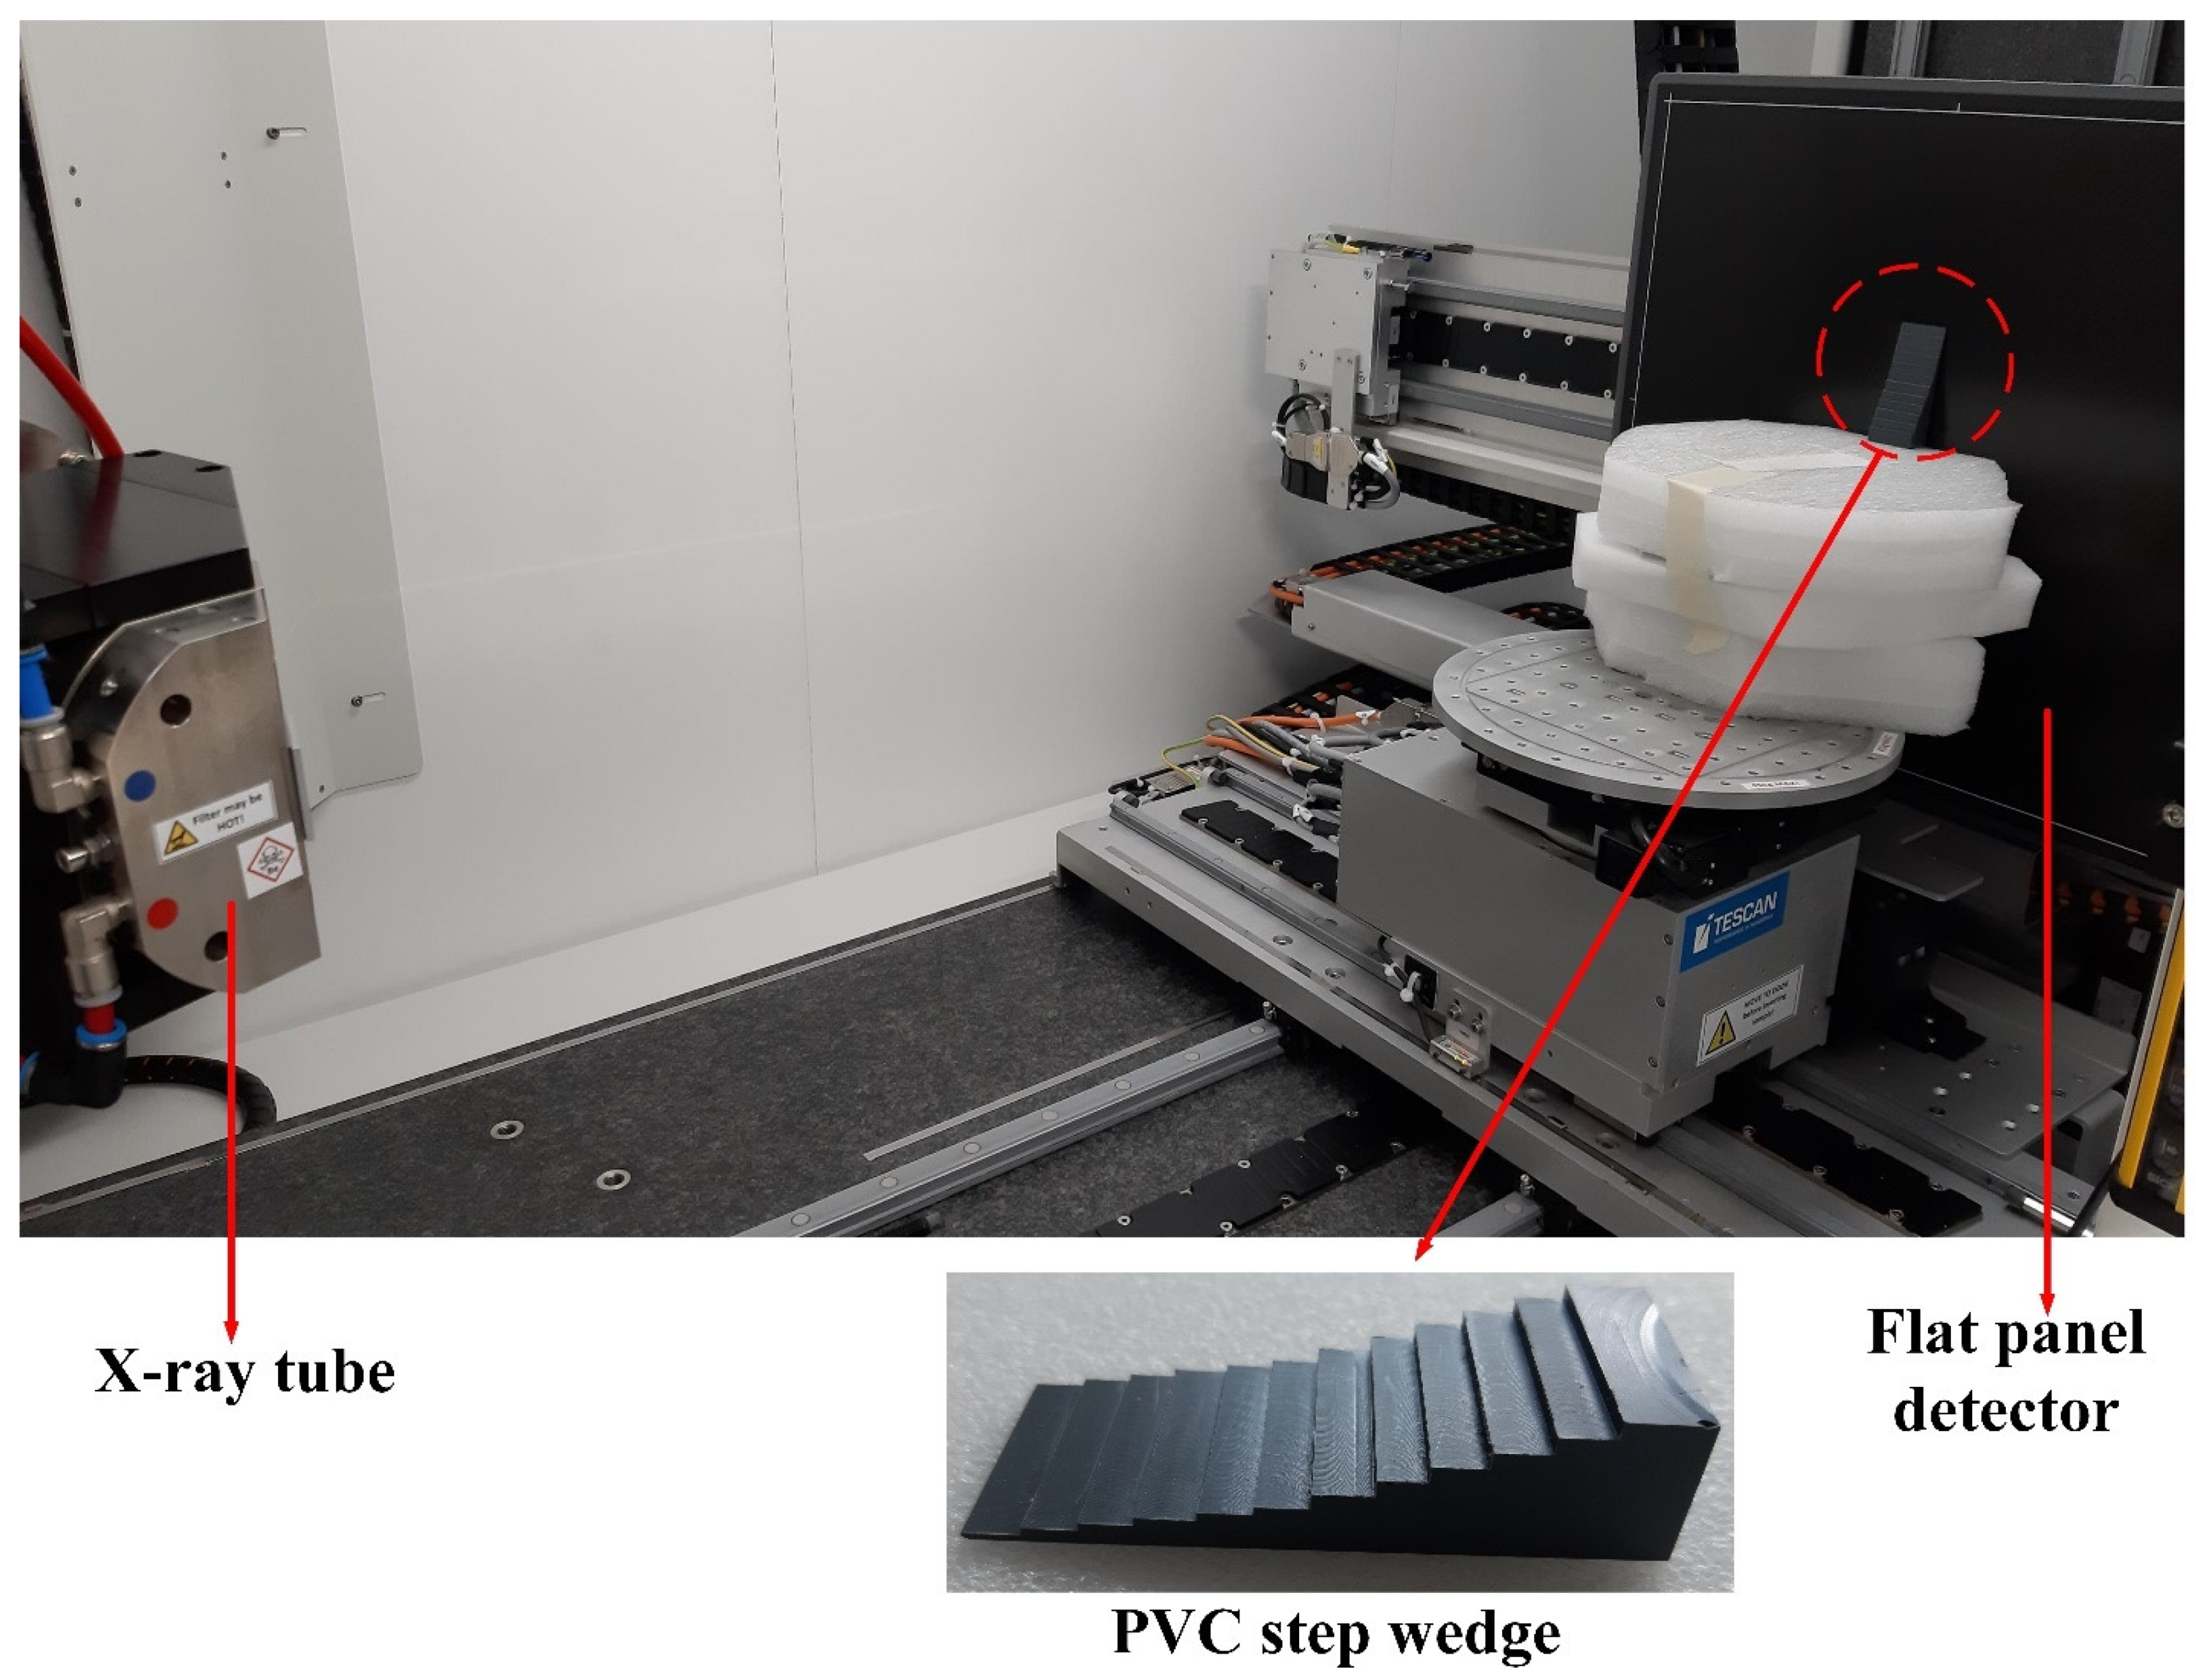
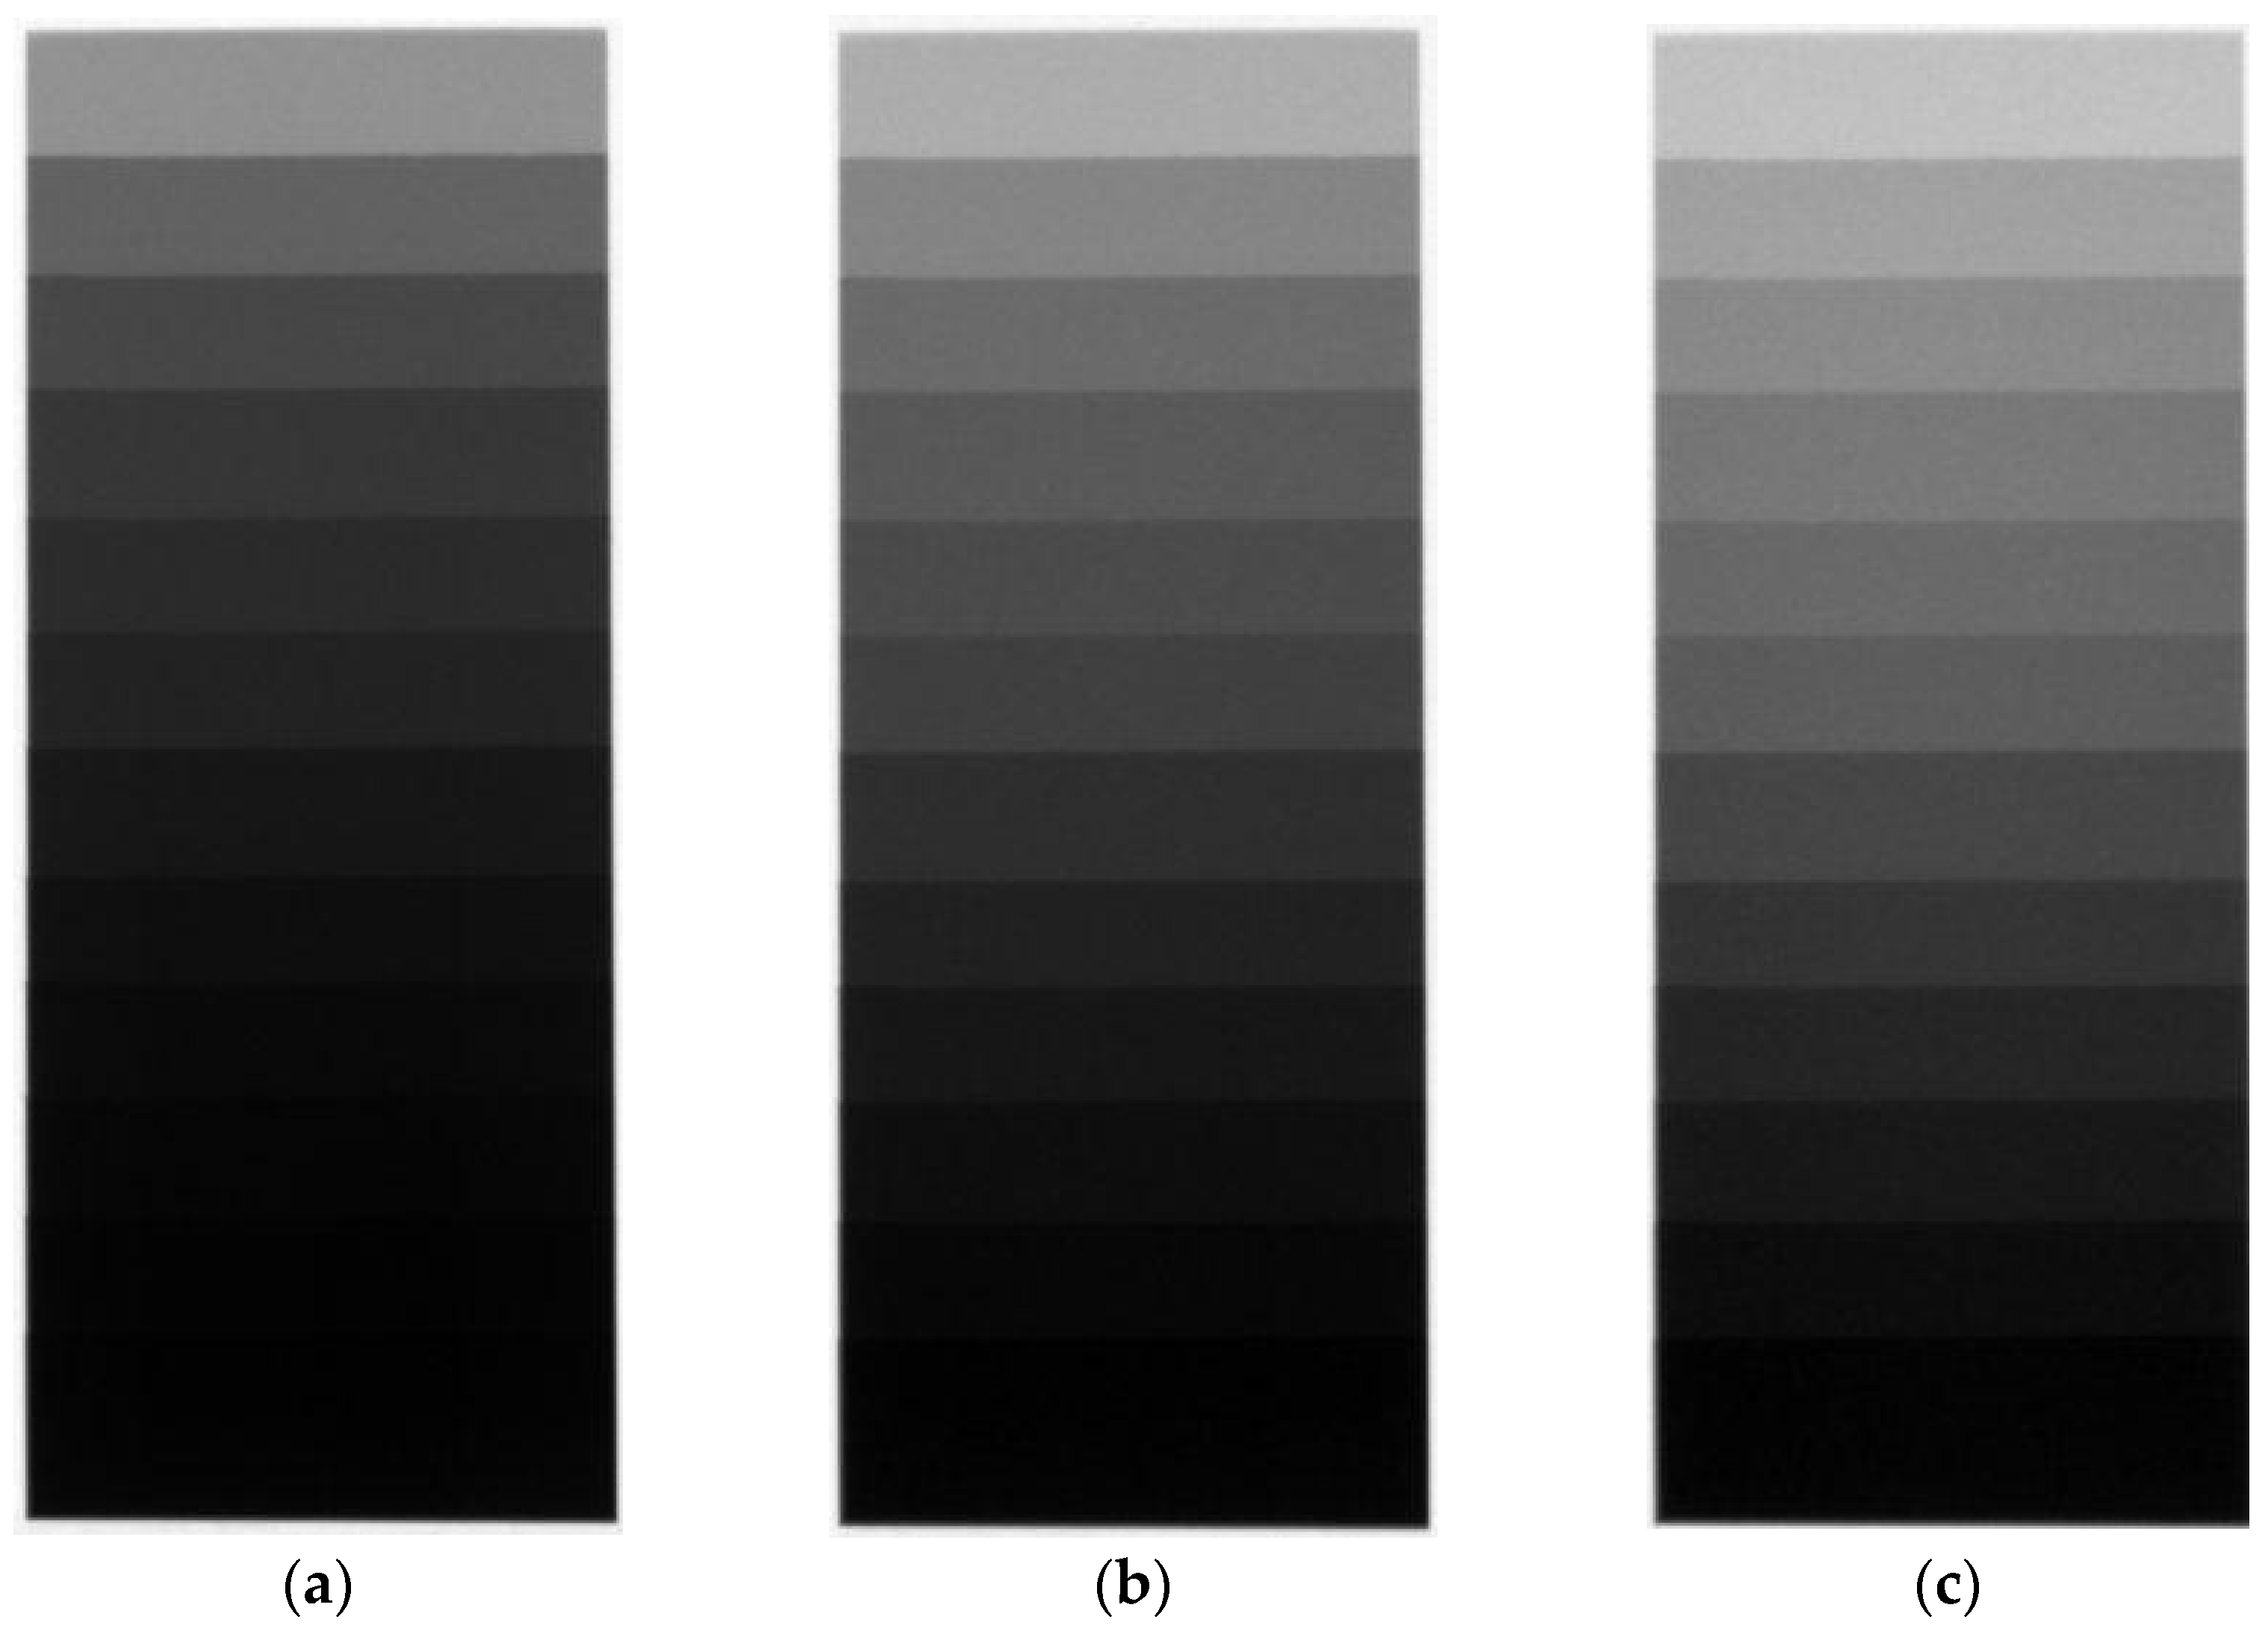
Since the FleXCT scanner produces an X-ray cone beam and the MLEM method assumes that the X-rays pass the sample in a parallel way, the experimental setup should be arranged in such a way that it optimally fulfils the MLEM method prerequisites. The FleXCT X-ray scanner instrument has 10 motorized axes to move the sample, detector and X-ray tube with respect to each other, allowing not only conventional radiography or CT, but a wide range of other scanning geometries (e.g., laminography, dynamic zooming, helical CT, 4DCT) [19]. This versatility of the instrument could be optimally used to approach parallel beam conditions. To accomplish this, the flat panel detector was placed at a distance of 1 m from the X-ray source, after which the PVC step wedge was put as close as possible to the detector (see Figure 4). In the next step, the axis center of the X-ray cone beam and center of the detector was aligned with the center of each step wedge separately, after which a radiograph was taken for each tube voltage (60–200 kV, 96 scans). In order to reduce the radiograph noise, 10 replicates were made for each radiograph, resulting in a total measuring time of 500 ms per step. After scanning all 12 steps for each tube voltage, the step wedge was removed, after which both flat and dark field projections were taken. After flat field and dark field correction, a region of interest (ROI) was defined in the center of each step (approx. 1 × 1 mm2), of which the mean value was used in the MLEM calculations. Figure 5 shows normalized projections of the step wedge for the center of the beam set in the center of step wedge no. 11 for tube voltages of 60, 100 and 180 kV.

2.2.3. Initial Guess

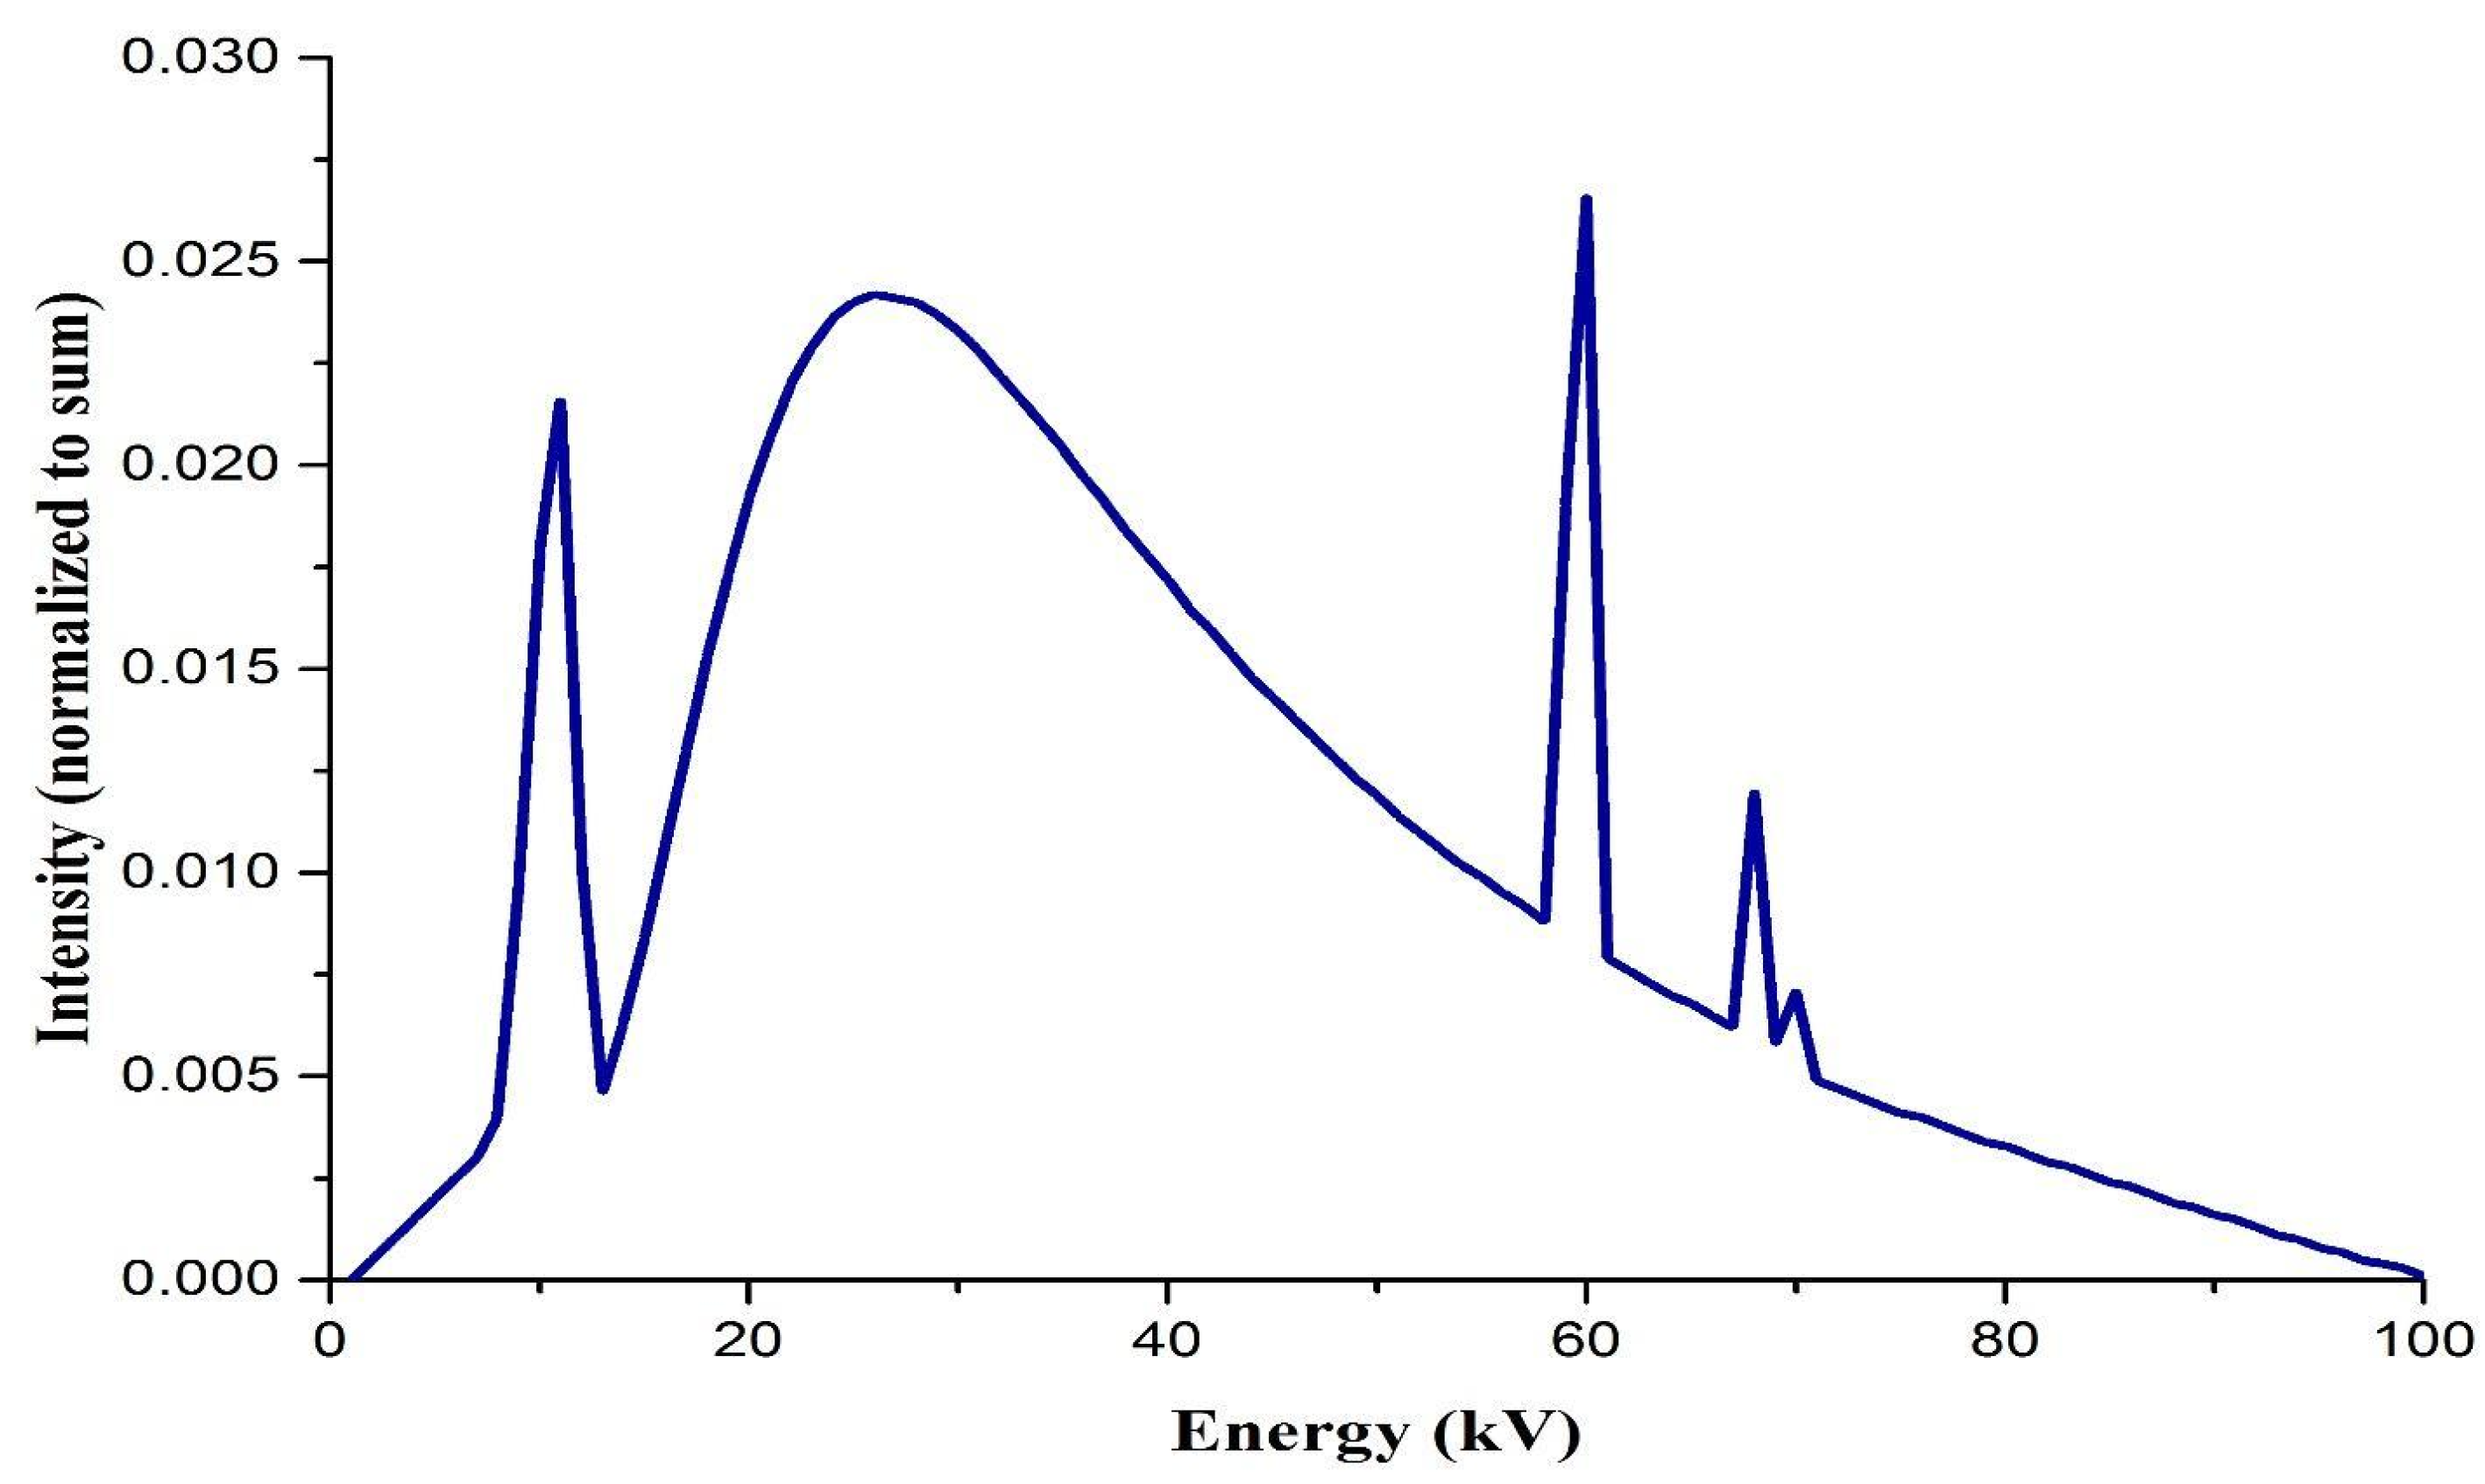
As mentioned in Section 2.2.1, the MLEM method does not consider the X-ray tube characteristic peaks, nor the detector response function discontinuities. Typically, a general X-ray energy spectrum which already includes characteristic lines is therefore inserted in MLEM calculations as an initial guess. To generate such an initial guess, an X-ray spectrum that only includes the characteristic peaks of the tungsten anode (W-Kα = 59.3 keV, W-Kβ1 = 67.2 keV, W-Kβ2 = 69.1 keV, W-Lα1 = 8.3 keV) was generated for each tube voltage using the electronic version of the Institute of Physics and Engineering in Medicine (IPEM) [39]. The generated X-ray spectrum obtained by using the electronic version of IPEM (report no. 78) for a tube voltage of 100 kV is shown in Figure 6.
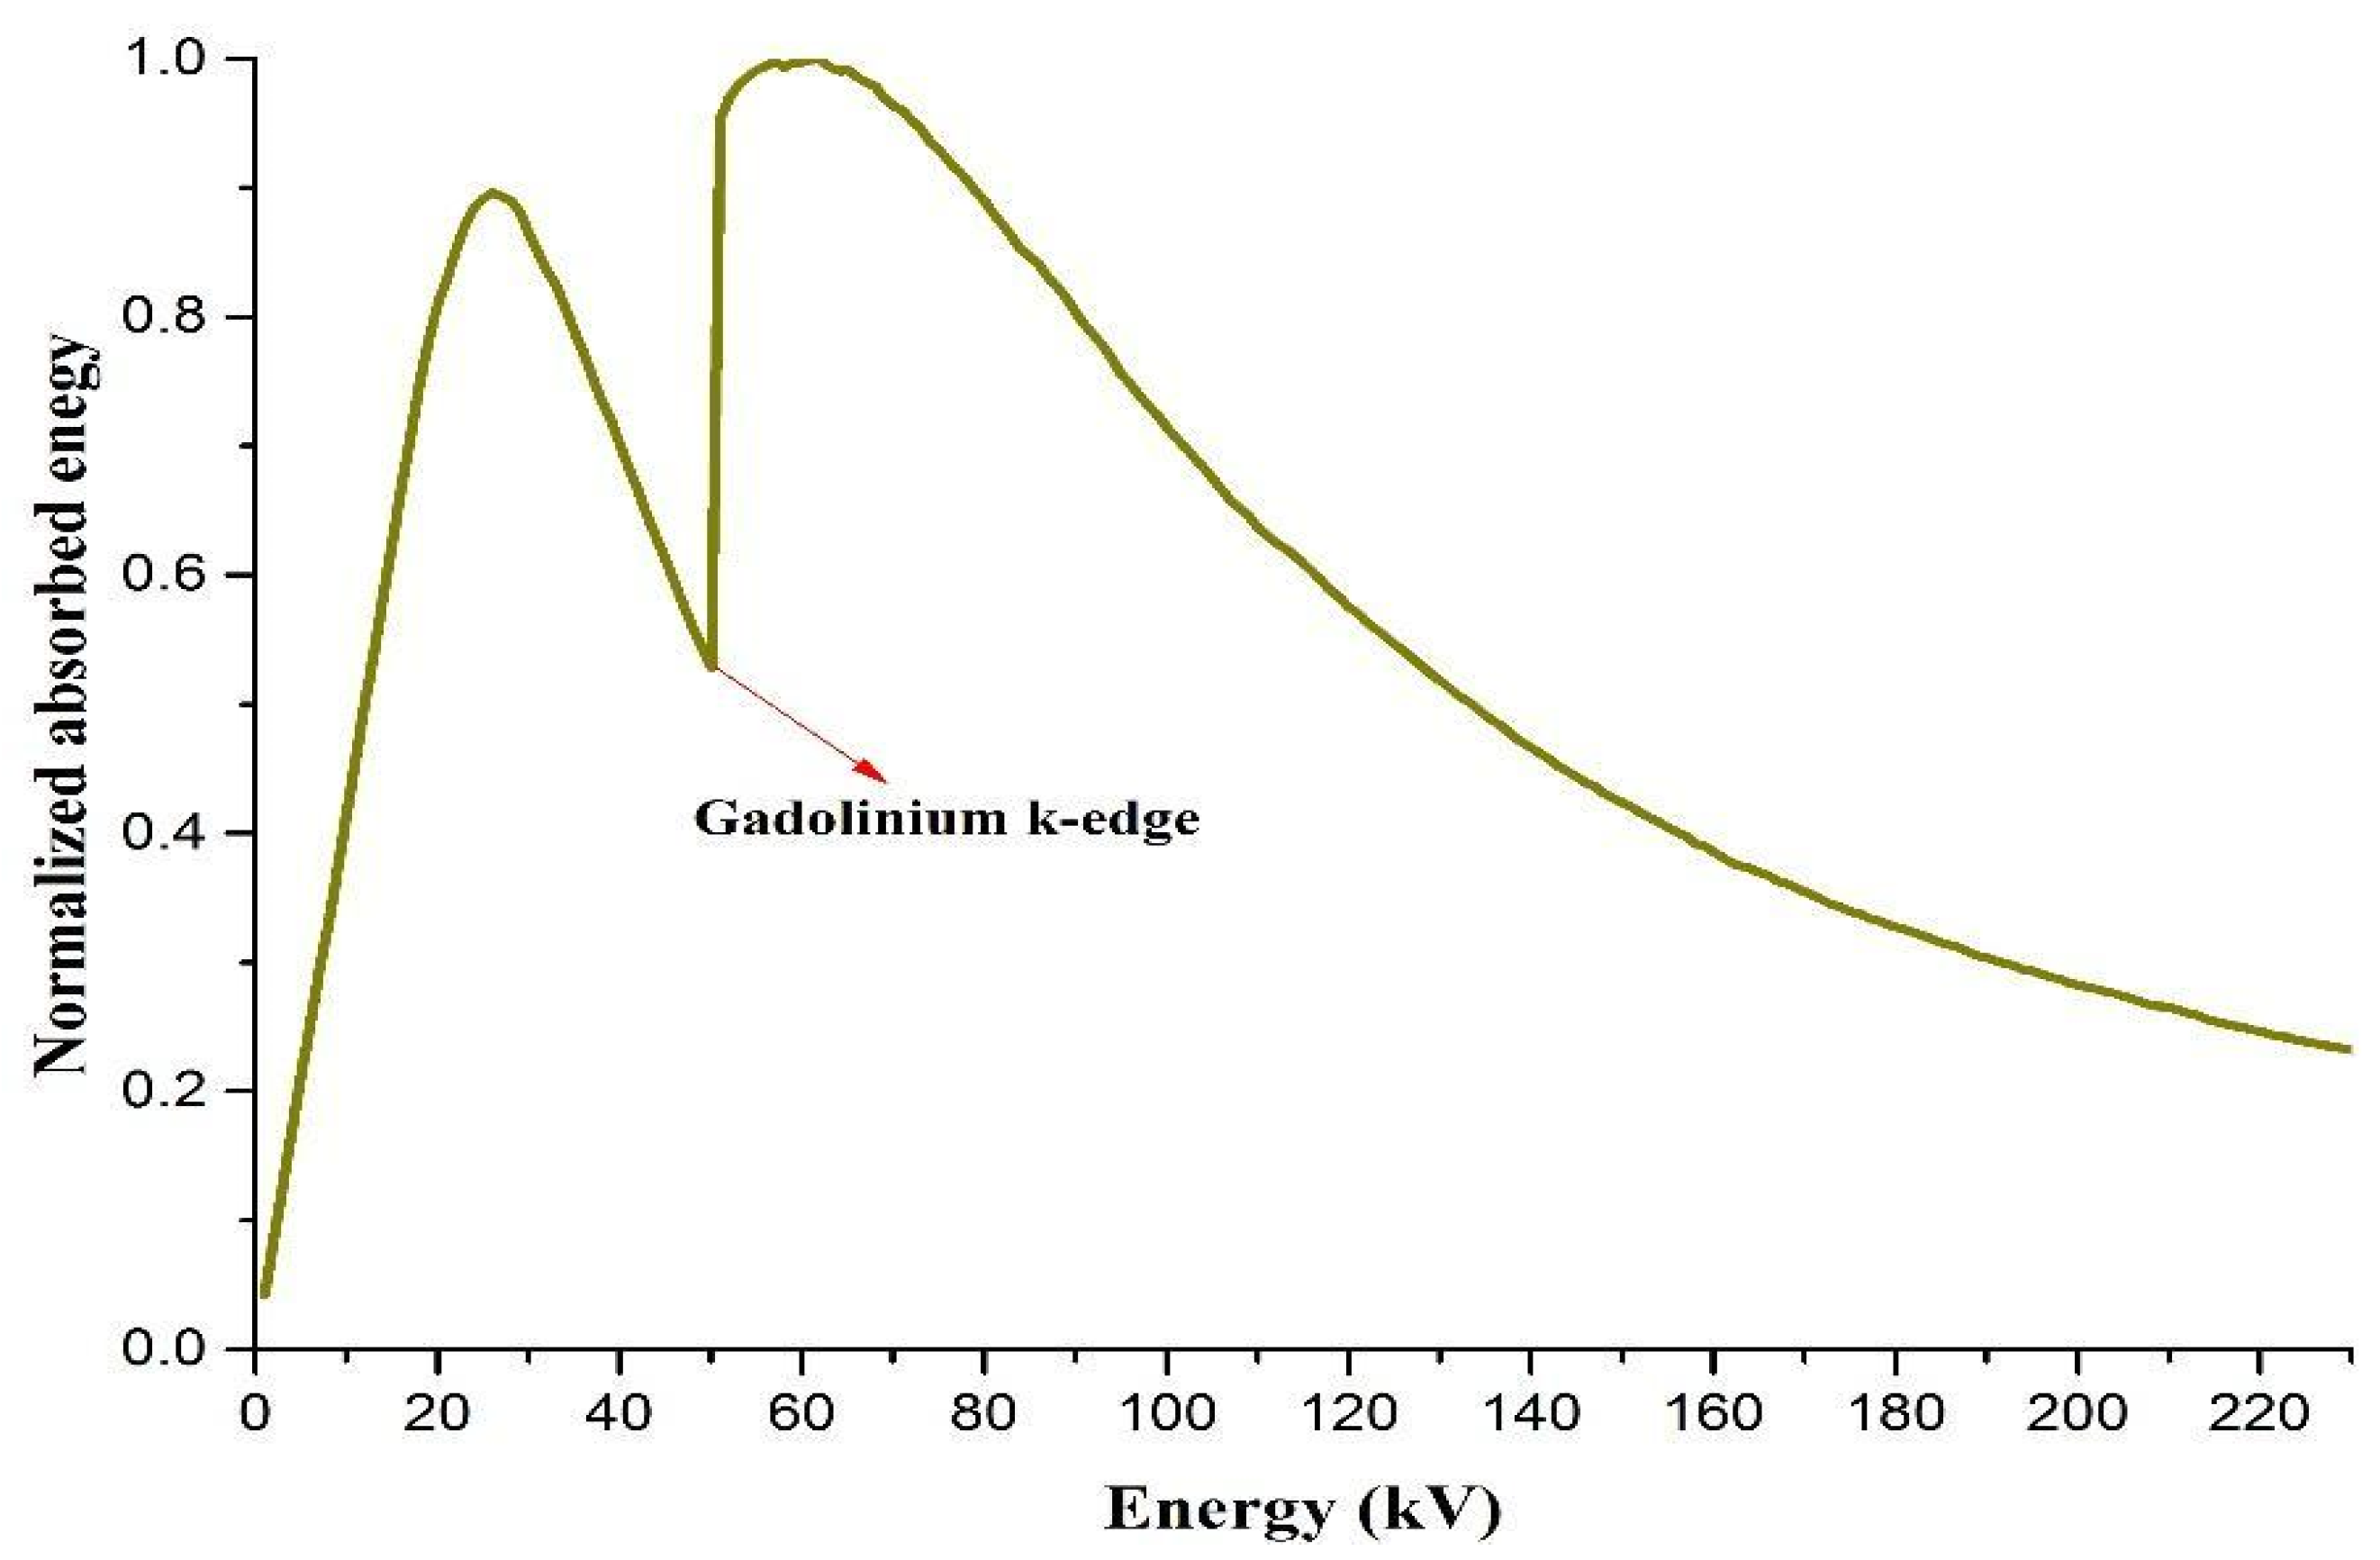
In the second phase, the energy absorption response function of the GadOx scintillator was calculated by using several individual Monte Carlo simulations. A mono-energetic photon beam was simulated in front of the GadOx scintillator layer (see Section 2.1.1 for scintillator parameters), after which, energy deposition in the scintillator was registered for each energy interval. The energy deposition in the scintillator versus the energy of the incident photon beam, the so-called energy absorption response function, is shown in Figure 7. The discontinuity around 50 kV is caused by the gadolinium (Gd) K-edge. The product of the general X-ray spectrum (obtained by IPEM report number 78) for each tube voltage multiplied with the normalized absorption response function of the GadOx scintillator, was then used as an initial guess for the MLEM calculations.

3. Results and Discussion

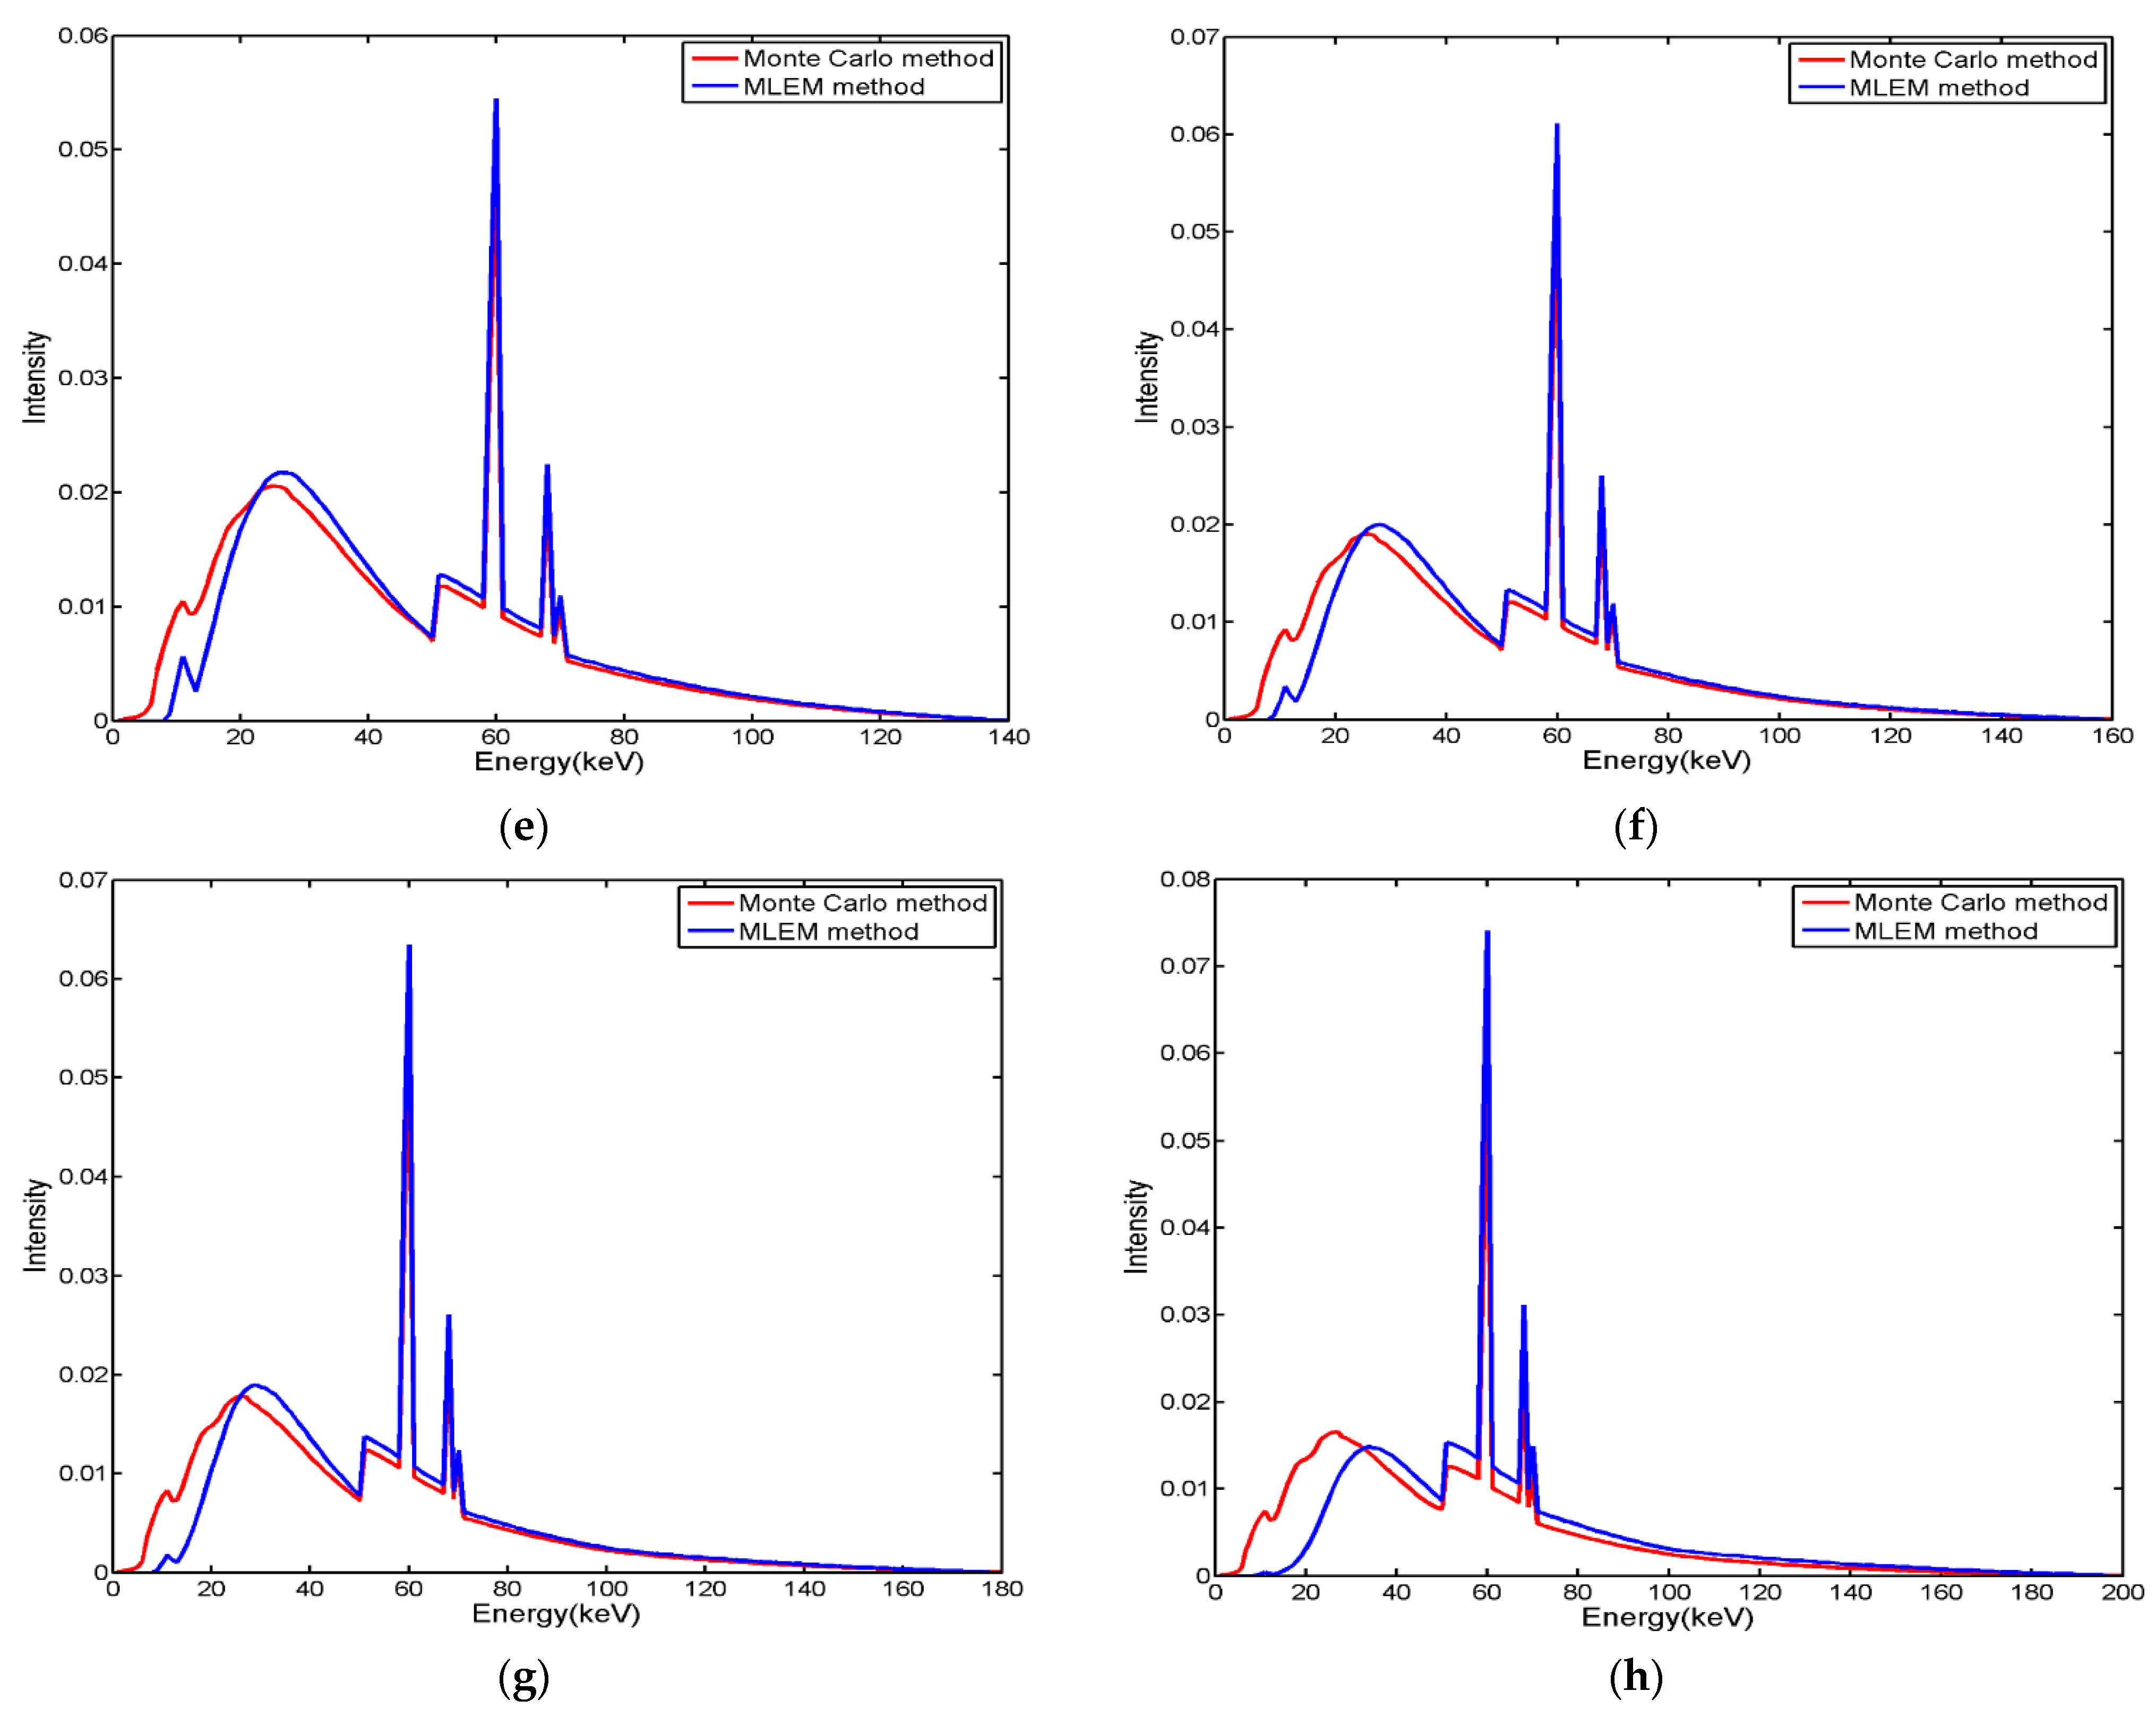
The normalized X-ray energy spectra obtained both from Monte Carlo simulation and MLEM methods for different tube voltages (in the range of 60–200 kV) are shown in Figure 8, from which good agreement between both methods can be observed.
In order to better evaluate the agreement between the obtained results, the root mean square error (RMSE) between the spectra obtained from Monte Carlo simulation and MLEM method was calculated for each tube voltage using the following equation:
R M S E =   [ i = 1 N ( S i ( M o n t e   C a r l o ) S i ( M L E M ) ) 2 N ] 0.5
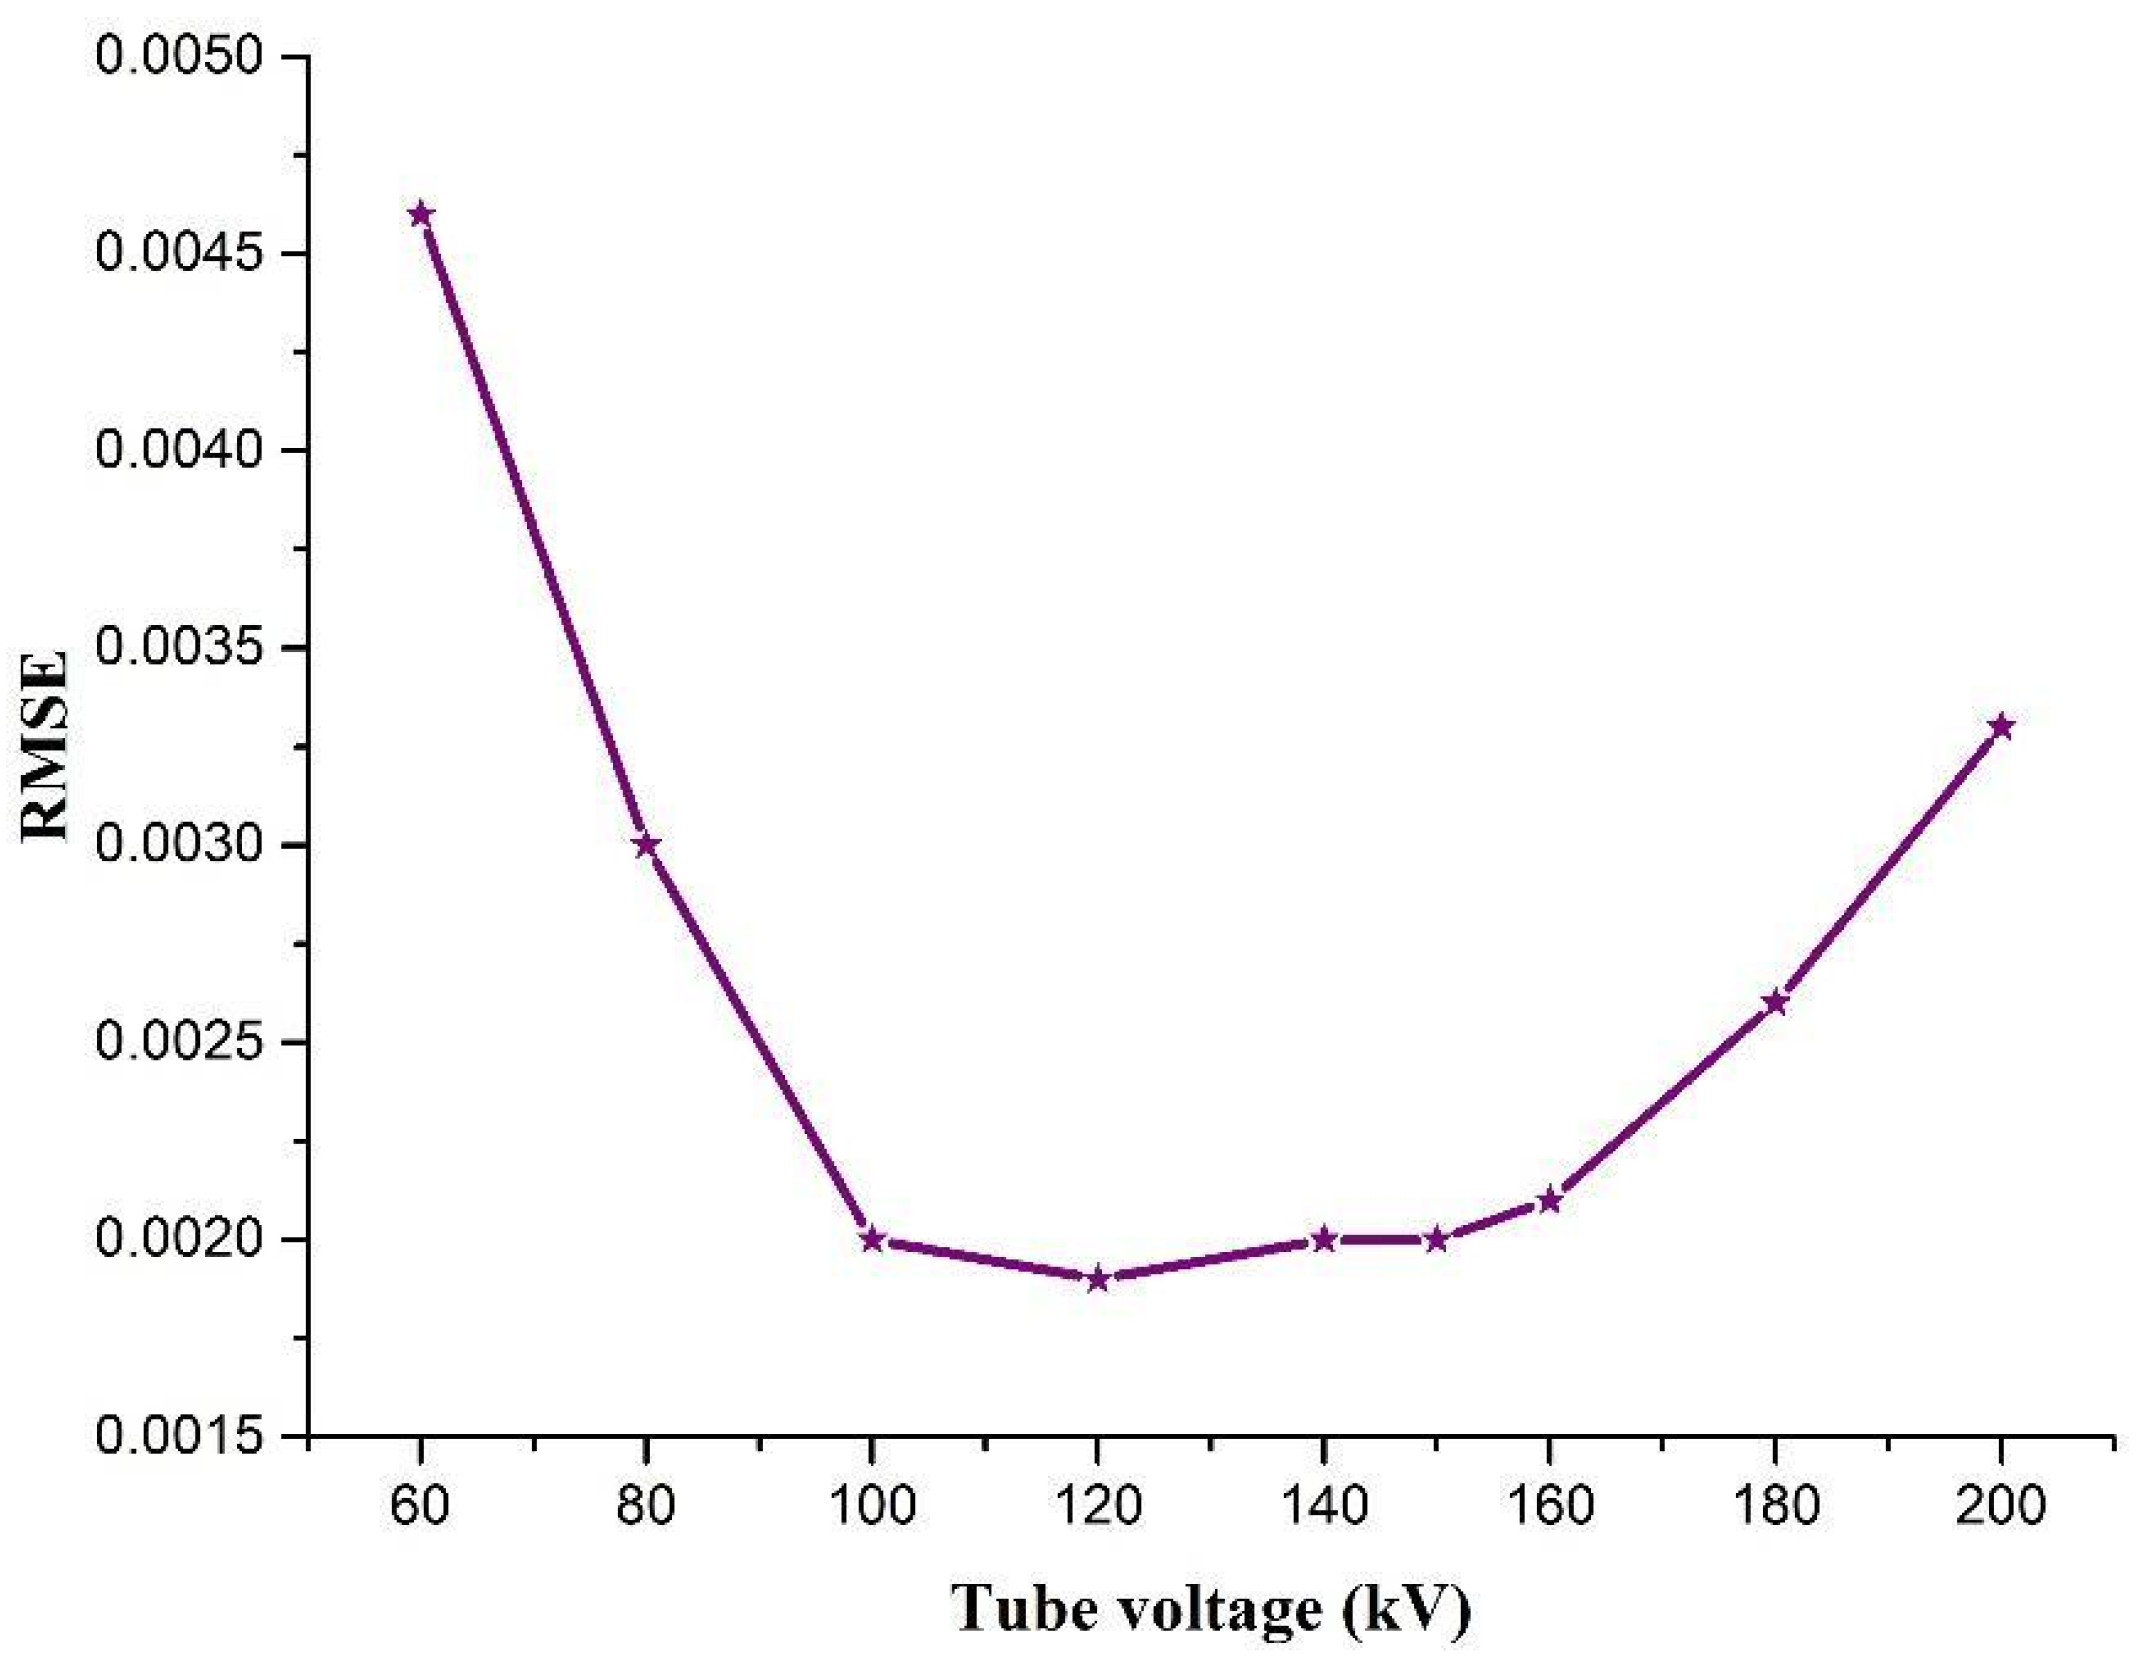
where Si(Monte Carlo) and Si(MLEM) represent the intensity in each 1 keV energy bin in the spectrum obtained by Monte Carlo simulation and the MLEM method, respectively. N represents the total number of 1 keV energy bins in each spectrum, for example, N = 160 represents the spectrum obtained for a tube voltage of 160 kV. The RMSE versus tube voltage is provided in Figure 9. As can be observed from Figure 9, by increasing the tube voltage, the RMSE decreases up to a tube voltage of 100 kV and remains almost constant up to 160 kV. After 160 kV, the RMSE increases again. The reason for the higher RMSE for lower tube voltages is that the majority of low energy photons are absorbed in the initial, thicker steps (mainly steps no. 1–3), and only a small portion of high energy photons passes through the remaining steps. A lower number of transmitted photons leads to a lower signal-to-noise ratio for pixel values belonging to thick steps, which consequently causes a higher error in MLEM calculations. The reason the RMSE for higher tube voltages is relatively high is that when the tube voltage is increased, the ratio of high energy photons is increased as well. These high energy photons, in turn, cause lower contrast in pixel values belonging to the thin steps (especially for step no. 11 and step no. 12), which consequently leads to a higher RMSE for MLEM calculations.
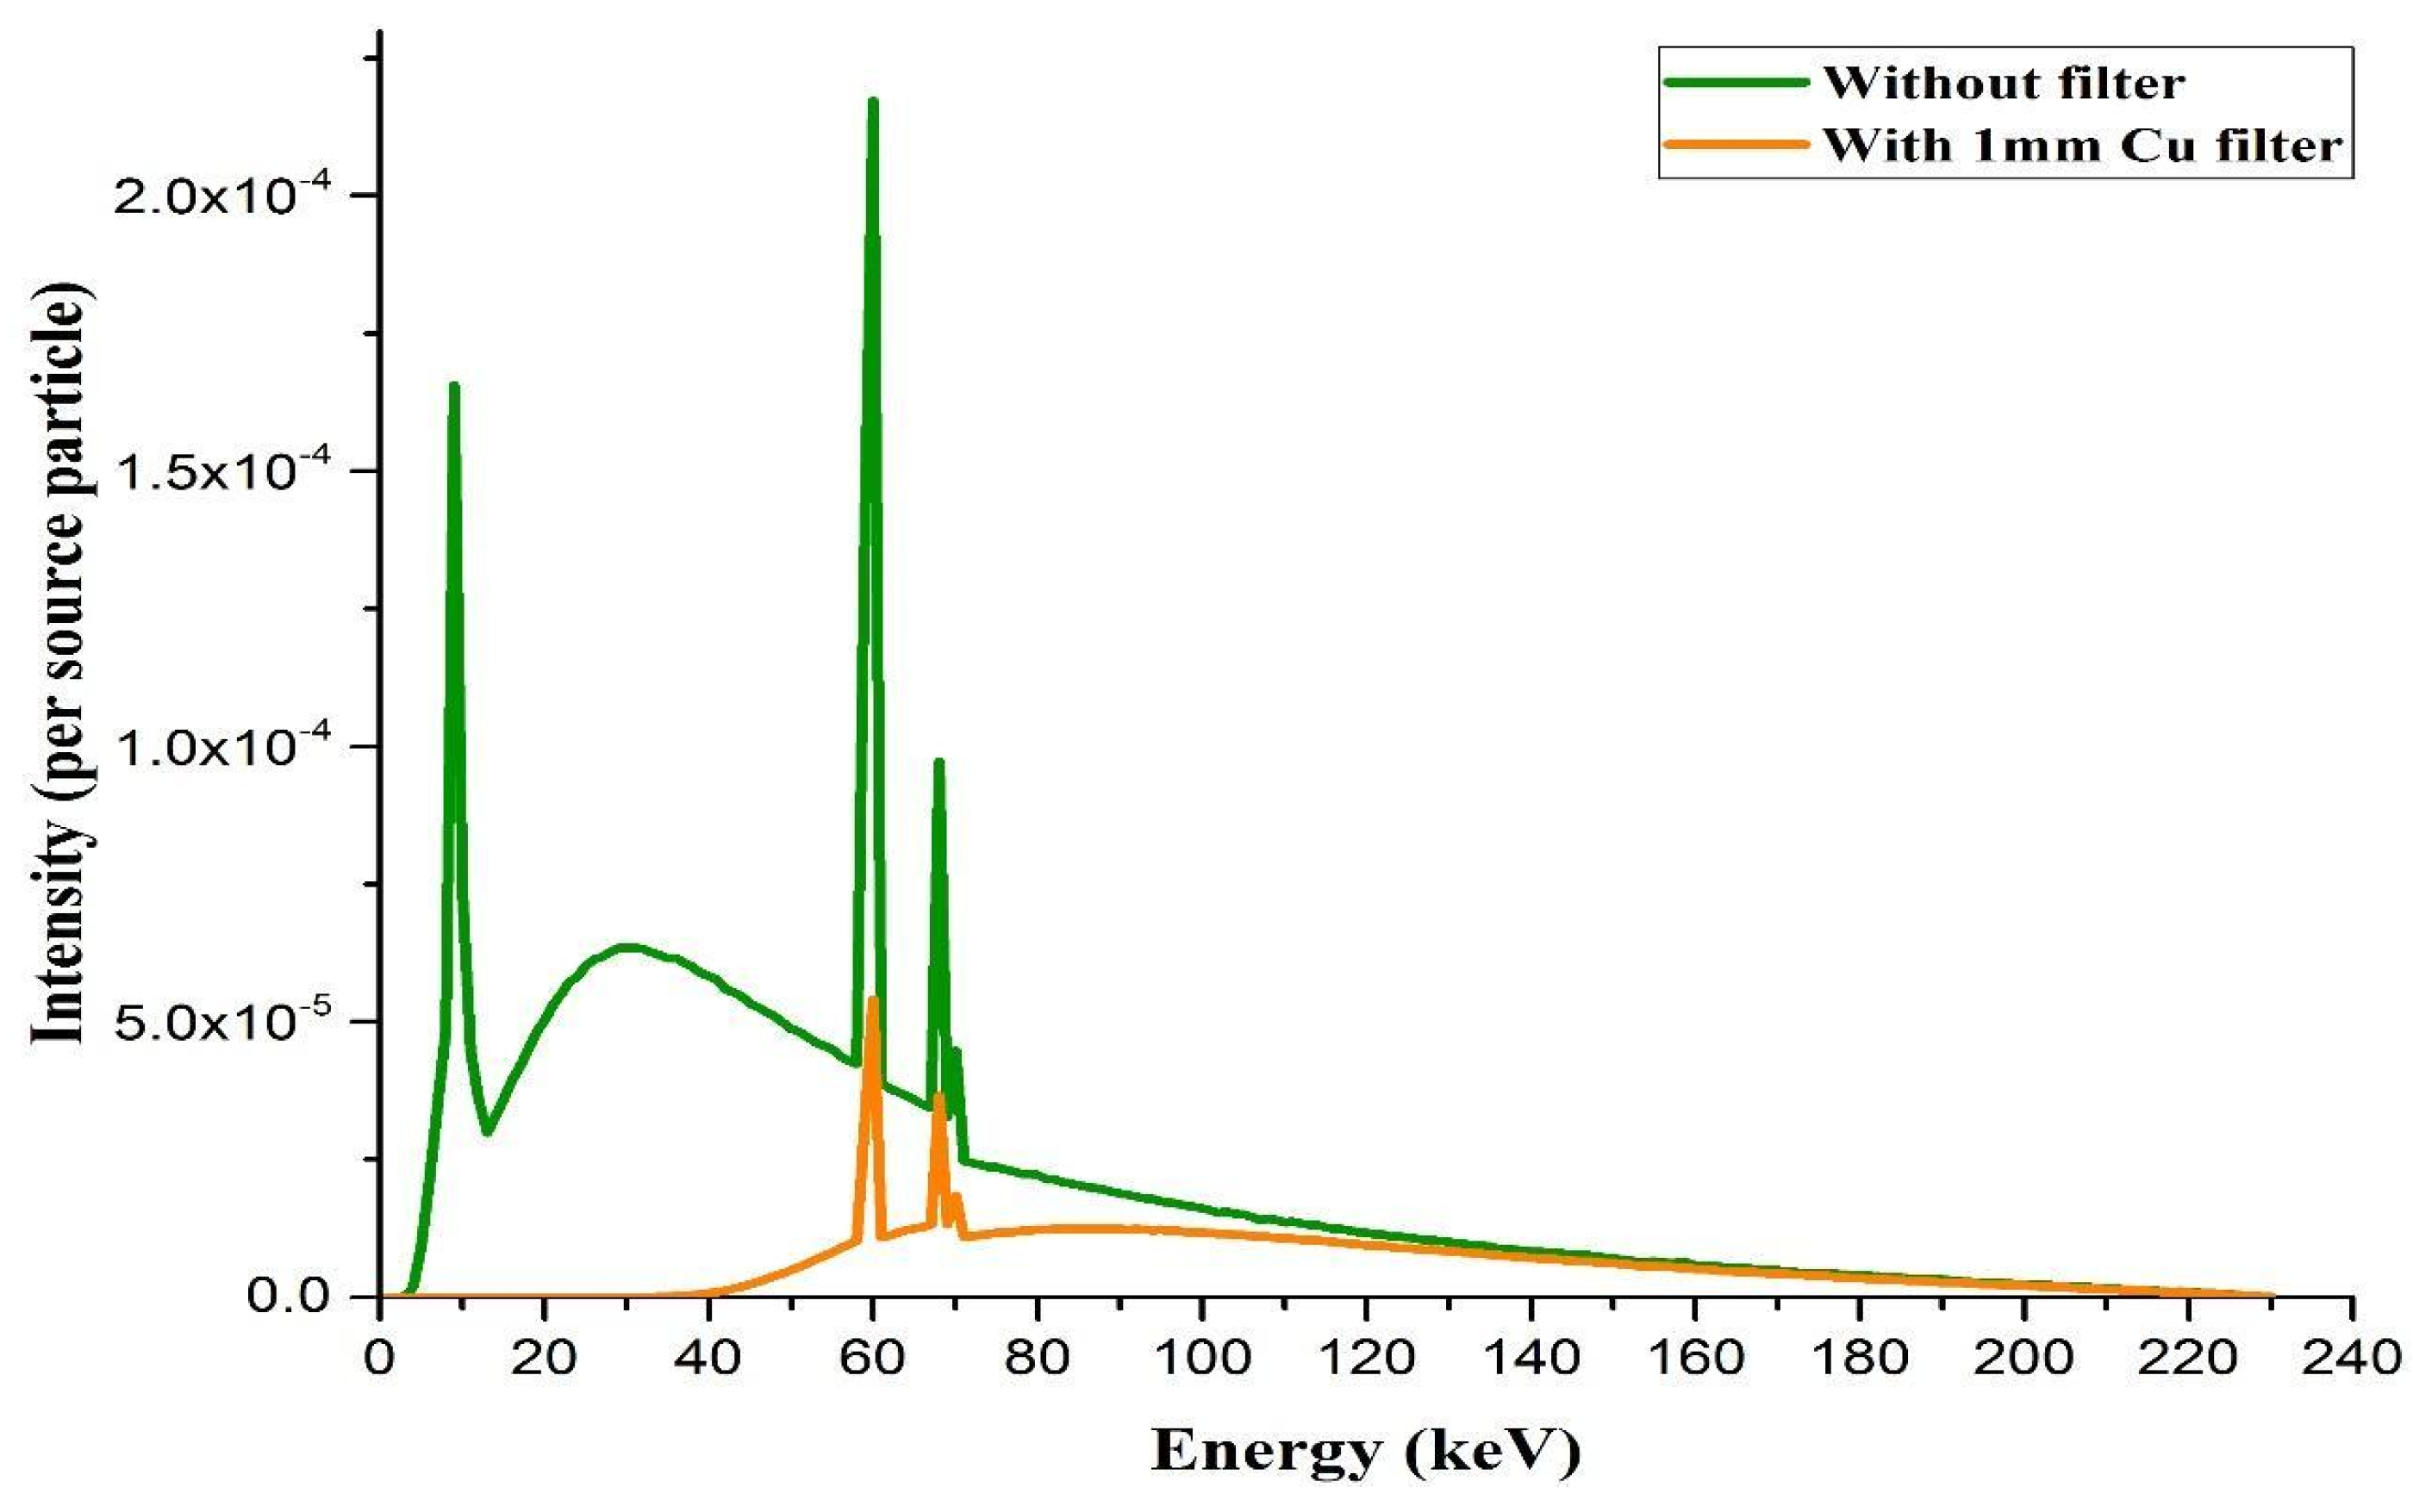
As described in Section 2.1.2, after validating the simulation geometry of the FleXCT system, the required X-ray energy spectrum (in front of the X-ray tube and independent of the flat panel detector response) for beam hardening and scattering CT artifact reduction applications was calculated. As an example, the energy spectrum of exiting X-ray radiations from the FleXCT X-ray tube was calculated for tube voltage of 230 kV for two different cases: (1) no additional filter, (2) 1 mm copper filter (the results are shown in Figure 10). The intensity values in Y-axis of Figure 10 are per one particle source (in fact, MCNP code calculates scores per one source particle). A copper filter is typically used to pre-harden the X-ray emission spectrum to prevent cupping effects in CT scans. By comparing both spectra, we see that a 1 mm copper filter completely absorbs photons below 40 keV, whereas the intensity of photons in the energy range of 40–130 keV is heavily reduced. The emission spectra above 130 keV remain almost unchanged for both cases. Although in this research, the X-ray energy spectrum independent of detector response was calculated for the tube voltage of 230 kV only, using the proposed approach, it is also possible to calculate the X-ray spectrum for every desired tube voltage as well as every external filter with different materials and thicknesses.
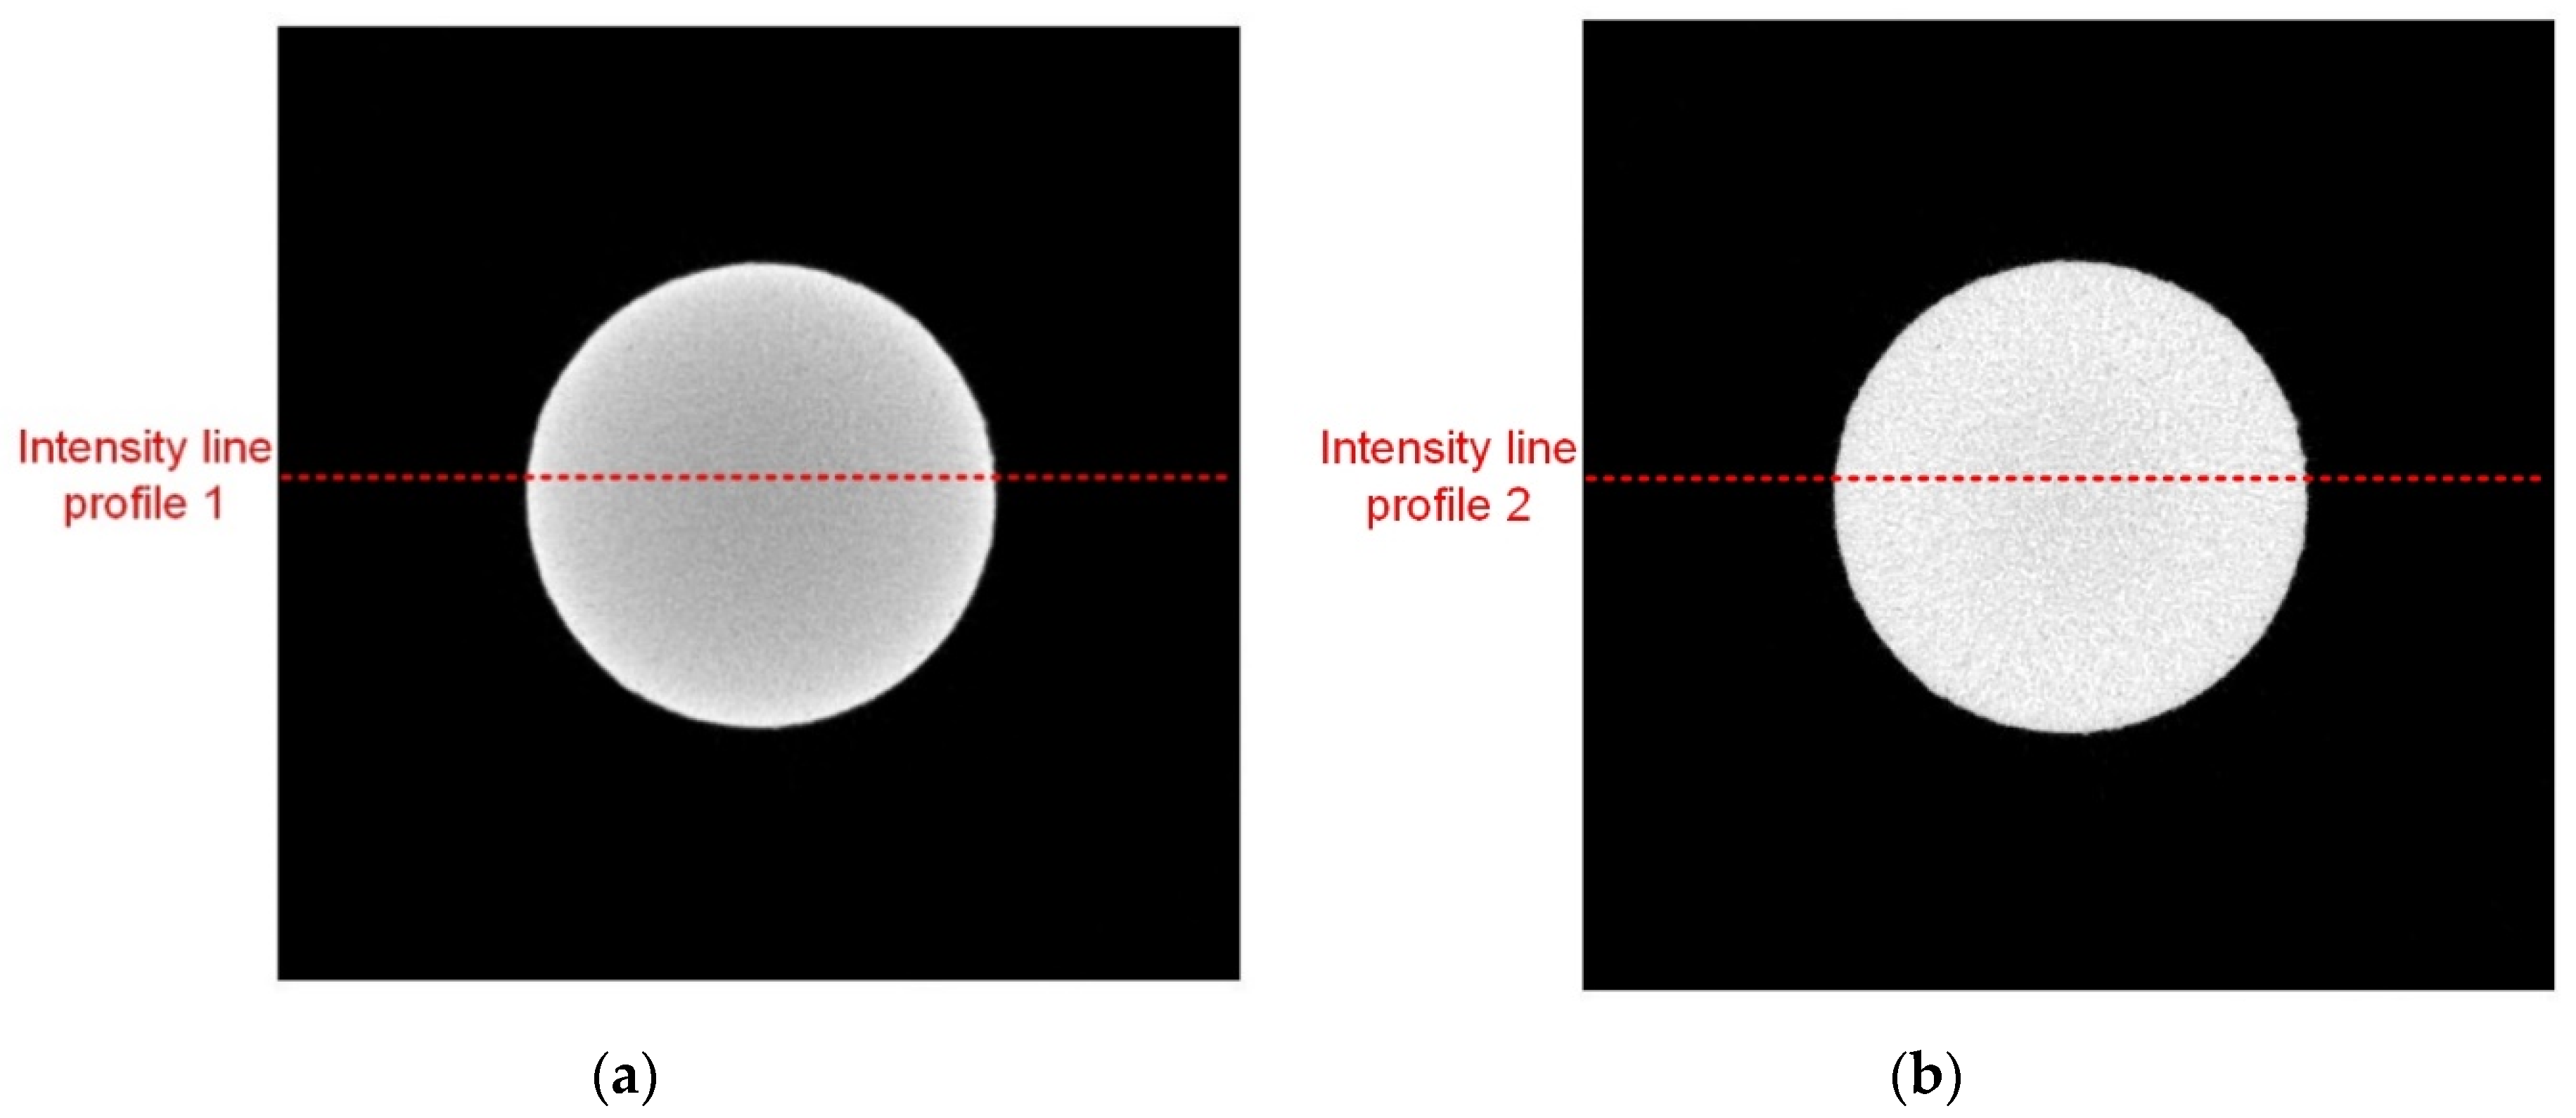
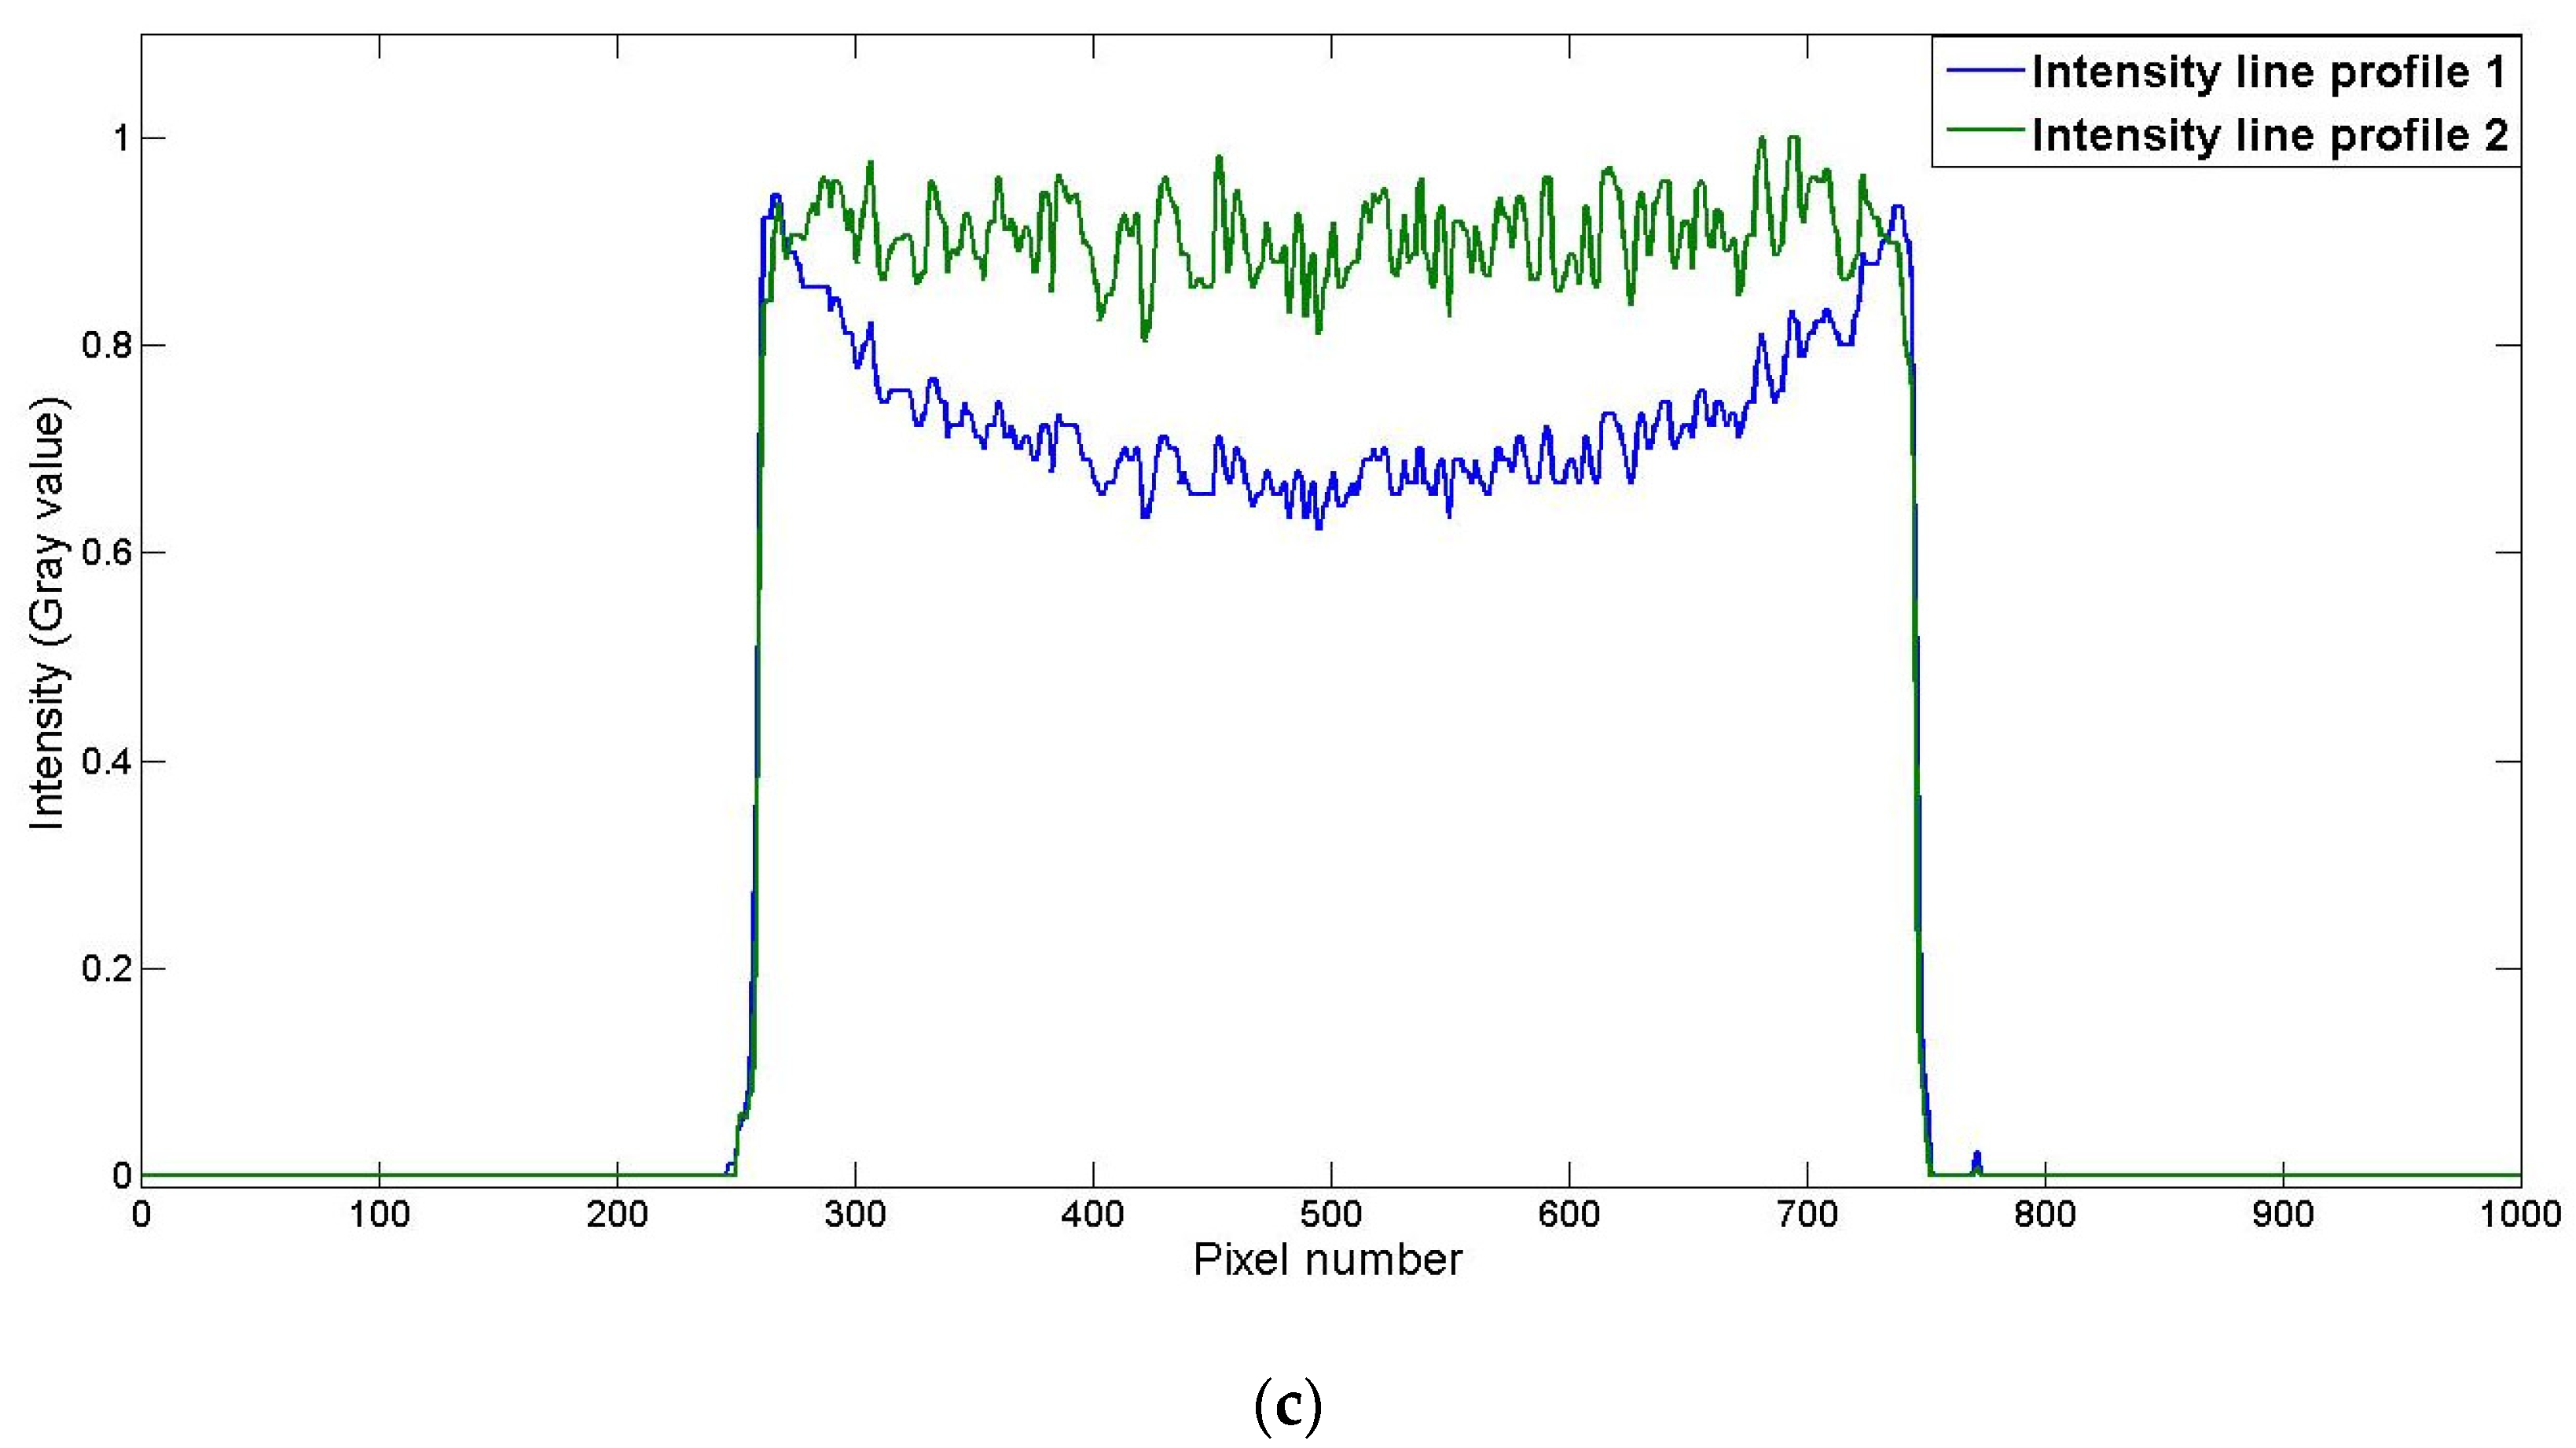
As an example, the calculated X-ray energy spectrum shown in Figure 10 was applied to beam hardening artifact reduction of a printed steel cylinder (2.5 mm radius and 19 mm height), scanned with the FleXCT scanner using a tube voltage of 230 kV and a 1 mm thick copper filter. A slice of the steel cylinder, reconstructed by the traditional Simultaneous Iterative Reconstruction Technique (SIRT) and Polychromatic SIRT (PSIRT) [19], is shown in Figure 11. All methods were implemented in MATLAB, making use of the ASTRA toolbox to handle forward and backward projections on the GPU [40]. As can be seen from this figure, by employing PSIRT, beam hardening effects have been almost completely compensated.

4. Conclusions

In this study, a validated Monte Carlo simulation-based approach was proposed to calculate the X-ray energy spectrum of a flexible X-ray scanner for CT artifact reduction applications. Firstly, both the X-ray tube and flat panel detector of the FleXCT scanner were completely modeled, after which the X-ray spectrum was calculated inside the flat panel detector for different tube voltages. In order to validate the modeled system by Monte Carlo simulation, the MLEM method was implemented to estimate the spectrum of the X-ray source based on empirical transmission data. To provide the required data for the MLEM method, a PVC step wedge was scanned (tube voltage between 60 and 200 kV). In order to mimic a parallel X-ray beam, the step wedge was positioned as close as possible to the detector and the flat panel detector further downstream, optimally exploiting the flexibility of the FleXCT system. Within each step wedge, a region of interest was cropped, after which its mean value was used for the MLEM calculations. The product of the X-ray spectrum for each tube voltage with the normalized absorption response function of a GadOx scintillator (obtained by Monte Carlo simulation) was used as an initial guess for the MLEM calculations. A good correlation between results of the Monte Carlo simulation and the MLEM method (RMSE value of 0.0046) confirmed the correct modeling of the FleXCT system by the Monte Carlo simulation technique. After validating the simulation geometry of the FleXCT system, the required X-ray energy spectrum was calculated in front of the X-ray tube, which is a prerequisite for beam hardening and scattering CT artifact reduction applications. As a proof of principle, the FleXCT X-ray energy spectrum was calculated for a tube voltage of 230 kV and then applied to beam hardening artifact reduction of a printed steel cylinder.
The proposed method can be applied to every medical and industrial X-ray imaging system as a trustable method for calculating the X-ray energy spectrum.

Author Contributions

Conceptualization, E.N., N.S., J.S. and J.D.B.; methodology, E.N. and N.S.; investigation, E.N., N.S., D.I., B.D.S., J.S. and J.D.B.; writing—original draft preparation, E.N., N.S. and D.I.; writing—review and editing, E.N., N.S., D.I., B.D.S., J.S. and J.D.B.; supervision, J.S. and J.D.B.; funding acquisition, J.S. and J.D.B. All authors have read and agreed to the published version of the manuscript.

Funding

Funding for the FleXCT scanner was provided by grant no. I002718N from the research foundation Flanders (FWO Vlaanderen). This work is financially supported by the VLAIO ICON project VIL (HBC.2019.2808), the FWO SBO projects S003421N and S004217N and FWO fellowship 11D8319N.

Institutional Review Board Statement

Not applicable.

Informed Consent Statement

Not applicable.

Data Availability Statement

Data is contained within the article.

Acknowledgments

We acknowledge Smart*Light funded by the Interreg V Flanders-Netherlands program with financial support from the European Regional Development Fund (ERDF).

Conflicts of Interest

The authors declare no conflict of interest.

References

  1. Li, Y.; Garrett, J.; Chen, G.-H. Reduction of beam hardening artifacts in cone-beam CT imaging via SMART-RECON algorithm. In Medical Imaging 2016: Physics of Medical Imaging; International Society for Optics and Photonics: Bellingham, WA, USA, 2016; Volume 9783. [Google Scholar]
  2. Hao, W.; Vernekohl, D.; Zhu, J.; Wang, L.; Xing, L. A model-based scatter artifacts correction for cone beam CT. Med. Phys. 2016, 43, 1736–1753. [Google Scholar]
  3. Sisniega, A.; Abella, M.; Lage, E.; Desco, M.; Vaquero, J. Automatic Monte-Carlo based scatter correction for X-ray cone-beam CT using general purpose graphic processing units (gp-gpu): A feasibility study. In Proceedings of the 2011 IEEE Nuclear Science Symposium Conference Record, Valencia, Spain, 23–29 October 2011. [Google Scholar]
  4. Davidson, D.W.; Fröjdh, C.; O’Shea, V.; Nilsson, H.E.; Rahman, M. Limitations to flat-field correction methods when using an X-ray spectrum. Nucl. Instrum. Methods Phys. Res. Sect. A Accel. Spectrometers Detect. Assoc. Equip. 2003, 509, 146–150. [Google Scholar] [CrossRef]
  5. Primak, A.N.; Ramirez Giraldo, J.C.; Liu, X.; Yu, L.; McCollough, C.H. Improved dual-energy material discrimination for dual-source CT by means of additional spectral filtration. Med. Phys. 2009, 36, 1359–1369. [Google Scholar] [CrossRef] [Green Version]
  6. Six, N.; De Beenhouwer, J.; Sijbers, J. poly-DART: A discrete algebraic reconstruction technique for polychromatic X-ray CT. Opt. Express 2019, 27, 33670–33682. [Google Scholar] [CrossRef] [PubMed]
  7. Bismark, R.N.; Frysch, R.; Abdurahman, S.; Beuing, O.; Blessing, M.; Rose, G. Reduction of beam hardening artifacts on real C-arm CT data using polychromatic statistical image reconstruction. Z. Med. Phys. 2020, 30, 40–50. [Google Scholar] [CrossRef] [PubMed]
  8. Zhao, W.; Ristic, G.; Rowlands, J.A. X-ray imaging performance of structured cesium iodide scintillators. Med. Phys. 2004, 31, 2594–2605. [Google Scholar] [CrossRef]
  9. Iuso, D.; Frysch, R.; Pfeiffer, T.; Rose, G. Analysis of scatter artifacts in cone-beam CT due to scattered radiation of metallic objects. In Proceedings of the 15th International Meeting on Fully Three-Dimensional Image Reconstruction in Radiology and Nuclear Medicine, Philadelphia, PA, USA, 2–6 June 2019; International Society for Optics and Photonics: Bellingham, WA, USA, 2019; Volume 11072. [Google Scholar]
  10. Caon, M.; Bibbo, G.; Pattison, J.; Bhat, M. The effect on dose to computed tomography phantoms of varying the theoretical X-ray spectrum: A comparison of four diagnostic X-ray spectrum calculating codes. Med. Phys. 1998, 25, 1021–1027. [Google Scholar] [CrossRef] [PubMed]
  11. Coolidge, W.D. Vacuum-Tube. U.S. Patent No. 1,203,495, 31 October 1916. [Google Scholar]
  12. Redus, R.H.; Pantazis, J.A.; Pantazis, T.J.; Huber, A.C.; Cross, B.J. Characterization of CdTe detectors for quantitative X-ray spectroscopy. IEEE Trans. Nucl. Sci. 2009, 56, 2524–2532. [Google Scholar] [CrossRef]
  13. Fritz, S.G.; Shikhaliev, P.M.; Matthews, K.L., II. Improved X-ray spectroscopy with room temperature CZT detectors. Phys. Med. Biol. 2011, 56, 5735. [Google Scholar] [CrossRef]
  14. Taguchi, K.; Iwanczyk, J.S. Vision 20/20: Single photon counting X-ray detectors in medical imaging. Med. Phys. 2013, 40. [Google Scholar] [CrossRef]
  15. Salehi, Z.; Ali, N.Y.; Yusoff, A.L. X-ray spectra and quality parameters from Monte Carlo simulation and analytical filters. Appl. Radiat. Isot. 2012, 70, 2586–2589. [Google Scholar] [CrossRef]
  16. Ay, M.R.; Shahriari, M.; Sarkar, S.; Adib, M.; Zaidi, H. Monte Carlo simulation of X-ray spectra in diagnostic radiology and mammography using MCNP4C. Phys. Med. Biol. 2004, 49, 4897. [Google Scholar] [CrossRef] [PubMed]
  17. Wu, D.; Xu, X.; Zhang, L.; Wang, S. A hybrid Monte Carlo model for the energy response functions of X-ray photon counting detectors. Nucl. Instrum. Methods Phys. Res. Sect. A Accel. Spectrometers Detect. Assoc. Equip. 2016, 830, 397–406. [Google Scholar] [CrossRef] [Green Version]
  18. Hernandez, A.M.; Boone, J.M. Tungsten anode spectral model using interpolating cubic splines: Unfiltered X-ray spectra from 20 kV to 640 kV. Med. Phys. 2014, 41, 042101. [Google Scholar] [CrossRef] [PubMed] [Green Version]
  19. Lin, Y.; Samei, E. An efficient polyenergetic SART (pSART) reconstruction algorithm for quantitative myocardial CT perfusion. Med. Phys. 2014, 41, 021911. [Google Scholar] [CrossRef]
  20. Wiegert, J.; Bertram, M.; Rose, G.; Aach, T. Modelbased scatter correction for cone-beam computed tomography. In Medical Imaging 2005: Physics of Medical Imaging; International Society for Optics and Photonics: Bellingham, WA, USA, 2005; Volume 5745, pp. 271–282. [Google Scholar]
  21. Shiroma, A.; Star-Lack, J.; Holt, K.; Hu, M.; Hoelzer, S.; Yoon, S.; Sosnovsky, E.; Failla, G.; Wang, A.; Kokkonen, P.; et al. Scatter correction for industrial cone-beam computed tomography (cbct) using 3d vsharp, a fast gpu-based linear boltzmann transport equation solver. In Proceedings of the 9th Conference on Industrial Computed Tomography (iCT), Padova, Italy, 13 February 2019. [Google Scholar]
  22. De Samber, B.; Renders, J.; Elberfeld, T.; Maris, Y.; Sanctorum, J.; Six, N.; Liang, Z.; De Beenhouwer, J.; Sijbers, J. FleXCT: A Flexible X-ray CT scanner with 10 degrees of freedom. Opt. Express 2021, 29, 3438–3457. [Google Scholar] [CrossRef]
  23. Roshani, M.; Phan, G.; Roshani, G.H.; Hanus, R.; Corniani, E.; Nazemi, E. Combination of X-ray tube and GMDH neural network as a nondestructive and potential technique for measuring characteristics of gas-oil–water three phase flows. Measurement 2021, 168, 108427–108438. [Google Scholar] [CrossRef]
  24. De Oliveira, P.M.C.; Squair, P.L.; Lacerda, M.A.; Da Silva, T.A. Assessment of organ absorbed doses in patients undergoing chest X-ray examinations by Monte Carlo based softwares and phantom dosimetry. Radiat. Meas. 2011, 46, 2073–2076. [Google Scholar] [CrossRef]
  25. Roshani, M.; Phan, G.; Faraj, R.H.; Phan, N.-H.; Roshani, G.H.; Nazemi, B.; Corniani, E.; Nazemi, E. Proposing a gamma radiation based intelligent system for simultaneous analyzing and detecting type and amount of petroleum by-products. Nucl. Eng. Technol. 2020. [Google Scholar] [CrossRef]
  26. Souza, E.M.; Correa, S.C.A.; Silva, A.X.; Lopes, R.T.; Oliveira, D.F. Methodology for digital radiography simulation using the Monte Carlo code MCNPX for industrial applications. Appl. Radiat. Isot. 2008, 66, 587–592. [Google Scholar] [CrossRef]
  27. Correa, S.C.A.; Souza, E.M.; Silva, A.X.; Cassiano, D.H.; Lopes, R.T. Computed radiography simulation using the Monte Carlo code MCNPX. Appl. Radiat. Isot. 2010, 68, 1662–1670. [Google Scholar] [CrossRef]
  28. Kulkarni, M.; Dendere, R.; Nicolls, F.; Steiner, S.; Douglas, T.S. Monte-Carlo simulation of a slot-scanning X-ray imaging system. Phys. Med. 2016, 32, 284–289. [Google Scholar] [CrossRef] [PubMed]
  29. Roshani, M.; Phan, G.T.T.; Ali, P.J.M.; Roshani, G.H.; Hanus, R.; Duong, T.; Corniani, E.; Nazemi, E.; Kalmoun, E.M. Evaluation of flow pattern recognition and void fraction measurement in two phase flow independent of oil pipeline’s scale layer thickness. Alex. Eng. J. 2021, 60, 1955–1966. [Google Scholar] [CrossRef]
  30. Shahmohammadi Beni, M.; Krstic, D.; Nikezic, D.; Yu, K.N. Modeling kV X-ray-induced coloration in radiochromic films. Appl. Sci. 2018, 8, 106. [Google Scholar] [CrossRef] [Green Version]
  31. Pelowitz, D.B. MCNP-X TM User’s Manual; Version 2.5.0; LA-CP-05e0369; Los Alamos National Laboratory: Los Alamos, NM, USA, 2005.
  32. Duan, X.; Wang, J.; Yu, L.; Leng, S.; McCollough, C.H. CT scanner X-ray spectrum estimation from transmission measurements. Med. Phys. 2011, 38, 993–997. [Google Scholar] [CrossRef] [PubMed] [Green Version]
  33. Sidky, E.Y.; Yu, L.; Pan, X.; Zou, Y.; Vannier, M. A robust method of X-ray source spectrum estimation from transmission measurements: Demonstrated on computer simulated, scatter-free transmission data. J. Appl. Phys. 2005, 97, 124701. [Google Scholar] [CrossRef]
  34. Endrizzi, M.; Delogu, P.; Oliva, P. Application of an expectation maximization method to the reconstruction of X-ray-tube spectra from transmission data. Spectrochim. Acta Part B At. Spectrosc. 2014, 102, 42–47. [Google Scholar] [CrossRef] [Green Version]
  35. Li, R.; Li, L.; Chen, Z. Spectrum reconstruction method based on the detector response model calibrated by X-ray fluorescence. Phys. Med. Biol. 2017, 62, 1032. [Google Scholar] [CrossRef]
  36. Tao, Y.; Li, Z.; Li, P. A Design and Fabrication Method for Wood-Inspired Composites by Micro X-Ray Computed Tomography and 3D Printing. Appl. Sci. 2020, 10, 1400. [Google Scholar] [CrossRef] [Green Version]
  37. Shi, H.; Hosdez, J.; Rougelot, T.; Xie, S.; Shao, J.; Talandier, J.; Lacidogna, G. Digital Volume Correlation Applied to X-ray Micro-Tomography Images in Uniaxial Creep Tests on Anisotropic Clayey Rock. Appl. Sci. 2020, 10, 4898. [Google Scholar] [CrossRef]
  38. Wang, L.G.; Li, Z.; Zhang, L.; Zhou, R.; Chen, X. On the Measurement of Particle Contact Curvature and Young’s Modulus Using X-ray μCT. Appl. Sci. Sci. 2021, 11, 1752. [Google Scholar] [CrossRef]
  39. Cranley, K.; Gilmore, B.J.; Fogarty, G.W.A.; Desponds, L. IPEM Report 78: Catalogue of Diagnostic X-ray Spectra and Other Data; CD-Rom Edition 1997; Electronic Version prepared by D Sutton; The Institute of Physics and Engineering in Medicine (IPEM): New York, NY, USA, 1997. [Google Scholar]
  40. Van Aarle, W.; Palenstijn, W.J.; Cant, J.; Janssens, E.; Bleichrodt, F.; Dabravolski, A.; De Beenhouwer, J.; Batenburg, K.J.; Sijbers, J. Fast and flexible X-ray tomography using the ASTRA toolbox. Opt. Express 2016, 24, 25129–25147. [Google Scholar] [CrossRef] [PubMed]
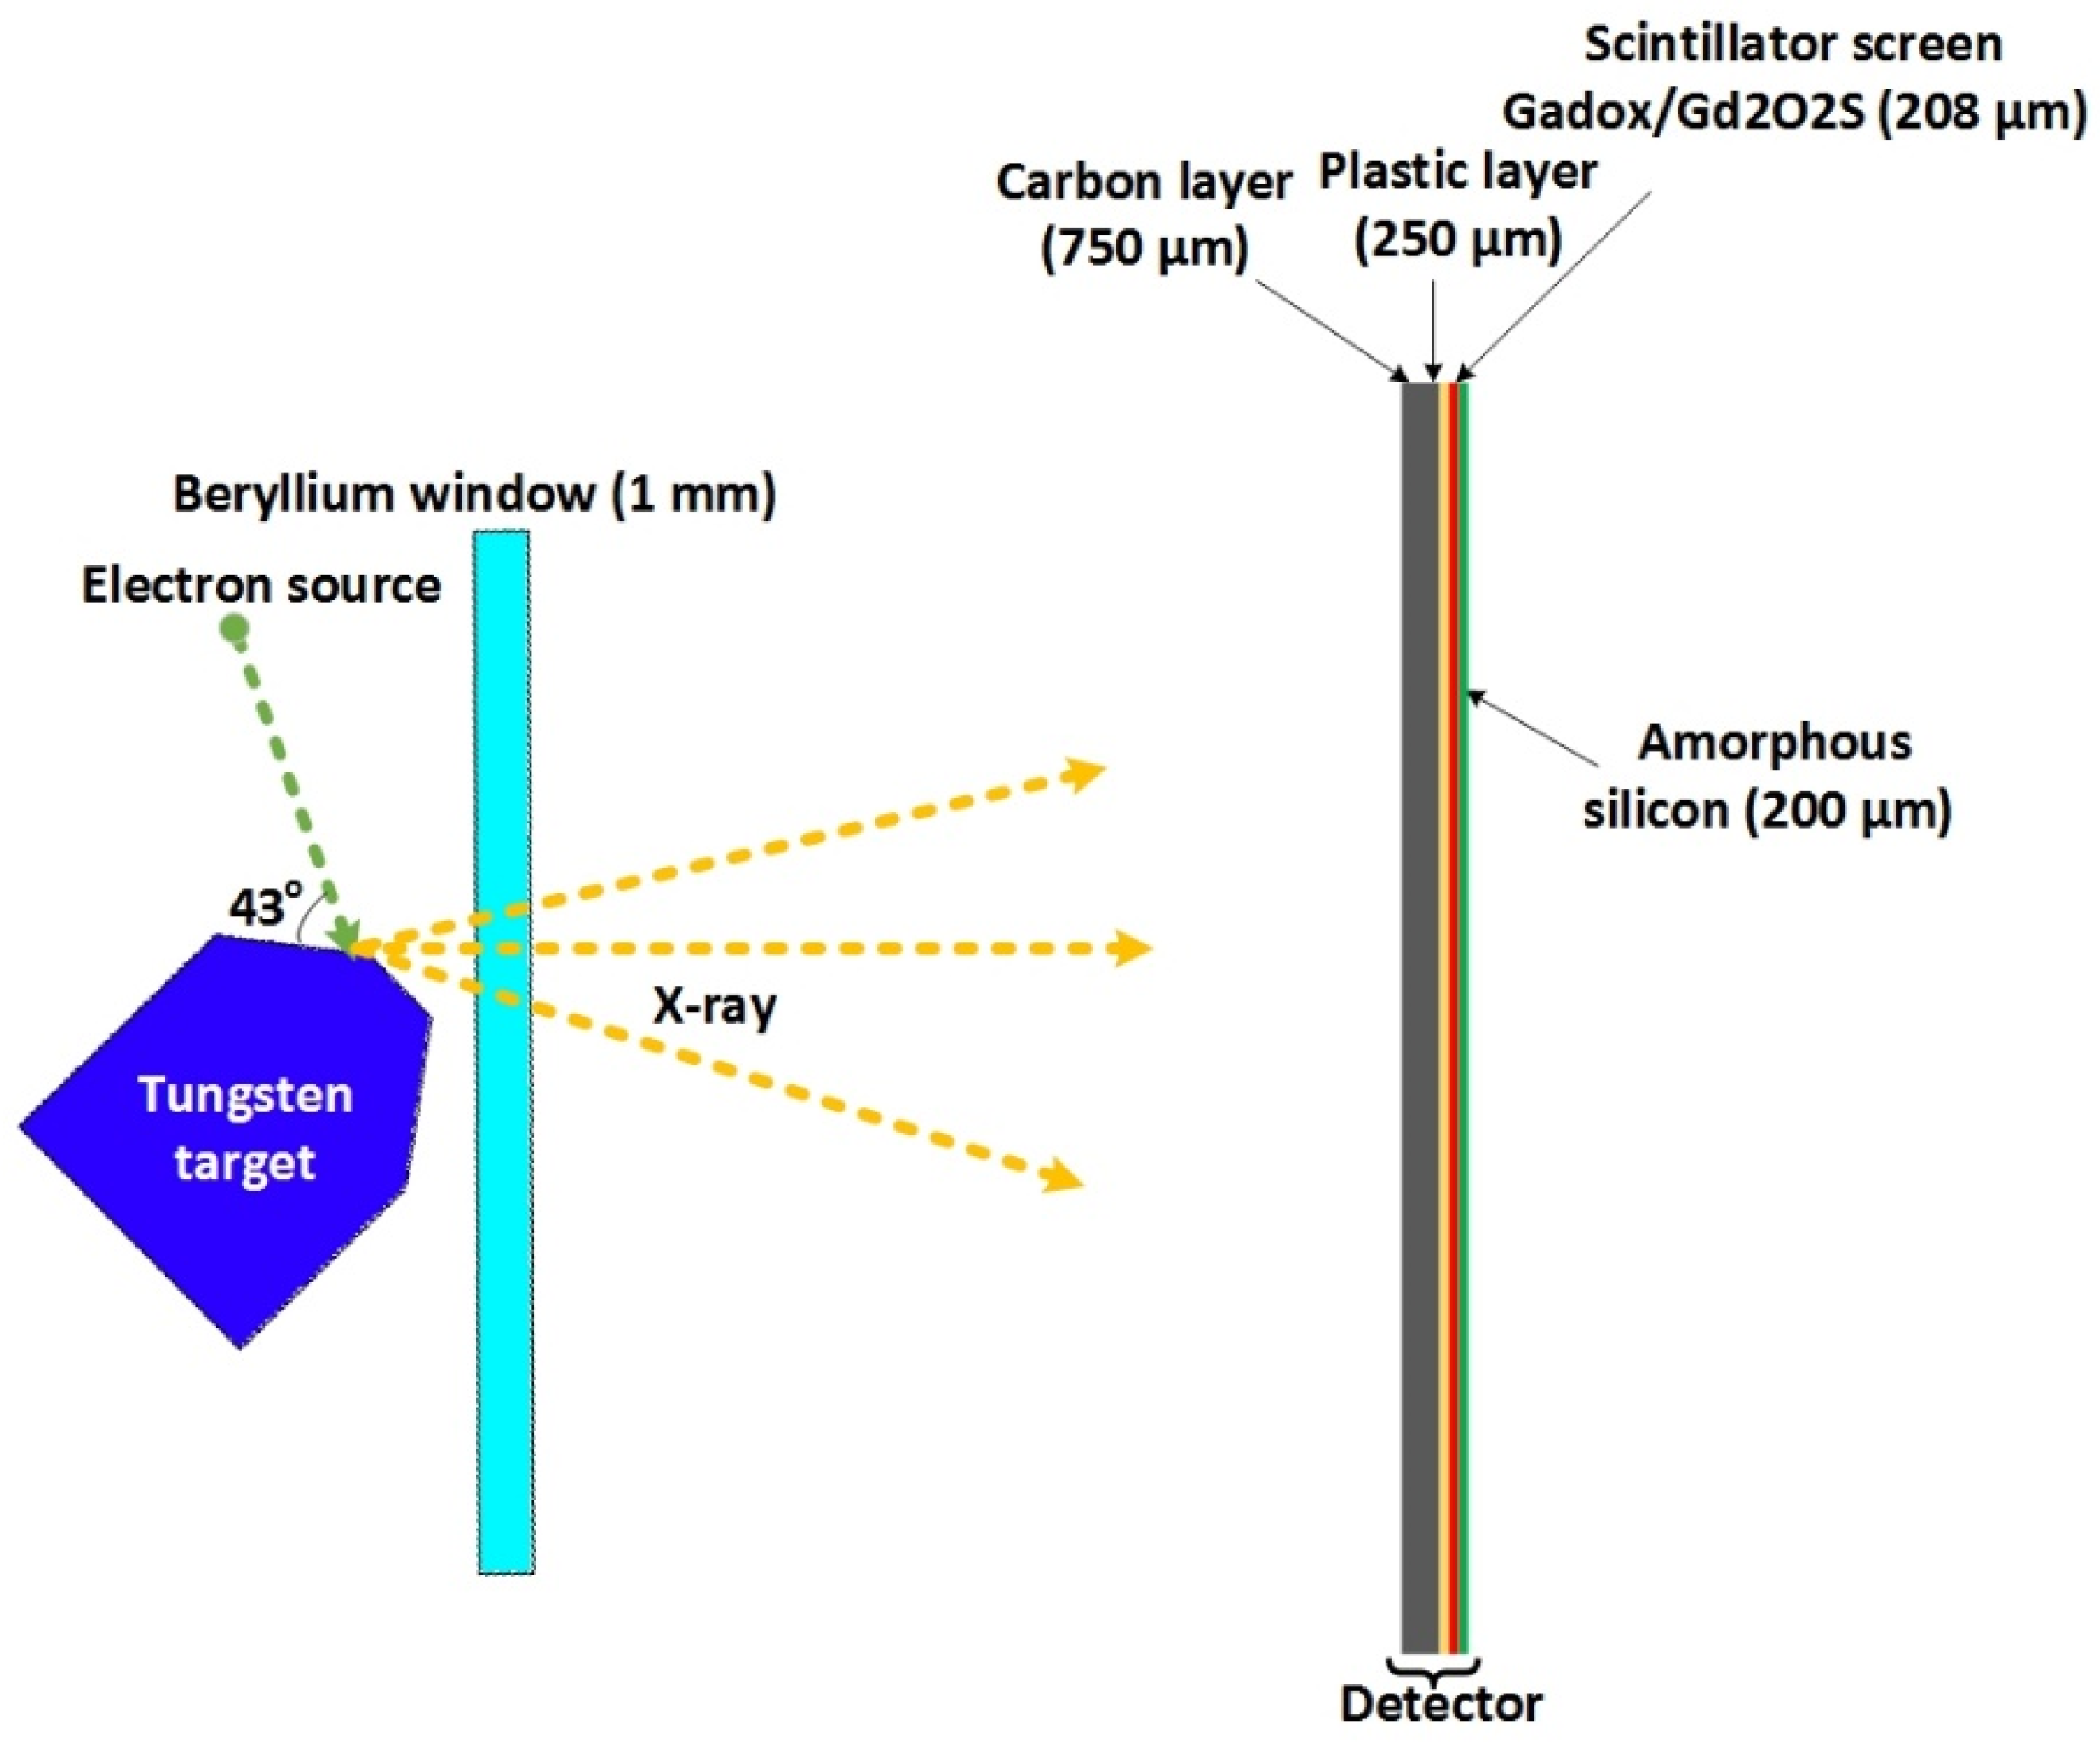
Figure 1. Schematic view of the simulation model of the FleXCT scanner, showing the geometry of the reflection type X-ray tube and different material layers present in the flat panel X-ray detector.
Applsci 11 03145 g001
Figure 2. Schematic view of the simulated FleXCT scanner’s X-ray tube for calculating X-ray spectrum independent of the detector response for 2 different cases: (a) without additional filter, (b) with a 1 mm copper filter.
Applsci 11 03145 g002
Figure 3. Schematic view of the polyvinyl chloride (PVC) step wedge.
Applsci 11 03145 g003
Figure 4. Experimental setup for acquiring 2D radiographs of a PVC step wedge at different tube voltages.
Applsci 11 03145 g004
Figure 5. Normalized projections of the PVC step wedge when the center of the beam was set in the center of step number 11: (a) 60 kV, (b) 100 kV, (c) 180 kV.
Applsci 11 03145 g005
Figure 6. X-ray energy spectrum of a tungsten X-ray tube at 100 kV reported by the Institute of Physics and Engineering in Medicine (IPEM) (report no. 78).
Applsci 11 03145 g006
Figure 7. Normalized energy absorption response function of GadOx (1–230 keV).
Applsci 11 03145 g007
Figure 8. Comparison of obtained X-ray energy spectra from both Monte Carlo and Maximum Likelihood Expectation Maximization (MLEM) methods for tube voltages in the range of (a) 60 kV, (b) 80 kV, (c) 100 kV, (d) 120 kV, (e) 140 kV, (f) 160 kV, (g) 180 kV and (h) 200 kV.
Applsci 11 03145 g008aApplsci 11 03145 g008b
Figure 9. The results of root mean square error (RMSE) between the spectra obtained from Monte Carlo simulation and the MLEM method versus tube voltage of the X-ray tube.
Applsci 11 03145 g009
Figure 10. The energy X-ray tube spectra of the FleXCT system calculated via Monte Carlo via simulation for a tube voltage of 230 kV. (1) Beryllium window only, no additional filter, (2) Beryllium window and 1 mm copper filter.
Applsci 11 03145 g010
Figure 11. (a) A slice of the steel cylinder reconstructed by the Simultaneous Iterative Reconstruction Technique (SIRT). (b) A slice of the steel cylinder reconstructed by Polychromatic SIRT (PSIRT). (c) Gray value intensity line profile along the central horizontal line of the reconstructed slices using SIRT and PSIRT.
Applsci 11 03145 g011aApplsci 11 03145 g011b
Publisher’s Note: MDPI stays neutral with regard to jurisdictional claims in published maps and institutional affiliations.