Abstract
Dust exposure is a serious threat to human health due to dermal contact, inhalation, and ingestion. Children are more vulnerable to dust than adults as a result of high rates of unintentional, or deliberate, ingestion and inhalation of dust. In this study, dust reduction in the playground due to coating of the soil particles with a PVA/PVAc-based solution was investigated. Soil particles were coated with varying amounts of coating solution and the samples were examined for various parameters e.g., specific density, moisture content, liquid and plastic limits, permeability, dust generation due to wind effect and human activity. The results demonstrated that coated soil samples showed improved permeability characteristics and reduced dust generation. These characteristics were improved by increased content of coating solution.
1. Introduction
The global population is increasing at a rapid rate and people are relocating to urban areas causing an increase in population density. According to a report, it has been predicted that 66% of the population will live in urban areas by 2050 [1]. Human activities may contribute to environmental changes leading to several irreversible environmental impacts [2]. Therefore, urbanization and its consequences are perceived as scientific problems which need to be addressed [3]. Among various problems affiliated with urbanization, air pollution is the most concerning.
Dust refers to a combination of natural and anthropogenic particles obtained from multiple sources. It is considered a critical pollutant for humans due to its inhalation, dermal contact, and ingestion [4]. Although finer particles (less than hundreds of microns) make up a major portion of the dust, particles of size range less than 10 μm are commonly referred to as hazardous atmospheric particulate matter (PM10). Several studies have been conducted to investigate the impact of PM10 on human health [5,6,7]. Farina et al. [8] found that inhaled PM10 may penetrate the respiratory tract and precipitate on the alveolar and tracheobronchial regions. Apart from this, the researchers [9,10,11] have described PM10 dust as the main cause of respiratory problems such as pneumonia, chronic pneumonia lung disease (COPD), and asthma.
Children are more vulnerable to the effects of dust than adults due to unintentional, or deliberate, ingestion and/or inhalation [12,13,14,15]. USEPA-2011 [16] reported that children aged between 1 to 6 years intake dust within a range of 39 to 271 mg day−1. The ingestion and/or inhalation of dust can cause serious health problems among children. For instance, Sunyer et al. [17] mentioned that the inhalation of dust can affect neurodevelopment and cause increased perilous respiratory diseases among children. In a similar way, Amato et al. [18] found that soil resuspension in sandy playgrounds in a school environment can increase the content of PM10. Playgrounds are normally unpaved and children are exposed to dust during play activities [19]. It is for this reason that dust reduction in playgrounds is mandatory. However, previous researchers [20,21,22,23,24] have focused on assessing the health risks affiliated with heavy metal ingestion. For example, Wong and Mak [25] found that playground soil and dust contained a considerable amount of heavy metals (Cd, Cu, Pb, and Zn) which may pose a serious threat to human health. For instance, De Miguel et al. [26] examined soil samples of 20 municipal playgrounds in Spain and found that As concentration demonstrated the highest health risk.
It is certain that dust in playgrounds is a serious threat to children’s health. Therefore, measures should be taken to reduce the generation of dust in playgrounds. However, to the best of the authors’ knowledge, few studies were found which focused on reduction of dust via direct particle coating. In this study, an attempt has been made to develop low dust producing playground soil by coating the particles with polymer.
2. Experimental Section
2.1. Materials and Sample Preparation
Sandy loam soil and pumice sand were investigated in this study. Sandy loam is the most used playground soil in the Republic of Korea due to its low cost. However, sandy loam particles possess low permeability and cause dust due to human activity. Pumice sand is obtained from volcanic vitreous effusion rock and has light weight, porous, high water absorption, and anti-corrosive properties [27,28,29]. Sandy loam soil samples were obtained from a local company in Seoul, Republic of Korea and pumice sand was obtained from Asan, Republic of Korea. Figure 1 displays the particle size distribution of soil samples. Table 1 summarizes the chemical composition of the pumice sand and the sandy loam soil. Poly vinyl alcohol coating solution was used as coating material in this study. Polyvinyl Acetate (PVAc)-based gel polymer was added to the coating solution to improve the bonding efficiency of the coating solution [30]. Table 2 represents the physical and chemical properties of the PVA film.
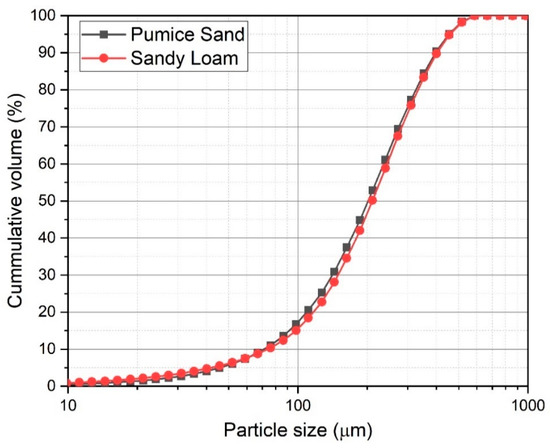
Figure 1.
Particle size distribution of soil samples.

Table 1.
Chemical composition of the raw materials by the XRF method.
Table 2.
Physical and chemical properties of PVA film.
2.2. Soil Coating Procedure
PVA film and PVAc gel polymer were used as the coating materials in this study. First, pumice sand and sandy loam soil particles were mixed thoroughly at a ratio of 3:7 to obtain a representative playground soil. A coating solution was prepared using a combination of PVA solution and PVAc gel polymer. PVA film and PVAc-based gel polymer were added in water at a ratio of 1:100. For instance, 1 g of PVA film and 1 g of PVAc gel polymer were added in 100 g of water to obtain the coating solution. PVAc gel polymer was added to prevent the washout of PVA film from the surface of soil particles during precipitation. Later, coating solution was poured in the mixer containing soil particles and mixing was carried out for five minutes. The particles were coated with 7%, 10%, and 12% of coating solution by weight of particles. Consequently, the coated soil samples were placed in a laboratory-scale oven for 3 h at 80 °C.
2.3. Experimental Methods
The soil samples were examined for specific gravity, moisture content, permeability test, liquid limit, and plastic limit following ASTM D792 [31], ASTM D2216-19 [32], ASTM D2434-19 [33], and ASTM D4318 [34], respectively. The in situ density test was conducted in accordance with the sand-cone method (ASTM D1556 [35]) to evaluate the compact ability of the surface layer. The in-situ density test was conducted at K elementary school in Seoul. Figure 2 shows the site construction (area about 2800 m2) using coated soil samples.
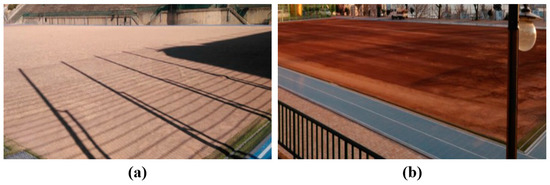
Figure 2.
Site construction on K elementary playground using soil samples coated with 12% coating solution: (a) before coated soil was laid on the playground, (b) after coated soil was laid on the playground.
Figure 3 depicts the schematic presentation of the permeability test conducted on soil samples. First, a sub-base layer of 150 mm height was laid which contained mixed aggregates of sizes ranging from 5 mm to 25 mm. Secondly, a base layer of 50 mm containing sandy loam particles was laid. Finally, a layer of 100 mm height containing coated soil particles was laid. The simulated drainage performance test of the specimen was conducted by measuring the time and amount of water drained. After arranging the layers, 18 L of water was poured on the top surface layer and the duration of 1 L of water drainage was recorded.
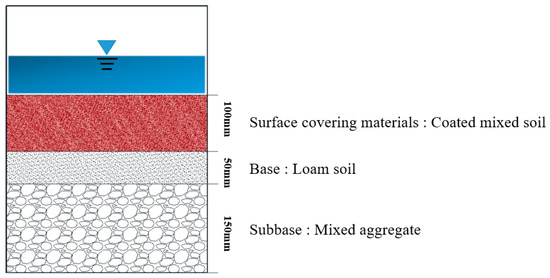
Figure 3.
Simulated Permeability Test.
TSI 8533 Dust Track (Dust Track Drx Aerosol monitor 8533, TSI, Minnessota, USA) was used to measure dust production. Normally, there are two main causes of dust generation in playgrounds: the first by wind flow and the second by human activity. Therefore, the dust generation due to both factors was investigated in this study. Figure 4 displays the experimental setup for measuring the dust generation caused by wind flow. The wind effect measurement setup comprised of a platform made with acrylic sheets of dimensions of 1000 × 600 × 1000 mm3. The experiment was carried out on four different kinds of soil samples coated with 0%, 7%, 10%, and 12% of coating solution. The dust tracker device was placed in the center of the experimental setup. Dust measurement was carried out at intervals of 10 s for a total duration of 1 h. In addition, the dust tracker was calibrated prior to every use by following the standard calibration manual of the instrument. A fan was used to produce the constant wind flow. The fan was placed 500 mm away from the setup.
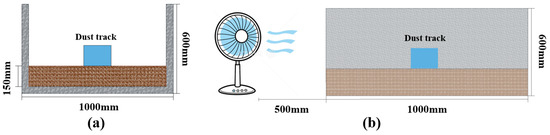
Figure 4.
Dust measurement setup due to wind effect (a) Front view and (b) Side view.
Figure 5 shows the details of the test setup to measure the dust generation due to human activity. The experimental setup consisted of wooden frames and laminated wooden sheets with dimensions of 1500 × 600 × 3000 mm3. A simulated playground composed of three layers was used in this experiment. The details of each layer are shown in Figure 5. The dust monitoring device was placed at the center of the experimental setup as shown in Figure 5a. Dust measurement was carried out at every 10 s for a total duration of two hours. For creating a human activity, a person walked inside the test setup at a constant pace every 15 min as shown in Figure 5b.
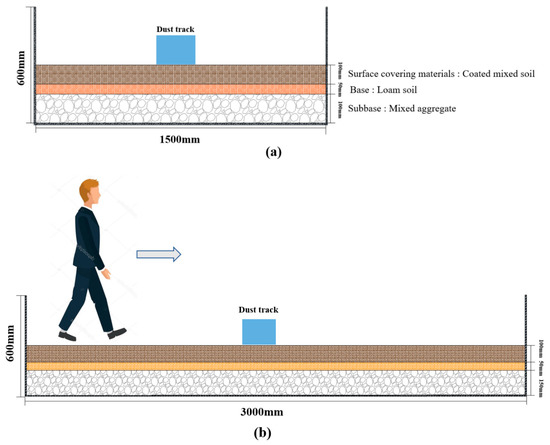
Figure 5.
Dust measurement setup due to human activity (a) Front view and (b) Side view.
3. Results and Discussion
3.1. Soil Physical Properties
Figure 6 displays the results of specific gravity and moisture content of various soil samples. Figure 6a depicts specific gravity of the soil samples. It is obvious from Figure 6a that the minimum specific gravity was presented by uncoated soil samples (2.612) while the maximum specific gravity was obtained for soil samples coated with 12% coating solution (2.685). A slight increment in specific gravity was perceived for coated soil samples in comparison with the uncoated soil samples. Additionally, specific gravity increased with the increase in the amount of coating solution. It may be attributed to the porous nature of pumice sand which absorbed a higher content of coating solution during the coating process [36,37,38]. Figure 6b shows the moisture content of the soil samples. From Figure 6b, it is clear that the moisture content decreased with the increase in coating solution content. For instance, a moisture content of 16.5%, 15.8%, 15.2%, and 14.9% was measured for soil samples coated with 0%, 7%, 10%, and 12% coating solution. The reduction in moisture content is attributed to the reduced permeability due to its being coated.
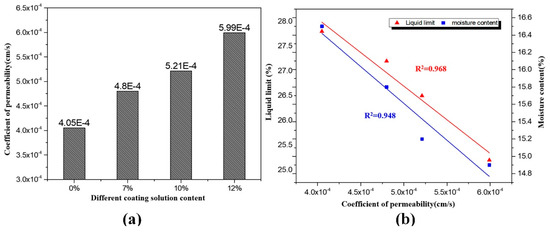
Figure 6.
(a) Specific gravity and (b) moisture content of soil samples.
Soil changes from solid state to semi-solid or plastic or fluid state due to the presence of moisture content. The liquid limit represents the boundary between the liquid state and the plastic state. The plastic limit represents the boundary between the plastic state and semi-solid state. Figure 7 displays the liquid limit and the plastic limit of the soil samples coated with different percentages of the coating solution. The results clearly demonstrate that liquid and plastic limit values tend to decrease when there is an increase in the amount of coating solution. For instance, a liquid limit value of 27.8%, 27.2%, 26.5%, and 25.2% was noted for the soil samples coated with 0%, 7%, 10%, and 12% coating solution, respectively. A plastic limit value of 14.5%, 13.9%, 12.9%, and 11.7% was measured for the samples coated with 0%, 7%, 10%, and 12% coating solution, respectively. This reduction in liquid limit and plastic limit values can be explained by the reduction in moisture content of the soil samples.
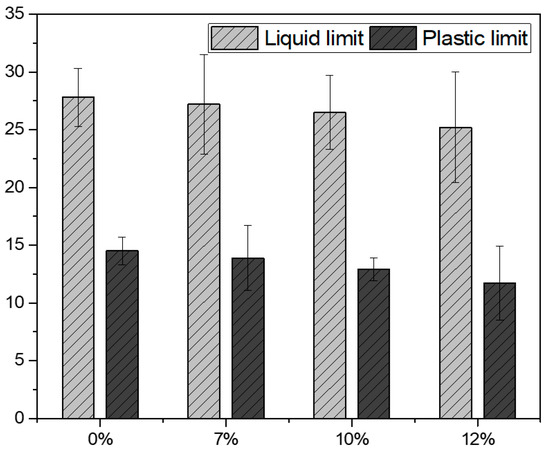
Figure 7.
Liquid limit (%) and plastic limit (%) values of soil samples.
A field density test was conducted to evaluate the degree of compaction achieved during the construction procedure. If the field density results are more than 90% of maximum drying density obtained by indoor compaction test, it indicates proper compaction conditions. A field density measurement was conducted three times and an average value was reported. Table 3 summarizes the field density test results. The moisture content was measured in a range of 10.3% to 10.8%. The reduction in moisture content compared to the indoor measurement after the coating procedure may be due to the evaporation of moisture during site construction. The degree of compaction was calculated as a percentage of the maximum dry density for field dry density, and all three results exceeded the Korean standard of 90%. The experimental results show that the coated soil specimen is suitable to be used as a surface layer material for the playground.
Table 3.
Field density measurement test results.
3.2. Permeability Test Results
Proper drainage of rainfall water is an essential parameter for playground soil. For this purpose, a permeability test was carried out on the soil samples. Figure 8a demonstrates the coefficient of permeability values for different soil samples. It is obvious that the soil sample coated with 0% coating solution showed the lowest permeability coefficient (4.05 × 10⁻⁴ cm/s). Whereas soil samples coated with 12% coating solution depicted the highest permeability coefficient value (5.99 × 10⁻⁴ cm/s). Apart from this, the coefficient of permeability increased with the increase in the amount of coating solution. For instance, soil samples coated with 7%, 10%, and 12% of coating solution depicted an increase of 18.5%, 28.6%, and 47.9% in the coefficient of permeability when compared to the soil samples coated with 0% coating solution. This increment in permeability is due to the coating effect, which reduced the porosity and cohesion among soil particles.
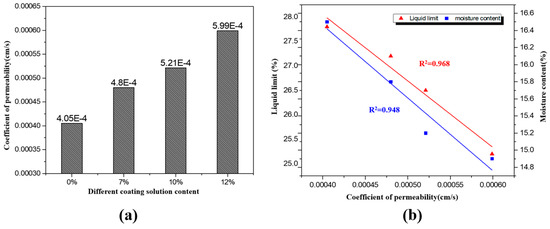
Figure 8.
(a) Coefficient of permeability and (b) relationship between liquid limit, coefficient of permeability, and moisture content of soil samples.
Figure 8b depicts the relationship between the liquid limit, coefficient of permeability, and moisture content. There is linear relationship between the liquid limit and coefficient of permeability as well as between moisture content and coefficient of permeability. The physical behavior of soil is highly affected by water. For example, soil samples with a large absorption capacity requires more water to change from semi-solid to liquid state, and less water permeability. However, coating the particles reduced the absorption and ultimately reduced the water required to change the soil from semi-solid to liquid state and the permeability increased.
The drainage performance of playground soil was evaluated using a simulated playground setup. Figure 9 shows the results of the simulated permeability test carried out on various soil samples. The X-axis of Figure 9 represents the total drainage, and the Y-axis indicates the time taken for drainage of that volume of water. Regardless of the presence of coating, no significant difference in drainage time was observed for up to 6 L of water. However, the drainage time began to vary beyond 7 L. In addition, the 8 L water drainage time of uncoated soil sample required 28 min more than the 12% coating solution contained samples, respectively. In the case of the uncoated sample, water was no longer draining after 8 L of water were discharged. However, an increase in the total drainage time was observed with increasing the amount of coating solution. For instance, the samples coated with 7%, 10%, and 12% showed total drainage of 9 L, 10 L, and 11 L at a similar time, respectively. The increase in water drainage may be attributed to the reduction in soil absorption and increase in permeability due to the effect of surface coating. These results suggest that the coated soil particles will play an important role in preventing the poor drainage when applied to the actual playground condition.
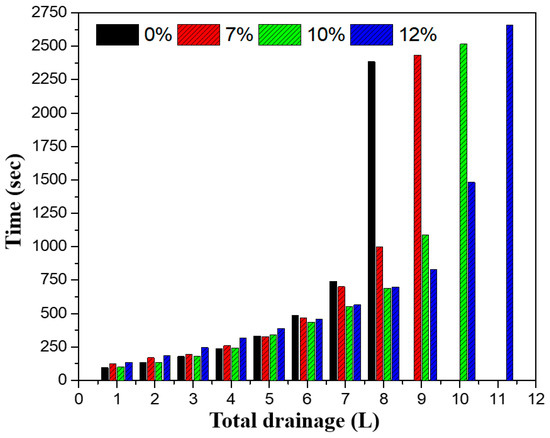
Figure 9.
Total drainage versus time for soil samples.
3.3. Dust (PM10 and PM2.5) Generation
3.3.1. Measurement of Dust (PM10 and PM2.5) Generation Due to Wind Effect
Dust generation due to wind effect has been measured using a simulated playground setup. Figure 10 and Figure 11 display the PM10 and PM2.5 dust generation, respectively. A significant amount of dust was generated due to wind in uncoated soil samples in comparison with the coated soil samples. A maximum value of 338 μg/m3 and 190 μg/m3 for PM10 and PM2.5 dust generation was measured, respectively. No significant difference in the dust generation rate was observed among coated soil samples. However, soil samples coated with 12% coating solution depicted the lowest rate of dust generation among all samples. It suggests the reduction in dust is due to the coating procedure. Visual inspection was carried out to examine the surface of soil samples. Figure 12 displays the microscopic image of uncoated soil and soil coated with 12% coating solution. It can be seen in Figure 12b that fine soil particles are attached on the surface of coarser soil particles due to coating material present on the surface of particles. It may be due to this reason that fine particles which contribute to dust generation are attached on the surface of coarser particles and reduce the dust generation rate.
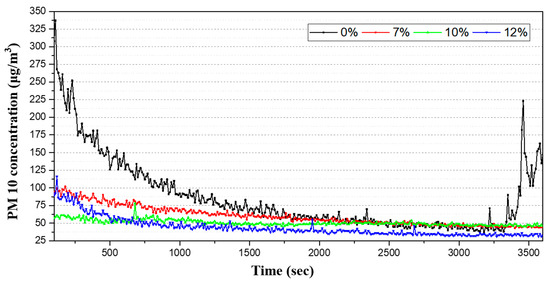
Figure 10.
PM10 dust generation for soil samples.
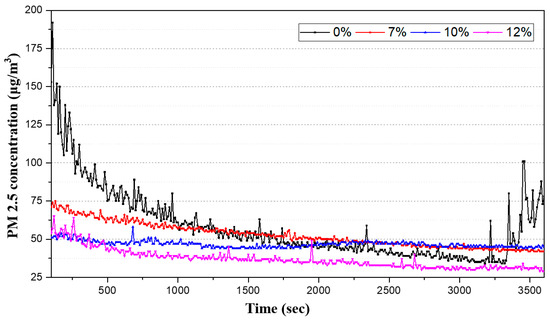
Figure 11.
PM2.5 dust generation for soil samples.
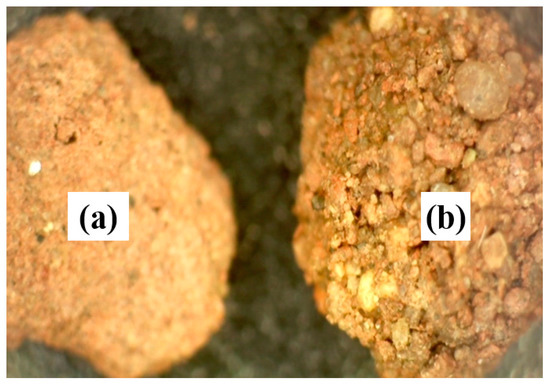
Figure 12.
Visual inspection (×60) of (a) uncoated soil particle and (b) soil sample coated with 12% coating solution.
3.3.2. Measurement of Sand Dust (PM10 and PM2.5) Generation Due to Human Activity
Dust generation in playgrounds due to human activity was measured using a simulated test setup. Figure 13 and Figure 14 demonstrate the PM2.5 and PM10 dust generation due to human activity effect for soil samples coated with 0% and 12% of coating solution. The maximum PM10 and PM2.5 dust generation due to human activity was noted at 4430 μg/m3 and 2180 μg/m3, which is 13.1 and 11.4 times higher compared to those generated due to wind effect, respectively. This may be due to the fact that wind effect only disturbs the surface soil while human activity interrupts the soil to a certain depth. Maximum PM2.5 dust generation was measured in the range of 192–765 μg/m3 and maximum PM10 generation was recorded in the range of 503–1018 μg/m3 for coated soil samples. Apart from this, maximum PM2.5 and PM10 dust generation in uncoated soil sample was found in the range of 887–2180 μg/m3 and 1741–4430 μg/m3, respectively. This reduction in dust generation is due to the reduced number of fine soil particles due to the coating process.
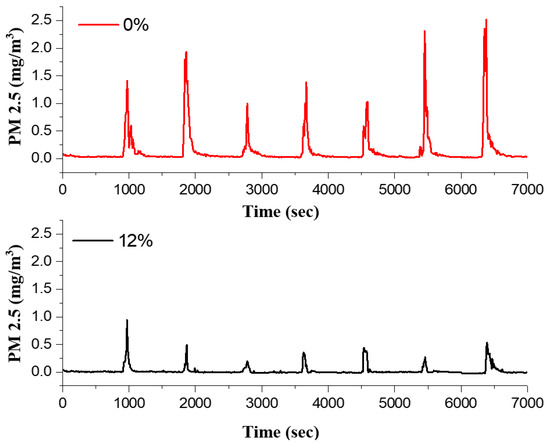
Figure 13.
PM2.5 dust generation due to human activity in soil samples coated with 0% and 12% coating solution.
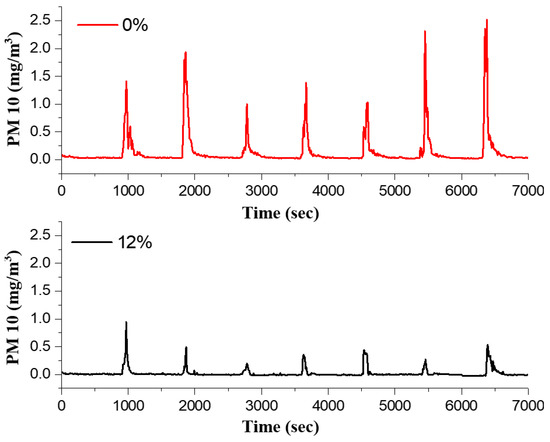
Figure 14.
PM10 dust generation due to human activity in soil samples coated with 0% and 12% coating solution.
4. Conclusions
This study investigated the effect of PVA coating on the physical properties, permeability, and dust generation of playground soil. The following conclusions can be drawn based on the results.
Coating the playground soil particles with PVA/PVAc solution reduced the moisture content and slightly increased the specific density. It caused a reduction in the absorption of soil samples, which ultimately reduced the liquid and plastic limits. The coefficient of permeability increased with the increase in coating solution content. Further, coating the soil particles significantly reduced the PM10 and PM2.5 generation due to the wind effect, as well as human activity.
Based on the findings of this study, it can be concluded that coating the soil particles of playgrounds will significantly reduce dust generation. Reduction in dust generation will ultimately reduce threats to the health of children associated with dust ingestion and inhalation. However, an extended observation is required to be carried out to understand dust reduction in real playgrounds.
5. Further Research
Future research will focus on the application of coated soil in actual playgrounds and measuring dust reduction efficiency by collecting real-time data for one year.
Author Contributions
Conceptualization, I.K.J., A.Q. and H.G.K.; methodology, I.K.J.; validation, A.Q. and H.G.K.; formal analysis, A.Q. and I.K.J.; investigation, I.K.J.; data curation, I.K.J., and H.L.; writing—original draft preparation, A.Q. and I.K.J.; writing—review and editing, A.Q. and I.K.J.; visualization, A.Q. and I.K.J.; supervision, H.G.K.; funding acquisition, H.G.K. and H.L. All authors have read and agreed to the published version of the manuscript.
Funding
This research was funded by R&D Program for Forest Science Technology (2021357B10-2123-AC03) provided by Korea Forest Service (Korea Forestry Promotion Institute).
Institutional Review Board Statement
Not applicable.
Informed Consent Statement
Not applicable.
Conflicts of Interest
The authors declare no conflict of interest.
References
- Population Division, Department of Economic and Social Affairs, United Nations Secretariat. World Urbanization Prospects, the 2011 Revision; UN DESAP: New York, NY, USA, 2012. [Google Scholar]
- Kabata-Pendias, A. Trace Elements in Soils and Plants; CRC Press: Boca Raton, FL, USA, 2010. [Google Scholar]
- Pincetl, S. Cities in the age of the Anthropocene: Climate change agents and the potential for mitigation. Anthropocene 2017, 20, 74–82. [Google Scholar] [CrossRef]
- Paustenbach, D.J. The practice of exposure assessment: A state-of-the-art review. J. Toxicol. Environ. Health Part B 2000, 3, 179–291. [Google Scholar] [CrossRef]
- Yang, H.-C.; Chang, S.-H.; Lu, R.; Liou, D.-M. The effect of particulate matter size on cardiovascular health in Taipei Basin, Taiwan. Comput. Methods Prog. Biomed. 2016, 137, 261–268. [Google Scholar] [CrossRef]
- Samuelsen, M.; Nygaard, U.; Løvik, M. Particle size determines activation of the innate immune system in the lung. Scand. J. Immunol. 2009, 69, 421–428. [Google Scholar] [CrossRef]
- Khaniabadi, Y.O.; Goudarzi, G.; Daryanoosh, S.M.; Borgini, A.; Tittarelli, A.; De Marco, A. Exposure to PM10, NO2, and O3 and impacts on human health. Environ. Sci. Pollut. Res. 2016, 24, 2781–2789. [Google Scholar] [CrossRef]
- Farina, F.; Sancini, G.; Battaglia, C.; Tinaglia, V.; Mantecca, P.; Camatini, M.; Palestini, P. Milano summer particulate matter (PM10) triggers lung inflammation and extra pulmonary adverse events in mice. PLoS ONE 2013, 8, e56636. [Google Scholar] [CrossRef]
- Maciejewska, A. Occupational exposure assessment for crystalline silica dust: Approach in Poland and worldwide. Int. J. Occup. Med. Environ. Health 2008, 21, 1–23. [Google Scholar] [CrossRef]
- Zheng, N.; Liu, J.; Wang, Q.; Liang, Z. Health risk assessment of heavy metal exposure to street dust in the zinc smelting district, Northeast. of China. Sci. Total Environ. 2010, 408, 726–733. [Google Scholar] [CrossRef] [PubMed]
- Omidianidost, A.; Ghasemkhani, M.; Azari, M.R.; Golbabaei, F. Assessment of occupational exposure to dust and crystalline silica in foundries. Tanaffos 2015, 14, 208. [Google Scholar] [PubMed]
- Acosta, J.A.; Cano, A.F.; Arocena, J.; Debela, F.; Martínez-Martínez, S. Distribution of metals in soil particle size fractions and its implication to risk assessment of playgrounds in Murcia City (Spain). Geoderma 2009, 149, 101–109. [Google Scholar] [CrossRef]
- Banerjee, A.D. Heavy metal levels and solid phase speciation in street dusts of Delhi, India. Environ. Pollut. 2003, 123, 95–105. [Google Scholar] [CrossRef]
- Calabrese, E.J.; Stanek, E.; James, R.C.; Roberts, S.M. Soil ingestion: A concern for acute toxicity in children. Environ. Health Perspect. 1997, 105, 1354–1358. [Google Scholar] [CrossRef] [PubMed]
- Ljung, K.; Oomen, A.; Duits, M.; Selinus, O.; Berglund, M. Bioaccessibility of metals in urban playground soils. J. Environ. Sci. Health Part A 2007, 42, 1241–1250. [Google Scholar] [CrossRef]
- U.S. EPA. Intake of fish and shellfish. In Exposure Factors Handbook 2011 Edition (Final Report); U.S. Environmental Protection Agency: Washington, DC, USA, 2011; p. 66. [Google Scholar]
- Sunyer, J.; Esnaola, M.; Alvarez-Pedrerol, M.; Forns, J.; Rivas, I.; López-Vicente, M.; Suades-González, E.; Foraster, M.; Garcia-Esteban, R.; Basagaña, X.; et al. Association between traffic-related air pollution in schools and cognitive development in primary school children: A prospective cohort study. PLoS Med. 2015, 12, e1001792. [Google Scholar] [CrossRef] [PubMed]
- Amato, F.; Rivas, I.; Viana, M.; Moreno, T.; Bouso, L.; Reche, C.; Àlvarez-Pedrerol, M.; Alastuey, A.; Sunyer, J.; Querol, X. Sources of indoor and outdoor PM2. 5 concentrations in primary schools. Sci. Total Environ. 2014, 490, 757–765. [Google Scholar] [CrossRef] [PubMed]
- Valido, I.H.; Padoan, E.; Moreno, T.; Querol, X.; Font, O.; Amato, F. Physico-chemical characterization of playground sand dust, inhalable and bioaccessible fractions. Chemosphere 2018, 190, 454–462. [Google Scholar] [CrossRef] [PubMed]
- Duggan, M.; Inskip, M.; Rundle, S.; Moorcroft, J. Lead in playground dust and on the hands of schoolchildren. Sci. Total Environ. 1985, 44, 65–79. [Google Scholar] [CrossRef]
- Taylor, M.P.; Camenzuli, D.; Kristensen, L.J.; Forbes, M.; Zahran, S. Environmental lead exposure risks associated with children’s outdoor playgrounds. Environ. Pollut. 2013, 178, 447–454. [Google Scholar] [CrossRef]
- Okereke, C.J.; Amadi, P.U.; Joy, O.C.; Uchenna, A.P. Accumulation and risk assessment of heavy metal contents in school playgrounds in Port. Harcourt Metropolis, Rivers State, Nigeria. J. Chem. Health Saf. 2017, 24, 11–22. [Google Scholar] [CrossRef]
- Massas, I.; Ehaliotis, C.; Kalivas, D.; Panagopoulou, G.; Kalivas, D. Concentrations and availability indicators of soil heavy metals; the case of children’s playgrounds in the city of Athens (Greece). Water AirSoil Pollut. 2010, 212, 51–63. [Google Scholar] [CrossRef]
- Glorennec, P.; Lucas, J.P.; Mandin, C.; Le Bot, B. French children′s exposure to metals via ingestion of indoor dust, outdoor playground dust and soil: Contamination data. Environ. Int. 2012, 45, 129–134. [Google Scholar] [CrossRef] [PubMed]
- Wong, J.; Mak, N. Heavy metal pollution in children playgrounds in Hong Kong and its health implications. Environ. Technol. 1997, 18, 109–115. [Google Scholar] [CrossRef]
- De Miguel, E.; Iribarren, I.; Chacón, E.; Ordoñez, A.; Charlesworth, S. Risk-based evaluation of the exposure of children to trace elements in playgrounds in Madrid (Spain). Chemosphere 2007, 66, 505–513. [Google Scholar] [CrossRef]
- Klug, C.; Cashman, K.; Bacon, C. Structure and physical characteristics of pumice from the climactic eruption of Mount Mazama (Crater Lake), Oregon. Bull. Volcanol. 2002, 64, 486–501. [Google Scholar]
- Orsi, G.; Gallo, G.; Heiken, G.; Wohletz, K.; Yu, E.; Bonani, G. A comprehensive study of pumice formation and dispersal: The Cretaio Tephra of Ischia (Italy). J. Volcanol. Geotherm. Res. 1992, 53, 329–354. [Google Scholar] [CrossRef]
- Hossain, K.M.A. Properties of volcanic pumice based cement and lightweight concrete. Cem. Concr. Res. 2004, 34, 283–291. [Google Scholar] [CrossRef]
- Kim, H.-K.; Ryou, J.-S. New approach for delaying the internal temperature rise of fire resistant mortar made with coated aggregate. Constr. Build. Mater. 2017, 149, 76–90. [Google Scholar] [CrossRef]
- American Society for Testing Materials. ASTM Standarts; ASTM International: West Conshohocken, PA, USA, 1958. [Google Scholar]
- American Society for Testing Materials. Standart Test D2216-10, methods for laboratory determination of water (moisture) content of soil and rock by mass. In ASTM Standarts; ASTM International: West Conshohocken, PA, USA, 2010. [Google Scholar]
- American Society for Testing Materials ASTM D2434-68. Standard Test Method for Permeability of Granular Soils (Constant Head); ASTM International: West Conshohocken, PA, USA, 2006; p. 5. [Google Scholar]
- American Society for Testing Materials ASTM D4318. Standard Test Method for Liquid Limit, Plastic Limit, and Plasticity Index of Soils; ASTM International: West Conshohocken, PA, USA, 2005. [Google Scholar]
- American Society for Testing Materials ASTM D1556-07. Standard Test Method for Density and Unit Weight of Soil in Place By Sand-Cone Method; ASTM International: West Conshohocken, PA, USA, 2007; 1556-07. [Google Scholar]
- Bekaroglu, S.K.; Yigit, N.; Karanfil, T.; Kitis, M. The adsorptive removal of disinfection by-product precursors in a high-SUVA water using iron oxide-coated pumice and volcanic slag particles. J. Hazard. Mater. 2010, 183, 389–394. [Google Scholar] [CrossRef]
- Kitis, M.; Kaplan, S.; Karakaya, E.; Yigit, N.; Civelekoglu, G. Adsorption of natural organic matter from waters by iron coated pumice. Chemosphere 2007, 66, 130–138. [Google Scholar] [CrossRef]
- Çifçi, D.İ.; Meriç, S. Manganese adsorption by iron impregnated pumice composite. Colloids Surf. 2017, 522, 279–286. [Google Scholar] [CrossRef]
Publisher’s Note: MDPI stays neutral with regard to jurisdictional claims in published maps and institutional affiliations. |
© 2021 by the authors. Licensee MDPI, Basel, Switzerland. This article is an open access article distributed under the terms and conditions of the Creative Commons Attribution (CC BY) license (https://creativecommons.org/licenses/by/4.0/).