Article

Characterization of Optical Coherence Tomography Images for Colon Lesion Differentiation under Deep Learning

by
Cristina L. Saratxaga
1,2,*,
Jorge Bote
3,
Juan F. Ortega-Morán
3,
Artzai Picón
1,
Elena Terradillos
1,
Nagore Arbide del Río
4,
Nagore Andraka
5,
Estibaliz Garrote
1,6 and
Olga M. Conde
2,7,8
1
TECNALIA, Basque Research and Technology Alliance (BRTA), Parque Tecnológico de Bizkaia, C/Geldo. Edificio 700, 48160 Derio, Spain
2
Photonics Engineering Group, University of Cantabria, 39005 Santander, Spain
3
Jesús Usón Minimally Invasive Surgery Centre, Ctra. N-521, km 41.8, 10071 Cáceres, Spain
4
Anatomic Pathology Service, Basurto University Hospital, 48013 Bilbao, Spain
5
Basque Foundation for Health Innovation and Research, BEC Tower, Azkue Kalea 1, 48902 Barakaldo, Spain
6
Department of Cell Biology and Histology, Faculty of Medicine and Dentistry, University of the Basque Country, 48940 Leioa, Spain
7
Valdecilla Biomedical Research Institute (IDIVAL), 39011 Santander, Spain
8
CIBER-BBN, Biomedical Research Networking Center—Bioengineering, Biomaterials, and Nanomedicine, Avda. Monforte de Lemos, 3–5, Pabellón 11, Planta 0, 28029 Madrid, Spain
*
Author to whom correspondence should be addressed.
Appl. Sci. 2021, 11(7), 3119; https://doi.org/10.3390/app11073119
Submission received: 12 February 2021 / Revised: 24 March 2021 / Accepted: 25 March 2021 / Published: 1 April 2021
(This article belongs to the Special Issue Machine Learning/Deep Learning in Medical Image Processing)

Abstract

:

Featured Application

Automatic diagnosis of colon polyps on optical coherence tomography (OCT) images for the development of computer-aided diagnosis (CADx) applications.

Abstract

(1) Background: Clinicians demand new tools for early diagnosis and improved detection of colon lesions that are vital for patient prognosis. Optical coherence tomography (OCT) allows microscopical inspection of tissue and might serve as an optical biopsy method that could lead to in-situ diagnosis and treatment decisions; (2) Methods: A database of murine (rat) healthy, hyperplastic and neoplastic colonic samples with more than 94,000 images was acquired. A methodology that includes a data augmentation processing strategy and a deep learning model for automatic classification (benign vs. malignant) of OCT images is presented and validated over this dataset. Comparative evaluation is performed both over individual B-scan images and C-scan volumes; (3) Results: A model was trained and evaluated with the proposed methodology using six different data splits to present statistically significant results. Considering this, 0.9695 (±0.0141) sensitivity and 0.8094 (±0.1524) specificity were obtained when diagnosis was performed over B-scan images. On the other hand, 0.9821 (±0.0197) sensitivity and 0.7865 (±0.205) specificity were achieved when diagnosis was made considering all the images in the whole C-scan volume; (4) Conclusions: The proposed methodology based on deep learning showed great potential for the automatic characterization of colon polyps and future development of the optical biopsy paradigm.

Graphical Abstract

1. Introduction

Colon cancer is the second most common cause of cancer death in Europe both for women and men, and the third most common cancer worldwide [1]. About 1.8 million new cases of colorectal cancer were recorded globally in 2018 [2], being the third most common cancer in men and second in women. The five-year survival rate is 90 percent for colorectal cancers diagnosed at an early stage, but unfortunately only 4 out of 10 cases are found this early [3].
Clinicians demand new non-invasive technologies for early diagnosis of colon polyps, especially to distinguish between benign and malignant or potentially malignant lesions that must be resected immediately. New methods should also proportionate information for safety margin resection and remaining tissue inspection after resection to decrease the possibility of tumor recurrence and improve patient prognosis. The current gold-standard imaging technique during patient examination is colonoscopy with narrow band red-flag technology for improved lesion visualization. During the procedure, lesions can be classified with Paris (morphology) [4] and Nice (vessel and surface) [5] classification patterns based on the physician experience. As this superficial information is not enough, the final diagnosis of the lesion is determined by the histopathological analysis after biopsy, meaning that all the suspicious polyps are resected. Bleeding related problems usually occur after biopsies are performed, with the risks that this entails for the patient. In fact, most problems occur when the biopsy is performed on a blood vessel and the incidence is higher when it is performed on patients with an abnormal blood coagulation function [6]. In relation to the latter, the rate of perforation associated to colonoscopies with polypectomy is 0.8/1000 (95% confidence interval (CI) 0.6–1.0) and the rate of bleeding related to polypectomies is 9.8/1000 (95% confidence interval (CI) 7.7–12.1) [7]. However, it is demonstrated that hyperplastic polyps are of a benign nature and can be left untouched, avoiding the underlying bleeding risk of resection, saving diagnosis time, costs, and patient trauma during that period [8]. On the other side, pre-malignant lesions and adenomatous polyps cannot be distinguished from neoplastic lesions as adenocarcinoma with the current diagnosis methods. In this sense, new imaging techniques and interpretation methods could allow real-time diagnosis and would facilitate better in-situ treatment of lesions, improving patient prognosis, especially if the diagnosis is made at early stages of the disease.
In recent years, different advanced imaging technologies that allow sub-surface microscopical inspection of tissue in an “optical-biopsy” manner have been under study for colonic polyps [9], such as: reflectance confocal microscopy (RCM) [10], multi-photon microscopy (MPM) [11], and optical coherence tomography (OCT) [12], among others. Of the mentioned techniques, a device called Cellvizio based on confocal laser endomicroscopy (CLE) is the only one commercially available. Using confocal mini-probes inserted in the working channel of flexible endoscopes, the system is used for studying the cellular and vascular microarchitecture of tissue. Colorectal lesions diagnosis [13,14,15] is one of the targeted applications and the corresponding probe reports a field-of-view (FOV) of 240 μm, 1 μm resolution and 55 to 65 μm confocal depth, with 20 maximum uses. The inconvenience of this system is that the successful usage by clinicians depends on specific training on image interpretation. Moreover, the main limitation is that this technology requires the use of an exogenous fluorophore which results in a more invasive procedure for the patient. In the case of MPM [16,17], which relies on the absorption of an external or endogen (as collagen) tissue fluorophore, high resolution images at sub-cellular level can also be obtained to study structural information, including also functional information. The mentioned ex vivo studies using this technology have revealed significant morphological differences between healthy and cancerous tissue. However, the interpretation of MPM images by clinicians also remains a challenge and relies on their expertise in histopathology.
In contrast, OCT provides sub-surface structural information of the lesion under a label-free approach, with reported resolutions less than 10 μm and penetration capacities up to 2 mm. OCT can be used in combination with MPM, as both technologies provide complementary information useful for diagnosis assessment. While RCM and MPM 2D images are obtained horizontally in the transversal plane (also called “en-face”), OCT 2D images (B-scan) are obtained axially in depth in the coronal or sagittal plane. Furthermore, since OCT also allows obtaining 3D images (C-scan), lesions can be studied volumetrically from different points or axes of visualization. Although OCT images have less resolution than RCM and MPM images, the penetration capacity is higher, and the acquisition time is generally lower. This OCT aspect is of great importance to evaluate lesion margins and tumor infiltration into the mucosa under real-time situations in clinical environments.
OCT technology capabilities in the diagnosis of colon polyps have been investigated in the latest years with promising results on the future adoption in clinical practice. Several studies [18,19,20,21], both in murine and human models, have reported the identification of tissue layers and the discrimination capacities of the technology on the differentiation of different types of benign (including healthy) and malignant tissue. When analyzing 44 polyps from 24 patients [18], endoscopists detected fewer subsurface structures and a lower degree of light scattering in adenomas, and that, in comparison, hyperplastic polyps were closer in structure and light scattering to healthy mucosa. The scattering property was calculated by a computer program applying statistical analysis (Fisher–Freeman–Halton test and Spearman rank correlation test), confirming the previous appreciation. A comparison of OCT images with respect to histopathological images was performed in [19] using previously defined criteria for OCT image interpretation on the identification of tissue layers. Upon the observations, hyperplastic polyps are characterized by a three-layer structure (with mucosa thickening) whereas adenomas are characterized by the lack of layers. Then, under these assumptions, measured over a group of 116 polyps from patients, lesions could be visually differentiated in OCT images with 0.92 sensitivity and 0.84 specificity. Later, a fluorescence-guided study performed on 21 mice [20] after administrating a contrast agent showed the OCT ability to differentiate healthy mucosa, early dysplasia, and adenocarcinoma. Visual analysis of normal tissue revealed that the submucosa layer is very thin in some specimens and not always well appreciated in the OCT images, although the tissue boundaries remain distinguishable. In adenoma polyps, a thickening of the mucosa (in first stages) or disappearance of the boundary between layers is detected, whereas in the case of adenocarcinoma, the OCT images showed a loss of tissue texture, absence of layers, and the presence of dark spots caused by the high absorption in necrotic areas. In the latest study [21], they go beyond and propose a diagnosis criterion over micro OCT images with some similarities to the Kudo pit pattern [22] and demonstrate the diagnosis capacity of the OCT technology as clinicians can reach 0.9688 sensitivity and 0.9231 specificity on the identification of adenomas over 58 polyps from patients.
Both the cross sectional and the en-face images have been shown to provide clinically relevant information in the mentioned studies, and the combination of both views for the detailed study of tissue features suggests an important advance [23,24,25]. In addition to previous studies, the calculation of the angular spectrum of the scattering coefficient map has also revealed quantifiable variances on the different tissue types [26].
The clinical characteristics of the lesions that can be observed on the OCT images can be further exploited by image-based analysis. Image and signal processing methods can allow dealing with the noisy nature of the signal, whereas machine learning algorithms are able to exploit the spatial correlation of the biological structures to make the most of them. These types of algorithms can detect, and quantify, subtle variations on images that the naked human eye cannot and can be applied with the goal of performing automatic interpretation of the images for image enhancement, lesion delimitation, or classification tasks. However, as seen in previously reviewed studies, few attempts of applying these methods for colon polyps on OCT images have been found, showing that there are opportunities of research in the area.
The main limitation of traditional machine learning methods is the need to process the original data from their natural form to another form of representation appropriate for the targeted problem. Image processing methods must be carefully applied to extract the most representative features of the data, aiming to resemble how the experts analyze the images. Then, the extracted features are passed as input to the selected classifier method. Unlike deep learning approaches, traditional machine learning methods require tailored feature extraction which is followed by a shallow machine learning method. This makes them less prone to generalization and leads to lower discriminative power [27]. Under the deep learning paradigm, image feature extraction and classification are simultaneously performed through a network architecture representing all possible solution domains and which is optimized by means of a loss function minimization that seamlessly drives the network parameters towards a suitable solution. Convolutional neural networks (CNN) [28,29] have surpassed classical machine learning methods [30,31], and even medical expert capabilities [32,33,34]. They have been also successfully applied in colon cancer histopathological classification [35,36], MPM classification [37], polyp detection on colonoscopy [38,39,40], or histological colon tissue staining [41].
The application of deep learning methods to OCT medical images is a recent trend and only few examples of application are available. Ophthalmology being the oldest context of application of OCT, most examples are found in this area, and some others in cardiology and breast cancer [42,43,44,45]. In gastroenterology of the lower track (colon), only one recent work has been identified [46]. A pattern recognition network called RetinaNet [47] has been trained to distinguish normal from neoplastic tissue with a 1.0 sensitivity and 0.997 specificity. The success of the model is based on a dentate structural pattern, identified in normal tissue in previous studies, being utilized as a structural marker on the images used as input during training and evaluation. In this sense, the B-scan images on the dataset (26,000 images acquired from 20 tumor areas) are manually inspected to identify “teeth” samples representing normal colonic mucosa and “noisy” samples representing malignant tissue. On evaluation, the network provides a list of boxes where these patterns are found along with the probability, and average scores are calculated over a sequence of N adjacent B-scan images. The drawback of this approach resides in the identification of the “teeth” pattern in normal tissue, but no other patterns have been identified for malignant tissue, just assuming that the “teeth” pattern does not appear in that case.
The work presented in this paper further investigates the application of deep learning methods over a collected database with more than 94,000 OCT images of murine (rat) colon polyps to study the discrimination capacity of this imaging technique for its future adoption as a real-time optical biopsy method. The aim of this proposal is to contribute to setting the bases for the automatic analysis of images with latest state-of-the-art techniques that could lead to the development of new computer-aided diagnosis (CADx) applications. Once image analysis methods demonstrate this capacity, colon polyp diagnosis with OCT can be progressively mastered by clinicians and the adoption of the technology naturally accomplished. With this aim, this work implements a classification (benign vs. malignant) approach based on an Xception deep learning model that is trained and tested over a large dataset of OCT images from murine (rat) samples that have been collected for this purpose. We propose a pre-processing method for data augmentation and to validate the application of deep learning methods for colon polyp classification as benign or malignant. In addition, to further investigate the diagnosis capacity of the proposed approach, evaluation is performed twice, once over individual B-scan images and then also over C-scan volumes for comparison. Finally, a strategy to maximize results when evaluating individual B-scans is applied.
In comparison with previous studies [46], this work proposes a general diagnosis strategy based on classification instead of pattern recognition, which avoids time consuming manual annotation of the database providing automatic identification of the characteristics representing polyps tissue type. The classification strategy model can generalize better upon new polyp categories than the segmentation strategy, the performance of which is biased by the available annotations of the database. A classification strategy can help in the identification of subtle characteristics present on noisy OCT images that are not easily distinguished by the naked eye, and with proper visualization of them, can help clinicians to better understand the OCT imaging technique. In the future, the combination of both approaches could be considered for maximizing automatic diagnosis results.

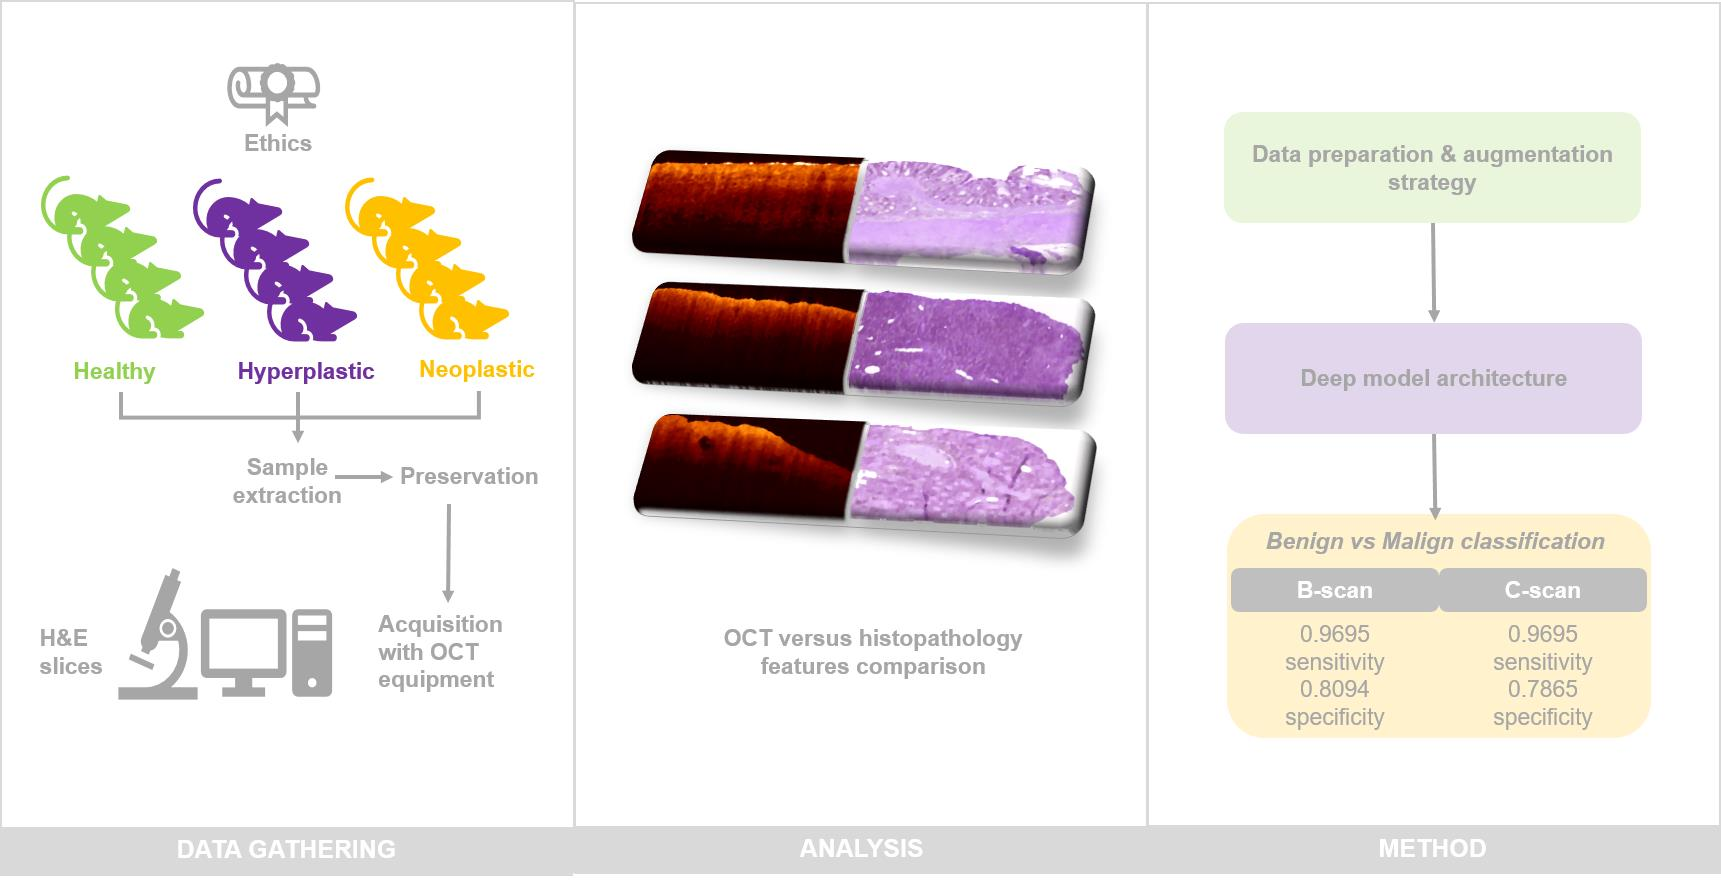
2. Materials and Methods

2.1. Animal Models

Sixty animals with colorectal cancer (CRC) from the strain PIRC (polyposis in the rat colon) rat F344/NTac-Apcam1137 model (sex ratio: 50/50) from the Rat Resource and Research Centre (RRRC) were used for the extraction of neoplastic colonic samples. This animal model was used in the study for the following main reasons: (a) it is an excellent model for studying human familial colon cancer; (b) ENU (N-ethyl-N-nitrosourea)-induced point mutation results in a truncating mutation in the APC (adenomatous polyposis coli) gene at a site corresponding to the human mutation hotspot region of the gene; (c) heterozygotes develop multiple tumors in the small intestine and colon by 2–4 months of age; (d) PIRC tumors closely resemble those in humans in terms of histopathology and morphology as well as distribution between intestine and colon; (e) provides longer lifespan compared to related mouse models (10–15 months); and (f) tumors may be visualized by CT (computerized tomography), endoscopy, or dissection. Moreover, the absolute incidence and multiplicity of colonic tumors are higher in F344-PIRC rats than in carcinogen-treated wild-type F344 rats, or in mice [48,49].
Additionally, thirty rats from the strain Fischer344—F344 wildtype model (sex ratio: 50/50) were used for the development and extraction of hyperplastic colonic samples. A rat surgical model of hyperplasia in the colon was developed in novo for endoscopic applications. It recreates important features of human hyperplasia, such as the generation of new cells in the colonic mucosa and tissue growth, as well as the corresponding angiogenesis. It consists of an extracolonic suture on which lesions are inflicted with a biopsy extraction forceps during a period established in different weekly follow-ups for the correct induction of the model [50,51].
Finally, as a control group, ten healthy tissue samples from three specimens were extracted from the colon of rats from the strain Fischer344—F344 wildtype model (sex ratio: 50/50). Uninvolved areas of the hyperplasia animals (ascending colon, transverse colon, and regions of the descending colon without lesion) were used as healthy tissue samples. This ensured meeting one of the three r’s of animal research that aims to maximize the information obtained per animal, making it possible to limit or avoid further use of other animals, without compromising animal welfare.

2.2. Equipment

The equipment used for imaging the murine (rat) samples was a CALLISTO from Thorlabs (CAL110C1) [52] spectral domain system with central wavelength 930 nm, field of view of 6 × 6 mm2, 7 µm axial resolution, 4 µm lateral resolution, 1.7 mm measurement in depth, 107 dB sensitivity at 1.2 kHz measurement speed, and 7.5 mm working distance. Samples were scanned using the high-resolution scan lens (18 mm focal length) and a standard probe head with a rigid scanner for stable and easy-to-operate setup.

2.3. Acquisition Procedure

2.3.1. Sample Acquisition Procedure

Rats were acclimatized before surgery in individually housed cages at 22–25 °C with food and water ad libitum. All surgical procedures were performed under general inhalation anesthesia [53,54,55] by placing them in an induction chamber to administrate sevoflurane 6–8% in oxygen with a high flow of fresh gas (1 L/min). Then, they were connected to a face mask to continue the administration of sevoflurane (3–3.5%) in oxygen (300 mL/min) and placed in dorsal decubitus to carry out the endoscopic procedure. Atropine (0.05 mg/kg), meloxicam (1 mg/kg/24 h), and pethidine (10–20 mg/kg) were injected subcutaneously before beginning the surgical procedure. A thermal blanket was used throughout the procedure. Once the animals had acquired the appropriate surgical plane, a colonoscopy was performed to rule out the presence of abnormalities that could interfere with the study. The aim was locating all those lesions that could be found through observation by using white light and a rigid cystourethroscope of 2.9 mm in diameter, which reached a diameter of up to 5 mm when working with an intermediate sheath and an external sheath (size appropriate for this animal model), with the objective of not damaging said structures at the start of the procedure. After shaving the abdomen and preparing the area with povidone-iodine and 70% ethanol, animals were covered with an open sterile cloth. Then, an average laparotomy of 4–5 cm in length was performed. A retraction device with hooks (Lonestar®) was used as support tool to make this section circular and externalize all the necessary intestinal content outside the abdomen. Animals were kept at constant temperature thanks to successive peritoneal washes made with tempered serum. Then, the block of the colon was fixated with a suture to prevent the reversion of the content throughout the colon and cecum. Three areas (ascending colon, transverse colon, and descending colon) were studied consecutively taking advantage of the anatomical division of the colon. They were divided with the help of ligatures (silk 4/0) through the mesentery of each portion and scanned in the proximal to distal direction making use of the rigid cystoscope to check the number of polyps.
At each point with lesions, a disposable bulldog clamp was used to mark the distribution of the lesions, thus avoiding cutting the lesions in the next procedure of colostomy of ascending and transverse portions. After that, the colon was extracted in block and then, the animals were euthanized under general inhalation anesthesia by rapid intracardiac injection of potassium chloride (KCl) (2 mEq/kg, KCl 2M), according to the ethical committee recommendations. The colon was opened by a longitudinal colotomy with the help of scissors to eliminate the tube shape of the colon, exposing thus the mucosa with the localized polyps to improve their visualization, handling, and analysis. At this time, magnification was provided by a STORZ VITOM® HD for a better location of the lesions with the extended organ.
For each localized lesion, a sample was extracted for later ex vivo analysis with the OCT equipment. Instead of acquiring the images directly on the fresh sample after resection, samples were fixed and then preserved for several further analyses while maintaining the properties of the tissue. Based on [56], the fixation procedure for each sample consisted in the immersion of the sample in 4% formaldehyde for at least 14 h at about 4 °C. Then, after two washes with phosphate buffered saline 0.01 M (PBS) each 30 min, the sample was submerged in PBS and 0.1% of sodium azide and stored in refrigeration at 4 °C. This method was established to provide safer handling of samples, avoiding the adverse effects of manipulating formaldehyde-embedded samples in a surgical environment. Additionally, it was checked with histopathological analysis that this fixation procedure did not alter the properties of the tissue, showing no noticeable differences from fresh tissue.

2.3.2. Image Acquisition Protocol

First, each sample was placed on a plate, secured, and fixed for the correct exposure of the tissue. Once placed on the platform under the OCT probe, a B-scan of the sample was acquired for further calibration of the equipment. While scanning, the sample was focused by approaching the OCT probe. The super-fine focus allows to acquire a high-quality OCT signal with the better penetration depth. Due to the anatomical differences of the samples, it was always necessary to repeat this step for each new sample. Once the sample was properly focused and the 2D signal quality optimized, the next step was the acquisition of a C-scan of the sample. In this case, the software allowed drawing a rectangle (Figure 1) indicating where to perform the 3D acquisition on the sample. When considered, various 3D scans covering different parts of the lesion were recorded for the same lesion.

2.3.3. Dataset Summary

The database consists of healthy, hyperplastic, and neoplastic (adenomatous and adenocarcinoma) samples. Following the previously described acquisition procedure, the subsequent number of cases were included in the database for each tissue type: 10 healthy samples with 48 C-scans, 13 hyperplastic samples with 53 C-scans, and 75 neoplastic samples with 245 C-scans. As a result, the database contains a total of 94,687 B-scan images.
The database was visually inspected before training the model ignoring all C-scans or B-scan images acquired with errors, large aberrations, or artifacts to ensure the quality of the data. Note that this database is a preliminary version of an ongoing larger dataset that will be made openly available. Access to the database used in this article is possible upon request to the corresponding author.

2.4. Ethical Considerations

Ethical approvals for murine (rat) samples acquisition were obtained from the relevant Ethics Committees. In case of research with animals, it was approved by the Ethical Committee of animal experimentation of the Jesús Usón Minimally Invasive Surgery Centre (Number: ES 100370001499) and was in accordance with the welfare standards of the regional government which are based on European regulations.

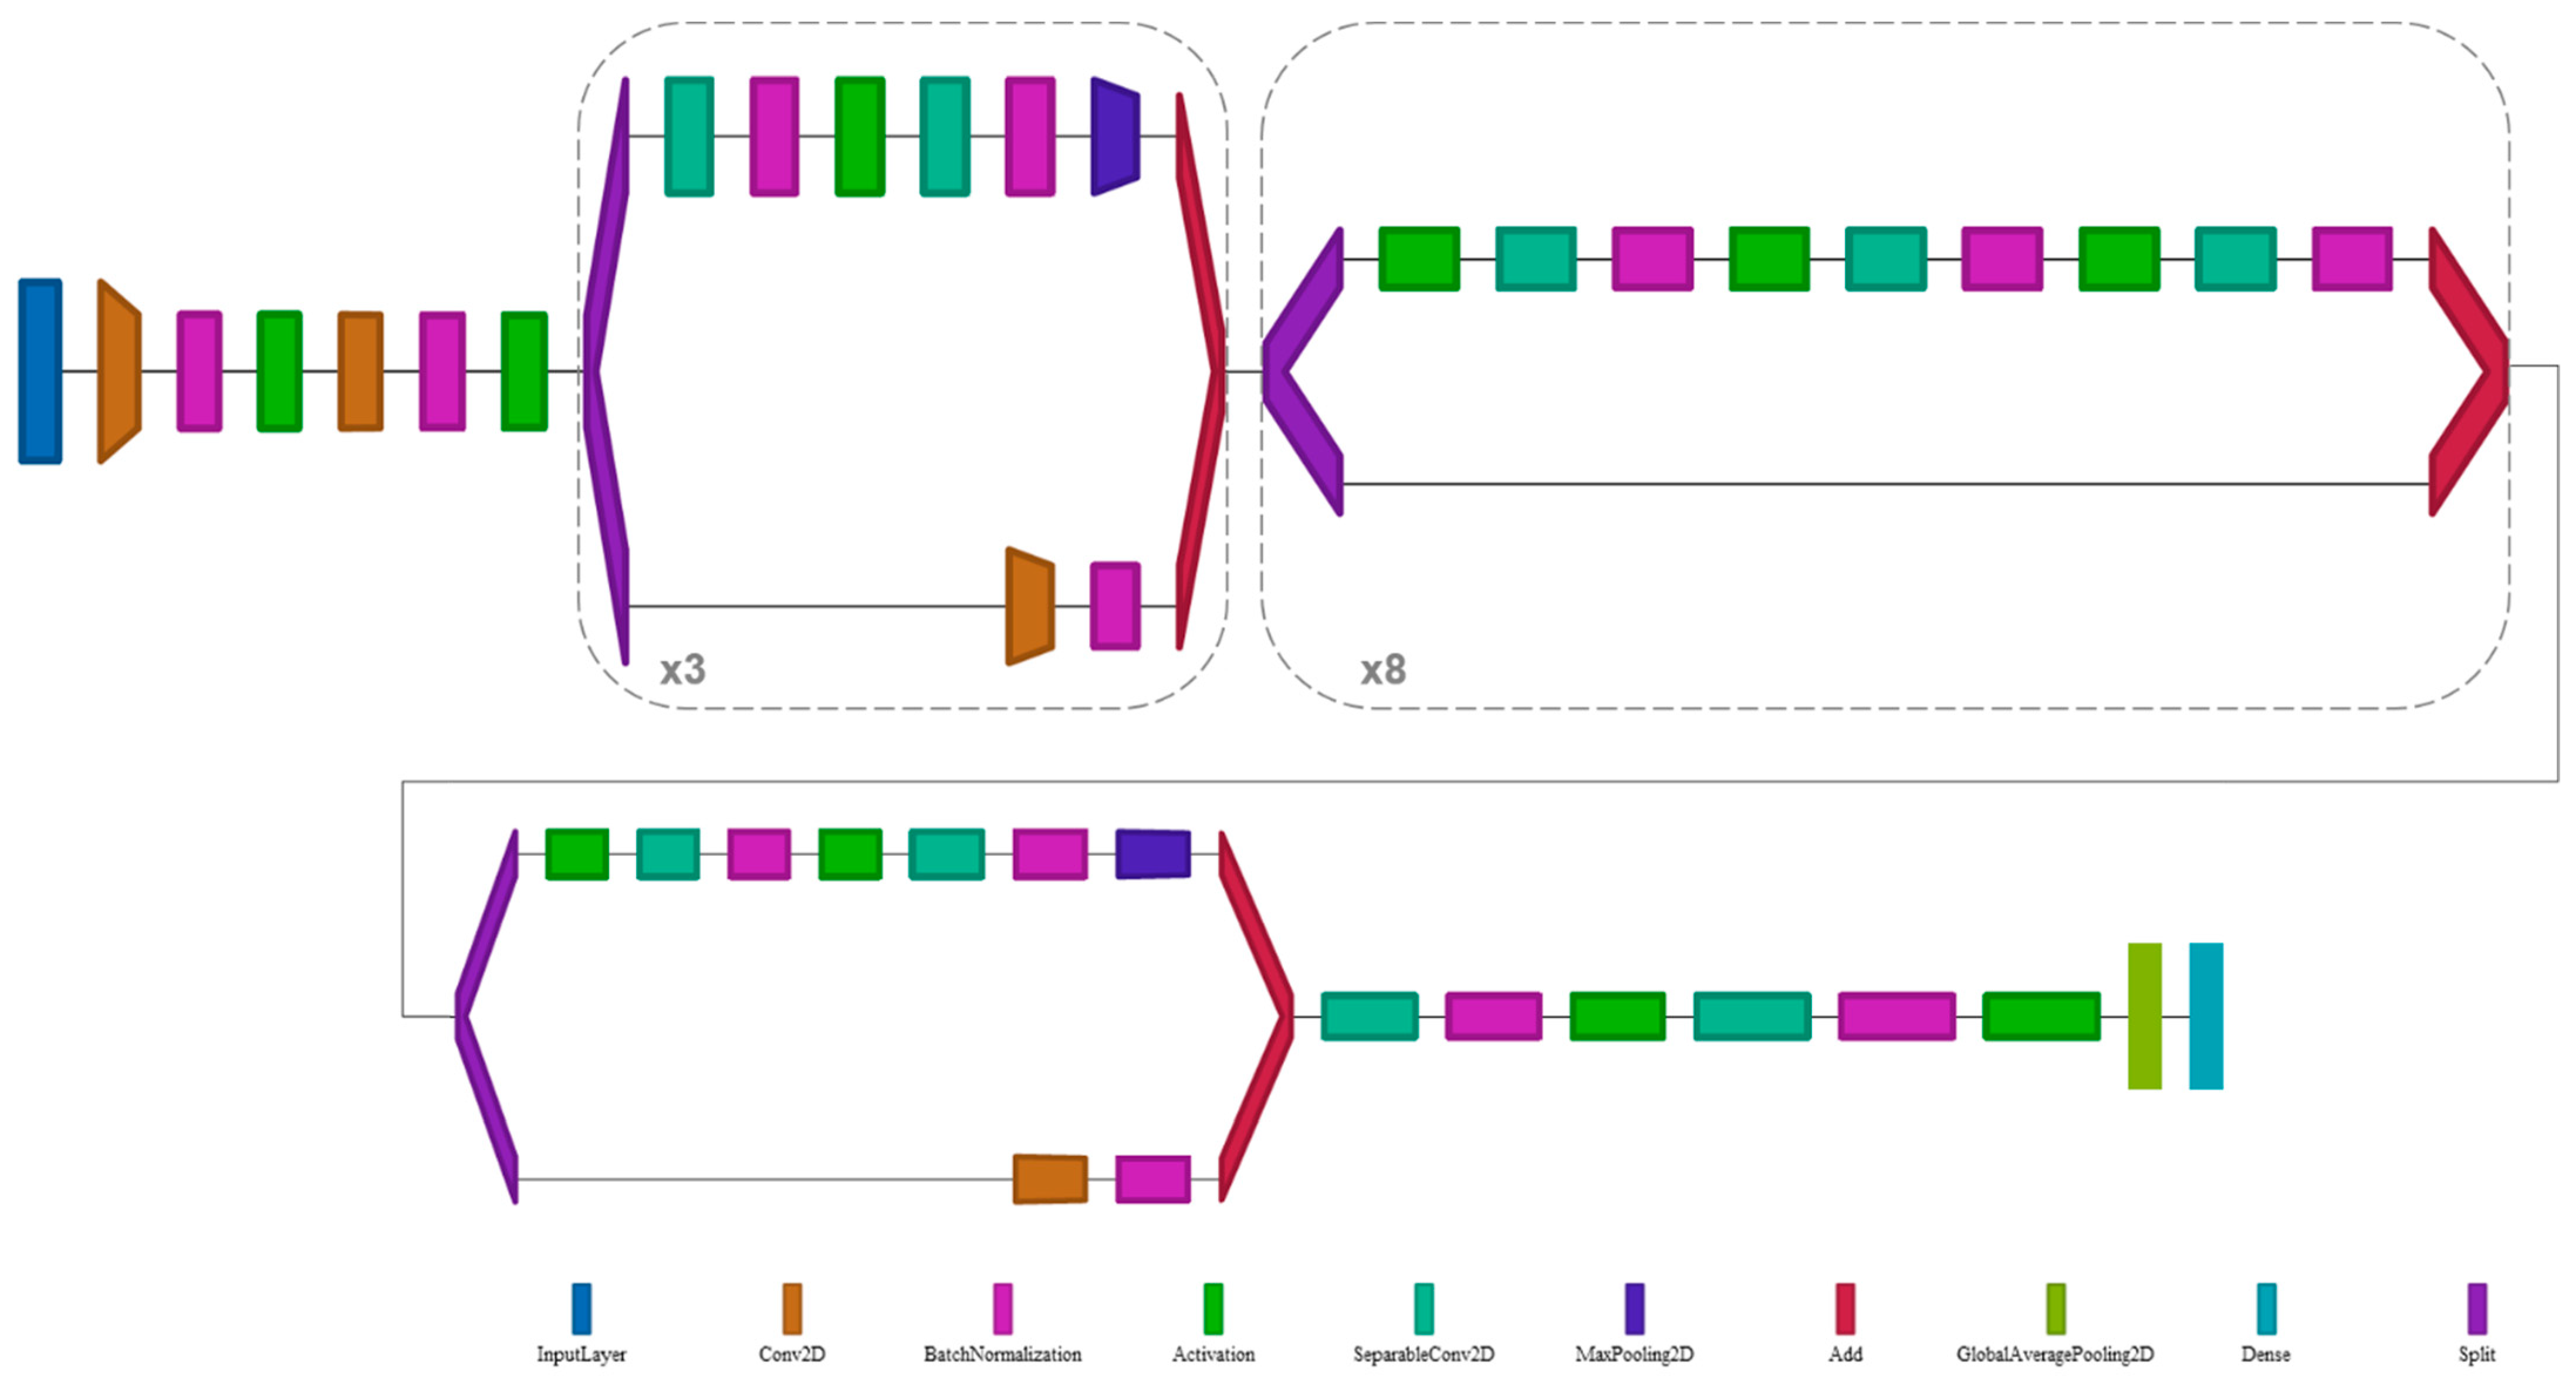
2.5. Deep Learning Architecture

The proposed architecture was based on the Xception classification model [57] previously trained over the ImageNet dataset [58]. Then, a global average pooling layer and a final layer with 2 neurons and softmax activation were added, representing the classification classes: benign vs. malignant. A schematic view of the architecture, generated with a visual grammar tool [59], is provided in Figure 2.
This pre-trained network accepts images of the size of 299 × 299 pixels which are randomly sampled from the original OCT images as detailed in next section “data preparation and augmentation”. OCT images on the database (B-scan images) have variable lateral sizes in the range 512–2000 pixels due to differences in the sizes of the polyps and scanning area selected. For this reason, B-scan images were pre-processed to extract regions of interest of smaller size (299 × 299 pixels) to make the most of the images and avoid losing lesion structural features on the bigger images that would happen with image rescaling. Directly rescaling the whole image could be comparable to reducing the lateral and axial resolution of the images, and hence losing information about the smaller structures. The proposed data preparation approach also serves as a data augmentation strategy. Moreover, a strategy for dealing with data imbalance in the dataset was also adopted.

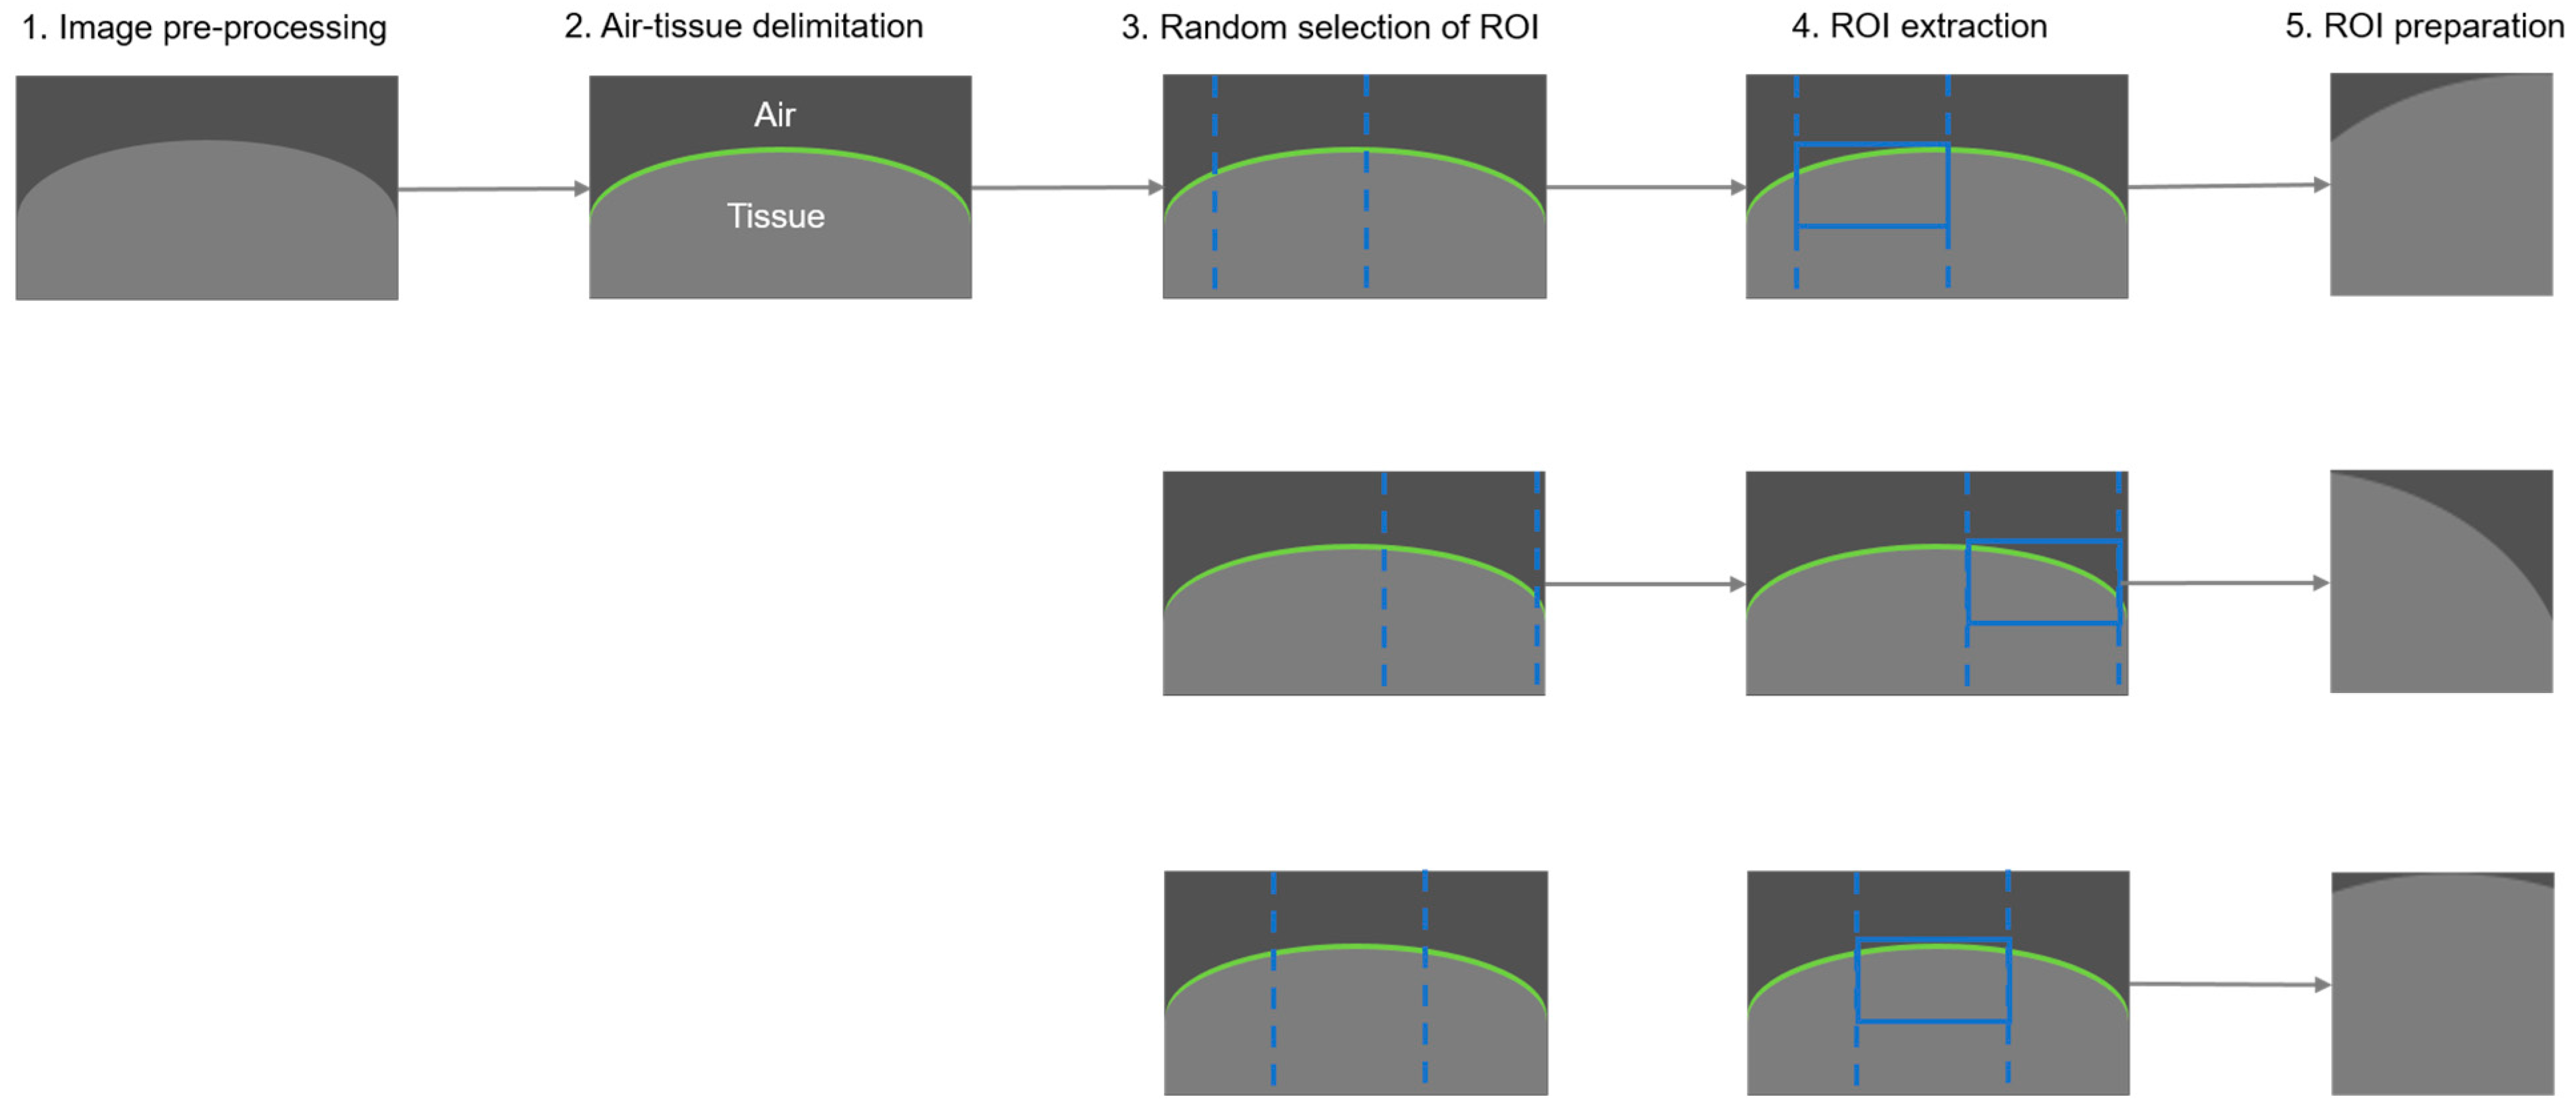
2.5.1. Data Preparation and Augmentation

As a data augmentation strategy, during the training process, the algorithm processes the dataset images in the following manner: image pre-processing; air-tissue delimitation; random selection of region of interest (ROI); ROI extraction; and ROI preparation. These steps are illustrated in Figure 3.
  • Image pre-processing
The OCT gray scale original image contains one single channel that is duplicated to generate the 3-channel image expected by the network to use the ImageNet pre-trained weights. As an additional data augmentation strategy, the image is randomly flipped horizontally to produce alternative input images. No additional geometric transformations are applied to the image, as this would alter the structural features of the lesion and lead to misclassification.
2.
Air-tissue delimitation
The aim of this step is to automatically detect on the image the delimitation between the air and the tissue. The final goal of this operation is to obtain ROI images adjusted to the tissue, so the noise present in the air part and the differences on the distance from the scanning tip to the tissue in the database images do not provide ambiguous information to the network. Conversely, the shape of the lesion is preserved, and flattering is discarded, as this could be a clinically interesting feature for differentiating the lesion’s diagnostic nature.
This step was implemented following the next sub-steps: automatic calculation of Otsu threshold [60] to differentiate between the air and the tissue regions; binary mask generation applying the calculated Otsu threshold to the image; morphological operation to remove small objects from the binary mask; then, for each column in the mask image, extraction of the location (row) of the first positive (true) value if available, to obtain a 1D array containing the delimitation path; and application of a median filter (kernel size = 69) to the delimitation array to eliminate or smooth possible noise in the signal.
3.
Random selection of region of interest
Considering that the total width of the input image (number of A-scans) is highly variable for the different images of the dataset due to the sample size and scanning conditions, a random number indicating where to start the region of interest is calculated. A preliminary sub-image (column) is obtained considering a width of 512 px for the region of interest.
4.
ROI extraction
The values of the delimitation array are applied to the previously extracted sub-image to adjust the tissue at the top, generating a ROI of 512 px width and 224 px depth, which is equivalent to approximately 0.71 mm in width and 0.75 mm in depth considering the optics of the device. Preliminary experiments with fewer widths or longer depths reported worse results. Smaller ROIs reduce the maintained information worsening the feature extraction and classification performance, so it is important to reach an agreement between both aspects.
5.
ROI preparation (post-processing)
The extracted ROIs are resized to 229 px width and 299 px depth to match the default input size of the network (pre-trained with ImageNet).

2.5.2. Data Imbalance Management

This work aims at differentiating benign samples, including healthy tissue and hyperplastic polyps, from malignant/neoplastic samples, including adenomatous and adenocarcinomatous samples. Unfortunately, in our dataset, healthy and hyperplastic samples are underrepresented with respect to neoplastic samples. Data imbalance is a usual problem and for the moment there is not a best strategy for dealing with it, as it mostly depends on the problem to solve and on data characteristics. In this work, a resampling strategy was implemented. This strategy was preferred to weight balance compensation, where weights of each class are calculated and specified on network fitting, as in the authors’ experience, it provides better results.
Resampling is a classical strategy for dealing with data imbalance. Over-sampling means adding more samples to the minority class, whereas under-sampling means removing samples for the majority class. Over-sampling and under-sampling can be achieved following different strategies, with the weakness that these may imply. The simplest way is to randomly duplicate or remove samples.
In this work, we implemented an over-sampling strategy by adding new samples for the minority class. However, these new samples were not exact copies of original data, as small variations were introduced to create a diverse set of samples. As described in the previous section, dataset images were manipulated for randomly obtaining ROIs (see Figure 3), that in addition were randomly horizontally flipped, which allowed introducing this variability in the training and validation set.

2.5.3. Training Process

The implemented network was based on a Xception model [57], where a global average pooling layer followed by a dense layer (with two outputs and softmax activation) to deal with a 2-class problem (benign vs. malignant) was added at the end. Pre-trained weights of ImageNet were used [58].
Categorical cross entropy loss was minimized by an Adam optimizer with a learning rate of 0.0001 during the training process. The selected batch size is 24, for a number of 100 epochs and validation loss minimization was monitored for early stopping (with patience 20). The training process was repeated 6 times over different data splits to make sure that the provided results were not biased.

2.5.4. Data Evaluation and Test-Time Augmentation

As described before, OCT C-scans were acquired from murine (rat) polyp samples and adjacent healthy tissue. The C-scans are 3D volumes that consist of consecutive and adjacent B-scan images. For some of the polyps, several C-scans covering different parts of the lesion (upper, center, and bottom) were obtained and included in the same data split. As one of the aims of this work was to study the diagnosis capacity and limitations of OCT in more detail, the evaluation of the model was designed with the intention of comparing the discrimination capacity of the individual B-scans classification with respect to C-scans.
A test time augmentation (TTA) strategy was applied to B-scan and C-scan evaluation. This was implemented by performing 10 augmentations over the data following the random ROI extraction strategy previously described (see Figure 3) and then calculating the mean prediction. By applying this strategy, we estimated a richer posterior probability distribution function of the prediction for the bigger (wider) B-scans. We present a comparison of the results without TTA (called standard) and with TTA to facilitate studying how this technique contributed to the proposed approach.

3. Results

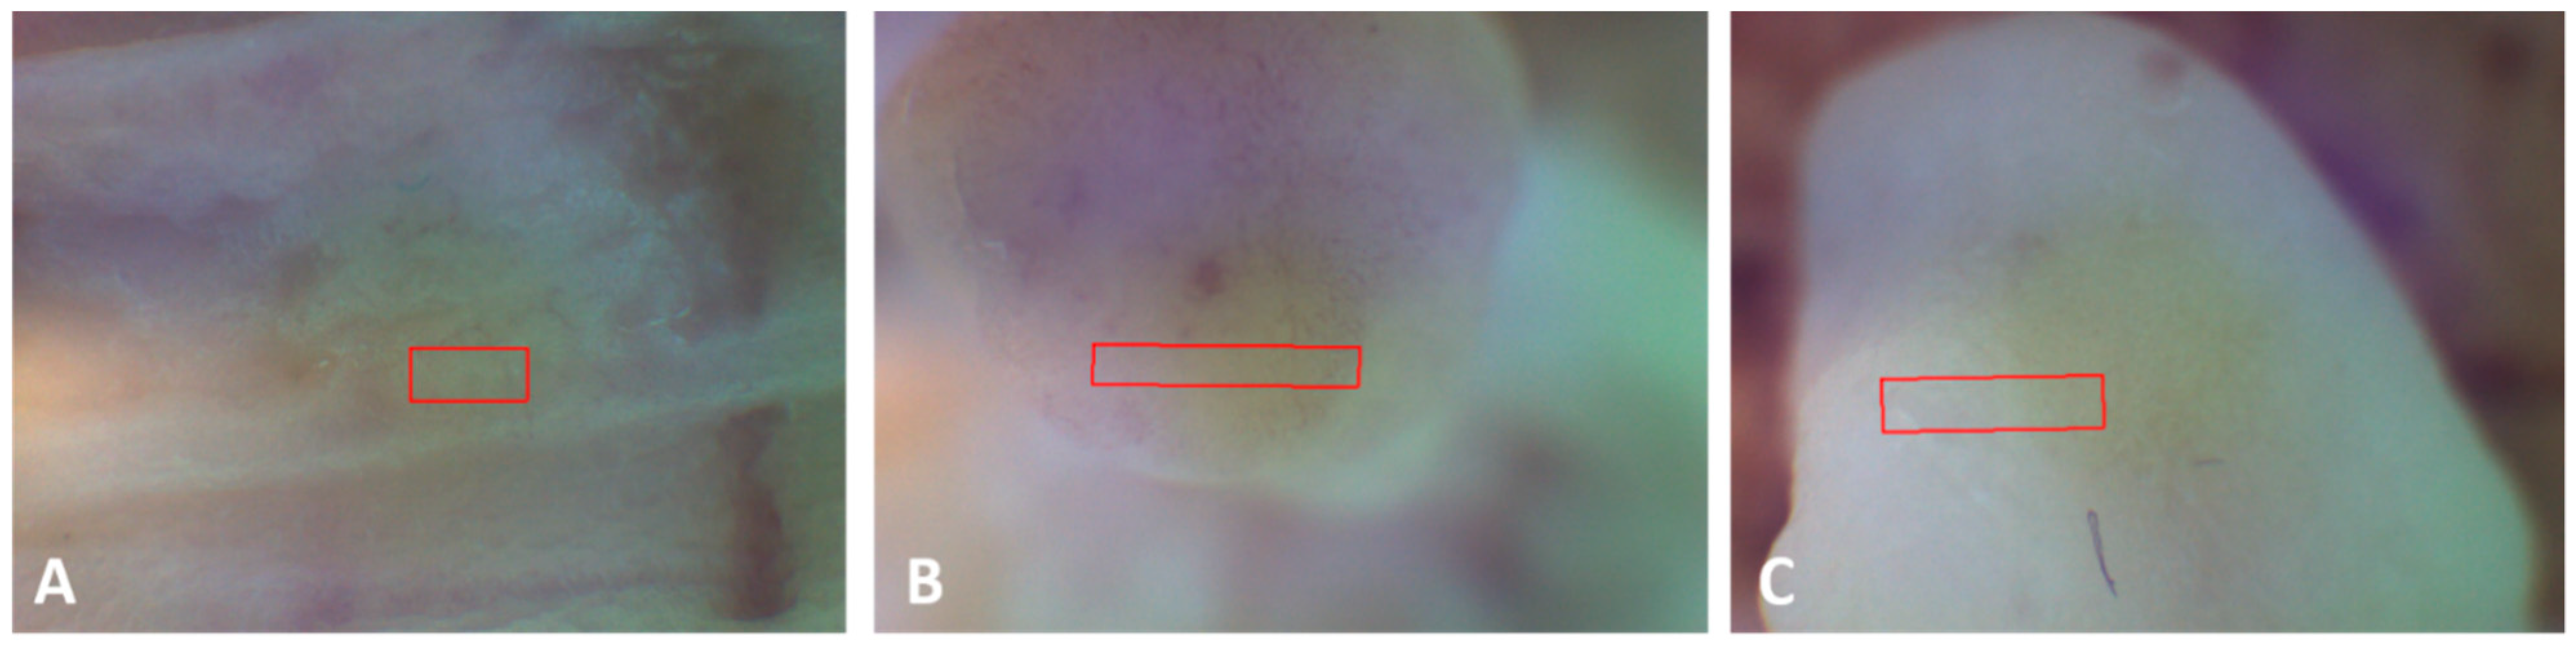
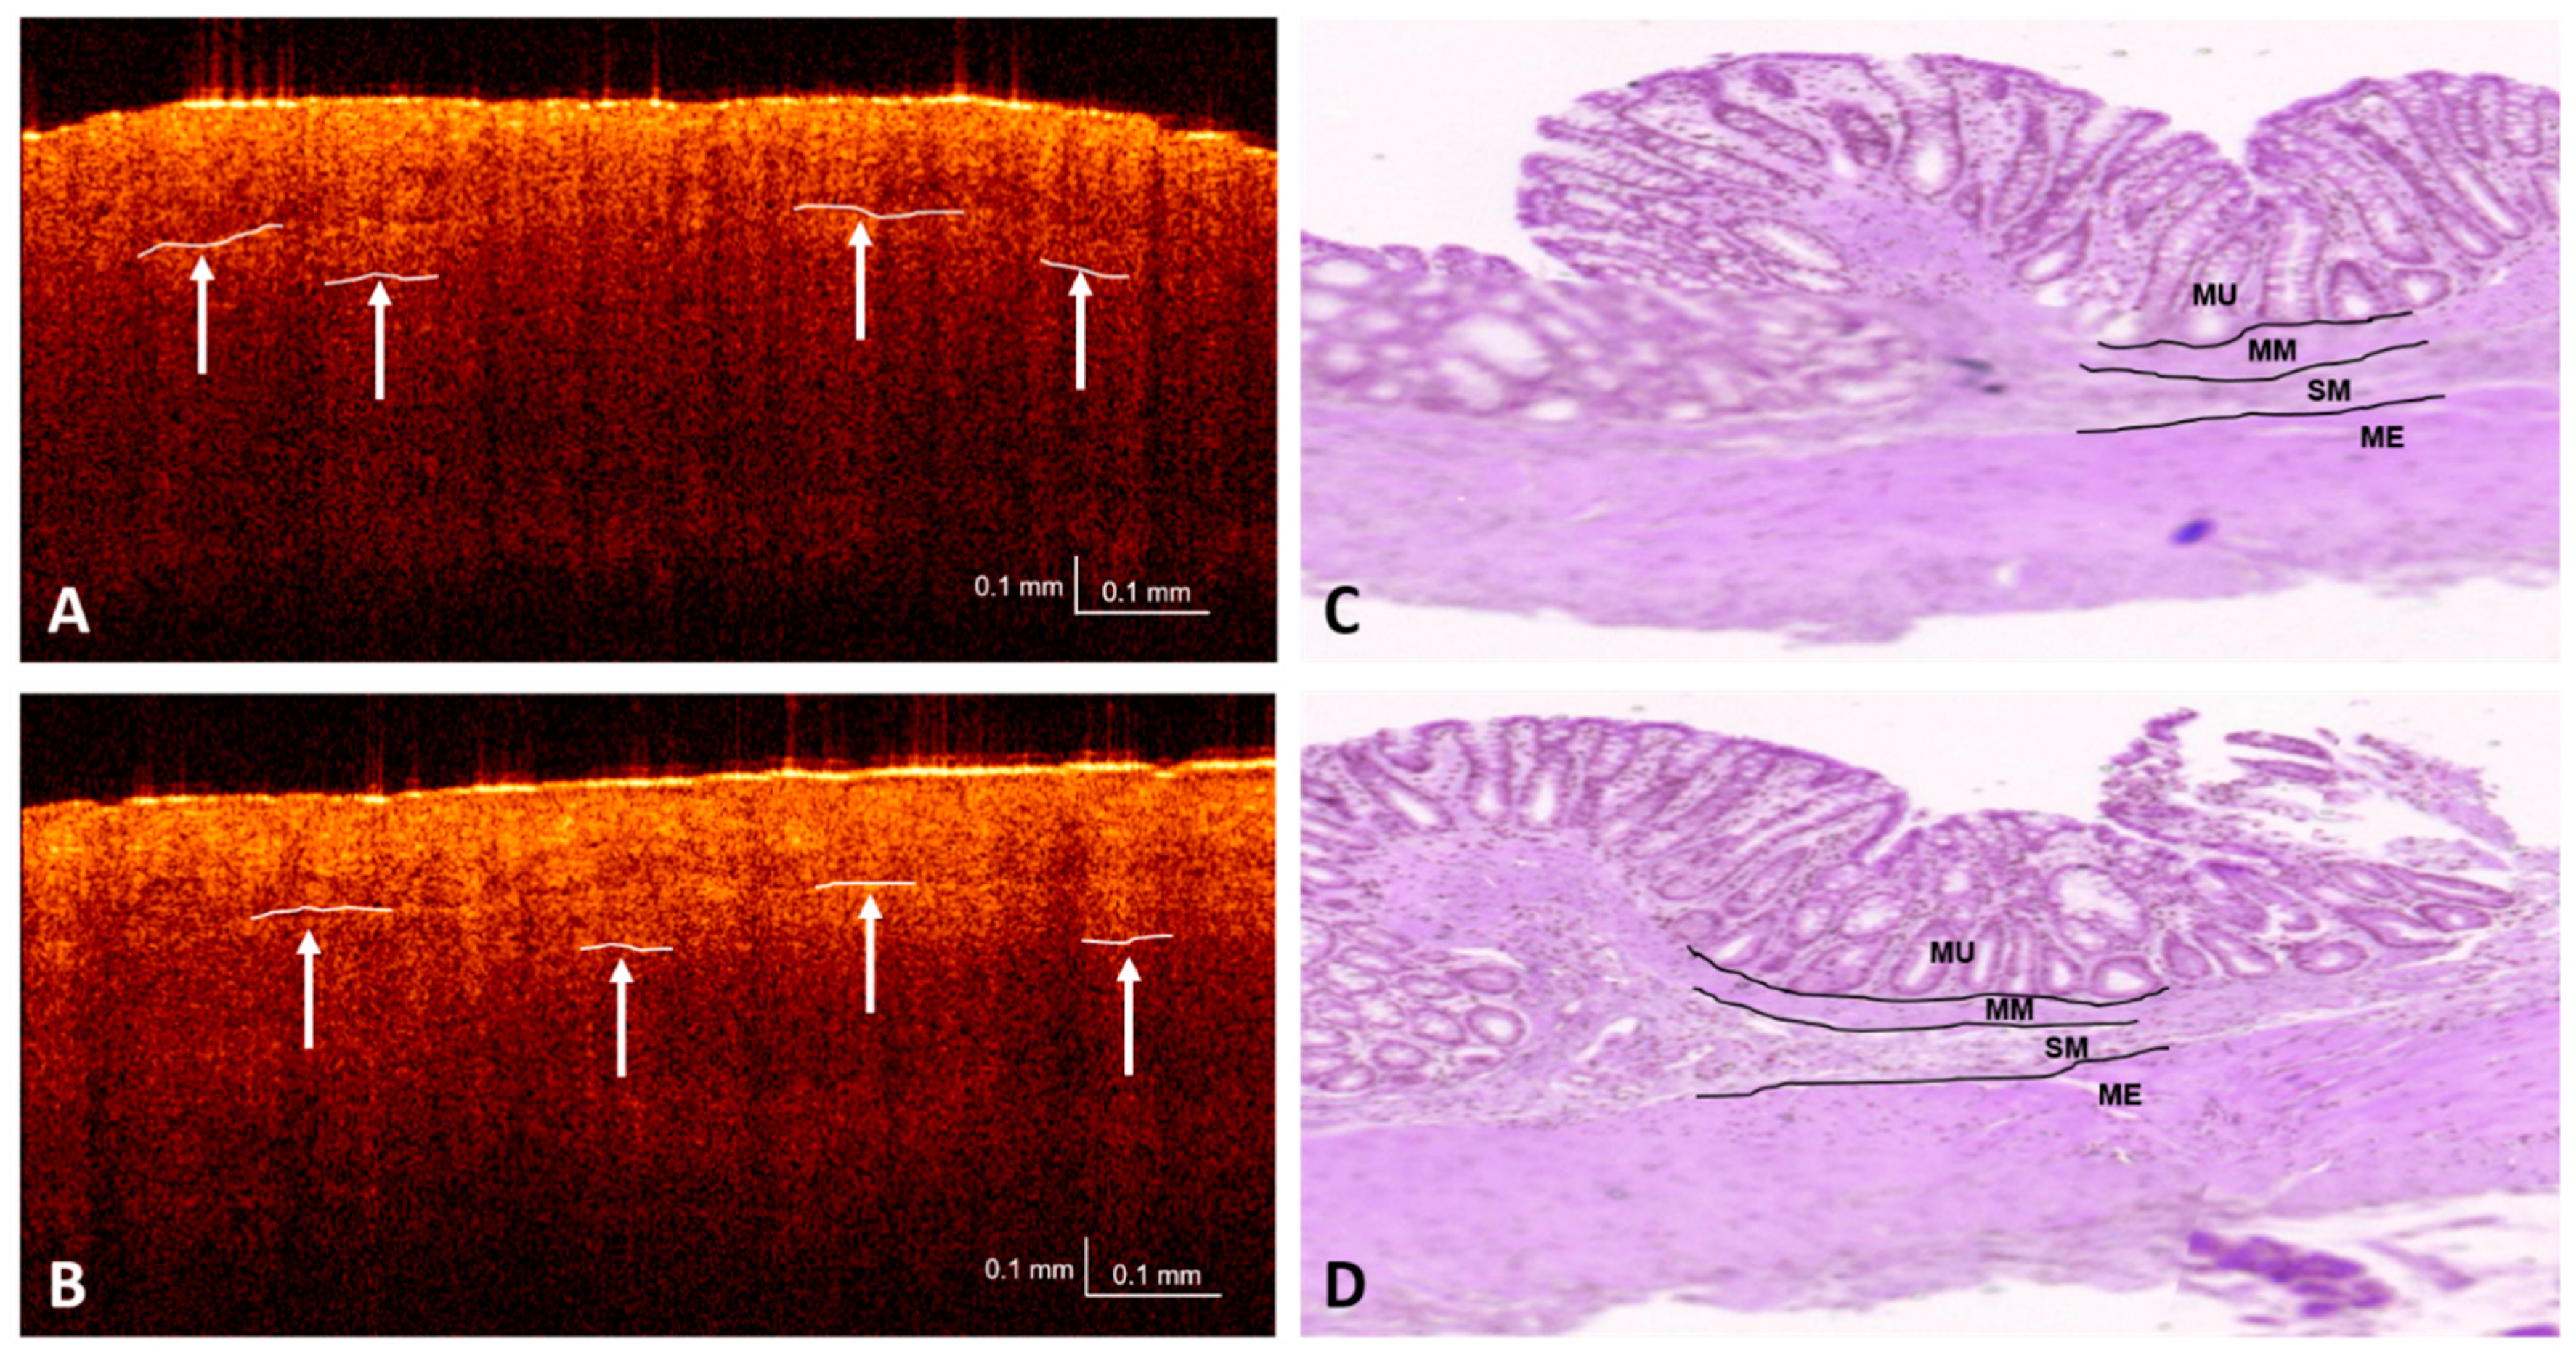
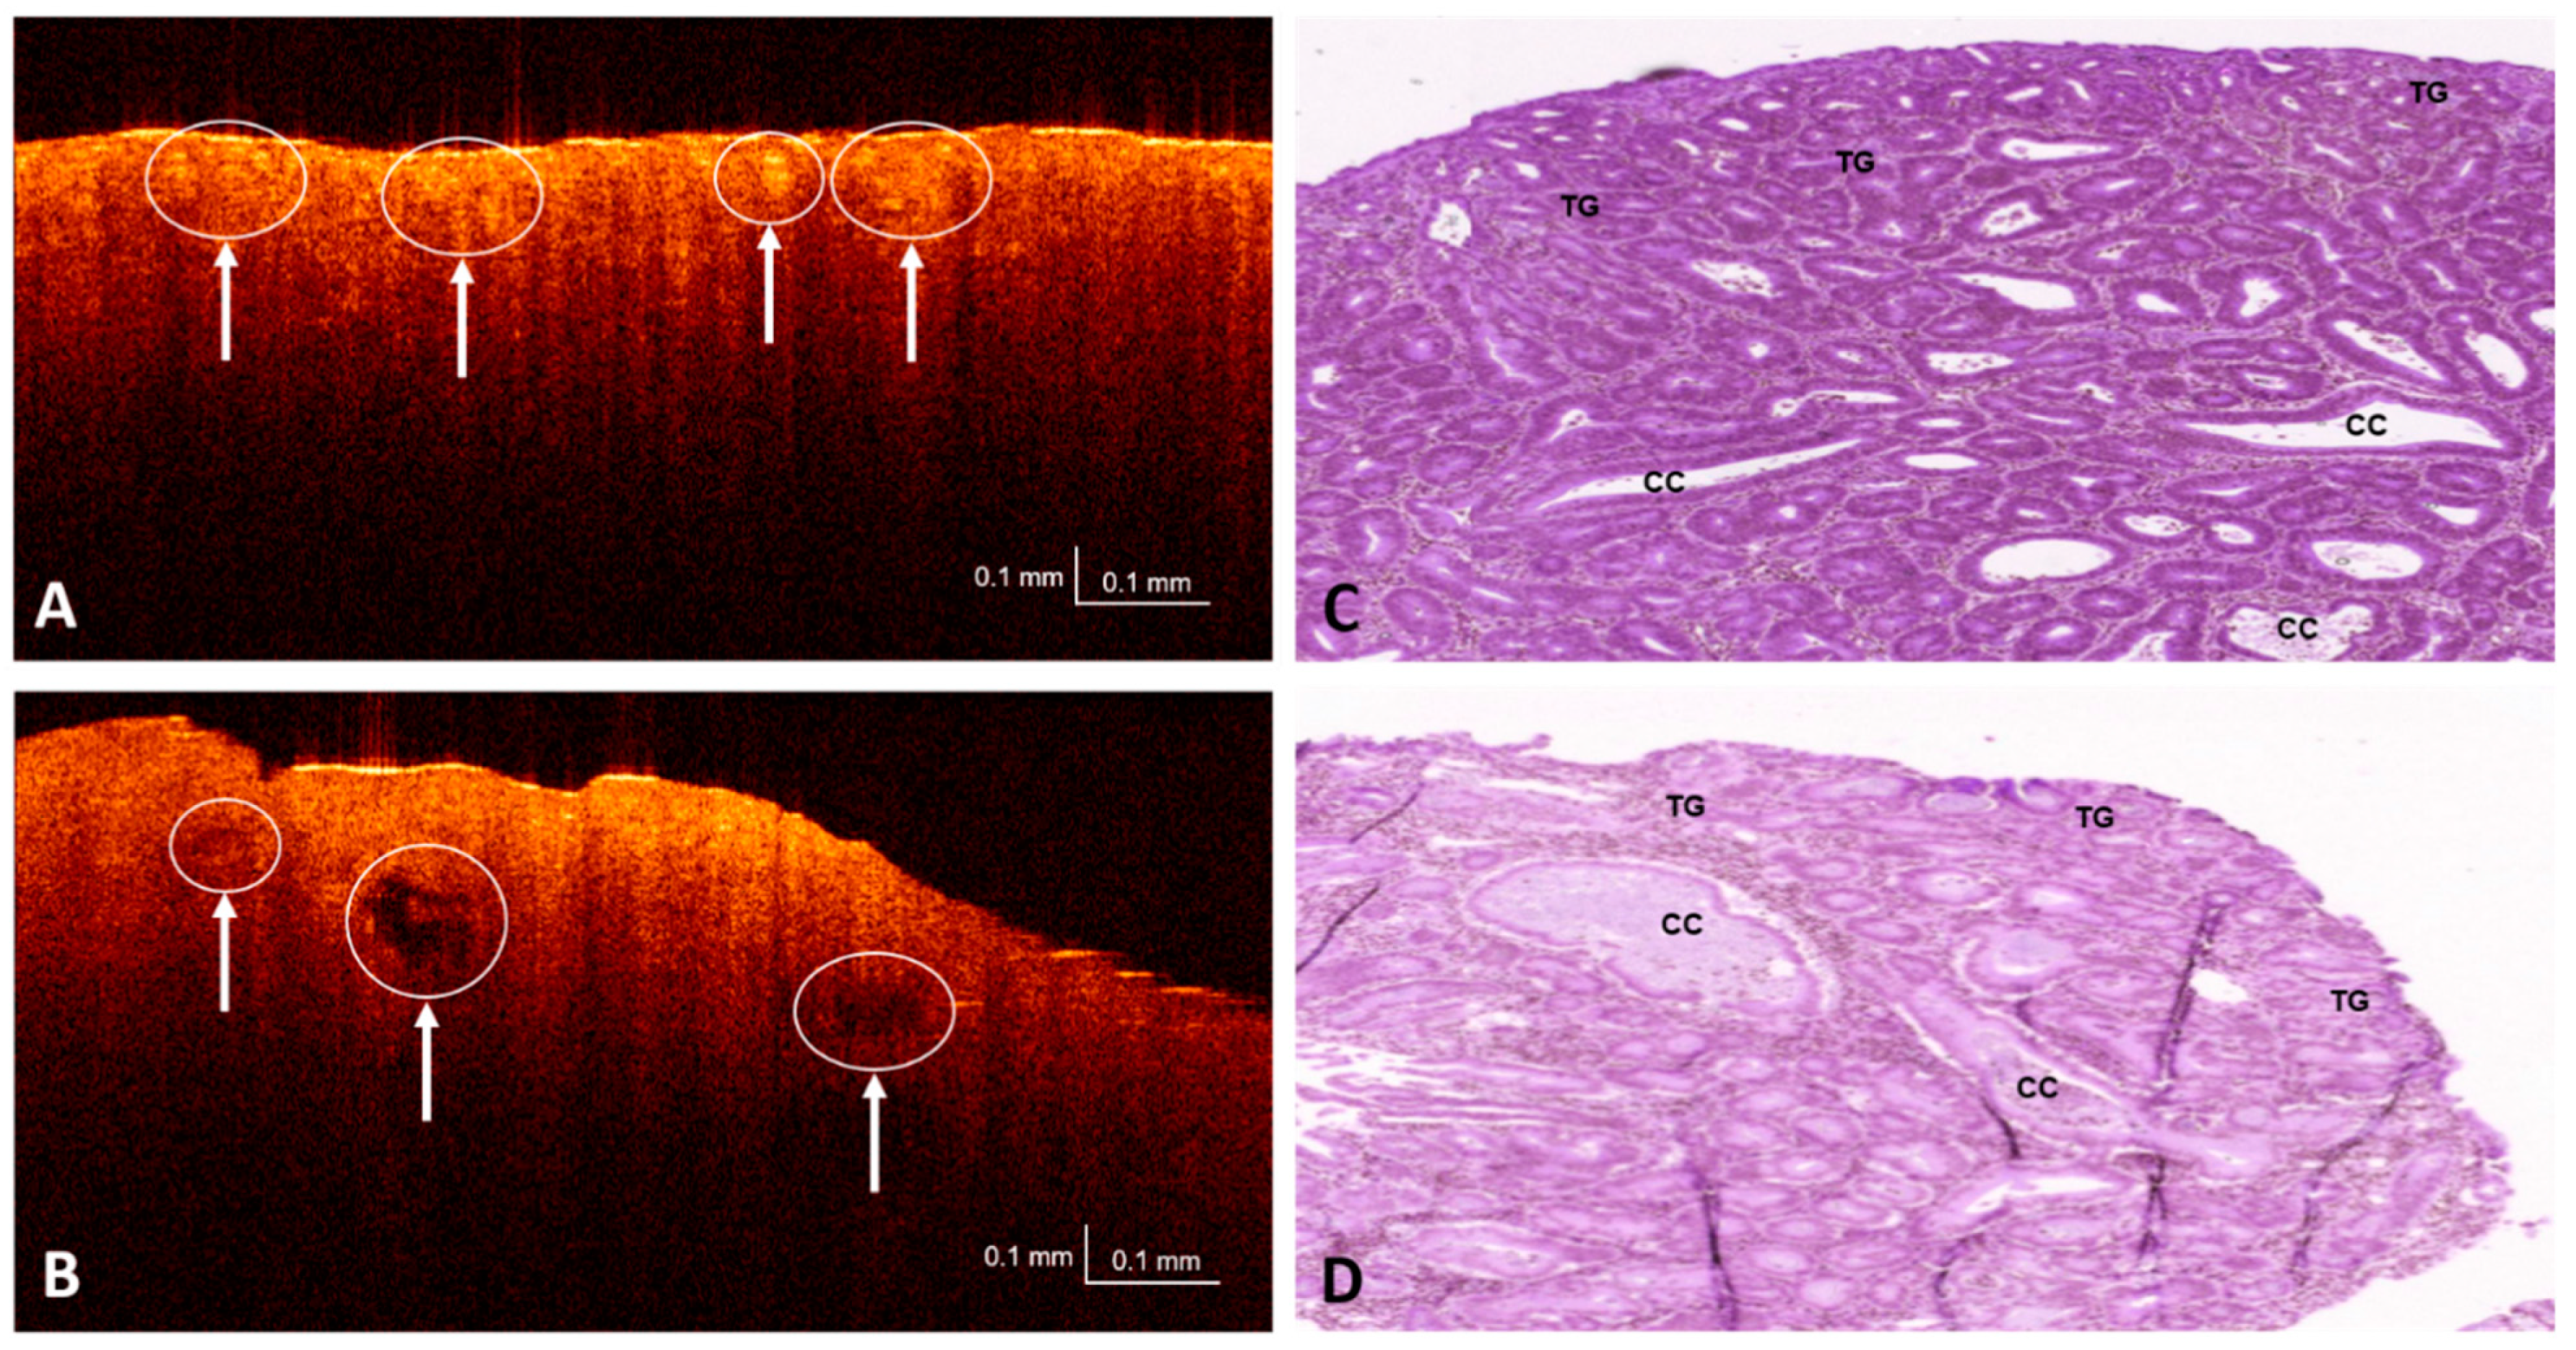
3.1. OCT and H&E Histology Comparative Analysis

Before performing the analysis, it was important to consider that some anatomical differences exist between human colon and murine colon structure. According to [61], in human and rats species, the colon maintains the same mural structure as the rest of the gastrointestinal tract: mucosa, submucosa, and inner circular and outer longitudinal tunica muscularis and serosa. The mucosa and submucosa layers in mice are relative thin in comparison with the human ones. Furthermore, human mucosa has transverse folds through the entire colon, whereas in mice it varies for each part of the colon. At the cecum and proximal colon, mouse mucosa has transverse folds, in the mid colon is flat, and in the distal colon has longitudinal folds. However, in both species the mucosa is composed of tubular glands. Taking this into account and considering that the database used in this work consists of murine (rat) samples, it was expected that the model also learn these anatomical differences present in the mucosa, especially for the healthy samples. A detailed comparison of the anatomical differences (extracted from reference [61]) is provided in Table A1.
According to previous studies analyzing features on OCT images [18,19,20,21], in normal tissue, well-defined layers can be visualized with uniform intensity. In the presence of hyperplasia, thickening of the mucosa layer occurs, but the intensity is similar to healthy tissue and tissue layers are still visible. However, in the case of adenomatous polyps, both thickening of the mucosa and reduced intensity must be observed. Finally, adenocarcinomatous lesions should show blurred boundaries and non-uniform intensity. In the presence of large polyps, the disappearance of the boundaries should be clearly observed, independently from the lesion nature.
Visual inspection of dataset images was performed to look for the features previously mentioned. Figure 4 and Figure 5 provide a detailed analysis of the visible features on the OCT images (of Figure 1 samples) with respect to the histopathological hematoxylin-eosin (H&E) images annotated by a pathologist (scanned at 5x). Regions of interest (with the same FOV of OCT images in mm) were extracted from H&E slides images and later rescaled to fit axial and lateral resolution of the OCT images for better comparison. In these figures, it can be observed that the main features present in H&E images can also be observed in the OCT images. On the one hand, Figure 4, representing healthy tissue, illustrates (as indicated by arrows and manual segmentation lines on the B-scans on the left, Figure 4A,B) that the mucosa layers can be very clearly observed, confirming what has been reported before in previous studies. Muscularis mucosae and sub-mucosa layers are also observed, although clear differentiation in all parts of the image is tougher. On the other side, when analyzing Figure 5 containing neoplastic lesions, it is also possible to confirm that the boundaries of the layers have totally disappeared, making it impossible to find any difference among them. Differences in the noise pattern are also observed. In addition, as indicated using circles and arrows on the B-scans (Figure 5A,B), new underlying structures appeared in the mucosa and can be identified as bright spots or dark areas in the images. These new structures (in comparison with healthy tissue) are also clearly observed in the corresponding annotated histopathology images (Figure 5C,D), where cystic crypts (CC) have been identified by the pathologist and appear as dark spots in the B-scan and tumoral glands (TG) clusters as bright spots.

3.2. Dataset Partitioning and Testing

The dataset was split such that 80% was dedicated to training, 10% to validation, and 10% to testing. It was assured that images coming from the same lesion (both B-scans and C-scans) were included in only one of the sets. The animal models employed on the creation of the database were genetically modified replicas of one specimen, hence no separation per specimen was necessary in splitting and lesions could be considered independently.
The model was tested on 6 different folds to ensure that the evaluation metrics proportionated were not biased by one random dataset split. A random state seed parameter was established for each fold to obtain different training, validation, and testing sets each time.

3.3. Performance Metrics and Evaluation

Given that both B-scan and C-scan data were available for the murine (rat) samples acquired in the database, the clinical discrimination capability of the model on the differentiation of benign versus malignant polyps was calculated for both types of data. To evaluate each C-scan, the mean of the individual predictions for the B-scan images that form the volume was calculated. The performance of the model was measured using the conditions provided by the confusion matrix (see Table 1).
In the clinical context being analyzed in this work, these conditions can be seen as:
  • True positive (TP): Malignant lesion correctly identified as malignant.
  • False positive (FP): Benign lesion incorrectly identified as malignant.
  • True negative (TN): Benign lesion correctly identified as benign.
  • False negative (FN): Malignant lesion incorrectly identified as benign.
The metrics that were employed to measure the model performance based on the previous conditions are described below.
  • Sensitivity. Also known as the true positive rate (TPR). Number of true/all positive assessments. TPR = TP/(TP + FN) = number of malign lesions with positive test/total number of malign lesions.
  • Specificity. Also known as the true negative rate (TNR). Number of true/all negative assessments. TNR = TN/(FP + TN) = number of benign lesions with negative test/total number of benign lesions.
  • Positive predictive value (PPV). In case of a malignant prediction, probability that the lesion is actually malignant. PPV = TP/(TP + FP) = Number of true positives/number of positive calls.
  • Negative predictive value (NPV). In case of a benign prediction, probability that the lesion is actually benign. NPV = TN/(TN + FN) = Number of true negatives/number of negative calls.
The desired value for these metrics was as close as possible to 1, 1 meaning a perfect test.
Additionally, as the accuracy (measure of the number of samples that were correctly classified in the expected class) is a misleading metric in imbalanced datasets, the balanced accuracy was calculated. This metric normalizes true positive and true negative predictions by the number of positive and negative samples, and then divides the sum by two, providing an accuracy value where the class frequencies are the same.
  • Balanced accuracy (BAC). Measures the number of samples that were correctly classified in the expected class considering class frequencies. Number of correct/all assessments considering class frequencies. BAC = (TPR + TNR)/2 = (Sensitivity + Specificity)/2.
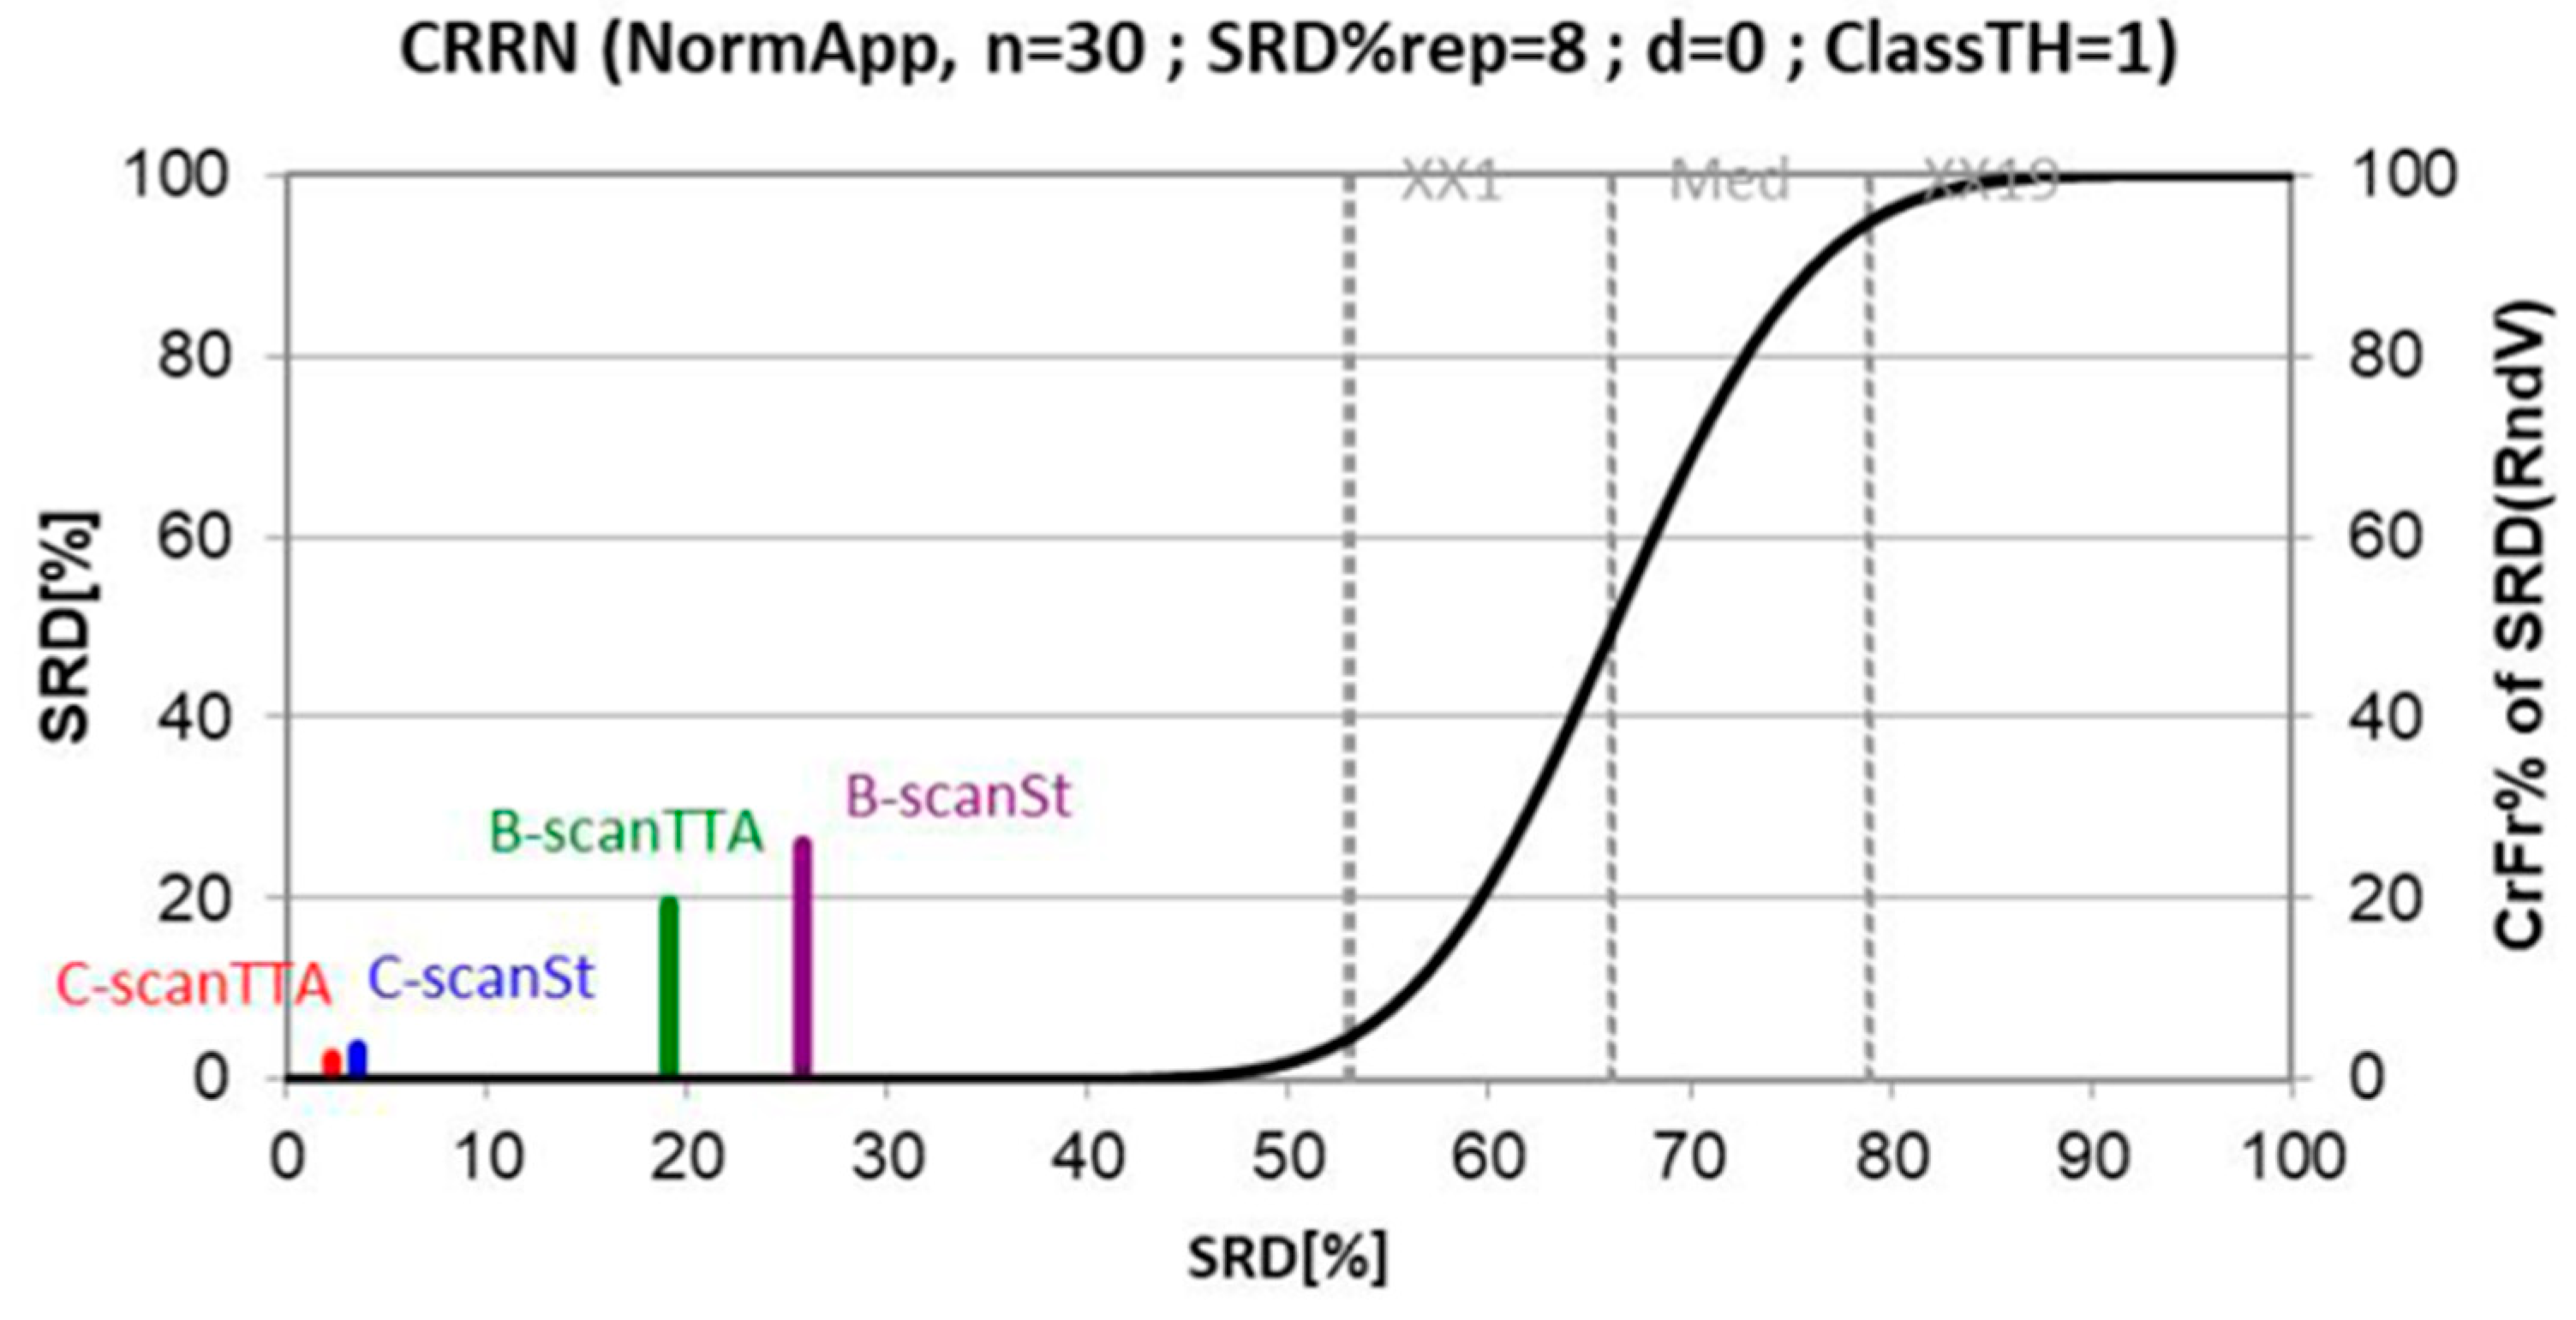
3.4. Thresholds

Considering the prediction values provided by the model, the threshold that maximizes the BAC (in the range 0–1) was calculated over the validation subset of each fold split both for the B-scan and C-scan data. Then, this threshold was applied over the test subset of each fold split to calculate the metrics of the model (BAC, sensitivity, specificity, PPV, and NPV).

3.5. Classification Results

The evaluation of the model was performed on 6 folds, over different training, validation, and testing splits of the dataset each time, with the aim of obtaining a model ensemble. As a result, the mean and standard deviation (std) were calculated for each of the selected metrics. Table 2 provides a summary of the results, where the first number reports the mean and the second the std (mean ± std). In this summary, the results obtained with B-scan and C-scan images, standard, and TTA test split evaluation are included for comparison. The complete list of results of each fold is included in Table A2. at the end of the document. Additionally, a graph illustrating a fair comparison of the folds results following the sum of ranking differences (SRDs) method [62] is provided in Figure A1. After calculating the SRD coefficients for each of the options on the different folds, a graph comparing the performance of the different options can be generated. The smaller the SRD value, the closer to the reference value, meaning better performance.

4. Discussion and Conclusions

On analyzing the results, in general terms and considering the mean results reported in Table 2, when using the standard evaluation technique, the prediction over C-scan volumes was slightly better than the prediction over individual B-scan images. This impression is confirmed by the SRD analysis (Figure A1), where smaller values were obtained for C-scan images analysis. This result makes sense, since when evaluating the lesion volumetrically (C-scan) considering the mean prediction of all the B-scan images contained in the C-scan, there was less probability of a bad prediction. If the volume contains some individual B-scans with poor information representing the class sample, the (expected) bad predictions do not have great influence on the final diagnosis. In any case, the small differences on the prediction metrics suggest the high quality of the database used in this study, as shown in the detailed results for each fold provided in Table A2.
It can also be observed that the TTA evaluation technique slightly benefitted the prediction over individual B-scan images in terms of sensitivity and specificity, but not the C-scan volume prediction. However, these results make sense for two reasons: the data preparation strategy and the volumetric evaluation of the lesion. On the one hand, due to the nature of the images, no geometrical transformations were applied for data augmentation, as described in the data preparation section, but ROIs at different location of the image were extracted. Depending on the location of the extracted ROIs, the clinical features can be more or less representative of the lesion, affecting the corresponding prediction. When TTA was applied, different ROIs from the B-scan were extracted, allowing analysis of the overall sample in width, and hence a better prediction was obtained. This is particularly beneficial in the case of large wide B-scan images, as it allows analyzing the different parts of the tissue/lesion in detail. Considering this, and although no improvement was observed on the C-scan evaluation, the TTA strategy was preferred during the evaluation, since in this way, the intrinsic clinical variability of the lesions was captured and hence the model prediction was more robust.
Interpretation of new imaging techniques, such as OCT, can be complicated at the beginning and prevent their adoption in clinical practice. However, advanced image processing techniques, such as deep learning, can be used to facilitate automatic image analysis or diagnosis and the development of optical biopsy. A previous work [46] proposed using a pattern recognition network that requires prior manual annotation of the dataset and diagnosis depends on whether the expected pattern is found on the image. Alternatively, this work proposes using a classification strategy, which can help in the identification of subtle clinical characteristics on the images and is not biased by dataset annotations. This work investigates the application of an Xception deep learning model for the automatic classification of colon polyps from murine (rat) samples acquired with OCT imaging. The developed database is accessible upon request and is part of a bigger database in the process of being published. A strategy for processing B-scan images and extracting regions of interest was proposed as a data augmentation strategy. Test time augmentation strategy implemented with the aim of improving model prediction was evaluated. In addition, this work also aims to compare the differences in the diagnosis capacity of the proposed method when evaluated using B-scan images and C-scan volumes, and for this purpose different clinical metrics were compared. The trained model was evaluated 6 times using different training, validation, and testing sets to provide an unbiased diagnosis of the results. In this sense, we got a model with mean 0.9695 (±0.0141) sensitivity and mean 0.8094 (±0.1524) specificity when diagnosis was performed over individual B-scans, and mean 0.9821 (±0.0197) sensitivity and mean 0.7865 (±0.205) specificity when diagnosis was performed in the whole C-scan volume.
Considering the future application of a deep learning method to assist clinical diagnosis with OCT, and in view of the results of this work, successful diagnosis can be achieved both on B-scan images and C-scan volumes. The evaluation of the lesion over a C-scan volume was preferred over the evaluation of an individual B-scan image, so the prediction could be more robust. However, this will not be possible most of the time in the daily clinical routine, for example during patient colonoscopy examination, where in vivo real-time information is necessary for diagnosis and in-situ treatment decision. In this sense, clinical procedures based on the accumulative predictions of various B-scan images could be defined to facilitate clinicians’ decision-making during examination. The promising results with the proposed approach suggest that the implemented deep learning based method can identify the clinical features reported in previous clinical studies on the OCT images, and more importantly, that the amount of data and features present on the images database are enough to allow automatic classification. These results are part of ongoing work that will be further extended; however, it has been demonstrated that deep learning-based strategies seem to be the path to achieve the “optical biopsy” paradigm. Raw interpretation of new imaging modalities is difficult for clinicians but assisted by an image analysis method, the interpretation can be eased and the reliable diagnosis suggestion can facilitate the adoption of the technology. Consequently, the CADx market can benefit from this progress in the short term as the latest market forecast studies suggest.
This work will be further extended and tested with a larger and more balanced version of the murine dataset collected. More sophisticated models accepting larger image size will be tested to check whether classification is improved. Optical properties of the different lesions will be studied in detail with the aim of finding scattering patterns for each type of lesion. OCT volumetric (C-scan) information will be also studied in further detail to make the most of it analyzing both the cross sectional and en-face views.

Author Contributions

Conceptualization, C.L.S., J.B., and J.F.O.-M.; methodology, C.L.S., A.P., and E.T.; software, C.L.S.; validation, C.L.S., J.B., N.A.d.R., and N.A.; formal analysis, C.L.S., A.P., and E.T.; investigation, C.L.S.; resources, J.B., J.F.O.-M., E.G., O.M.C., N.A.d.R., and N.A.; data curation, C.L.S., J.B., J.F.O.-M., N.A.d.R., and N.A.; writing—original draft preparation, C.L.S., J.B., and J.F.O.-M.; writing—review and editing, C.L.S., J.B., J.F.O.-M., A.P., E.T., E.G., and O.M.C.; visualization, C.L.S.; supervision, E.G. and O.M.C.; project administration, C.L.S., A.P., and E.G.; funding acquisition, C.L.S. and A.P. All authors have read and agreed to the published version of the manuscript.

Funding

This work was partially supported by PICCOLO project. This project has received funding from the European Union’s Horizon2020 Research and Innovation Programme under grant agreement No. 732111. The sole responsibility of this publication lies with the authors. The European Union is not responsible for any use that may be made of the information contained therein. This research has also received funding from the Basque Government’s Industry Department under the ELKARTEK program’s project ONKOTOOLS under agreement KK-2020/00069 and the industrial doctorate program UC- DI14 of the University of Cantabria.

Institutional Review Board Statement

Ethical approvals for murine (rat) samples acquisition were obtained from the relevant Ethics Committees. In case of research with animals, it was approved by the Ethical Committee of animal experimentation of the Jesús Usón Minimally Invasive Surgery Centre (Number: ES 100370001499) and was in accordance with the welfare standards of the regional government which are based on European regulations.

Informed Consent Statement

Not applicable.

Data Availability Statement

The dataset used in this study is available upon request. This dataset is part of a more extensive dataset that is under collection and will be made publicly available in the future.

Acknowledgments

The authors would also like to thank Ainara Egia Bizkarralegorra from Basurto University hospital (Spain) for the processing of the samples.

Conflicts of Interest

The authors declare no conflict of interest. The funders had no role in the design of the study; in the collection, analyses, or interpretation of data; in the writing of the manuscript, or in the decision to publish the results.

Appendix A

Table A1. Comparison of anatomical differences of human and murine colon (adapted from reference [61]).
FeatureHumanRats
Anatomy of the large intestine compared macroscopically
Cecum to rectum~100–150 cm~25 cm
Taenia coli and haustraPresentNone; smooth serosa; may have fecal pellets
AppendixPresent, vermiform, ~9 cmAbsent
Functional cecumAbsentPresent; fermentation, vitamins K and B
Proximal/ascending/rightColon from ileocecal valve to the hepatic flexureTransverse folds in the mucosa, from cecum to mid colon; Rat: folds are visible through serosa
Mid/transverseConnects the hepatic to the splenic
flexure
Very short; lumen narrows; no mucosal folds
Distal/descending/leftSplenic flexure to left lower quadrant;
S-shaped sigmoid colon extends from
descending colon to rectosigmoid
junction; sigmoid colon may be
redundant
Fecal pellets may be seen
Rectum12–15 cm curved; proximal two-thirds
of rectum has a mesothelial covering
within the peritoneal cavity, whereas the distal third of rectum is extraperitoneal, lying within the deep pelvis, surrounded by adventitia, fascia, and fat
Indistinct from distal colon; Rat: ~50–80 mm, prolapse is rare
Large intestine anatomy compared at histological level
MucosaTransverse folds at all regionsMucosal folds vary by region. Cecum and proximal colon: transverse; mid colon: flat with no folds; distal colon and rectum: longitudinal
Absorptive colonocytesSimilar to rodentPresent
Mucous/goblet cellsSimilar to rodentPresent
Enteroendocrine cellsSimilar to rodentPresent
Paneth cellsCecum and appendixAbsent
Microfold (M) cellsSimilar to rodentPresent
Lamina propriaSimilar to rodentLymphocytes, plasma cells, macrophages,
eosinophils, mast cells
Muscularis mucosaeVariable thickness; traversed by lymphoid follicles; poorly developed in appendixThin
SubmucosaContains adipose tissue, arterioles,
venules, lymphatics, and Meissner’s
plexus
Rodents thinner than humans
Muscular tunicsAuerbach’s plexus between the two
muscle bands
Muscular tunics thicken distally
Proximal colonTransverse foldsTransverse mucosal folds
Transverse colonTransverse foldsFlat mucosa
Distal colonTransverse foldsLongitudinal mucosal folds
RectumTransverse foldsIndistinguishable from distal colon

Appendix B

Table A2. Detail of the results of each fold for the different imaging modalities (B-scan vs. C-scans).
FoldData TypeEvaluationBACSensitivitySpecificityPPVNPV
1B-scanStandard0.89670.94720.84620.92070.8948
TTA0.90240.95530.84940.92290.9098
C-scanStandard0.87360.96150.78570.89290.9167
TTA0.87360.96150.78570.89290.9167
2B-scanStandard0.90000.95830.84170.93620.8928
TTA0.90600.96160.85050.93980.9012
C-scanStandard0.89880.96430.83330.93100.9091
TTA0.89880.96430.83330.93100.9091
3B-scanStandard0.75680.95490.55880.84550.8305
TTA0.75900.95850.55940.84610.8421
C-scanStandard0.69170.96670.41670.80560.8333
TTA0.73330.96670.50000.82860.8571
4B-scanStandard0.83110.96570.69660.90370.8732
TTA0.83980.97900.70070.90480.9189
C-scanStandard0.85001.00000.70000.90321.0000
TTA0.80001.00000.60000.87501.0000
5B-scanStandard0.94370.96420.92330.97330.8988
TTA0.95870.97050.94680.98150.9172
C-scanStandard1.00001.00001.00001.00001.0000
TTA1.00001.00001.00001.00001.0000
6B-scanStandard0.95530.99050.92010.98120.9584
TTA0.97090.99220.94950.98810.9666
C-scanStandard1.00001.00001.00001.00001.0000
TTA1.00001.00001.00001.00001.0000
Figure A1. Fair comparison of folds results with sum of ranking differences (SRDs) method.
Applsci 11 03119 g0a1

References

  1. Office World Health Organization Europe. Colorectal Cancer. Available online: https://www.euro.who.int/en/health-topics/noncommunicable-diseases/cancer/news/news/2012/2/early-detection-of-common-cancers/colorectal-cancer (accessed on 15 December 2020).
  2. World Cancer Research Fund International. Colorectal Cancer Statistics. Available online: https://www.wcrf.org/dietandcancer/cancer-trends/colorectal-cancer-statistics, (accessed on 15 December 2020).
  3. Society, A.C. Can Colorectal Polyps and Cancer Be Found Early? Available online: https://www.cancer.org/cancer/colon-rectal-cancer/detection-diagnosis-staging/detection.html (accessed on 15 December 2020).
  4. Axon, A.; Diebold, M.D.; Fujino, M.; Fujita, R.; Genta, R.M.; Gonvers, J.J.; Guelrud, M.; Inoue, H.; Jung, M.; Kashida, H.; et al. Update on the Paris classification of superficial neoplastic lesions in the digestive tract. Endoscopy 2005, 37, 570–578. [Google Scholar]
  5. Hewett, D.G.; Kaltenbach, T.; Sano, Y.; Tanaka, S.; Saunders, B.P.; Ponchon, T.; Soetikno, R.; Rex, D.K. Validation of a simple classification system for endoscopic diagnosis of small colorectal polyps using narrow-band imaging. Gastroenterology 2012, 143, 599–607. [Google Scholar] [CrossRef]
  6. Kavic, S.M.; Basson, M.D. Complications of endoscopy. Am. J. Surg. 2001, 181, 319–332. [Google Scholar] [CrossRef]
  7. Reumkens, A.; Rondagh, E.J.A.; Bakker, C.M.; Winkens, B.; Masclee, A.A.M.; Sanduleanu, S. Post-colonoscopy complications: A systematic review, time trends, and meta-analysis of population-based studies. Am. J. Gastroenterol. 2016, 111, 1092–1101. [Google Scholar] [CrossRef] [PubMed]
  8. Kandel, P.; Wallace, M.B. Should we resect and discard low risk diminutive colon polyps. Clin. Endosc. 2019, 52, 239–246. [Google Scholar] [CrossRef] [PubMed] [Green Version]
  9. Glover, B.; Teare, J.; Patel, N. The Status of Advanced Imaging Techniques for Optical Biopsy of Colonic Polyps. Clin. Transl. Gastroenterol. 2020, 11, e00130. [Google Scholar] [CrossRef] [PubMed]
  10. Levine, A.; Markowitz, O. Introduction to reflectance confocal microscopy and its use in clinical practice. JAAD Case Rep. 2018, 4, 1014–1023. [Google Scholar] [CrossRef] [PubMed] [Green Version]
  11. Zhao, Y.; Iftimia, N.V. Overview of supercontinuum sources for multiphoton microscopy and optical biopsy. In Neurophotonics and Biomedical Spectroscopy; Elsevier: Amsterdam, The Netherlands, 2018; pp. 329–351. [Google Scholar]
  12. Drexler, W.; Fujimoto, J.G. Optical Coherence Tomography-Technology and Applications; Springer: Berlin/Heidelberg, Germany, 2008. [Google Scholar]
  13. Mason, S.E.; Poynter, L.; Takats, Z.; Darzi, A.; Kinross, J.M. Optical Technologies for Endoscopic Real-Time Histologic Assessment of Colorectal Polyps: A Meta-Analysis. Am. J. Gastroenterol. 2019, 114, 1219–1230. [Google Scholar] [CrossRef] [Green Version]
  14. Taunk, P.; Atkinson, C.D.; Lichtenstein, D.; Rodriguez-Diaz, E.; Singh, S.K. Computer-assisted assessment of colonic polyp histopathology using probe-based confocal laser endomicroscopy. Int. J. Colorectal Dis. 2019, 34, 2043–2051. [Google Scholar] [CrossRef]
  15. Ussui, V.M.; Wallace, M.B. Confocal endomicroscopy of colorectal polyps. Gastroenterol. Res. Pract. 2012, 2012, 545679. [Google Scholar] [CrossRef] [Green Version]
  16. Cicchi, R.; Sturiale, A.; Nesi, G.; Kapsokalyvas, D.; Alemanno, G.; Tonelli, F.; Pavone, F.S. Multiphoton morpho-functional imaging of healthy colon mucosa, adenomatous polyp and adenocarcinoma. Biomed. Opt. Express 2013, 4, 1204–1213. [Google Scholar] [CrossRef] [Green Version]
  17. He, K.; Zhao, L.; Chen, Y.; Huang, X.; Ding, Y.; Hua, H.; Liu, L.; Wang, X.; Wang, M.; Zhang, Y.; et al. Label-free multiphoton microscopic imaging as a novel real-time approach for discriminating colorectal lesions: A preliminary study. J. Gastroenterol. Hepatol. 2019, 34, 2144–2151. [Google Scholar] [CrossRef] [PubMed]
  18. Pfau, P.R.; Sivak, M.V.; Chak, A.; Kinnard, M.; Wong, R.C.K.; Isenberg, G.A.; Izatt, J.A.; Rollins, A.; Westphal, V. Criteria for the diagnosis of dysplasia by endoscopic optical coherence tomography. Gastrointest. Endosc. 2003, 58, 196–202. [Google Scholar] [CrossRef] [PubMed]
  19. Zagaynova, E.; Gladkova, N.; Shakhova, N.; Gelikonov, G.; Gelikonov, V. Endoscopic OCT with forward-looking probe: Clinical studies in urology and gastroenterology | Natalia Shakhova-Academia.edu. J. Biophotonics 2008, 1, 114–128. [Google Scholar] [CrossRef]
  20. Iftimia, N.; Iyer, A.K.; Hammer, D.X.; Lue, N.; Mujat, M.; Pitman, M.; Ferguson, R.D.; Amiji, M. Fluorescence-guided optical coherence tomography imaging for colon cancer screening: A preliminary mouse study. Biomed. Opt. Express 2012, 3, 178–191. [Google Scholar] [CrossRef] [Green Version]
  21. Ding, Q.; Deng, Y.; Yu, X.; Yuan, J.; Zeng, Z.; Mu, G.; Wan, X.; Zhang, J.; Zhou, W.; Huang, L.; et al. Rapid, high-resolution, label-free, and 3-dimensional imaging to differentiate colorectal adenomas and non-neoplastic polyps with micro-optical coherence tomography. Clin. Transl. Gastroenterol. 2019, 10, e00049. [Google Scholar] [CrossRef]
  22. Kudo, S.E.; Tamura, S.; Nakajima, T.; Yamano, H.O.; Kusaka, H.; Watanabe, H. Diagnosis of colorectal tumorous lesions by magnifying endoscopy. Gastrointest. Endosc. 1996, 44, 8–14. [Google Scholar] [CrossRef]
  23. Adler, D.C.; Zhou, C.; Tsai, T.-H.; Schmitt, J.; Huang, Q.; Mashimo, H.; Fujimoto, J.G. Three-dimensional endomicroscopy of the human colon using optical coherence tomography. Opt. Express 2009, 17, 784–796. [Google Scholar] [CrossRef] [PubMed]
  24. Ahsen, O.O.; Lee, H.C.; Liang, K.; Wang, Z.; Figueiredo, M.; Huang, Q.; Potsaid, B.; Jayaraman, V.; Fujimoto, J.G.; Mashimo, H. Ultrahigh-speed endoscopic optical coherence tomography and angiography enables delineation of lateral margins of endoscopic mucosal resection: A case report. Therap. Adv. Gastroenterol. 2017, 10, 931–936. [Google Scholar] [CrossRef] [PubMed] [Green Version]
  25. Liang, K.; Ahsen, O.O.; Wang, Z.; Lee, H.-C.; Liang, W.; Potsaid, B.M.; Tsai, T.-H.; Giacomelli, M.G.; Jayaraman, V.; Mashimo, H.; et al. Endoscopic forward-viewing optical coherence tomography and angiography with MHz swept source. Opt. Lett. 2017, 42, 3193–3196. [Google Scholar] [CrossRef]
  26. Zeng, Y.; Rao, B.; Chapman, W.C.; Nandy, S.; Rais, R.; González, I.; Chatterjee, D.; Mutch, M.; Zhu, Q. The Angular Spectrum of the Scattering Coefficient Map Reveals Subsurface Colorectal Cancer. Sci. Rep. 2019, 9, 1–11. [Google Scholar] [CrossRef] [Green Version]
  27. Picón Ruiz, A.; Alvarez Gila, A.; Irusta, U.; Echazarra Huguet, J. Why deep learning performs better than classical machine learning engenering. Dyn. Ing. Ind. 2020, 95, 119–122. [Google Scholar]
  28. Krizhevsky, A.; Sutskever, I.; Hinton, G.E. ImageNet Classification with Deep Convolutional Neural Networks. In Advances in Neural Information Processing Systems 25; Pereira, F., Burges, C.J.C., Bottou, L., Weinberger, K.Q., Eds.; Curran Associates, Inc.: Red Hook, NY, USA, 2012; pp. 1097–1105. [Google Scholar]
  29. LeCun, Y.; Haffner, P.; Bottou, L.; Bengio, Y. Object recognition with gradient-based learning. In Lecture Notes in Computer Science (Including Subseries Lecture Notes in Artificial Intelligence and Lecture Notes in Bioinformatics); Springer: Berlin/Heidelberg, Germany, 1999; Volume 1681, pp. 319–345. [Google Scholar]
  30. Goodfellow, I.; Bengio, Y.; Courville, A. Deep Learning; The MIT Press: Cambridge, MA, USA, 2016. [Google Scholar]
  31. LeCun, Y.A.; Bengio, Y.; Hinton, G.E. Deep learning. Nature 2015, 521, 436–444. [Google Scholar] [CrossRef] [PubMed]
  32. Litjens, G.; Kooi, T.; Bejnordi, B.E.; Setio, A.A.A.; Ciompi, F.; Ghafoorian, M.; van der Laak, J.A.W.M.; van Ginneken, B.; Sánchez, C.I. A Survey on Deep Learning in Medical Image Analysis. Med. Image Anal. 2017, 42, 60–88. [Google Scholar] [CrossRef] [Green Version]
  33. Esteva, A.; Kuprel, B.; Novoa, R.A.; Ko, J.; Swetter, S.M.; Blau, H.M.; Thrun, S. Dermatologist-level classification of skin cancer with deep neural networks. Nature 2017, 542, 115–118. [Google Scholar] [CrossRef] [PubMed]
  34. Liu, X.; Faes, L.; Kale, A.U.; Wagner, S.K.; Fu, D.J.; Bruynseels, A.; Mahendiran, T.; Moraes, G.; Shamdas, M.; Kern, C.; et al. A comparison of deep learning performance against health-care professionals in detecting diseases from medical imaging: A systematic review and meta-analysis. Lancet Digit. Health 2019, 1, 271–297. [Google Scholar] [CrossRef]
  35. Wei, J.W.; Suriawinata, A.A.; Vaickus, L.J.; Ren, B.; Liu, X.; Lisovsky, M.; Tomita, N.; Abdollahi, B.; Kim, A.S.; Snover, D.C.; et al. Evaluation of a Deep Neural Network for Automated Classification of Colorectal Polyps on Histopathologic Slides. JAMA Netw. Open 2020, 3, e203398. [Google Scholar] [CrossRef] [Green Version]
  36. Medela, A.; Picon, A. Constellation loss: Improving the efficiency of deep metric learning loss functions for the optimal embedding of histopathological images. J. Pathol. Inform. 2020, 11, 38. [Google Scholar]
  37. Terradillos, E.; Saratxaga, C.L.; Mattana, S.; Cicchi, R.; Pavone, F.S.; Andraka, N.; Glover, B.J.; Arbide, N.; Velasco, J.; Echezarraga, M.C.; et al. Analysis on the characterization of multiphoton microscopy images for malignant neoplastic colon lesion detection under deep learning methods. in press.
  38. Sánchez-Peralta, L.F.; Picón, A.; Sánchez-Margallo, F.M.; Pagador, J.B. Unravelling the effect of data augmentation transformations in polyp segmentation. Int. J. Comput. Assist. Radiol. Surg. 2020, 15, 1975–1988. [Google Scholar] [CrossRef]
  39. Sánchez-Peralta, L.F.; Pagador, J.B.; Picón, A.; Calderón, Á.J.; Polo, F.; Andraka, N.; Bilbao, R.; Glover, B.; Saratxaga, C.L.; Sánchez-Margallo, F.M. PICCOLO White-Light and Narrow-Band Imaging Colonoscopic Dataset: A Performance Comparative of Models and Datasets. Appl. Sci. 2020, 10, 8501. [Google Scholar] [CrossRef]
  40. Sánchez-Peralta, L.F.; Bote-Curiel, L.; Picón, A.; Sánchez-Margallo, F.M.; Pagador, J.B. Deep learning to find colorectal polyps in colonoscopy: A systematic literature review. Artif. Intell. Med. 2020, 108, 101923. [Google Scholar] [CrossRef] [PubMed]
  41. Picon, A.; Medela, A.; Sanchez-Peralta, L.F.; Cicchi, R.; Bilbao, R.; Alfieri, D.; Elola, A.; Glover, B.; Saratxaga, C.L. Autofluorescence image reconstruction and virtual staining for in-vivo optical biopsying. IEEE Access 2021, 9, 32081–32093. [Google Scholar] [CrossRef]
  42. Yanagihara, R.T.; Lee, C.S.; Ting, D.S.W.; Lee, A.Y. Methodological challenges of deep learning in optical coherence tomography for retinal diseases: A review. Transl. Vis. Sci. Technol. 2020, 9, 11. [Google Scholar] [CrossRef] [PubMed] [Green Version]
  43. Lu, W.; Tong, Y.; Yu, Y.; Xing, Y.; Chen, C.; Shen, Y. Deep learning-based automated classification of multi-categorical abnormalities from optical coherence tomography images. Transl. Vis. Sci. Technol. 2018, 7, 41. [Google Scholar] [CrossRef] [Green Version]
  44. Jiang, Z.; Huang, Z.; Qiu, B.; Meng, X.; You, Y.; Liu, X.; Liu, G.; Zhou, C.; Yang, K.; Maier, A.; et al. Comparative study of deep learning models for optical coherence tomography angiography. Biomed. Opt. Express 2020, 11, 1580–1597. [Google Scholar] [CrossRef]
  45. Singla, N.; Dubey, K.; Srivastava, V. Automated assessment of breast cancer margin in optical coherence tomography images via pretrained convolutional neural network. J. Biophotonics 2019, 12, e201800255. [Google Scholar] [CrossRef] [PubMed]
  46. Zeng, Y.; Xu, S.; Chapman, W.C.; Li, S.; Alipour, Z.; Abdelal, H.; Chatterjee, D.; Mutch, M.; Zhu, Q. Real-time colorectal cancer diagnosis using PR-OCT with deep learning. Theranostics 2020, 10, 2587–2596. [Google Scholar] [CrossRef] [PubMed]
  47. Lin, T.Y.; Goyal, P.; Girshick, R.; He, K.; Dollar, P. Focal Loss for Dense Object Detection. IEEE Trans. Pattern Anal. Mach. Intell. 2020, 42, 318–327. [Google Scholar] [CrossRef] [Green Version]
  48. Amos-Landgraf, J.M.; Kwong, L.N.; Kendziorski, C.M.; Reichelderfer, M.; Torrealba, J.; Weichert, J.; Haag, J.D.; Chen, K.S.; Waller, J.L.; Gould, M.N.; et al. A target-selected Apc-mutant rat kindred enhances the modeling of familial human colon cancer. Proc. Natl. Acad. Sci. USA 2007, 104, 4036–4041. [Google Scholar] [CrossRef] [Green Version]
  49. Irving, A.A.; Yoshimi, K.; Hart, M.L.; Parker, T.; Clipson, L.; Ford, M.R.; Kuramoto, T.; Dove, W.F.; Amos-Landgraf, J.M. The utility of Apc-mutant rats in modeling human colon cancer. DMM Dis. Model. Mech. 2014, 7, 1215–1225. [Google Scholar] [CrossRef] [Green Version]
  50. Bote-Chacón, J.; Moreno-Lobato, B.; Sanchez-Margallo, F.M. Pilot study for the characterization of a murine model of hyperplastic growth in colon. In Proceedings of the 27th International Congress European Association of Endoscopic Surgery, Seville, Spain, 12–15 June 2019. [Google Scholar]
  51. Bote-Chacón, J.; Ortega-Morán, J.F.; Pagador, B.; Moreno-Lobato, B.L.; Saratxaga, C.; Sánchez-Margallo, F.M. Validation of murine hyperplastic model of the colon. In Proceedings of the Abstracts of the first virtual Congres of the Spanish Society of Surgical Research. Br. J. Surg. 2022. to be published. [Google Scholar]
  52. Thorlabs CAL110C1-Spectral Domain OCT System. Available online: https://www.thorlabs.com/thorproduct.cfm?partnumber=CAL110C1 (accessed on 15 September 2020).
  53. Gleed, R.D.; Ludders, J.W. Recent Advances in Veterinary Anesthesia and Analgesia: Companion Animals; International Veterinary Information Service: Ithaca, NY, USA, 2008. [Google Scholar]
  54. Abreu, M.; Aguado, D.; Benito, J.; Gómez de Segura, I.A. Reduction of the sevoflurane minimum alveolar concentration induced by methadone, tramadol, butorphanol and morphine in rats. Lab. Anim. 2012, 46, 200–206. [Google Scholar] [CrossRef] [PubMed] [Green Version]
  55. Flecknell, P. Laboratory Animal Anaesthesia; Elsevier: Amsterdam, The Netherlands, 1996. [Google Scholar]
  56. Gabrecht, T.; Andrejevic-Blant, S.; Wagnières, G. Blue-Violet Excited Autofluorescence Spectroscopy and Imaging of Normal and Cancerous Human Bronchial Tissue after Formalin Fixation. Photochem. Photobiol. 2007, 83, 450–459. [Google Scholar] [CrossRef] [PubMed]
  57. Chollet, F. Xception: Deep learning with depthwise separable convolutions. In Proceedings of the 30th IEEE Conference on Computer Vision and Pattern Recognition, CVPR 2017, Honolulu, HI, USA, 21–26 July 2016; Institute of Electrical and Electronics Engineers Inc.: New York, NY, USA, 2017; pp. 1800–1807. [Google Scholar]
  58. Russakovsky, O.; Deng, J.; Su, H.; Krause, J.; Satheesh, S.; Ma, S.; Huang, Z.; Karpathy, A.; Khosla, A.; Bernstein, M.; et al. ImageNet Large Scale Visual Recognition Challenge. Int. J. Comput. Vis. 2015, 115, 211–252. [Google Scholar] [CrossRef] [Green Version]
  59. Bäuerle, A.; van Onzenoodt, C.; Ropinski, T. Net2Vis-A Visual Grammar for Automatically Generating Publication-Tailored CNN Architecture Visualizations. IEEE Trans. Vis. Comput. Graph. 2019, 1. [Google Scholar] [CrossRef]
  60. Otsu, N. A Threshold Selection Method from Gray-Level Histograms. IEEE Trans. Syst. Man. Cybern. 1979, 9, 62–66. [Google Scholar] [CrossRef] [Green Version]
  61. Treuting, P.M.; Dintzis, S.M. Lower Gastrointestinal Tract. In Comparative Anatomy and Histology; Elsevier Inc.: Amsterdam, The Netherlands, 2012; pp. 177–192. [Google Scholar]
  62. Kollár-Hunek, K.; Héberger, K. Method and model comparison by sum of ranking differences in cases of repeated observations (ties). Chemom. Intell. Lab. Syst. 2013, 127, 139–146. [Google Scholar] [CrossRef]
Figure 1. Pre-view of tissue/lesions with C-scan scanning area selected in red. (A): healthy sample; (B): neoplastic polyp 1; (C): neoplastic polyp 2.
Applsci 11 03119 g001
Figure 2. Schematic diagram of deep learning architecture based on the Xception model.
Applsci 11 03119 g002
Figure 3. Proposed image data preparation methodology. 1. Image pre-processing, 2. air-tissue delimitation, 3. random selection of region of interest (ROI), 4. ROI extraction, and 5. ROI preparation.
Applsci 11 03119 g003
Figure 4. Comparison of features identified in optical coherence tomography (OCT) images (A,B) with respect to pathologists’ annotations on H&E images (C,D) on healthy sample (Figure 1A). MU: mucosa, MM: muscularis mucosae, SM: submucosa, ME: muscularis externa.
Applsci 11 03119 g004
Figure 5. Comparison of features identified in OCT images (A,B) with respect to pathologists’ annotations on H&E images (C,D) on neoplastic samples (Figure 1B,C). CC: cystic crypt, TG: tumoral glands.
Applsci 11 03119 g005
Table 1. Confusion matrix conditions for metrics calculation.
Actual Condition
MalignantBenign
Predicted
Condition
MalignantTPFP
BenignFNTN
Table 2. Summary of results by the network for the different imaging modalities (B-scan vs. C-scan), applying different evaluation techniques (standard vs. test time augmentation (TTA)) and resampling imbalance strategy. Note that the numbers report “mean ± std” values.
Data TypeEvaluationBACSensitivitySpecificityPPVNPV
B-scanStandard0.8806 ±
0.0748
0.9635 ±
0.0148
0.7978 ±
0.1431
0.9268 ±
0.0498
0.8914 ±
0.0415
TTA0.8895 ±
0.0792
0.8094 ±
0.1524
0.8094 ±
0.1524
0.9305 ±
0.0526
0.9093 ±
0.0400
C-scanStandard0.8857 ±
0.1143
0.7893 ±
0.2180
0.7893 ±
0.2180
0.9221 ±
0.0735
0.9432 ±
0.0687
TTA0.8843 ±
0.1068
0.7865 ±
0.2050
0.7865 ±
0.2050
0.9212 ±
0.0693
0.9472 ±
0.0614
Publisher’s Note: MDPI stays neutral with regard to jurisdictional claims in published maps and institutional affiliations.

