Featured Application
Ice hockey requires many different physical characteristics (e.g., endurance, speed, strength, core stability, postural regulation) that are completed on ice. Therefore, it is important to develop sufficient on-ice tests with respects to these characteristics and that are closely related to match performance (MP). Currently, most investigations validate off-ice and on-ice tests using MP because no alternative gold standard is available. In this context, the parametrization of the MP is the crucial question, but very little evidence is currently available in the scientific literature. This study contains a comparison of test (IHCT) and match performance data and provides a valuable contribution for coaches and sport scientists regarding the clarification of the interaction of on-ice testing and match performance.
Abstract
This prospective study aimed to validate the IHCT using a match performance score (MPS). Seventeen 3rd league male professional ice hockey field players (mean ± SD; age: 28.0 ± 6.95 years; 10 forwards, 7 defenders) completed the IHCT and were observed in the subsequent competitive match period. Match performance data were collected over 2 months (number of matches: 13–15). Based on these evaluated matches, the MPS consisting of goals, assists, penalty time, plus-minus, and number of matches was calculated for each player. The IHCT contains load parameters (e.g., 10 m and 30 m skate times, transition/weave agility times with and without a puck, slap and wrist shot puck velocities on goal) and stress parameters (e.g., lactate, heart rate). The 30 m sprint skate without puck (r2 = 0.41) and the maximum wrist shot velocity before test (r2 = 0.36) were the test performance parameters with the highest relevance for match performance. The velocity of shots on goal (SOG) displayed the highest correlation for any on-ice performance parameter (30 m sprint without puck: r = 0.76). These results provide evidence of the validity of the IHCT and the usefulness of the MPS to quantify match performance. Obviously, sprint and shot velocities are important parameters to be a successful ice hockey player. Based on these findings, IHCT and MPS are valuable assessments for coaches to evaluate the individual match performance and the effectiveness of training programs. Further research is needed to extend the scope of the IHCT and MPS for 1st and 2nd league players and for a stronger differentiation between forwards and defenders.
1. Introduction
Ice hockey is a fast and complex team sport with high physical demands including strength, core stability, speed, postural stability, and endurance. The ability to recover quickly and specific on ice skills (e.g., change of direction, skating/shooting with body contact, accelerations, decelerations) are necessary for a successful ice hockey player. The described complexity of these physical demands and the multidimensionality of match performance are also major challenges for the development of off- and on-ice performance diagnostics, although the on-ice performance diagnostic is most critical.
In ice hockey, a number of general (e.g., general endurance tests, strength and speed tests) [1,2,3,4,5,6,7], semi-specific, and sport-specific tests (specific strength, on ice with and without puck endurance, and speed tests), which imitate typical movement requirements of the ice hockey match, exist [5,8,9,10,11]. While general tests tend to be used to assess the expression of performance prerequisites, specific tests should be designed in relation to match performance or consist of actions relevant to the match.
Current standardized tests often do not provide enough information regarding their relevance to a match. Data collected across various leagues and in a standardized manner would allow for a stronger and more sufficient scientific examination (validity, reliability, reference data) of on-ice and off-ice performance diagnostics. Then, a systematic use of performance tests applied in short time intervals could help in the evaluation of training effects. In our search of current research, we observed a lack of studies that use match performance as the gold standard to prove and validate on- or off-ice performance tests and parameters [5,12,13,14].
The usefulness of performance diagnostic measures depends partially on the quality of the specific diagnostic with respect to its viability and validity. The results and findings of the performance diagnostic should be useful for the coaches and physiotherapists to improve the match performance of each player. In this context and based on our experiences in sports such as ice hockey [15], handball [16,17], basketball [18], and soccer [19], comparison of the assessments used in relation to the match statistics can positively contribute to acceptance and continuity of these tests, as immediate practical benefits can be visible. The acceptance of performance diagnostic measures also depends on its relation to the head coach’s philosophies and provides information and recommendations that can easily be implemented into the athletes’ daily training program. This “transfer” is mainly the job of the performance diagnosticians and sport scientists involved and is complicated by the highly complex physical requirements of ice hockey. It should be noted in this regard that no on-ice or off-ice test can provide 100% explanation of variance concerning the match performance, but we must try to fill the gap as much as possible.
Based on our experience we recommend completing complex on-ice performance diagnostic tests at three times during the season: preseason, approximately eight weeks later (preseason, +8 weeks), and before play-offs or off-season begin. Off-ice diagnostics (e.g., isolated strength, sprint or endurance tests) and isolated skill tests should be only used as a supplement to the complex on-ice testing.
This investigation was motivated by the general lack of a complex on-ice performance diagnostic such as the ice hockey-specific complex test (IHCT) and the missing scientifically proven link between (on-ice) test and match performance. For this purpose, we used a developed match performance score (MPS) as the “gold standard” [5] and an independent sample of German 3rd league male ice hockey players. Based on the first published findings [5], we hypothesized that actions with the puck under fatigue conditions and the ability to recover in the shortest possible time would provide the highest explained variance for match performance.
2. Materials and Methods
2.1. Subjects
Data were collected as part of the 2020/2021 season among a professional male team of German 3rd league hockey players. All players were healthy and injury-free at the time of testing. Only players who played in at least 12/15 (80%) competitive league matches within the two-month observational period (27 October 2020–20 December 2020) were included in the statistical analysis. Overall, 17 professional ice hockey field players were included in the analysis (10 forwards, 7 defenders) (mean ± SD; age: 28.0 ± 6.95 years, height: 1.83 ± 0.06 m, body mass: 89.1 ± 8.52 kg, body fat: 18.5 ± 4.87% (BC 545 digital scale, Tanita, Tokyo, Japan)). Goalkeepers were excluded.
Prior to any testing, all players were informed that they could end their participation in the study at any time without any repercussions. Next, all test procedures and possible risks and benefits of the project were described. All participants gave their written consent before participating. The study design was approved by the local Ethics Commission of the Martin-Luther-University Halle Wittenberg (reference number: 2013-13) and was in line with the Helsinki Declaration [20].
2.2. Study Design and Methodology
This prospective observational study (Figure 1) utilized results from the IHCT of a German 3rd league ice hockey team after 8 weeks of season preparation (test date: 27 October 2020).
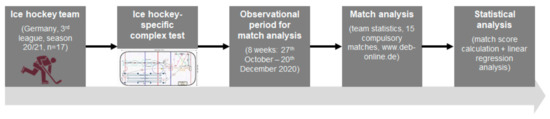
Figure 1.
Study protocol—from the sample recruitment to the data analysis.
All participants were carefully familiarized with the testing protocol (figure, instructional video, on ice demonstration; Figure 2).
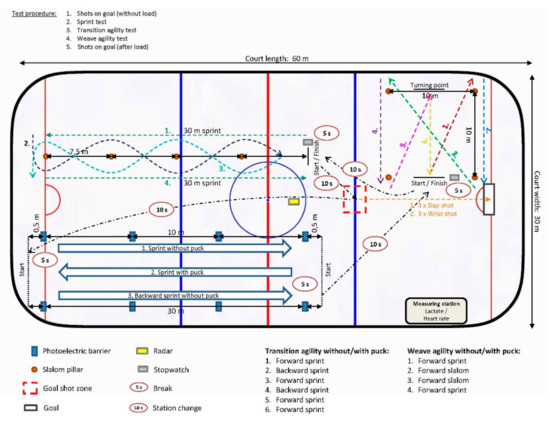
Figure 2.
Schematic diagram of the IHCT and description of the test sequences [5].
The IHCT was developed to imitate essential match associated actions and action sequences within a complex test design (Figure 2). A detailed description regarding action sequences and used assessments (e.g., lactate and heart rate measurement) and parameters (e.g., definitions and time point of capturing) has been previously published in Schwesig et al. [5,21] and Schulze et al. [15].
All tests were completed on the same day, and the order of testing was not randomized. To ensure a high degree of standardization, test preparation (including nutrition, warm-up and instructions) was comparable for all players.
To ensure strong comparability with Schwesig et al. [5], the same investigators (R.S.; S.S.) performed all test measurements.
The recording of the players’ match performance was based the team statistics of the Deutscher Eishockey-Bund website (www.deb-online.de; accessed on 21 December 2020). The evaluation only considered compulsory matches of the German Oberliga Sued. The observation period was set at 8 weeks after IHCT testing (27 October 2020–20 December 2020). During this period, 15 matches occurred.
2.3. Parameterization of Match Performance
We calculated a match performance score (MPS) for all subjects as follows [5]:
TS = total score (goals + assists 1 + assists 2),
TPT = total penalty time,
NM = number of matches,
IADiff = on-ice activity goals for minus on-ice activity goals against = Plus-minus.
The higher the calculated MPS, the better the match performance of the athlete. The number of matches used in calculating this score ranged from 13 to 15. To increase the validity of the MPS, subjects had to participate in at least 80% of the matches (12/15) to be included in the analysis.
Furthermore, we captured the shots on goal (SOT), shot efficiency, match-winning goals, powerplay goals and points in order to compare our results with the literature [12]. In addition, we have the possibility to further develop the MPS.
2.4. Statistics
Descriptive statistics (mean, standard deviation (SD), 95% confidence interval (CI), minimum, maximum) were reported for all IHCT test parameters.
Before the regression analyses, all variables were tested for normal distribution (Shapiro–Wilk Test).
Pearson’s product moment correlations were calculated in order to evaluate the relationship between different IHCT parameters and to detect dependencies between these parameters. The magnitude of correlations (r) between measures was interpreted as follows: <0.1 = trivial; 0.1–0.3 = small; 0.3–05 = moderate; 0.5–0.7 = large; 0.7–0.9 = very large; 0.9–1.0 = almost perfect [22].
Relationships were determined using an unifactorial linear regression analysis. IHCT parameters were used as independent variables, and the MPS acted as the dependent variable. For multifactorial linear regression models, a minimum of 10 to 15 observations per predictor variable generally allows for good estimates [23,24]. Due to the small sample size (n = 17), we used an inclusion rather than a stepwise model, in line with the recommendations of Green et al. [25] and Babyak et al. [24]. We calculated the functional equation, CI for m and r2 (the proportion of explained variance). An r2 > 0.5 (explained variance > 50%) was defined as relevant.
All statistical analysis were performed using SPSS version 25.0 for Windows (IBM, Armonk, NY, USA).
3. Results
3.1. Normal Distribution
Only the variables transition with puck (p = 0.001), goals after test (p = 0.006), and difference maximum wrist shot before and after test (p = 0.019) did not show a normal distribution.
3.2. Demographic and Anthropometric Data
Playing experience (Table 1) was reported based on data provided by the website https://www.eliteprospects.com (accessed on 21 December 2020). Only the competitive seasons above the youth level (leagues 1 to 3) were used for the variables playing experience and the number of matches (deadline: 03.02. 2021) in a professional league.

Table 1.
Demographic and anthropometric characteristics of ice hockey players in relation to playing positions (mean ± standard deviation).
3.3. Dependences between Anthropometric and IHCT Data
Prior to the linear regression analysis we conducted a bivariate product moment correlation in order to check for dependences between anthropometric and test performance parameters. Large correlations were found for body mass with maximum slap shot velocity (r = 0.72) and wrist shot velocity (r = 0.81) before testing. BMI also showed a large correlation to the maximum slap shot velocity after testing (r = 0.75). No significant correlations were found (r ≥ 0.7) between the different IHCT performance parameters (e.g., sprint vs. shot velocity and accuracy vs. transition/weave agility).
3.4. Test and Match Performance Data
Test and match performance data are presented in Table 2. The MPS ranged from −1 to 2 (0.42 ± 0.69) and did not differ significantly (p = 0.684, ηp2 = 0.011) between defenders (0.50 ± 0.69) and forwards (0.36 ± 0.71).
Table 2.
Descriptive data for all IHCT parameters and the match performance score (MPS).
The relationship of 29 IHCT parameters (9 stress parameters, 18 load parameters) to the MPS was calculated by linear regression analysis and summarized in Table 3; 52% (14/27) of the parameters explained at least 10% of the total variance, 26% (7/27) of the parameters explained at least 20% of variance, and 7% (2/27) of the parameters (maximum wrist shot, 30 m sprint without puck) before testing explained more than 30% of variance.
Table 3.
Comparison of the IHCT parameters with the match performance score (MPS) as gold standard by means of linear regression analysis (model: inclusion). CI = confidence interval. r2 ≥ 0.10 marked in bold.
The 30 m sprint test without a puck was able to explain 41% of the match performance measured by the MPS (Table 4):
Table 4.
All IHCT parameters with r² ≥ 0.20 according to the MPS.
3.5. Dependences between Single Match Performance Data and IHCT Data
For a more detailed analysis of the used match performance parameters, we calculated bivariate correlations between single match performance variables and the stress (Table 5) and load (Table 6) parameters of the IHCT. Only one of the analyzed player exhibited 0 points.
Table 5.
Bivariate correlations (r) between on-ice testing variables (stress parameters) and selected match performance variables. Relevant correlations (r ≥ 0.5) marked in bold. SOG = shots on goal.
Table 6.
Bivariate correlations (r) between on-ice testing variables (load parameters) and selected match performance variables. Relevant correlations (r ≥ 0.5) marked in bold. SOG = shots on goal.
4. Discussion
This is the second investigation to analyze the relationships of the IHCT using the MPS. Because the MPS was developed within the first study, this is the first investigation using an independent sample of third league male ice hockey players. We captured physical load parameters (e.g., sprint, shot velocity, agility parameters) and physiological stress parameters (e.g., heart rate and lactate concentration after testing). Similar to our first investigation [5], we found high percentages (above 25%) of explained variances in this study. While the IHCT parameters weave agility with a puck (r2 = 0.39) and wrist shot velocity 3 after testing (r2 = 0.26) achieved the largest explanations of variance with MPS in the first study, in the current study the largest explanations of variance were the 30 m sprint without a puck (r2 = 0.41) and maximum wrist shot velocity before testing (r2 = 0.36). Obviously, the capacity for rapid sprinting over a long distance of 30 m and the ability to perform wrist shots with high velocity and accuracy are important factors and predictors for match performance.
The findings from this investigation partially confirm the hypothesis that actions while handling a puck and fatigued, as well as the ability to recover, provide the highest portion of explained variance for match performance. The lactate degradation rate per minute was one of seven IHCT parameters with an explained variance above 20% (r2 = 0.21). Consistent with our first comparison study [5], the cardiac response to the IHCT measured by heart rate after the test (minutes: 0, 6, 10) revealed explained variances from 20 and 24% (heart rate minute 0 after test). The markedly lower explained variance two minutes after the test (r2 = 0.01) can be explained with the six shots on goal within the first two minutes after the test. Therefore, the cardiac recovery after the test is disturbed, and this parameter is not able to explain a meaningful amount of variance. From a content point of view and in terms of test practicability, consideration should be given to dispensing with measurements two and six minutes after the test, as the largest and equal amounts of explained variances were calculated for the first (minute 0) and last (minute 10) heart rate measurement after the test (r2 = 0.24). In contrast to the first study, which indicated that weave agility without and with a puck were the most relevant load parameters for match performance, we calculated the largest explained variances for the 30 m sprint without a puck (41%) and the 10 m sprint without a puck (19%). The prospective design of both investigations was identical (IHCT and subsequent observation and analysis of the matches), but the timelines of the observational periods were different (six months versus two months). Consequently, the number of used matches for the calculation of the MPS is clearly different (25 to 42 matches vs. 13 to 15 matches). Over a long observational period, endurance determined actions (e.g., weave agility at the end of the test) can be affected, whereas speed or explosive strength based actions (sprints and shots) are relatively constant. This could possibly explain the differences in IHCT parameters within the comparisons.
An extern discussion of our results is difficult because comparable studies are rare. Off-ice tests are often used, and the match performance is rarely covered over a long period of time. There are several studies which explain the predictive value of off-ice performance parameters in relation to on-ice performance, but there are few studies relating on-ice test performance to match performance. One study by Vescovi et al. [4] emphasized that there could not be a detectable relationship between off-ice tests and the National Hockey League (NHL)-draft status using the NHL scouting database. These authors suggested the use of more specific on-ice tests to increase the predictive value of the NHL test program. Boland et al. [12] investigated match performance relative to on-ice and off-ice test results of division one collegiate female ice hockey players (n = 20) and observed a bivariate negative correlation between repeated sprint time (0–10 m) and number of assists (r = −0.45). This is in contrast to the findings of the present study, which showed that there was an inverse relationship between match performance and sprinting times. Bond et al. [26] also published data using repeated sprint times. They suggested to use multiple sprint tests as an indicator of fatigue or possibly as a decisive indicator for the transfer period. There are several other studies that also report the importance of additional tests to evaluate ice hockey performance, suggesting more complex test demands with stops, accelerations, and cornering maneuvers are necessary [2,11,27]. Reinforced by the results of the current study, we support this approach as linear sprinting does not appear to reflect the complexity of the demands in ice hockey. Bracko et al. [28] presented data from the NHL and found that ice hockey players spent more than 70% of their on-ice time gliding and skating corners. Within the IHCT the players spent 85% (80/94 s) of the active test time (94 s activity and 40 s rest time between actions) gliding and skating corners (sum of transition and weave agility time). Consequently, the IHCT may mimic the demands of a match.
The results of Durocher et al. [3] underline the importance of specific on-ice diagnostics. These authors compared VO2max values of players using cycle ergometer tests and performance tests on-ice and observed a significant difference with higher values testing in an ice hockey specific manner (+8%) without a correlation to the ergometer test (r = −0.002). The more endurance-focused test elements at the end of our testing protocol (weave agility test with/without puck) showed no correlation to the match performance parameters or the calculated MPS.
Haugen et al. [29] analyzed off-ice fitness tests (strength endurance, sprinting, and jumping performance) in relation to player statistics. They observed only small correlations of strength, speed, and endurance with the achieved points per match (r = 0.1–0.3). The authors concluded that there is only a small predictive value of off-ice fitness testing. In line with Haugen et al. [29] we support the use of team statistics for a better predictive value of the preferred on-ice tests used.
In relation to a recently published reference database [15], sprinting performance parameters of the present study were around the 50th percentile (P50). Based on the P50, the differences ranged from 0 s (10 m sprint without puck) to + 0.07 s (30 m backward sprint). Transition agility and weave agility also displayed slightly lower performances for the current study (averaged difference: 0.48 s). Mean values of stress parameters and shot accuracy were comparable to the P50 values of Schulze et al. [15]. The metabolic load measured by blood lactate within the IHCT ranged from 8.54 mmol/L (minimum minute 2 after test) to 20.6 mmol/L (maximum minute 6 after test; Table 2). This range and the averaged value (14.7 mmol/L) at 10 min after the test were significantly higher than the intra match values (range: 4.4–13.7 mmol/L, mean: 8.15 mmol/L) reported by Noonan [30]. Obviously, the IHCT exaggerates the requirements of the match. The extension of the used rest times within (5 s) and between (10 s) actions in the IHCT can be a possibility to get closer to the demands of the match, but before players from higher leagues should be tested.
Lignell et al. [10] provided match performance data from the NHL. They reported that NHL players’ spent nearly half of the match in a high-intensity skating zone with one-fourth of the game sprinting. Based on their results, they also described a highly intermittent structure with 22–30% of variance explanation for cardiovascular loading in high-intensity skating (>17 km/h). Our findings regarding heart rate parameters 0, 6, and 10 min after the test (r2: 0.20–0.24; Table 3) supported these previous results and show that the relationship between loading structure and match performance of top-level ice hockey players also exists among German 3rd league players.
We reported inverse correlations between sprint parameters and match performance, which is contrary to previous findings by Schwesig et al. [5]. It seems other factors that are not elements of the IHCT (e.g., technical skills, tactics, match intelligence (“ice hockey sense”), quality of teammates in the same line) should also be taken into account. For example, and based of our observations, slower players are often the top scorers in various team sports (e.g., ice hockey, soccer, handball), as they are able “to read” a match and may have more effective teammates. The top scorer of the investigated team was the slowest player during the 10 m sprint with a puck test and the second worst player over the 30 m sprint with a puck test. For this reason, it is difficult to place parameters around match performance because this is a multidimensional construct.
Nigg et al. [31] reported correlations of plus-minus statistics and several on-ice and off-ice parameters in German 5th league players. However they could not show relevant relations to skating performance (linear sprint, s-corner), but small correlations to shot speed (r = 0.33) and psycho-social factors became visible. Largest correlations seen in this previous study were for strength parameters (push-ups, squats).
In our study bivariate correlation coefficients were possibly influenced by homogeneity of players match performance (MPS: 0.42 ± 0.69, coefficient of variation: 164%, range: −1.00 to 2.00) in relation to Schwesig et al. [5] (MPS: 0.82 ± 1.46, coefficient of variation: 178%, range: −1.38 to 3.44). Therefore, it could be difficult to discriminate between different players. It is also possible that tactical decisions (e.g., changes in the lines, more offensive or defensive style of play) made in the analyzed matches of the selected ice hockey team, which was in first place within their league during the observation period, were responsible for some differences. These types of tactical options could have also influenced the playing time of some players, offering more time for players with lower test performance (3rd and 4th line) and consequently increasing the relevant actions of their MPS.
The main methodological limitation of the current study was the small sample size (n = 17; 7 defenders, 10 forwards). Based on the reported relation between observations and predictor variable (10–15 observations/1 predictor) for good estimates [23,24], at least 270 subjects would have been necessary for using a multifactorial regression model. However, we used a unifactorial regression model. Nevertheless, this should definitely be considered when interpreting and generalizability of the results. In this context, it was impossible to perform a statistical analysis for forwards and defenders separately. However, a position-specific analysis is very useful because some match performance variables are highly position dependent. For example, goals, assists or shots on goal favor the forwards, whereas defenders are more likely to be affected by penalty time. It can therefore be assumed that the typical MPS results would be different between these positions. Additional valuable match performance parameters for better validity could include playing time, number of steals, number of successful and unsuccessful duels, or the number of technical errors (e.g., failed passes).
The exclusive recruitment of players from the 3rd league was necessary in order to compare the IHCT parameters with the MPS. Following, the data homogeneity is an advantage, but also a limitation for the scope (players from the 3rd league) of the IHCT and MPS. Further research is needed to extend the scope for the 1st and 2nd leagues, as well as players of different skill levels.
The time interval after testing to collect the match performance data is a critical point. In contrast to the first study (six months, 25–42 matches), we decided for a shorter (two months) observational period with a smaller number of matches (13–15). The advantage of this shorter period is that the test performance is more closely associated with the subsequent match performance. Conversely, it should be noted that the match performances at the end of the longer observational period may have little relation to the test performance. The slightly higher averaged explained variances (12% vs. 10%) and the higher maximums (41% and 36% vs. 39% and 26%) in this investigation suggest an eight-week observational period would be beneficial.
Another limitation that cannot be changed was the difference in ice quality during the IHCT (duration on ice: 2 h). To reduce this influence and to improve the inter-individual comparability of the test results, ice preparation was performed after the 10th player was tested.
5. Conclusions
The results of this study suggest the IHCT is a valid, practical, reliable, and reference data based assessment that is able to evaluate the on-ice physical performance in elite ice hockey players. Based on these findings, we believe that the IHCT is the best scientifically tested on-ice test at this time. In terms of improved practicability, we recommend not taking heart rate measurements 2 and 6 min after the test. With respect to a previous reference database [15], the IHCT is a valuable on-ice test for coaches to monitor the success of training, evaluate on-ice physical performance, and for sufficient scouting of new players.
In support of our first study [5], maximum wrist shot velocity is a valuable single test parameter for the prediction of the match performance. Additionally, the ability to sprint without a puck over 30 m was the parameter with the largest explained variance regarding MPS. Furthermore, the previously developed match performance score (MPS) seems to be well suited to characterize and quantify actual match performance. The integration of a “shots on goal” variable in the MPS equation may improve the meaningfulness of the MPS. This should be examined in future studies with larger samples (also from higher leagues) that will allow for a differentiated analysis of forwards and defenders.
Author Contributions
Conceptualization, S.S., and R.S.; methodology, S.S., R.S., and R.B.; formal analysis, K.-S.D., R.S., and K.G.L.; investigation, S.S., and R.S.; resources, R.S.; data curation, R.S.; writing—original draft preparation, S.S., R.S., R.B., and K.G.L.; writing—review and editing, S.S., R.S., K.G.L., and K.-S.D.; visualization, S.S.; supervision, S.S., and R.S.; project administration, S.S., K.-S.D., and R.S.; All authors have read and agreed to the published version of the manuscript.
Funding
This research received no external funding.
Institutional Review Board Statement
The study was conducted according to the guidelines of the Declaration of Helsinki, and approved by the local Ethics Committee of the Martin-Luther-University Halle-Wittenberg (reference number: 2013-13; date of approval: 06.06.2017). All procedures performed in studies involving human participants or on human tissue were in accordance with the ethical standards of the institutional and/or national research committee and with the 1975 Helsinki declaration and its later amendments or comparable ethical standards.
Informed Consent Statement
Informed consent was obtained from all subjects involved in the study.
Data Availability Statement
The raw data supporting the conclusions of this article will be made available by the authors: without undue reservation.
Acknowledgments
The authors would like to thank the ice hockey players of Selber Wölfe for their cooperation and outstanding efforts. We greatly appreciate the support provided by Herbert Hohenberger concerning the preparation and organization of the performance diagnostic.
Conflicts of Interest
The authors declare no conflict of interest.
References
- Green, M.R.; Pivarnik, J.M.; Carrier, D.P.; Womack, C.J. Relationship Between Physiological Profiles and On-Ice Performance of a National Collegiate Athletic Association Division I Hockey Team. J. Strength Cond. Res. 2006, 20, 43. [Google Scholar] [CrossRef]
- Bracko, M.R. On-Ice Performance Characteristics of Elite and Non-elite Women’s Ice Hockey Players. J. Strength Cond. Res. 2001, 15, 42–47. [Google Scholar] [CrossRef]
- Durocher, J.J.; Guisfredi, A.J.; Leetun, D.T.; Carter, J.R. Comparison of on-ice and off-ice graded exercise testing in collegiate hockey players. Appl. Physiol. Nutr. Metab. 2010, 35, 35–39. [Google Scholar] [CrossRef]
- Vescovi, J.D.; Murray, T.M.; Fiala, K.A.; VanHeest, J.L. Off-ice performance and draft status of elite ice hockey players. Int. J. Sports Physiol. Perform. 2006, 1, 207–221. [Google Scholar] [CrossRef] [PubMed]
- Schwesig, R.; Hermassi, S.; Edelmann, S.; Thorhauer, U.; Schulze, S.; Fieseler, G.; Delank, K.S.; Shephard, R.J.; Chelly, M.S. Relationship between ice hockey-specific complex test and maximal strength, aerobic capacity and postural regulation in professional players. J. Sports Med. Phys. Fitness 2017, 57, 1415–1423. [Google Scholar]
- Burr, J.F.; Jamnik, V.K.; Dogra, S.; Gledhill, N. Evaluation of jump protocols to assess leg power and predict hockey playing potential. J. Strength Cond. Res. 2007, 21. [Google Scholar] [CrossRef]
- Burr, J.F.; Jamnik, R.K.; Baker, J.; Macpherson, A.; Gledhill, N.; Mcguire, E.J. Relationship of physical fitness test results and hockey playing potential in elite-level ice hockey players. J. Strength Cond. Res. 2008, 22. [Google Scholar] [CrossRef]
- Roczniok, R.; Stanula, A.; Gabryś, T.; Szmatlan-Gabryś, U.; Gołaś, A.; Stastny, P. Physical fitness and performance of polish ice-hockey players competing at different sports levels. J. Hum. Kinet. 2016, 51, 201–208. [Google Scholar] [CrossRef] [PubMed]
- Peterson, B.J.; Fitzgerald, J.S.; Dietz, C.C.; Ziegler, K.S.; Baker, S.E.; Snyder, E.M. Off-ice anaerobic power does not predict on-ice repeated shift performance in hockey. J. Strength Cond. Res. 2016, 30, 2375–2381. [Google Scholar] [CrossRef]
- Lignell, E.; Fransson, D.; Krustrup, P.; Mohr, M. Analysis of high-intensity skating in top-class ice hockey match-play in relation to training status and muscle damage. J. Strength Cond. Res. 2018, 32, 1303–1310. [Google Scholar] [CrossRef]
- Hajek, F.; Keller, M.; Taube, W.; von Duvillard, S.P.; Bell, J.W.; Wagner, H. Testing-Specific Skating Performance in Ice Hockey. J. Strength Cond. Res. 2020. [Google Scholar] [CrossRef]
- Boland, M.; Delude, K.; Miele, E.M. Relationship between physiological off-ice testing, on-ice skating, and game performance in division I female ice hockey players. J. Strength Cond. Res. 2019, 33, 1619–1628. [Google Scholar] [CrossRef] [PubMed]
- Farlinger, C.M.; Kruisselbrink, L.D.; Fowles, J.R. Relationships to skating performance in competitive hockey players. J. Strength Cond. Res. 2007, 21, 915–922. [Google Scholar] [CrossRef]
- Ransdell, L.B.; Murray, T.M.; Gao, Y. Off-ice fitness of elite female ice hockey players by team success, age, and player position. J. Strength Cond. Res. 2013, 27. [Google Scholar] [CrossRef]
- Schulze, S.; Laudner, K.G.; Delank, K.S.; Brill, R.; Schwesig, R. Reference data by player position for an ice hockey-specific complex test. Appl. Sci. 2021, 11, 280. [Google Scholar] [CrossRef]
- Schwesig, R.; Koke, A.; Fischer, D.; Fieseler, G.; Jungermann, P.; Delank, K.S.; Hermassi, S. Validity and Reliability of the New Handball-Specific Complex Test. J. Strength Cond. Res. 2016, 30, 476–486. [Google Scholar] [CrossRef] [PubMed]
- Hermassi, S.; Chelly, M.S.; Wollny, R.; Hoffmeyer, B.; Fieseler, G.; Schulze, S.; Irlenbusch, L.; Delank, K.S.; Shephard, R.J.; Bartels, T.; et al. Relationships between the handball-specifc complex test, non-specifc feld tests and the match performance score in elite professional handball players. J. Sports Med. Phys. Fitness 2018, 58. [Google Scholar] [CrossRef]
- Schwesig, R.; Hermassi, S.; Lauenroth, A.; Laudner, K.; Koke, A.; Bartels, T.; Delank, S.; Schulze, S. Validity of a basketball-specific complex test in female professional players. Sport. Sport. 2018, 32, 125–133. [Google Scholar] [CrossRef]
- Schwesig, R.; Schulze, S.; Reinhardt, L.; Laudner, K.G.; Delank, K.-S.; Hermassi, S. Differences in Player Position Running Velocity at Lactate Thresholds Among Male Professional German Soccer Players. Front. Physiol. 2019, 10, 886. [Google Scholar] [CrossRef]
- Millum, J.; Wendler, D.; Emanuel, E.J. The 50th Anniversary of the Declaration of Helsinki. JAMA 2013, 310, 2143. [Google Scholar] [CrossRef]
- Schwesig, R.; Lauenroth, A.; Schulze, S.; Laudner, K.; Bartels, T.; Delank, K.; Reinhardt, L.; Kurz, E.; Hermassi, S. Reliability of an ice hockey-specific complex test. Sport. Sport. 2018, 32, 196–203. [Google Scholar] [CrossRef]
- Cohen, J. Statistical Power Analysis for the Behavioural Science, 2nd ed.; Lawrence Erlbaum: Hillsdale, NJ, USA, 1988; ISBN 0805802835. [Google Scholar]
- Green, S.B. How Many Subjects Does It Take To Do A Regression Analysis? Multivar. Behav. Res. 1991, 26, 499–510. [Google Scholar] [CrossRef]
- Babyak, M.A. What you see may not be what you get: A brief, nontechnical introduction to overfitting in regression-type models. Psychosom. Med. 2004, 66, 411–421. [Google Scholar] [CrossRef] [PubMed]
- Green, D.J.; Maiorana, A.; O’Driscoll, G.; Taylor, R. Effect of exercise training on endothelium-derived nitric oxide function in humans. J. Physiol. 2004, 561, 1–25. [Google Scholar] [CrossRef]
- Bond, C.W.; Bennett, T.W.; Noonan, B.C. Evaluation of skating top speed, acceleration, and multiple repeated sprint speed ice hockey performance tests. J. Strength Cond. Res. 2018, 32, 2273–2283. [Google Scholar] [CrossRef] [PubMed]
- Krause, D.A.; Smith, A.M.; Holmes, L.C.; Klebe, C.R.; Lee, J.B.; Lundquist, K.M.; Eischen, J.J.; Hollman, J.H. Relationship of Off-Ice and On-Ice Performance Measures in High School Male Hockey Players. J. Strength Cond. Res. 2012, 26, 1423–1430. [Google Scholar] [CrossRef]
- Bracko, M.R.; Fellingham, G.W.; Hall, L.T.; Fisher, A.G.; Cryer, W. Performance skating characteristics of professional ice hockey forwards. Sport. Med. Train. Rehabil. 1998, 8, 251–263. [Google Scholar] [CrossRef]
- Haugen, T.; Hopkins, W.; Breitschädel, F.; Paulsen, G.; Solberg, P. Fitness tests and match performance in a male ice-hockey national league. Int. J. Sports Physiol. Perform. 2020. [Google Scholar] [CrossRef] [PubMed]
- Noonan, B.C. Intragame Blood-Lactate Values During Ice Hockey and Their Relationships to Commonly Used Hockey Testing Protocols. J. Strength Cond. Res. 2010, 24, 2290–2295. [Google Scholar] [CrossRef]
- Nigg, C.R.; Gessner, A.; Nigg, C.; Giurgiu, M.; Neumann, R. Demographic, physiological, psychological, and on-ice performance indicators predict plus/minus status of recreational ice hockey players across a season. Ger. J. Exerc. Sport Res. 2020, 50, 463–469. [Google Scholar] [CrossRef]


Publisher’s Note: MDPI stays neutral with regard to jurisdictional claims in published maps and institutional affiliations. |
© 2021 by the authors. Licensee MDPI, Basel, Switzerland. This article is an open access article distributed under the terms and conditions of the Creative Commons Attribution (CC BY) license (https://creativecommons.org/licenses/by/4.0/).