Featured Application
This article informs the textile industry stakeholders on the relevant environmental trade-offs when a major synthetic fiber such as polyester is subject to bio-based sourcing. Due to the per-tinence and market presence of the underlying polymers, the findings of this paper also apply to a wider spectrum of bio-based products and therefore inform the environmental policy on the expected repercussions for large scale bio-sourcing.
Abstract
The textile industry has lately started exploring the possibility of bio-sourcing for synthetics, notably polyester fiber, in the effort to break from the proven fossil-fuel dependency and decrease the environmental impacts. Traditionally made out of fossil-based polyethylene terephthalate polymer, polyester can be functionally substituted with three bio-based alternatives: bio-polyester, polytrimethylene terephthalate, and polylactic acid fibers. At present, however, there is a lack of studies on the environmental effects of such substitution. We, therefore, performed a comparative, cradle-to-gate life cycle assessment of conventional polyester and those substitutes featuring varying levels of bio-content. The impact assessment was performed with the most recent version of the Environmental Footprint method including some adaptations—using carbon crediting and a different, distance-to-target weighting approach. Bio-sourced fibers are found to cause higher environmental burdens than polyester. Acidification, eutrophication, ecotoxicity, water, and land use increase with the bio-content and are predominantly linked to the first generation feedstock (agriculture and transport). The results on climate change vary with the impact method adaptations, yet do not manage to offset the aforementioned deteriorations. In single scores, only three out of nine substitutes are found to perform comparably, while the rest perform significantly worse than the incumbent fiber.
1. Introduction
Numerous studies from public agencies, the scientific community and businesses have shown that the current practices throughout the textile supply chain go against the sector’s long-term sustainability. Business-as-usual in this resource-intensive sector involves a very high fossil-fuel dependency, produces excessive greenhouse gas (GHG) emissions, uses high quantities of water, and causes substantial water pollution and other burdens to the environment [1,2,3].
A major component in the textile industry is fibers. As intermediate products, they are a common denominator for all subsequent products such as yarn or garments. On the fiber market, polyester fiber accounts for little over half of the entire annual global fiber production [4]. In the textile industry, polyester conventionally refers to a fiber produced by melt spinning the amorphous polyethylene terephthalate (PET) polymer, even though polymer science groups many compounds, including PET, into polyesters. Hence, it is a fossil-based product, where the entirety of the embedded carbon (C) comes from the fossil-based feedstock. In order to mitigate the environmental impacts of its products, to decouple from the dependency on fossil resources, and to meet the sustainability-minded consumer trends, the textile industry needs to rethink its current supply chains. At the same time, “the ever-increasing consumption of textiles and clothing is only expected to intensify the social and environmental issues” associated with their production [5].
Bio-sourcing is a solution, which supposedly has an effect on all the aforementioned environmental impacts. It is particularly relevant for polyester fiber due to fiber’s market dominance. Bio-sourcing relies on feedstock diversification, whereby so-called renewable or bio-based feedstock such as crops (edible, first-generation) or lignocellulosic mass (non-edible, second-generation) displaces the conventional fossil-based inputs [6,7]. In short, bio-sourcing rests on the idea that changing the provenance of C in the product’s backbone results in a decrease in the environmental impacts of the said product. The share of total carbon in the product coming from the bio-based feedstock is expressed as % of bio-based C content, ranging from 0% bio-C (in case of fossil-based polyester) to 100% bio-C (when the polyester is entirely produced out of bio-based feedstock), with “partially bio-based” capturing everything in between. Due to the current lack of standardization in the bio-based field, both entirely and partially bio-based products are simply called “bio-based”. Moreover, the European Commission (EC) particularly supports this strategy with its recent European Green Deal [8]. Through these activities, the EC aims to stimulate the development of new markets for climate-neutral and circular products, especially in resource-intensive sectors, such as textiles and plastics (with relevant overlaps in polymer production) [8].
In this light, polyester fibers could largely be substituted by three bio-based alternatives, minding the necessary functionalities of the fiber in different applications [9]. By accounting for the technical substitution potential of the total polyester put on the market, Shen et al. [9] report that 65% of polyester can be substituted by bio-polyester, 20% by polytrimethylene terephthalate (PTT) fibers, and 10% by polylactic acid (PLA) fibers. In the first case, the substitute fiber is chemically identical to polyester, but the production chain has been revised and slightly modified to accommodate bio-sourcing for the two underlying PET monomers. Such an approach is referred to as drop-in substitution [10]. Secondly, PTT fiber, also known as Triexta (with the Federal Trade Commissions in the United States), is a fiber made out of the homonymous polymer with favorable material properties in substituting the conventional polyester fiber [11]. The industry has known PTT fiber for a long time (i.e., it was discovered in 1941 as a fossil-based fiber), but the production cost of one of its two monomers rendered it too expensive for any mass-market application [12,13,14]. When a biotechnology solution for producing a bio-based version of this monomer emerged, PTT, now in its bio-based form, was put back into consideration due to favorable economic factors, i.e., smart drop-in substitution. Finally, PLA fiber is a representative of novel products, with a “dedicated” production pathway [10] and no fossil-based counterpart. It is made of a homonymous polymer.
It may be misleading to think that bio-based products are immune to the use of fossil resources since the approach concerns only the product’s mass without any other particular modification in the supply chain (e.g., energy production, transportation). Bio-sourcing is not without risks either. Competition between food supply and biomass production, the over-exploitation of natural resources, and the loss of biodiversity are just a few of the possible undesired effects related to this strategy [15]. Whatever the case may be, whether bio-sourcing is a good solution for synthetics or not, the actual impacts of polyester substitution have not been studied abundantly to provide a conclusion.
In order to obtain a more adequate and complete picture of the environmental implications of such a solution, the life cycle assessment (LCA) methodology is applied since it accounts for the aggregate environmental impacts of a product [16]. All the resource consumption and environmental emissions from feedstock (cradle) to fiber (factory gate) are thereby accounted for. Thus far, published LCAs are in fact only indirectly related to polyester because its underlying polymer (PET) is well established in the plastics and packaging sectors, driving bio-based innovation. As to our knowledge, there are no published LCAs on PLA or PTT fibers available either. Thus far, published studies address bio-based PET and PTT monomers [17,18,19,20,21,22], bio-based PET polymer [23,24,25,26,27] or bio-based PET and PLA bottles [28,29,30,31]. While they act as very valuable proxies for an impact assessment and a degree of overlap indeed exists between the polymers and fibers, further comparison to other synthetic or natural fibers is not possible if studies stay on the lower product levels.
Recent reviews found that LCA studies related to bio-based synthetics through the aforementioned proxies do not follow the same methodology (impact assessment method, inclusion of transport, etc.), have vastly different scopes (cradle-to-gate, cradle-to-grave, variant) and functional units, and are often fully aggregated and thus not entirely transparent [32,33]. Further, existing studies are found to focus mainly on the global warming potential (GWP) or fossil resource depletion, largely ignoring other environmental impacts [34]. In fact, the goal of the only paper related to bio-based polyester fibers (including PET and PLA polymer) was to study GHG emissions and non-renewable energy use assuming incineration at the end of life [35]. On the topic of decreased climate impacts of bio-based products, Walker and Rothman [32] found that present LCAs have been favoring bio-based polymers by applying carbon crediting for the uptake of carbon (C) as carbon dioxide (CO2) from the air during feedstock growth. In the absence of immediate photosynthesis, a carbon credit is not applied to the fossil-based products since the method is founded on the so-called short C cycle (the uptake of the non-fossilized C from air). They point that carbon crediting is a “controversial and potentially misleading method when used in cradle-to-gate studies where the end of life emission of CO2 is not included”. If the end of life (EOL) is included, studies are found to report much higher GWP results for polymers than those which limit the scope to granulate, i.e., to the gate [34].
When only climate factors are accounted for, there is a great chance to miss adverse effects or trade-offs in other categories such as water consumption, eutrophication, acidification, ecotoxicity, land use, etc., which may stem from the agricultural practices or the modified supply chains. Furthermore, an LCA study [25] that compared recycled PET and PLA polymers against the conventional PET in Europe found that recycled PET outperforms both counterparts. By examining 11 non-climate impacts in addition to climate change, the study found that the bio-based representative does not show clear environmental advantages and that current European waste management practices strongly question its sustainability [25]. Given that melt spinning is the only step between polymers and synthetic fibers in question, very close outcomes can be expected on the fiber level.
Last but not least, in the absence of comprehensive LCA studies on the substitution of fossil-based fibers by the bio-based alternatives, the political or corporate decisions of prioritizing bio-based fibers and textiles over conventional ones stay without a scientific foundation. The present paper acts in this information vacuum and aims to shed light on the implications of bio-sourcing for polyester by performing a cradle-to-gate LCA on polyester fiber and its bio-based substitutes with varying levels of bio-content. By assessing a wide range of environmental impacts, the study revolves around two main hypotheses that: (i) bio-sourcing decreases the climate impacts of bio-based fibers relative to fossil-based polyester as a consequence of omitted consumption of fossil-based feedstock; (ii) bio-sourcing simultaneously causes adverse effects in non-climate impacts of bio-based fibers relative to the conventional polyester. The impact assessment was performed with the Environmental Footprint method and three adaptations on carbon crediting and distance-to-target weights (see Methods and Materials). This method was chosen as the future reference method of the European Union (EU) for the product’s environmental footprint while the EU’s bio-based policy is expected to drive the innovation for these and products alike. The results, therefore, enable institutional decision-makers, sustainability managers as well as the general public to grasp the environmental consequences of this well-intended strategy.
To do so, the on-hand manuscript is structured in the following way: the first part defines the goal and scope of this study and gives an overview of the methodology. The prevailing production pathways on the market for each of the fibers and their modeling are elaborated in the subsequent section. Finally, we present the most relevant results for each examined fiber and summarize the discussion of these results.
2. Materials and Methods
This study performs a comparative LCA of polyester and three types of its substitutes with varying levels of bio-based content. It aims to identify the environmental advantages and disadvantages of the bio-sourcing of polyester and point to the most influential parameters for the environmental performance of bio-based alternatives (in the context of the European bio-based economy). The functional unit of comparison is 1 kg of fiber, finished, at factory gate, while the scope of the study is cradle-to-gate, i.e., from the primary inputs (crop or fossil-based compounds) to the finished fiber, at factory gate. Life cycle inventories were modeled based on state-of-the-art production processes (see chapter Production Pathways and Scenarios) for every fiber. Background data for this modeling were retrieved from the ecoinvent database, version 3.6 (recycled-content system model). The entire modeling was conducted in the software tool Simapro, version 9.1.1.1.
For the life cycle impact assessment (LCIA), the Environmental Footprint (EF) method as implemented in Simapro (i.e., “EF 3.0 Method (adapted), version 1.00”)—with its default characterization, normalization, and weighting factors—was applied in the first step (referred here as Default EF). However, the implementation of this method in Simapro does not account for biogenic CO2 uptake and emissions during the life cycle; therefore, a modified version of the said impact assessment method was applied to account for carbon sequestered from the atmosphere during crop growth. Modifications in characterization factors for climate change impacts for the uptake of CO2 from the air (factor -1 instead of 0), for biogenic emissions of CO2 (factor of 1 instead of 0), and for biogenic carbon monoxide emissions (factor of 1.57 instead of 0) were added. No other characterization factors, normalization or weighting parameters were modified. This Modified EF method, therefore, allowed us to determine the relevance of biogenic C net emissions in the production process of the fiber.
Additionally, two more modified EF methods are produced by replacing the default weighting factors with distance-to-policy-target weights reported in Castellani et al. [36], which reflect the gap between the EU’s current and the desired state in environmental impacts. Amongst others, the importance of climate change decreases with these alternative target weights, while the relevance of factors such as ecotoxicity, eutrophication, and acidification increases [36]. These modified methods allowed us to assess whether bio-based innovation was indeed aligned with the European environmental policy targets (binding and non-binding) as well as to perform a sensitivity analysis of our results. The impact assessment method where only these weights are changed is referred to as Default Castellani. Finally, the method where both elements, i.e., the characterization (same as in Modified EF) and the weighting factors, are modified is referred to as Modified Castellani.
The characterization results are calculated for all 16 EF default impact categories included in this method. The single score results represent the aggregate scores after normalization and corresponding weighting and are expressed in points (Pt). Production pathways are represented in Figure 1, while LCIA results are summarized in Table 1 and Figures 2–6. In order to facilitate the interpretation of the results, the same color-coding is applied throughout the paper, where grey stands for fossil-based products, orange for partially bio-based, and green for fully bio-based products. In LCIA, a darker shade of bars refers to results of Default EF and lighter to Modified EF.
3. Production Pathways and Scenarios
PET polymer is predominantly produced through the esterification of monoethylene glycol (MEG) and purified terephthalic acid (PTA) according to Reaction 1 [17,37]. The two monomers are synthesized independently of each other and then brought together in a polymerization plant.
The production of fossil-based MEG and PTA is globally well-established. The traditional production of MEG starts with ethylene derived from natural gas. Ethylene is oxidized into ethylene oxide and subject to hydrolysis to arrive to MEG [28]. All the production steps are enchained on the same production site. On the other hand, the main raw material for PTA, para-xylene, is obtained cheaply and in large quantities from the crude oil’s aromatic stream [17,24]. Para-xylene (PX) is subject to catalytic partial oxidation, after which the crude form of terephthalic acid is purified [17,18]. This process, also known as the Amoco process, is currently the leading technology for PTA production on a global scale with very high process efficiency parameters [17].
Reaction 1 does not depend on the origin of the monomers, and thus equally applies to the partially and fully bio-based PET production as well. Partial bio-content means that only one of the two monomers is derived from bio-based feedstock, while the other is taken from fossil resources. Monomers alone always stem from just one feedstock, making them either fully bio- or fossil-based. The bio-based C content of a polymer is then calculated as the weighted average of the C contents of the two monomers. Namely, as Reaction 1 demonstrates, MEG accounts for 20% of C content of PET, while the remaining 80% comes from PTA. Partially bio-based PET consists of bio-based MEG and fossil-based PTA, and therefore has 20% bio-based C content; the reverse combination of monomers is not known as of yet. PET can also be 100% bio-based when both monomers are derived from biogenic sources.
In the case of bio-based MEG, instead of sourcing ethylene from the natural gas, it is obtained indirectly through bio-ethanol (see Figure 1). Bio-ethanol is industrially produced in the microbial fermentation of natural sugars present in sucrose (e.g., sugarcane) and starchy (e.g., corn) biomass, notably in the United States of America (USA) and Brazil [35,38]. The USA uses corn to produce 63% of the global bio-ethanol volumes, while Brazil uses sugarcane and accounts for 24% [35,38]. Second-generation feedstock for bio-ethanol production is yet to be commercialized [38] and as such is far from relevant industrial-scale production. Corn-based production predominantly uses the dry milling technology [39] in which starch is extracted from the corn grain and separated into glucose units. This simple sugar is then fermented and ethanol is distilled. Conversely, ethanol from sugarcane can be obtained in two modes—in direct fermentation of raw sugarcane with cogeneration (energy recovery) of lingo-cellulosic by-products [24]; or via fermentation of molasses, a by-product in sugar mills, where crystal sugar is extracted for human consumption. Regardless of the exact production method of ethanol, this compound is dehydrated into ethylene [40]. All the subsequent steps, downstream of ethylene, then mimic those of the petrochemical chain of MEG (see Figure 1).
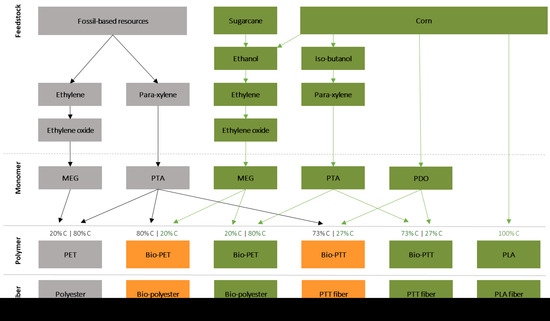
Figure 1.
The production pathways of polyester and its bio-based substitutes. Polymers are transformed into fibers via melt spinning. Note that in this graph grey stands for fossil-based, green for bio-based and orange for partially bio-based products. Scenarios refer to the system setup in modeling. Scenario 1 contains corn-based monoethylene glycol (MEG); MEG in Scenario 2A and 2B stems from sugarcane, whereas the ethanol production processes differ between the two. Same explanations apply for Scenarios 3, 4A and 4B, respectively. (MEG: monoethylene glycol; PTA: purified terephthalic acid; PET: polyethylene terephthalate; PDO: 1,3-propanediol; PTT: polytrimethylene terephthalate; PLA: polylactic acid).)
New pathways to produce PTA from diverse non-fossil sources have already been considered in the literature and practice [41]. The only industrial-scale production of PTA to date involves bio-sourced iso-butanol, which is converted into bio-PX using the Gevo process in a bio-refinery in the USA [17,18]. Its production also requires the extraction of glucose from corn, followed by its fermentation into iso-butanol, conversion into iso-butylene, and several intermediary steps to arrive at the bio-PX [42]. Finally, the bio-based PX is converted into PTA using the Amoco process, just as for the conventional PX.
PTT polymer is produced in an esterification reaction between 1,3-propanediol (PDO) and PTA whose conditions are similar to PET polymerization [12,13].
Monomers are again synthesized separately and brought together during the polymerization. As attested by Reaction 2, PDO accounts for 27% of C in PTT. Depending on whether one or either monomer is bio-based, PTT can therefore have a bio-based C content of 27% (partially bio-based) or 100% (fully bio-based). Unlike PET, where the production of bio-MEG implies a change for the intermediary product, in PTT, fossil- and bio-based PDO have vastly different production pathways (see Figure 1). Fossil-based PDO used to be produced from ethylene via the Shell process [43,44]; however, such a monomer is no longer commercially available due to the high costs of production [21]. For the production of bio-based PDO, only one fully commercialized route exists, i.e., the fermentation of corn-derived glucose for a direct production of bio-PDO using genetically engineered E. Coli [14,19,20,44]. Corn cultivation and glucose extraction via starch hydrolysis therefore precede bacterial fermentation [19,20] like in all other corn-based monomers.
Last but not least, PLA is a polymer with a 100% bio-based carbon content [26,45]. From the point of view of life sciences, PLA is a biopolymer, hence biodegradable [45,46]. As it does not have a fossil-based counterpart, it is classified as a novel/dedicated polymer [10] and a new generic fiber [4]. PLA is predominantly produced in ring-opening polymerization of lactides [47], used by NatureWorks in the USA, which is currently its most notable producer [26,48]. Here, corn-derived glucose is fermented into crude lactic acid by diverse bacteria; several continuous extraction and purification steps are applied to obtain an aqueous polymer-grade lactic acid [26]. The acid is transformed into lactides followed by an open ring polymerization and pelletization by which PLA granulate is obtained [26,47].
As a final step, conventional polyester fibers are produced by melt spinning the PET granulate. Melt spinning is a thermo-mechanical, solvent-free process, possible only if the decomposition temperature of the polymer is above its melting point [12], which yields continuous or staple fiber (cut into predetermined length for a cotton-like fiber). Melt spinning can equally be applied on PTT and PLA polymers [13,45].
Based on the state-of-the-art production processes, and to account for different levels of bio-based content and feedstock, a total of seven different scenarios for PET fiber, two for PTT fiber and one for PLA fiber are modeled here as presented in Figure 1. Scenario 0 is the baseline scenario for fossil-based polyester; Scenarios 1, 2A, 2B combine the bio- MEG and fossil-PTA; Scenarios 3, 4A, 4B combine the bio-MEG and bio-PTA; Scenario 5 combines bio-PDO and fossil-PTA; Scenario 6 combines bio-PDO and bio-PTA; Scenario 7 refers to PLA.
Firstly, fossil-based MEG (Scenario 0) is derived from ethylene in existing production facilities around the world. All the steps from ethylene to MEG happen on one site. Its global production and transport are modeled using ecoinvent datasets without modifications. Further, three versions of bio-based MEG are modeled:
- Bio-MEG derived from corn grain in the USA. The entire production from ethanol to MEG is assumed to happen on one production site. Ethanol is obtained using dry milling technology (for Scenarios 1 and 3).
- Bio-MEG derived from sugarcane in Brazil. The ethanol is obtained in an autonomous plant in the direct fermentation of sugarcane, where bagasse is incinerated for energy recovery (for Scenarios 2A and 4A).
- Bio-MEG derived from sugarcane in Brazil. The ethanol is obtained in an annexed plant through the fermentation of sugar molasses from the crystal sugar production (for Scenarios 2B and 4B).
In all three versions, the dehydration of ethanol into ethylene is assumed based on [18,40]. The rest of the chain up to MEG and its transport is modeled in the same way as for the fossil-MEG, with appropriate modifications of inputs and biogenic emissions.
Secondly, fossil-PTA is derived from para-xylene using the Amoco process in existing production facilities around the world. The extraction of PX and its transformation into PTA happen on the same site (for Scenarios 0, 1, 2A/B, 5). PTA’s global production and transport are modeled using ecoinvent datasets without modifications. Conversely, bio-PTA is produced from corn on one site in USA using the Gevo process. Iso-butanol fermentation and its transformation to iso-butylene are adapted from corn-to-ethanol and ethanol-to-ethylene (for MEG) processes using stoichiometric relations. The remainder of the chain up to bio-based PX is based on data from [18]. The transformation of PX into PTA is modeled as for fossil-PTA with appropriate input modifications and same transport.
As for the PET polymerization, the same global facilities are assumed to be used for applicable bio- and fossil-based scenarios, both modeled with ecoinvent datasets (scenarios 0 to 4B).
Bio-PDO is produced from corn in the USA (for Scenarios 5 and 6). Glucose extraction followed by fermentation is modeled using the data from [19,20,21]. PTT polymerization is adapted from PET polymerization using stoichiometric relations since the two reactions show a strong similarity (esterification under similar conditions, water as a by-product, shared monomer) and a potential for retrofitting.
PLA (Scenario 7) is obtained from corn in the USA; the entire corn-to-polymer production chain is modeled using an ecoinvent dataset.
All polymers are transported to a fiber production site, modeled with PET polymer transport data from ecoinvent. Further, all are subject to melt spinning in order to produce the homonymous fiber in available fiber production facilities around the world. The melt spinning is modeled using the ecoinvent dataset on polyester production. More details on all datasets, approximations, and modifications can be found in the Supplementary Information.
4. Results and Discussion
4.1. Feedstock Requirements
As evidenced by the production pathways, current bio-based strategies follow particular substitution approaches, all starting from first-generation feedstock. In the case of bio-polyester fibers, they displace the fossil-based intermediary products in established production pathways, namely ethylene and para-xylene, by homologous alternatives derived from bio-feedstock. In doing so, they add production steps to derive the two compounds through fermentation and chemical modification of an alcohol, while a substantial part of the chain follows without major modifications (e.g., Amoco process for PTA, ethylene-to-MEG, polymerization, melt spinning). In the case of PTT, an entirely new bio-based path for PDO was developed using bacterial fermentation; ethylene for fossil-based PDO is not substituted simply because its conversion into PDO is financially unattractive. In the case of PLA, its novelty does not permit a comparison with a pre-existing fossil-based counterpart, except that it too uses microbial fermentation.
Under these conditions, modeled scenarios are shown to have vastly different feedstock requirements, as shown in Table 1. Namely, in order to produce 1 kg of the conventional polyester, 0.199 kg of ethylene and 0.585 kg of para-xylene are needed. The two compounds are regarded as primary inputs, while additional inputs such as oxygen or water not listed here do not fall under the bio-based innovation (no C to replace). When crops displace these petrochemical inputs, the requirements for primary inputs are shown to rise substantially due to feedstock and process modifications.

Table 1.
Feedstock requirements for each scenario. Note that these results are independent of the impact assessment applied.
Partially bio-based fibers require 1.089 to 3.043 kg crop/kg fiber in addition to the unchanged para-xylene quantities. Moreover, corn-derived MEG is observed to have higher feedstock efficiency than the sugarcane-derived versions since it requires less feedstock than the other two variations. MEG from directly fermented ethanol has a higher sugarcane requirement than the one stemming from molasses. The latter comes from a by-product of crystal sugar extraction, which means that other products are extracted from the sugarcane mass in parallel; in the former case, after fermentation, the mass is burned for energy recovery. The feedstock requirements rise for fully bio-based scenarios, where they range from 1.53 to 6.43 kg crops/kg fiber. It should be noted that the present LCA only partially accounts for whether the crop is of natural or genetically modified (GMO) origin. Namely, in accounting for the spatial and mass distribution of global corn production, part of this feedstock grown in the USA is presumed to be GMO. This question remains of great relevance to public opinion.
At this point, the contribution of feedstock to the aggregate environmental impacts of the fiber is not addressed, only the crop quantities. The latter will depend on the environmental intensity of said crops, i.e., how they are grown. Since agriculture is an environmentally intense activity, we explore the contribution of bio-based feedstock to different impact categories in sub-chapter 4.3 (Further Midpoint Categories).
4.2. Climate Change Impact
Climate change impact (CCI) has the highest weight in the single score results of the EF impact assessment method, reflecting its relevance in the overall environmental narrative of the EU. For this reason, the results of climate change impacts are presented and discussed in the first step of the assessment. Figure 2 shows the CCI results with the Default and the Modified EF, the latter of which incorporates biogenic C uptake and emissions (as described in Materials and Methods). Since Walker and Rothman [32] find that presenting only the CCI results obtained with carbon crediting in a cradle-to-gate study is misleading, we also take the opportunity to not only explore the relevance of the biogenic C but address the issue of carbon crediting on a solid example.
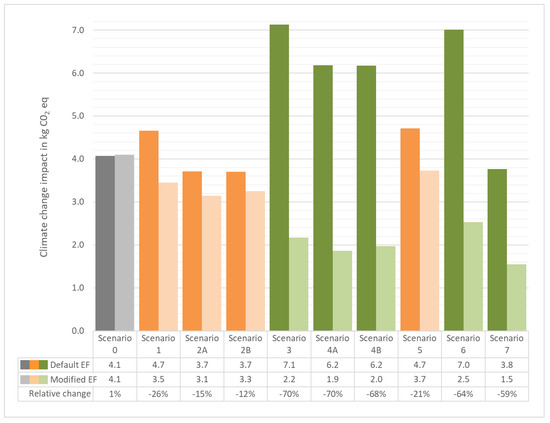
Figure 2.
Climate change impacts calculated with Default EF (darker bars) and Modified EF (lighter bars) methods. Note that the difference between the dark and light bars for each scenario reflects the biogenic carbon embedded in the fiber. The relative change between the two results is therefore calculated as (modified − default)/default result and illustrates the impact of carbon crediting on climate change results.
When Default EF is applied (i.e., darker bars in Figure 2), only three scenarios (2A, 2B, 7) are shown to perform within a ±10% range of the conventional polyester, which is associated with 4.07 kg CO2 eq./kg fiber. All other scenarios far surpass the baseline, rising up to 7.13 kg CO2 eq./kg fiber for bio-based polyester derived from corn. Except in the case of PLA fiber, CCI is found to rise with the bio-content.
Contrary to it, Modified EF (i.e., lighter bars in Figure 2) leads to a completely different conclusion on the bio-based fibers as all perform notably better than the conventional polyester. Unlike 4.10 kg CO2 eq./kg polyester, bio-based fibers are shown to have emissions as low as 1.54 kg CO2 eq./kg fiber when crediting is applied. Furthermore, CCI decreases with the increasing bio-based content. Namely, when comparing the corresponding partially and fully bio-based scenarios (1 vs. 3, 2A vs. 4A, 2B vs. 4B, 5 vs. 6), the latter display lower climate impacts; between these scenarios, we observe that CCI decreases from 32 to 41% by substituting not only MEG/PDO but PTA as well.
Regardless of the method, we observe that Scenario 1 with a corn-derived MEG has a higher climate impact than the sugar-derived ones (2A, 2B). In comparison, such a conclusion is consistent with the finding of Shen et al.; in their cradle-to-grave study on GHG emissions, they identified that partially bio-based PET polymer from corn has higher climate results than the one from sugarcane [35]. Moreover, Anex and Ogletree [19] had found that partially bio-based PTT polymer (here comparable to Scenario 5) has emissions of 4.1 kg CO2 eq./kg polymer. Indeed, our Default EF calculations point to a comparable level of emissions (4.71 kg CO2 eq./kg fiber) for Scenario 5. Finally, Vink et al. showed that NatureWorks’ brand of PLA polymer emits 3.2 kg CO2 eq./kg polymer without and 1.3 kg CO2 eq./kg polymer with carbon crediting [27]. Their results are equally in the range of ours, as we add the melt spinning.
Furthermore, on the topic of two impact methods, darker bars in Figure 2 reflect the fossil-based process emissions in the production chain of fibers. The difference between darker and corresponding lighter bars highlights the role of CO2 sequestered from the atmosphere via crops’ photosynthesis. The gap is thus displaying the carbon capture since the sequestered C eventually ends up embedded in fiber mass. The extent of this effect is portrayed by the relative change where we see the resulting decrease in emissions. The lighter bars hence represent net CO2 eq. including all emissions and when this uptake is taken into account.
Present cradle-to-gate LCA, however, cannot account for what happens to the embedded C at the end of life. In theory, all this C (i.e., fossil-based and bio-based) is released back into the atmosphere at the end of life; as Hottle et al. [34] suggest the extension of the scope to the grave would inherently increase the net CO2 emissions relative to the present study. Accounting for the EOL of fibers is, therefore, possible through scope expansion and adding grave variants specific to the individual waste management systems. Due to the high variability of these systems, different material properties are desirable under different local circumstances and, as such, they influence the aggregate climate impact of the fibers. If there exists an incineration facility for heat and energy recovery, then a fiber with higher energy content per kg is more desirable (PET or PTT). If only composting or digestion are available in local circumstances, a biodegradable product such as PLA might be preferred over the other, non-biodegradable alternatives. If all textile waste ends up landfilled, biodegradable fiber may be the worst option due to the anaerobic conditions causing the production of methane in the body of landfill, which is far more potent than CO2 in terms of climate impacts. The final effects of applied EOL solutions on the environmental performance of fibers remain to be investigated.
Finally, since the EOL of textile products (of which fibers are a part) is not accounted for at present, our results should be interpreted solely in a way to understand the relevance of C uptake to these bio-based fibers. Conversely, as Figure 2 shows, carbon crediting alone can artificially decrease the climate impact results by up to 70% and misportray the climate impacts of the substitutes, especially knowing that effective emission will rise when the scope is enlarged.
4.3. Further Midpoint Categories
In addition to climate change, all 15 other impacts were examined in the impact assessment. Since carbon crediting affects only the emissions related to climate change, results for the remaining 15 categories are the same regardless of whether the applied EF method is modified or default. Here, 8 out of 15 most relevant categories are discussed in detail, while the remainder, which have low normalization results, can be found in Supporting information. Due to low relevance for the bio-based economy, the use of metal and mineral resources is, however, not elaborated here. Conversely, despite low normalization results, land use was still included due to its relevance in the bio-based economy in terms of agricultural surface needs. Note that any change in all the aforementioned impacts relative to Scenario 0 is still accounted for with upcoming single scores.
The said results are found to largely depend on the bio-content and crop choice. As to the former, the gravity of acidification, all three eutrophication categories, ecotoxicity, water use, and land use generally increases with the bio-content, as attested by Figure 3. As to the latter, partially bio-based polyesters derived from sugarcane have the lowest results in acidification, eutrophication, ecotoxicity and water use and are largely comparable to those of polyester. Notably, the scenarios (2A, 2B) with MEG derived from sugarcane outperform those with MEG stemming from corn (3). To recall, scenarios 2A and 2B have or stem from a useful by-product in sugar/ethanol production (bagasse and molasses), which results in shared environmental burdens among the main and by-products. Moreover, out of all scenarios, fully bio-based scenarios have the worst impact results in acidification, eutrophication categories, ecotoxicity, water use as well as land use. Finally, the use of fossil resources does not decrease substantially, nor enough to balance out the increase in other impacts. For 8 out of 9 scenarios, fossil resource use is within 85% of the fossil consumption of conventional polyester.
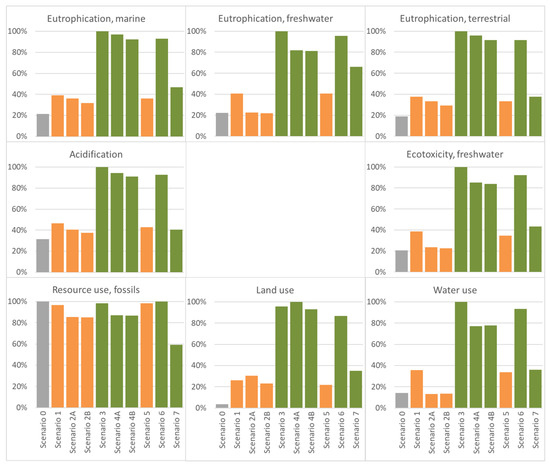
Figure 3.
Impact results for 8 chosen categories calculated with Default EF. Note that 100% of each impact category refers to the scenario with the highest results.
Conventional polyester is shown to have a better eutrophication profile than all bio-based fibers. It is identified that polyester causes eutrophication in the order of 0.17 g P eq./kg polyester (freshwater), 3 g N eq./kg polyester (marine) and 0.032 mol N eq./kg polyester (terrestrial). The said indicators increase with the bio-based content, up to 4.5, 4.7, and 5.3 times, respectively, as indicated in Figure 3. Limited comparison with previous studies is possible on this topic. An existing cradle-to-gate LCA has found that bio-based PET polymer, derived from sugarcane (comparable to Scenario 2B), has a eutrophication potential of 0.179 g P/kg polymer [24]. In our case, including melt spinning, the result for Scenario 2B amounts to 0.174 kg P eq./kg fiber. Furthermore, a recent study [25] found that freshwater and marine eutrophication increase 1.8 and 3.2 times, respectively, during manufacturing when switching from PET polymer to PLA. In our case, the increases amount to 3 times for freshwater and 2.2 times for marine eutrophication when comparing the PLA fiber (Scenario 7) to polyester (Scenario 0). The primary difference between our setups is that the said study [25] does not incorporate the transport and is elaborated on the polymer level for Europe only.
Freshwater ecotoxicity impacts for bio-based fibers resemble those of freshwater eutrophication. Corn-based bio-polyester (Scenario 3) has the poorest ecotoxicity profile, its result being 4.9 times higher than Scenario 0. Corn agriculture is characterized by the notable use of pesticides such as glyphosate or atrazine, which contribute substantially to ecotoxicity profiles (high characterization factors). Moreover, as part of the modeled corn comes the genetically modified spectrum, and the use of pesticides is even more prominent and negatively affects the environmental impacts.
Furthermore, the acidification potential increases with bio-content up to 3.2 times relative to Scenario 0. As the only recent point of reference, a study [25] also found that the acidification potential of PLA polymer increases 1.76 times relative to fossil-based PET. In our study, we find 1.3 times the difference between the two comparable fibers.
The production of conventional polyester is found to require 1.972 m3 water/kg fiber. Partially bio-based fibers derived from sugarcane have a comparable water requirement, while other bio-based scenarios require 2.3 to 7.1 times more. Fully corn-based fibers have the worst water impact profile.
Land use in bio-based fibers increases the most of all other impacts, as seen in Figure 3; bio-based fibers require 6 to 27 times more land for their production than the conventional polyester. Even though the share of agricultural land consumption which falls specifically on fiber production can be regarded as small, switching other products to bio-based alternatives will put additional stress on the available land as evident from this example. There are two major implications associated with increased land requirements—land clearing and biodiversity loss, as well as feedstock competition. Firstly, if requirements are not met by the historically cleared land, the destruction of intrinsically richer ecosystems such as forests or rainforests is foreseeable and leads to irreparable loss of biodiversity [15] in order to make a place for intensive monoculture. Amongst other ecological services such as land erosion prevention, forests are also a major carbon sink; therefore, their clearing has negative climate implications. This is increasingly important for one of the crops of choice—sugarcane grown in Brazil, where regions are particularly susceptible to deforestation to make space for the intensive agriculture. The more bio-based products are put on the market, the more first-generation feedstock is required. In the case of limited land availability, feedstock competition may be provoked as the same crops end up as non-edible products instead of as a source of food. Indirect and direct land use are, therefore, an important part of the bio-based economy with substantial ramifications that should be addressed in more detail before bolder bio-based innovation steps are taken.
Our discussion of bio-based fibers, which rely on agriculture, is complemented with an assessment of feedstock contribution (agriculture and transport) to the eight non-climate impact categories. Figure 4 shows that the feedstock determines a big part of the fibers’ impacts.
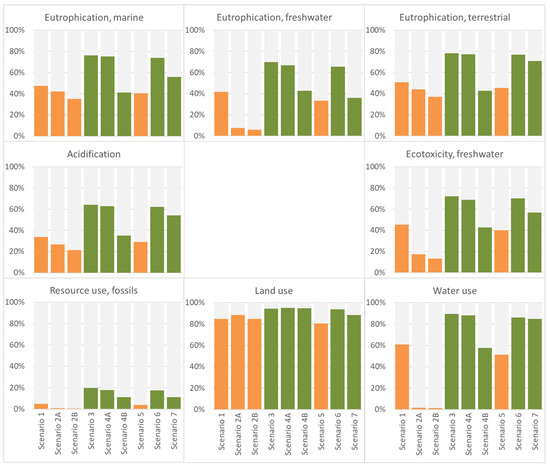
Figure 4.
Contribution of feedstock (agriculture and transport) to the resulting impacts of fibers. Note that 100% of each impact stands for the resulting impact of the fiber in question. Feedstock contributions were calculated for each scenario as (impact of the crop as per Default EF method x feedstock requirement per kg of fiber)/impact of the fiber as per Default EF method.
In most of the impacts elaborated here, Scenarios 2A and 2B are an exception to the rule. Not only do they display lower absolute impact results relative to other scenarios, but the contribution of sugarcane is also less notable than in other cases, due to the sharing of environmental burdens as explained. The relevance of feedstock in acidification, eutrophication (all three types), and ecotoxicity rises with bio-content. Terrestrial eutrophication is affected by feedstock the most—from 43% to 71% is directly tied to feedstock. Crops also account for 50–85% of water use, as a direct consequence of intensive agriculture. Land use is heavily governed by crop needs, as more than 80% of land requirements of the fiber production falls on feedstock. Finally, the results on the use of fossil resources indicate that a bulk of oil and gas consumption happens during the transformation and production processes, rather than at the feedstock stage.
4.4. Single Score Results
The aggregate environmental impacts of the fiber were examined through single scores. The results that bring all 16 impact categories together were produced with Default EF and are presented in Figure 5. When all the impacts are addressed jointly, it is shown that only partially bio-based polyesters derived from sugarcane (Scenarios 2A/2B) and PLA fiber (Scenario 7) have comparable performance to conventional polyester. Their single score results are in the ±10% range from the said baseline. Conversely, conventional polyester outperforms all other bio-based alternatives, notably all fully bio-based ones just like elaborated midpoint scores had shown. Fully bio-based polyester made from corn (Scenario 3) is characterized by the most substantial increase in environmental impact relative to polyester.
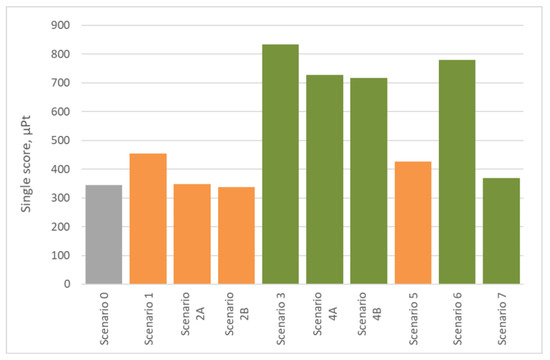
Figure 5.
The aggregate environmental impact of polyester and its bio-based substitutes. The results refer to single scores obtained with Default EF method.
The choice of the crop has a decisive impact on the aggregate performance of the fiber, owing to their different environmental intensities. Corn-derived fibers have a higher overall environmental impact relative to the corresponding sugar-derived ones as Scenarios 1 and 2A/2B show. Here, only MEG is substituted with a bio-based form, making sugarcane a better alternative than corn for MEG sourcing.
Bio-based PTA is found to have a poorer performance relative to the fossil-based version of the monomer. Due to its relevance for the bio-based C content of the polyester and PTT fibers (80% and 73% C content), the environmental performance of these bio-based fibers hinges on the development of the environmentally sound bio-PTA. On the side of LCA, it should be noted that the modeling of PTA is subject to many approximations, and to increase the accuracy, bio-PTA assessment necessitates either on-site process data or modeling in chemical engineering software. As it stands at present, an increase in the bio-based content is shown to have an adverse effect on the aggregate environmental performance of the bio-based fibers in question.
Furthermore, the lighter colored bars in Figure 6 represent the results obtained with the Modified EF method. Three substitute scenarios (2A, 2B, 7) are again shown to have comparable performance to conventional polyester. The remaining bio-based scenarios again show a poorer overall environmental performance, with an increase in the bio-based content resulting in a bigger gap between the two methods. For each scenario, the entire score gap between modified and default EF results stems from the difference in the climate impacts due to carbon crediting.
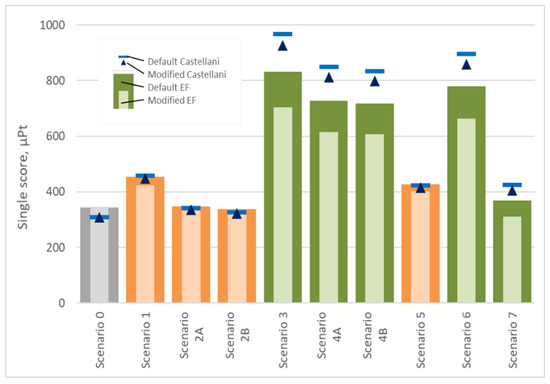
Figure 6.
Sensitivity analysis of single score results with distance-to-target (Castellani) weights. The results refer to single scores obtained with Default EF (darker bars), Modified EF (lighter bars), Default Castellani (line), Modified Castellani (triangle) methods.
As a final step, in order to corroborate that non-climate impacts of fibers are highly relevant to the overall environmental performance, we performed a sensitivity analysis of single scores. We applied European distance-to-policy-target weighting factors for the Default Castellani and the Modified Castellani methods (see Materials and Methods). Notably, we find that trends stay largely the same—bio-content in linked to poorer performance of the bio-based fibers, while the gravity of the performance gap increases. Distance-to-target weights show that when climate change is given less priority, the aggregate impacts of the bio-based fibers in fact increase, which demonstrates that the substitution of polyester by bio-based alternatives goes against achieving environmental targets of the EU.
The reduction in carbon footprint which is achieved through bio-sourcing (and shown through the bar difference) applies only in circular economy systems, where material recycling, product durability, and increased life span will sustain the carbon reduction over a longer period until EOL management. In European countries, incineration for energy recovery is a highly plausible scenario for a wide array of textile products, whereby bio-C ends up in the atmosphere as CO2 after burning. The final climate performance of intermediaries such as fibers is contingent on the textile products which they form. Notably, in the case of durable, long-life textile products (e.g., carpets), the carbon in the bio-based product’s structure is released back into the atmosphere further down the timeline. These products may therefore bring the benefit of carbon capture. Conversely, when fibers form fast fashion products, this is lost due to the associated short use and fast disposal. All the C is rapidly released back into the atmosphere without a “grace period” on carbon emissions. Considering that polyester is a fiber inherently linked to fast fashion [49], the examined bio-based substitutes are likely to serve in fast fashion applications. Consequently, their climate impacts have to be interpreted in accordance with their future application.
As for recycling, by keeping these products in a closed-loop system, life is inevitably prolonged. In the textile sector, the mechanical recycling of conventional as well as drop-in polyester fibers in closed loop is not common. In fact, current recycled polyester is a method of down-cycling PET bottles; therefore, conventional recycled polyester itself presents the second life of PET. In the case of the recycling of substitute fibers, if the efforts of their recycling are too high, then the impacts of closed loops can end up being negative. At present, we do not dispose of enough evidence on the burdens of polyester recycling.
Further, on the topic of recycling and circular economy, the present LCA does not fully cover the issues of public perception, corporate communication, or greenwashing. The term “bio” was shown to be innately associated with a better environmental performance of the products [32] even though our results point to different conclusions. People may associate “bio-based” with a long-term solution to the textile waste problem and microplastic pollution, the effects of which have not yet been investigated. Not all bio-based textiles are biodegradable, nor does the reverse apply. Even when a product has the potential of being biodegradable (PLA), whether it actually does will depend on a number of environmental conditions and the waste management facilities. After all, bio-based synthetic fibers remain synthetics, requiring chemical engineering to convert the feedstock, whatever the perception around them may be.
5. Conclusions
The here summarized project performed a comparative LCA of fossil-based polyester (originating from fossil-based PET) and its bio-based substitutes—i.e., bio-polyester (drop-in), PTT fiber (smart drop-in), and PLA fiber (novel). All of the aforementioned fibers are produced here by melt spinning the homonymous polymers. Currently, all state-of-the-art production processes of these bio-based substitutes use first-generation feedstock, i.e., crops, predominantly corn and sugarcane. Production pathways of bio-based and fossil-based PET and PTT are found to have significant overlaps, which is a strong point for the use and retrofitting of the existing production capacities.
As for the impact assessment, several common trends are observed across all presently examined fibers. Only three out of nine substitutes are found to be in the range of polyester, based on the overall scores (Default EF). The remainder offer no real environmental advantage since single scores are higher than for the incumbent. Moreover, the performance of bio-polyester and PTT fibers is shown to be strongly influenced by the profile of bio-PTA since this monomer accounts for a prevailing part of their C contents. More accurate modeling of PTA is therefore necessary for the future.
We find that conclusions on climate results significantly depend on whether carbon crediting is applied or not. Climate impacts decrease for the same fiber up to 70% when biogenic carbon is accounted for. However, for this reduction to hold in the long(er) term, circular economy principles are mandatory. Otherwise, carbon crediting may end up as a method that artificially reduces the climate impacts of bio-based products as previously suggested.
We also show that highly relevant impacts for all examined bio-based fibers are acidification, eutrophication (terrestrial, marine, freshwater), ecotoxicity, land and water use. Their impacts are found to rise with an increasing bio-content, while a sizeable part of the aforementioned impacts is directly linked to the used feedstock. Our study thus confirms that the adverse effects of bio-sourcing on non-climate impact categories are overlooked if not accounted for. Finally, the consumption of fossil resources is shown to drop only slightly relative to conventional polyester, by which we also show that the fossil-fuel dependency of the process chain does not decrease simply by a change to bio-based starting materials. In order to mitigate the adverse effects of bio-sourcing, we identify three major options—search for other functional substitutes of polyester, revert to feedstock diversification or improve the agricultural practices. In the first case, other bio-based fibers with favorable material properties should be considered, e.g., polyethylene furanoate. In the second case, the so-called second-generation feedstock should be considered and involves lingo-cellulosic waste and products such as wood mass, stalks, leaves, etc. As of yet, all the processes using such feedstock are only at the very beginning of development, and it will take significant time to catch up with present processes, based on first feedstock generation. In the last case, the environmental intensity of agriculture is to be mitigated by reducing the use and pollution of water and the use of pesticides and fertilizers, all of which are linked with acidification, eutrophication, and ecotoxicity. While the first strategy may have positive consequences on the plastic and textiles sectors, the mitigation of agricultural impacts should have a spill-over effect on all domains of the bio-based economy.
In summary, taking into account the constraint of this research and the currently available technologies, this project identified important implications for bio-based textiles. Bio-based alternatives are found to be environmentally uncompetitive with conventional polyester. When European distance-to-target weights are applied, bio-based products are found to be counterproductive in mitigating environmental impacts. From a strictly environmental perspective, moving to bio-based synthetics still asks for several optimizations and improvements. As long as they stay predominantly “agro-based”, their use as “green” substitutes for polyester is scientifically unfounded.
Supplementary Materials
The following are available online at https://www.mdpi.com/article/10.3390/app11072993/s1. Tables S1–S9: LCI data; Figure S1: LCI data; Tables S10–S13: LCA mid-point results; Table S14: LCA single score results.
Author Contributions
Conceptualization, all authors; methodology, R.H. and T.I.; formal analysis, T.I.; investigation, T.I.; data curation R.H. and T.I.; writing—original draft preparation, T.I.; writing—review and editing, all authors; visualization, T.I. and R.H.; supervision, C.S.; project administration, C.S. All authors have read and agreed to the published version of the manuscript.
Funding
This research received no external funding.
Institutional Review Board Statement
Not applicable.
Informed Consent Statement
Not applicable.
Data Availability Statement
Data used in this study is available in the supplementary materials.
Acknowledgments
This publication is based on the master thesis “Life cycle assessment of bio-based synthetic fibers: the case of polyester substitutes” conducted by Tijana Ivanović in 2020 in collaboration between EMPA and Ecole polytechnique fédérale de Lausanne (EPFL). We would sincerely like to thank Philippe Thalmann and Vincent Moreau for the contribution during their time as the academic supervisors of this project.
Conflicts of Interest
The authors declare no conflict of interest.
References
- Claudio, L. Waste Couture Environmental of the Clothing Industry. Environ. Heal. Perspect. 2007, 115, A449–A454. [Google Scholar] [CrossRef] [PubMed]
- Quantis. Measuring Fashion: Environmental Impact of the Global Apparel and Footwear Industries Study; 2018; Available online: https://quantis-intl.com/wp-content/uploads/2018/03/measuringfashion_globalimpactstudy_full-report_quantis_cwf_2018a.pdf (accessed on 28 January 2021).
- Nathani, C.; Frischknecht, R.; Hellmüller, P.; Alig, M.; Stolz, P.; Tschümperlin, L. Environmental Hotspots in the Supply Chain of Swiss Companies; Rütter Soceco AG & treeze Ltd.: Rüschlikon, Switzerland, 2019. [Google Scholar]
- Textile Exchange, Preferred Fiber & Materials Market Report 2019; Textile Exchange: Guangzhou, China, 2019; pp. 1–87. Available online: https://store.textileexchange.org/product/2019-preferred-fiber-materials-report/ (accessed on 14 January 2021).
- Peters, J.; Simaens, A. Integrating sustainability into corporate strategy: A case study of the textile and clothing industry. Sustainability 2020, 12, 6125. [Google Scholar] [CrossRef]
- Babu, R.P.; O’Connor, K.; Seeram, R. Current progress on bio-based polymers and their future trends. Prog. Biomater. 2013, 2, 8. [Google Scholar] [CrossRef] [PubMed]
- Lambert, S.; Wagner, M. Environmental performance of bio-based and biodegradable plastics: The road ahead. Chem. Soc. Rev. 2017, 46, 6855–6871. [Google Scholar] [CrossRef]
- European Commission Bio-Based Products. Available online: https://ec.europa.eu/growth/sectors/biotechnology/bio-based-products_en (accessed on 20 January 2021).
- Shen, L.; Worrell, E.; Patel, M. Present and future development in plastics from biomass. Biofuels Bioprod. Biorefining 2010, 4, 25–40. [Google Scholar] [CrossRef]
- Carus, M.; Dammer, L.; Puente, Á.; Raschka, A.; Arendt, O. Bio-Based Drop-in, Smart Drop-in and Dedicated Chemicals; 2017; Available online: https://www.roadtobio.eu/uploads/news/2017_October/RoadToBio_Drop-in_paper.pdf (accessed on 15 December 2020).
- Textile Exchange. Quick Guide To Biosynthetics; 2018; Available online: https://textileexchange.org/wp-content/uploads/2018/01/Textile-Exchange-Quick-Guide-To-Biosynthetics-2018.pdf (accessed on 13 January 2021).
- Sattler, H.; Schweizer, M. Fibers, 5. Polyester Fibers. Ullmanns Encycl. Ind. Chem. 2011. [Google Scholar] [CrossRef]
- Chan, C.H.; Thomas, S. Poly(Trimethylene Terephthalate) –The New Generation of Engineering Thermoplastic Polyester; Polyester, InTech-Open Access Publisher: London, UK, 2012. [Google Scholar]
- Liu, H.; Xu, Y.; Zheng, Z.; Liu, D. 1,3-Propanediol and its copolymers: Research, development and industrialization. Biotechnol. J. 2010, 5, 1137–1148. [Google Scholar] [CrossRef]
- European Commission. Bio-based economy for Europe: State of play and future potential—Part 2: Summary of position papers received in response to the European Commission’s Public on-line Consultation. Biotechnology 2011, 92. [Google Scholar] [CrossRef]
- Rebitzer, G.; Ekvall, T.; Frischknecht, R.; Hunkeler, D.; Norris, G.; Rydberg, T.; Schmidt, W.P.; Suh, S.; Weidema, B.P.; Pennington, D.W. Life cycle assessment Part 1: Framework, goal and scope definition, inventory analysis, and applications. Environ. Int. 2004, 30, 701–720. [Google Scholar] [CrossRef]
- Volanti, M.; Cespi, D.; Passarini, F.; Neri, E.; Cavani, F.; Mizsey, P.; Fozer, D. Terephthalic acid from renewable sources: Early-stage sustainability analysis of a bio-PET precursor. Green Chem. 2019, 21, 885–896. [Google Scholar] [CrossRef]
- Akanuma, Y.; Selke, S.E.M.; Auras, R. A preliminary LCA case study: Comparison of different pathways to produce purified terephthalic acid suitable for synthesis of 100 % bio-based PET. Int. J. Life Cycle Assess. 2014, 19, 1238–1246. [Google Scholar] [CrossRef]
- Anex, R.P.; Ogletree, A.L. Life-cycle assessment of energy-based impacts of a biobased process for producing 1,3-propanediol. ACS Symp. Ser. 2006, 921, 222–238. [Google Scholar] [CrossRef]
- Urban, R.A.; Bakshi, B.R. 1,3-Propanediol from fossils versus biomass: A life cycle evaluation of emissions and ecological resources. Ind. Eng. Chem. Res. 2009, 48, 8068–8082. [Google Scholar] [CrossRef]
- DuPont Tate & Lyle Bio Products company. Life Cycle Analysis Overview—Susterra Propanediol; 2018; Available online: https://api.duponttateandlyle.com/sites/default/files/2019%20Susterra%28r%29%20Propanediol%20Life%20Cycle%20Analysis%20Overview_1.pdf (accessed on 21 January 2021).
- Semba, T.; Sakai, Y.; Sakanishi, T.; Inaba, A. Greenhouse gas emissions of 100% bio-derived polyethylene terephthalate on its life cycle compared with petroleum-derived polyethylene terephthalate. J. Clean. Prod. 2018, 195, 932–938. [Google Scholar] [CrossRef]
- Tabone, M.D.; Cregg, J.J.; Beckman, E.J.; Landis, A.E. Sustainability metrics: Life cycle assessment and green design in polymers. Environ. Sci. Technol. 2010, 44, 8264–8269. [Google Scholar] [CrossRef]
- Tsiropoulos, I.; Faaij, A.P.C.; Lundquist, L.; Schenker, U.; Briois, J.F.; Patel, M.K. Life cycle impact assessment of bio-based plastics from sugarcane ethanol. J. Clean. Prod. 2015, 90, 114–127. [Google Scholar] [CrossRef]
- Rybaczewska-Błażejowska, M.; Mena-Nieto, A. Circular economy: Comparative life cycle assessment of fossil polyethylene terephthalate (PET) and its recycled and bio-based counterparts. Manag. Prod. Eng. Rev. 2020, 11, 121–128. [Google Scholar] [CrossRef]
- Vink, E.T.H.; Davies, S. Life Cycle Inventory and Impact Assessment Data for 2014 Ingeo® Polylactide Production. Ind. Biotechnol. 2015, 11, 167–180. [Google Scholar] [CrossRef]
- Vink, E.T.H.; Davies, S.; Kolstad, J.J. The eco-profile for current Ingeo® polylactide production. Ind. Biotechnol. 2010, 6, 212–224. [Google Scholar] [CrossRef]
- Chen, L.; Pelton, R.E.O.; Smith, T.M. Comparative life cycle assessment of fossil and bio-based polyethylene terephthalate (PET) bottles. J. Clean. Prod. 2016, 137, 667–676. [Google Scholar] [CrossRef]
- Koch, D.; Mihalyi, B. Assessing the change in environmental impact categories when replacing conventional plastic with bioplastic in chosen application fields. Chem. Eng. Trans. 2018, 70, 853–858. [Google Scholar] [CrossRef]
- Gironi, F.; Piemonte, V. Life Cycle Assessment of Polylactic Acid and Polyethylene Terephthalate Bottles for Drinking Water. Environ. Prog. Sustain. Energy 2011, 30, 459–468. [Google Scholar] [CrossRef]
- Groot, W.J.; Borén, T. Life cycle assessment of the manufacture of lactide and PLA biopolymers from sugarcane in Thailand. Int. J. Life Cycle Assess. 2010, 15, 970–984. [Google Scholar] [CrossRef]
- Walker, S.; Rothman, R. Life cycle assessment of bio-based and fossil-based plastic: A review. J. Clean. Prod. 2020, 261, 1–15. [Google Scholar] [CrossRef]
- Hottle, T.A.; Bilec, M.M.; Landis, A.E. Sustainability assessments of bio-based polymers. Polym. Degrad. Stab. 2013, 98, 1898–1907. [Google Scholar] [CrossRef]
- Hottle, T.A.; Bilec, M.M.; Landis, A.E. Biopolymer production and end of life comparisons using life cycle assessment. Resour. Conserv. Recycl. 2017, 122, 295–306. [Google Scholar] [CrossRef]
- Shen, L.; Worrell, E.; Patel, M.K. Comparing life cycle energy and GHG emissions of bio- based PET, recycled PET, PLA, and man-made cellulosics. Biofuels Bioprod. Biorefining 2012, 6, 625–639. [Google Scholar] [CrossRef]
- Castellani, V.; Benini, L.; Sala, S.; Pant, R. A distance-to-target weighting method for Europe 2020. Int. J. Life Cycle Assess. 2016, 21, 1159–1169. [Google Scholar] [CrossRef]
- Gubbels, E.; Heitz, T.; Yamamoto, M.; Chilekar, V.; Zarbakhsh, S.; Gepraegs, M.; Köpnick, H.; Schmidt, M.; Brügging, W.; Rüter, J.; et al. Polyesters. Ullmann’s Encycl. Ind. Chem. 2018. [Google Scholar] [CrossRef]
- IEA-ETSAP, IRENA. Production of Bio-Ethylene; 2013; Available online: https://irena.org/-/media/Files/IRENA/Agency/Publication/2013/IRENA-ETSAP-Tech-Brief-I13-Production_of_Bio-ethylene.pdf (accessed on 21 December 2020).
- Gustafson, C.; Fewell, J. Ethanol Production-Dry Versus Wer Grind Process. Available online: https://www.ag.ndsu.edu/energy/biofuels/energy-briefs/ethanol-production-dry-versus-wet-grind-processing (accessed on 8 December 2020).
- Liptow, C.; Tillman, A.M. A Comparative Life Cycle Assessment Study of Polyethylene Based on Sugarcane and Crude Oil. J. Ind. Ecol. 2012, 16, 420–435. [Google Scholar] [CrossRef]
- Siracusa, V.; Blanco, I. Bio-Polyethylene (Bio-PE), Bio-Polypropylene (Bio-PP) and Bio-Poly(ethylene terephthalate) (Bio-PET): Recent Developments in Bio-Based Polymers Analogous to Petroleum-Derived Ones for Packaging and Engineering Applications. Polymers 2020, 12, 1641. [Google Scholar] [CrossRef] [PubMed]
- Peters, M.W.; Taylor, J.D.; Jenni, M.M.; Manzer, L.E.; Henton, D.E. (Gevo)Integrated Process To Selectively Convert renewable Isobutanol to P-Xylene. US 2011/0087000 A1, 14 April 2011. [Google Scholar]
- Samudrala, S.P. Glycerol Transformation to Value-Added 1,3-Propanediol Production: A Paradigm for a Sustainable Biorefinery Process, Glycerine Production and Transformation—An Innovative Platform for Sustainable Biorefinery and Energy, Marco Frediani, Mattia Bartoli and Luca Rosi. IntechOpen 2019. [Google Scholar] [CrossRef]
- European Commission. Environmental Factsheet: 1,3-Propanediol; Available online: https://ec.europa.eu/jrc/sites/jrcsh/files/BISO-EnvSust-Bioproducts-13PDO_140930.pdf (accessed on 14 January 2021).
- Gupta, B.; Revagade, N.; Hilborn, J. Poly(lactic acid) fiber: An overview. Prog. Polym. Sci. 2007, 32, 455–482. [Google Scholar] [CrossRef]
- Kabasci, S. Bio-Based Plastics: Materials and Applications; John Wiley and Sons: Hoboken, NJ, USA, 2014; ISBN 978-1-119-99400-8. [Google Scholar]
- Niaounakis, M. Biopolymers: Processing and Products; William Andrew Publishing: Amsterdam, The Netherlands, 2015; ISBN 9780323266987. [Google Scholar]
- Vink, E.T.H.; Rábago, K.R.; Glassner, D.A.; Gruber, P.R. Applications of life cycle assessment to NatureWorksTM polylactide (PLA) production. Polym. Degrad. Stab. 2003, 80, 403–419. [Google Scholar] [CrossRef]
- Changing Markets Foundation. Fossil Fashion. The Hidden Reliance of Fast Fashion on Fossil Fuels; 2021; Available online: http://changingmarkets.org/wp-content/uploads/2021/01/FOSSIL-FASHION_Web-compressed.pdf (accessed on 15 February 2021).
Publisher’s Note: MDPI stays neutral with regard to jurisdictional claims in published maps and institutional affiliations. |
© 2021 by the authors. Licensee MDPI, Basel, Switzerland. This article is an open access article distributed under the terms and conditions of the Creative Commons Attribution (CC BY) license (http://creativecommons.org/licenses/by/4.0/).