Article

Enhancement of Optical Chirality Using Metasurfaces for Enantiomer-Selective Molecular Sensing

School of Electrical Engineering, Korea University, 145, Anam-ro, Seoungbuk-gu, Seoul 02841, Korea
*
Author to whom correspondence should be addressed.
Appl. Sci. 2021, 11(7), 2989; https://doi.org/10.3390/app11072989
Submission received: 15 February 2021 / Revised: 12 March 2021 / Accepted: 19 March 2021 / Published: 26 March 2021
(This article belongs to the Special Issue Photonics in BioMedical Progress)

Abstract

:
Circular dichroism (CD) is a physical property observed in chiral molecules by inducing the difference of absorption between left- and right-handed circularly polarized light (CPL). Circular dichroism spectroscopy is widely used in the field of chemistry and biology to distinguish the enantiomers, which typically show either positive or severe side effects in biological applications depending on the molecular structures’ chirality. To effectively detect the chirality of molecules, diverse designs of nanostructured platforms are proposed based on optical resonances that can enhance the optical chirality and amplify the signal of circular dichroism. However, the underlying physics between the optical chirality and the resonance in a nanostructure is largely unexplored, and thus designing rules for optimal chiral detection is still elusive. Here, we carry out an in-depth analysis of chiral enhancement (C enhancement) in nanostructured surfaces to find the relationship between optical resonances and chirality. Based on the relations, we optimize the nanostructured metasurface to induce effective chiral detection of enantiomers for diverse conditions of molecule distribution. We believe that the proposed designing rules and physics pave the important pathway to enhance the optical chirality for effective circular dichroism spectroscopy.

1. Introduction

Chirality refers to the property that an object cannot be superimposed with its mirror image [1,2]. Chirality is an observable property in diverse molecules and plays a crucial role in determining the molecules’ chemical and biological properties, which are important in the fields of life science, analytical chemistry, biochemistry, and medicine [3,4,5,6]. One of the most representative examples of chiral structures is the enantiomers that are mirror images of each other. Although they exhibit the same molecular formula, the response of each molecule has either a positive or a severe side effect in biology. The need for developing technology to distinguish such chiral molecules has been noticed since the discovery that the enantiomer of thalidomide, which was sold as an anti-morning drug in the 1950s, caused birth defects and malformed babies. Circular dichroism (CD) spectroscopy utilizes different reactivity to circularly polarized light (CPL) with opposite handedness in chiral molecules, and it is used to distinguish two optical isomers [7,8]. However, it still remains challenging to effectively distinguish chirality using CD signals due to most enantiomers’ weak chiroptical reactivity to the light.
To overcome such limitations, significant research is conducted to develop the platform of CD spectroscopy for the effective enhancement of chiroptical signal. Researchers have explored and designed various nanostructures to study the novel light-matter interactions in the form of chirality into two distinct classes. In one class, nanostructures with intrinsic chiral geometry are designed and studied to enhance CD signals induced by the nanostructure itself. In the other class, achiral nanostructures exhibiting mirror symmetry are exploited, which amplify the optical chirality of orthogonally polarized incident light equally. The former approach helps the researchers to elucidate the mechanism and how the CPL interact differently in chiral nanostructures [9,10,11,12,13]; however, the intrinsic chiral geometry in such nanostructure severely distorts and eludes the detection of the target molecules’ chirality, which is not appropriate for the CD spectroscopy. In the latter approach, on the other hand, diverse methods of achiral nanostructures are developed as a platform to amplify the optical chirality [14,15,16,17,18,19,20,21], which affords effective detection of enantiomers with enhanced CD signals and provides tremendous opportunities for developing novel CD spectroscopy by optimizing the nanostructures. It typically requires two crucial conditions to enhance chirality in achiral nanostructures; optimal phase difference between the electric and magnetic fields of CPL and significant amplification of the field. To achieve these, various designs of metasurfaces are proposed to secure a high-field value and to induce an appropriate phase difference by driving strong light-matter interaction, such as plasmonics [9,10,11,13,22,23,24] or dielectric resonances [14,16,17,18,20,21,25,26]. For example, a nanodimer structure that invokes strong field concentration facilitates the strong enhancement of optical chirality in the gap regions [27,28,29] and even the dynamic tuning of the chiral signal is possible using an electrically tunable metasurface [23]. Despite such progress, the underlying physics of the relation between chiral enhancement (C enhancement) and geometric design of resonant nanostructures is still elusive, and thus the in-depth understanding of chiroptical response in a nanostructured surface is essential to pave a pathway of realizing efficient CD spectroscopy.
In this paper, we explore the design of nanostructured surfaces, i.e., metasurfaces, by investigating the interaction between electric and magnetic resonances in diverse unit structures. The core novelty of this work is that we comparably analyze the underlying physical mechanism of the optical chirality in various nanostructures to optimize and elucidate the relation between the resonances and their relative phase for the C enhancement. With this, we design a set of metasurfaces for effective chiral detection in the diverse conditions of molecular distribution, i.e., located in local hotspots or the overall surface area.

2. Theory and Simulation Methods

We carry out a numerical analysis based on the finite-difference time-domain (FDTD) method. The nanostructured crystal silicon (Si) is placed in the three-dimensional simulated space with the boundaries in all directions set as a perfectly matched layer (PML). The total-field scatter-field (TFSF) light source with specific polarization is normally incident to the nanostructure, and the condition for optimal C enhancement is derived by rigorously analyzing the simulated parameters.
To demonstrate the impact of geometric features in the metasurface on C enhancement, we investigate the resonances in various nanostructures induced by the oscillations of electric and magnetic dipoles. 
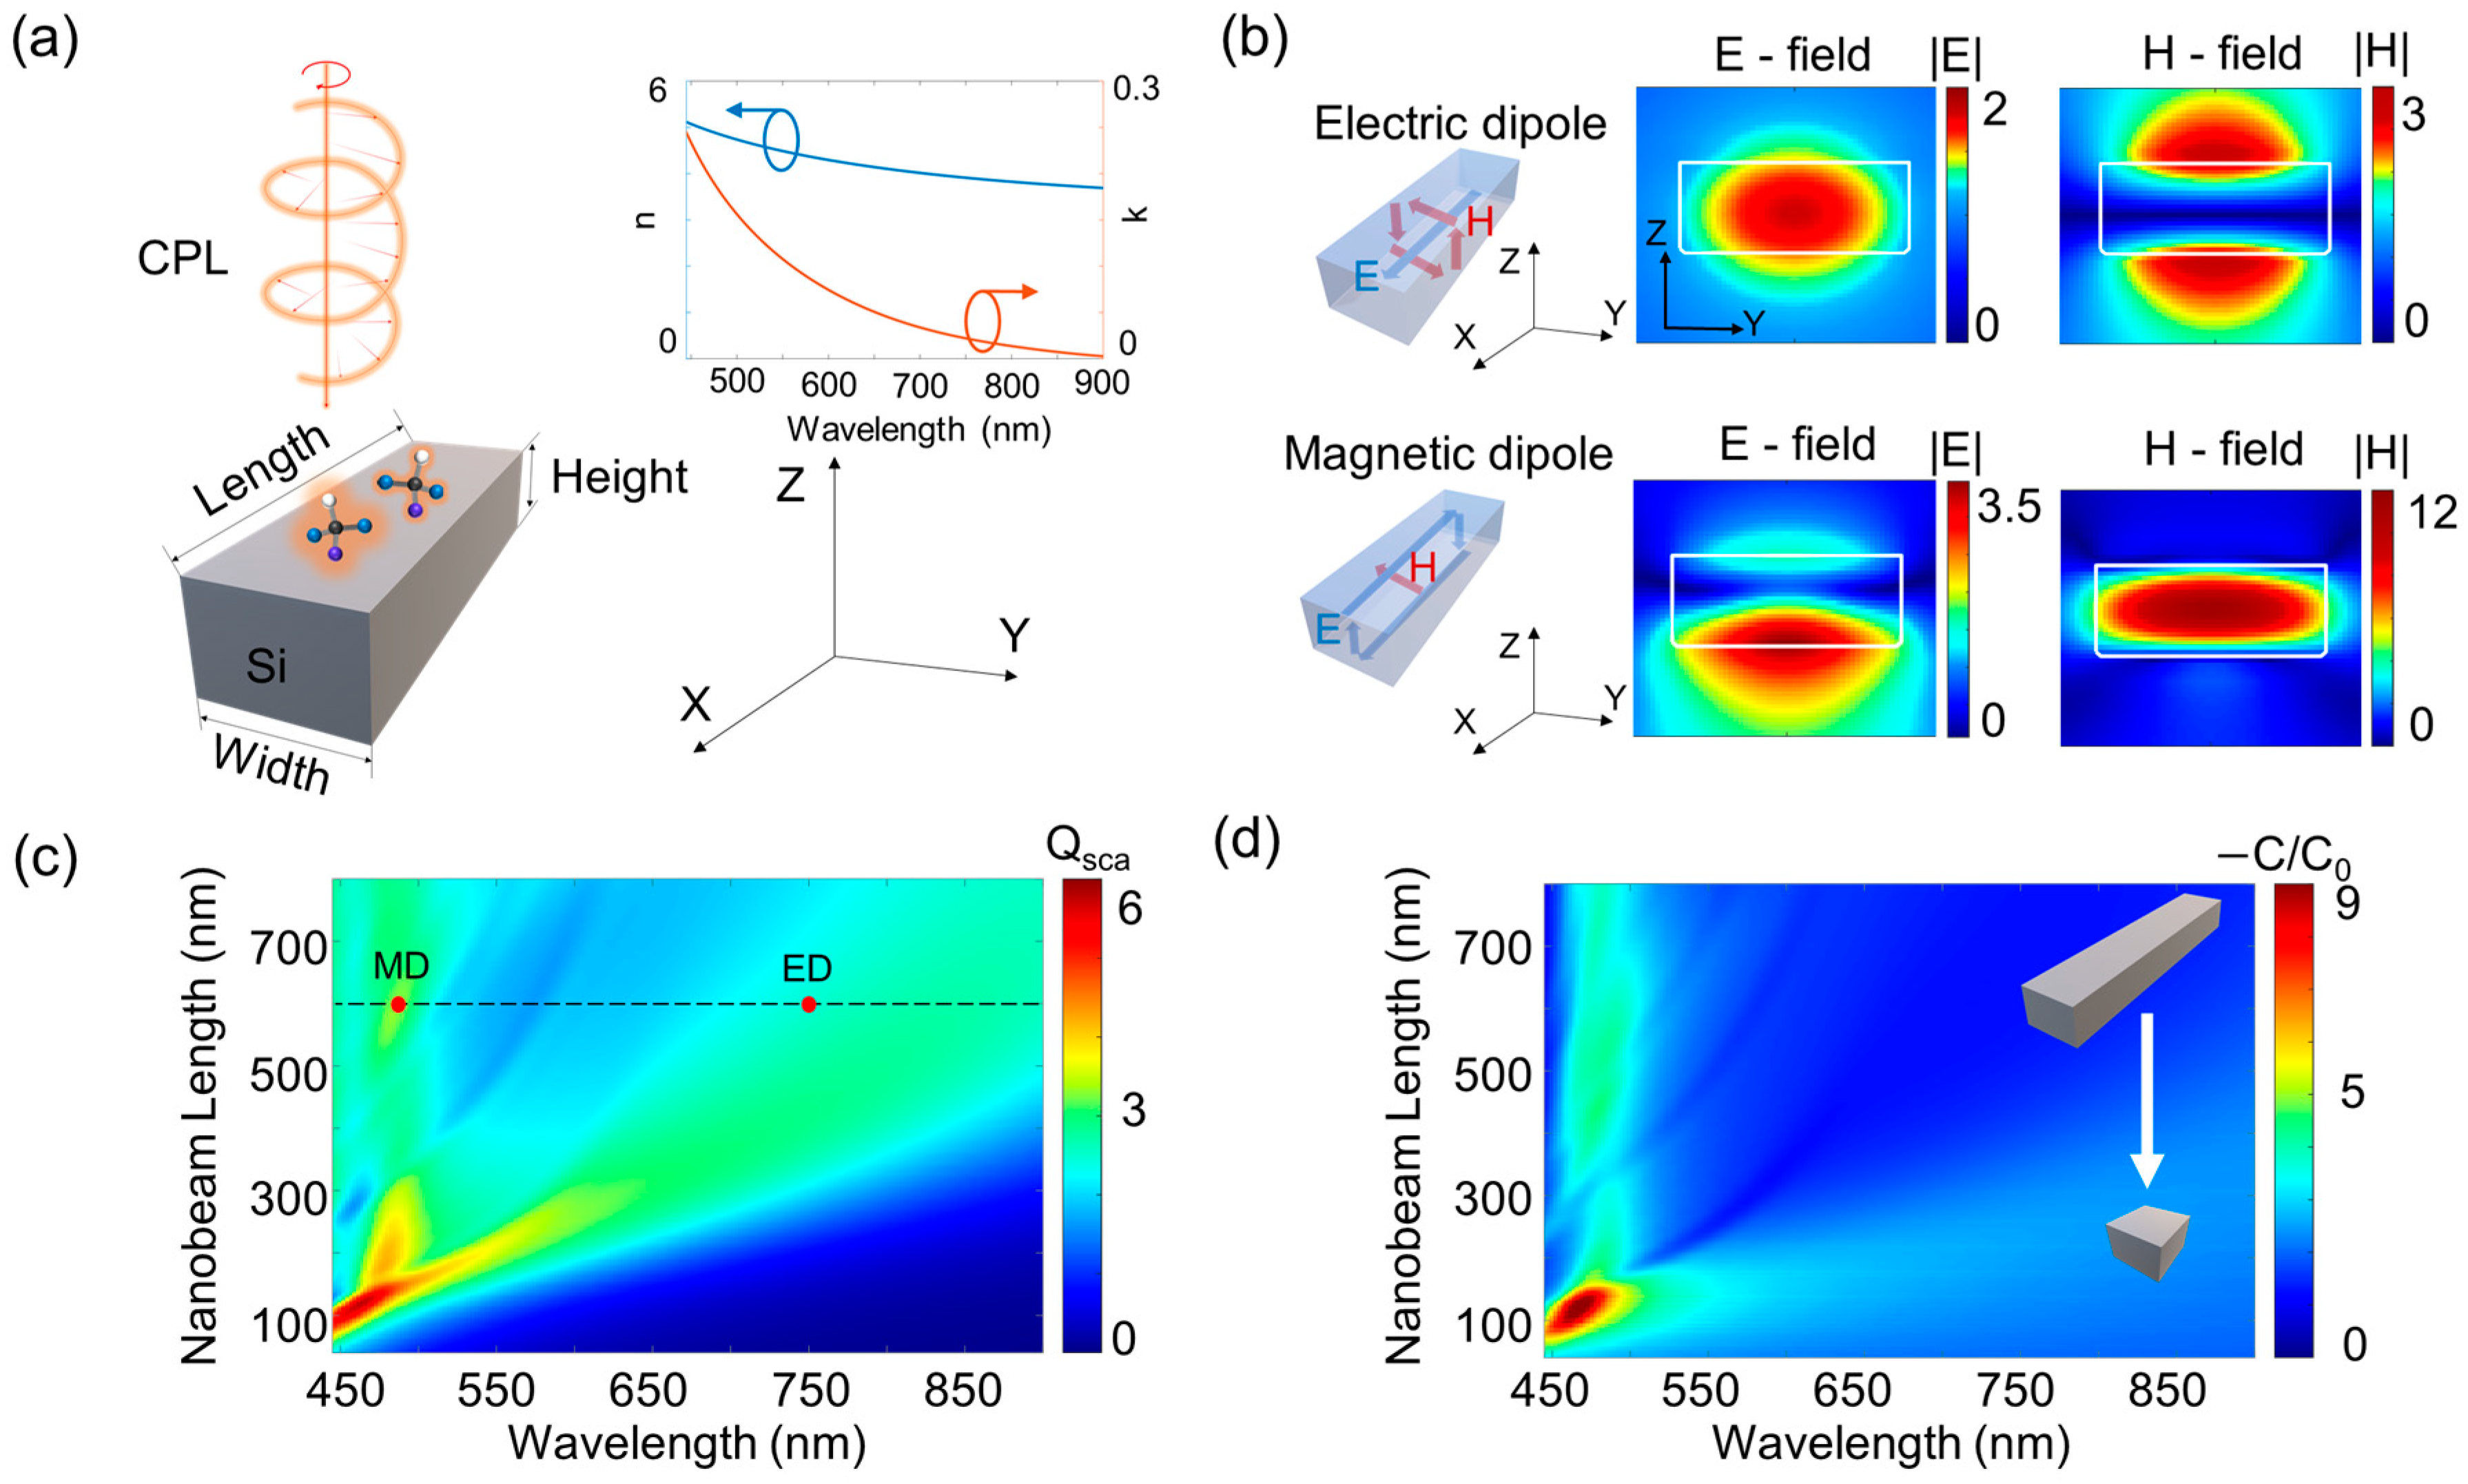
Figure 1a shows a schematic of a Si nanorod with a constant cross-sectional area under incident light directed to z-direction. The refractive index of crystal Si in the simulation is plotted in the inset of Figure 1a based on the value from palik [30]. By the repeated simulations, the origin of chirality is analyzed based on the resonances of a nanostructure to find the general trend that the squared nanoblock with an aspect ratio of similar width and length shows superior performance to the nanorods with a high aspect ratio. To prove this, we set the simulation to observe the relationship of resonances and chirality as the length of a nanostructure changes, and the height and width fixed to be 60 nm and 125 nm, respectively. The chirality for the tuning height or width of a nanostructure is additionally presented in supplementary note 1 and 2.
Figure 1c demonstrates a numerically simulated map of the scattering efficiency (Qsca) of Si nanostructures under the incident light of right-handed circular polarization. The scattering efficiency is defined as the ratio of scattered cross-section to the geometrical cross-section of the nanostructure. As shown in the figure, there are two resonance modes induced by the oscillations of the electric dipole (ED) and the magnetic dipole (MD), which are highlighted as the bands of enhanced Qsca. To confirm these dipole resonances, the profiles of electric and magnetic fields for each resonant wavelength are visualized in Figure 1b for the representative geometric structure. The length of the nanorod is fixed to be 600 nm as indicated by the condition of the black dotted line in Figure 1c, and the field profiles for the resonances of the ED and the MD are monitored at the wavelength of 475 nm and 750 nm, respectively. To confirm the resonance mode of the dipoles, light is illuminated with the polarization parallel to the x-axis. The electric and magnetic fields at the cross-sectional area of the nanorod, i.e., viewed from the direction of the x-axis, show the maximum value at the center of the area by the strong dipole resonances. We also theoretically conducted an analysis to verify that the overlap of the ED and the MD occurs, which can be confirmed in supplementary note 3.
The wavelength of the resonances is effectively tuned as the length of the nanorod changes, which is illustrated in Figure 1c, and interestingly, the tuning trend of such dipole resonances significantly differs from each other. The resonant wavelength of MD mode is rarely shifted and remains as a constant value (λ0 = 475 nm), even when the length of the nanorod varies significantly. It is also noteworthy that the spectral linewidth is narrower than the linewidth of ED mode. Additionally, the slight undulation of the magnitude of Qsca along the vertical region can be explained by the 0-order longitudinal Fabry–Perot (FP) resonance supported by the two reflective-end faces of the nanorod [31].
On the other hand, the resonant wavelength for the ED mode varies significantly. The resonance of ED mode can be extensively adjusted over the broad spectral range of visible and near-infrared wavelength from 750 nm to 475 nm by tuning the length of the nanostructure from 600 nm to 125 nm. Ultimately, as the length reduces to approximately 125 nm, the ED and MD modes overlap spatially and spectrally, with the magnitude of resonance being twice the magnitude of individual resonance.
The overlap of resonances in squared-silicon nanoblocks induces the Kerker effect [32,33], which facilitates the effective enhancement of optical chirality. To verify this, the enhancement of optical chirality for the continuously tuned lengths of the nanostructure is analyzed as exhibited in Figure 1d, which features significant C enhancement when the ED and MD resonances overlap. Note that the trend of such overlap and the nanostructure’s design for C enhancement is possible using various materials and a wide range of spectrums depending on target molecules. In addition, diverse shapes of nanostructures that feature rotation symmetry and induce the overlap of the resonances can effectively function for C enhancement, as studied in supplementary note 4.
Note that the optical C enhancement is defined as the optical chiral density (C) divided by the chirality in free space (C0), i.e., C 0 = ± ω ε 0 | E | 2 / ( 2 c ) , where c is the speed of light in a vacuum, and the plus or minus sign indicates right- or left-handedness, respectively, and ω , ε 0 , and E are the angular frequency of light, the permittivity of free space, and the complex electric field. The optical chiral density in a nanostructure is defined as [16,34,35]
C = ε 0 2 E · ( × E ) + 1 2 μ 0 B · ( × B ) = ω ε 0 2 I m ( E * · B ) = ω 2 c 2 | E | | H | cos ( β i E , H )
where E (E) and H (H) represent the real (complex) electric and magnetic fields, and μ 0 and B(= μ 0 H) is the permeability of a vacuum and magnetic flux, respectively. Since the chiroptical reactivity of a chiral molecule is weak, distinguishing the enantiomer without signal amplification, i.e., without C enhancement, is more difficult, which typically requires significant molecular density. Thus, the enhancement of optical chirality in a devise amplifies and increases the circular dichroism (CD) signal, which allows the effective sensing of chiral molecules with less molecular density.
The optical C enhancement (C/C0) is calculated in the regions around the surface of a nanostructure with the thickness of 10 nm. Only a certain volume is included in the calculation area on surfaces, excluding the interior of the structure because molecules may exist through the surface, not inside the platform. The sensing of molecules on the surface of the platform requires amplification of the CD signal, which is enhanced by the C enhancement value. Based on the equation, two crucial conditions have to be satisfied to achieve effective C enhancement: the overlap of electric and magnetic fields with the relative phase difference that affords the magnitude of cos ( β i E ,   H ) being close to unity, which implies the preservation of the circular polarization state.

3. Results and Discussion

To understand the working principle of the enhancement of optical chirality, we analyze the underlying physical mechanism of the resonances in two representative nanostructures. 
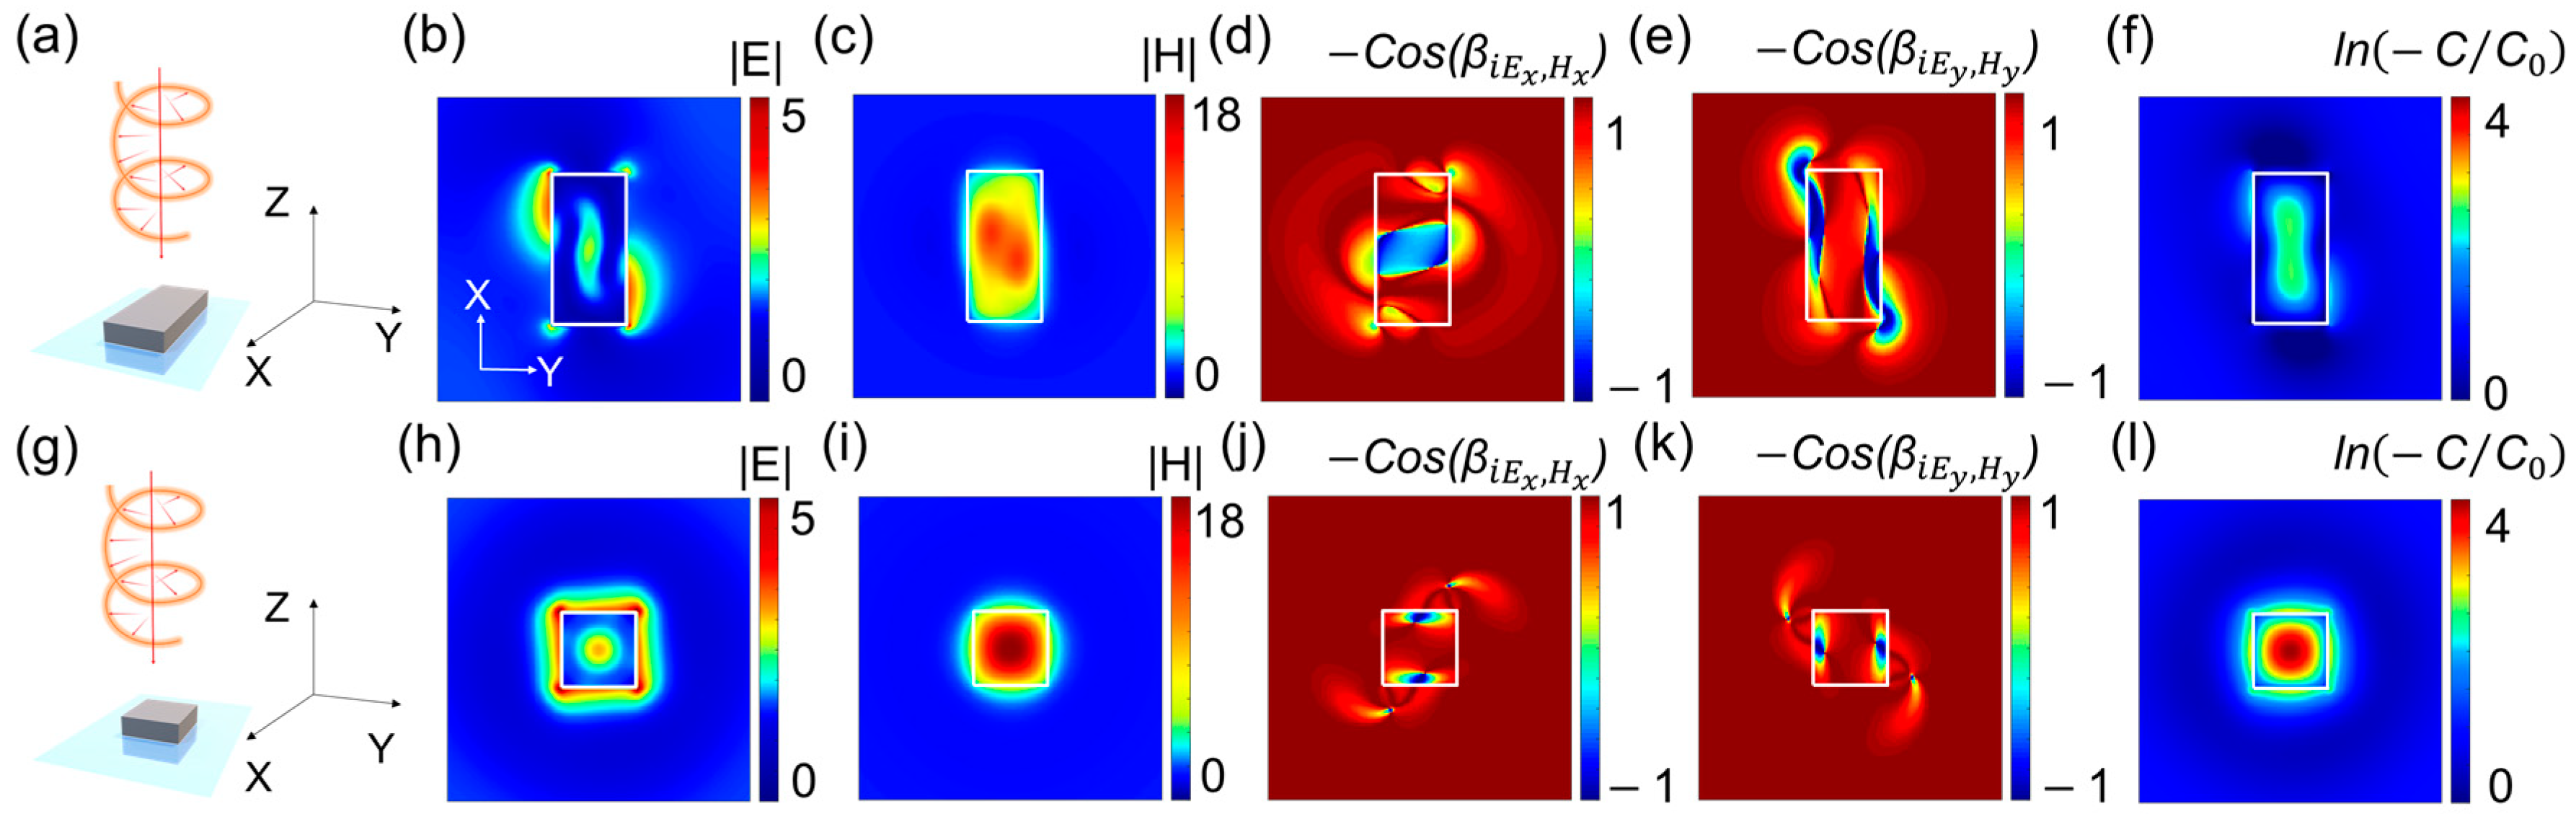
Figure 2a,g show the schematics of two classes of nanostructures, i.e., a nanorod with the length of 250 nm and a squared nanoblock with the length of 125 nm under the incident light of right-handed circular polarization. To elucidate the condition for effective C enhancement, the magnitude and phase of the electromagnetic field are evaluated by comparing them with the associated terms in Equation (1). Figure 2b–f shows the magnitude and relative phase of the electromagnetic field at the resonant nanorod. The fields are inspected in the cross-sectional plane located at the height of 30 nm as illustrated in Figure 1a. Despite the reasonable level the electric and magnetic fields overlap (Figure 2b,c), the relative phase in the overlapped area near the surface, i.e., two corners for x-polarization and vertical surfaces for y-polarization, renders the cos ( β i E ,   H ) close to zero that decreases C enhancement (Figure 2d,e). This undesirable condition of the phase occurs by the non-consistent phase delay between orthogonally polarized scattered fields and hinders the chirality’s preservation (Figure 2f). As the second class of geometry, the squared nanoblock is evaluated, which features the relative phase value reaching close to unity at the substantially overlapped area of the electromagnetic field (Figure 2h–k). As such, the nature of CPL is effectively preserved and the chirality is enhanced near the surface of the nanoblock compared to the example of the nanorod (Figure 2l).
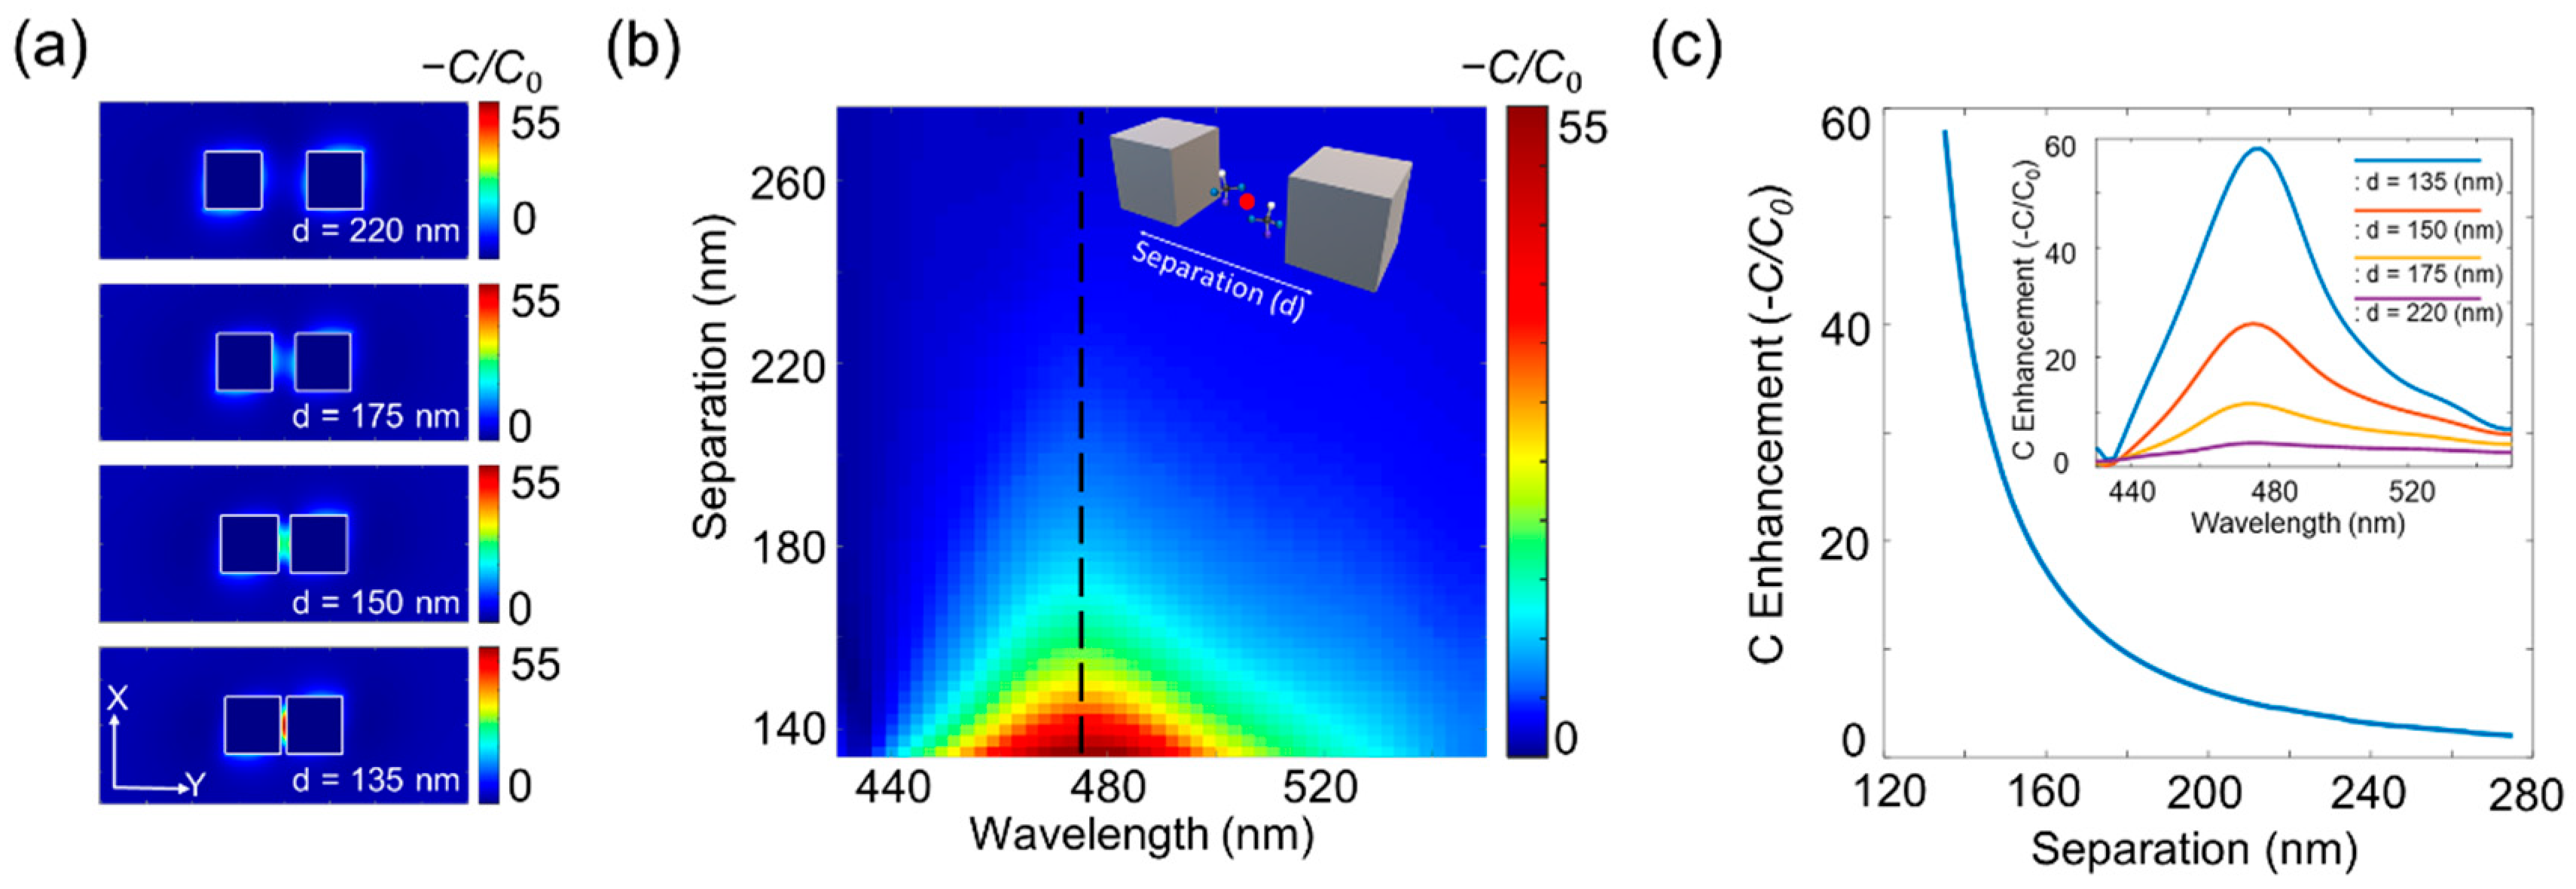
Next, we construct a dimer structure to multiply the C enhancement when the molecules are placed in the gap region. To investigate the effect of optical interaction between each element of the dimer on the chirality, the C enhancement for various conditions of separation is analyzed, which is shown in Figure 3. Figure 3a shows the four representative examples of dimer structures consisting of squared nanoblocks. As the separation decreases from 220 nm to 135 nm, the electric field is more concentrated at the center region of the hotspot, which is similar to the effect of the plasmonic dimer. This also facilitates the enhancement of optical chirality, which reaches approximately 55 times higher than the free space chirality as the separation decreases to 135 nm, i.e., gap size of 10 nm. Figure 3b exhibits the values of C enhancement at the center of the gap for the continuous adjustment of separation. The chirality monotonically increases as the separation decreases to 180 nm and significantly increases as the separation decreases further. Figure 3c shows the C enhancement at the wavelength of 475 nm, which is indicated by the black dotted line in Figure 3b. The consistent increase of C enhancement can be explained by the near-field interaction combined with the continuity of electric flux at the interface of the gap, which results in the enhancement of both the electromagnetic fields and the optical chirality.
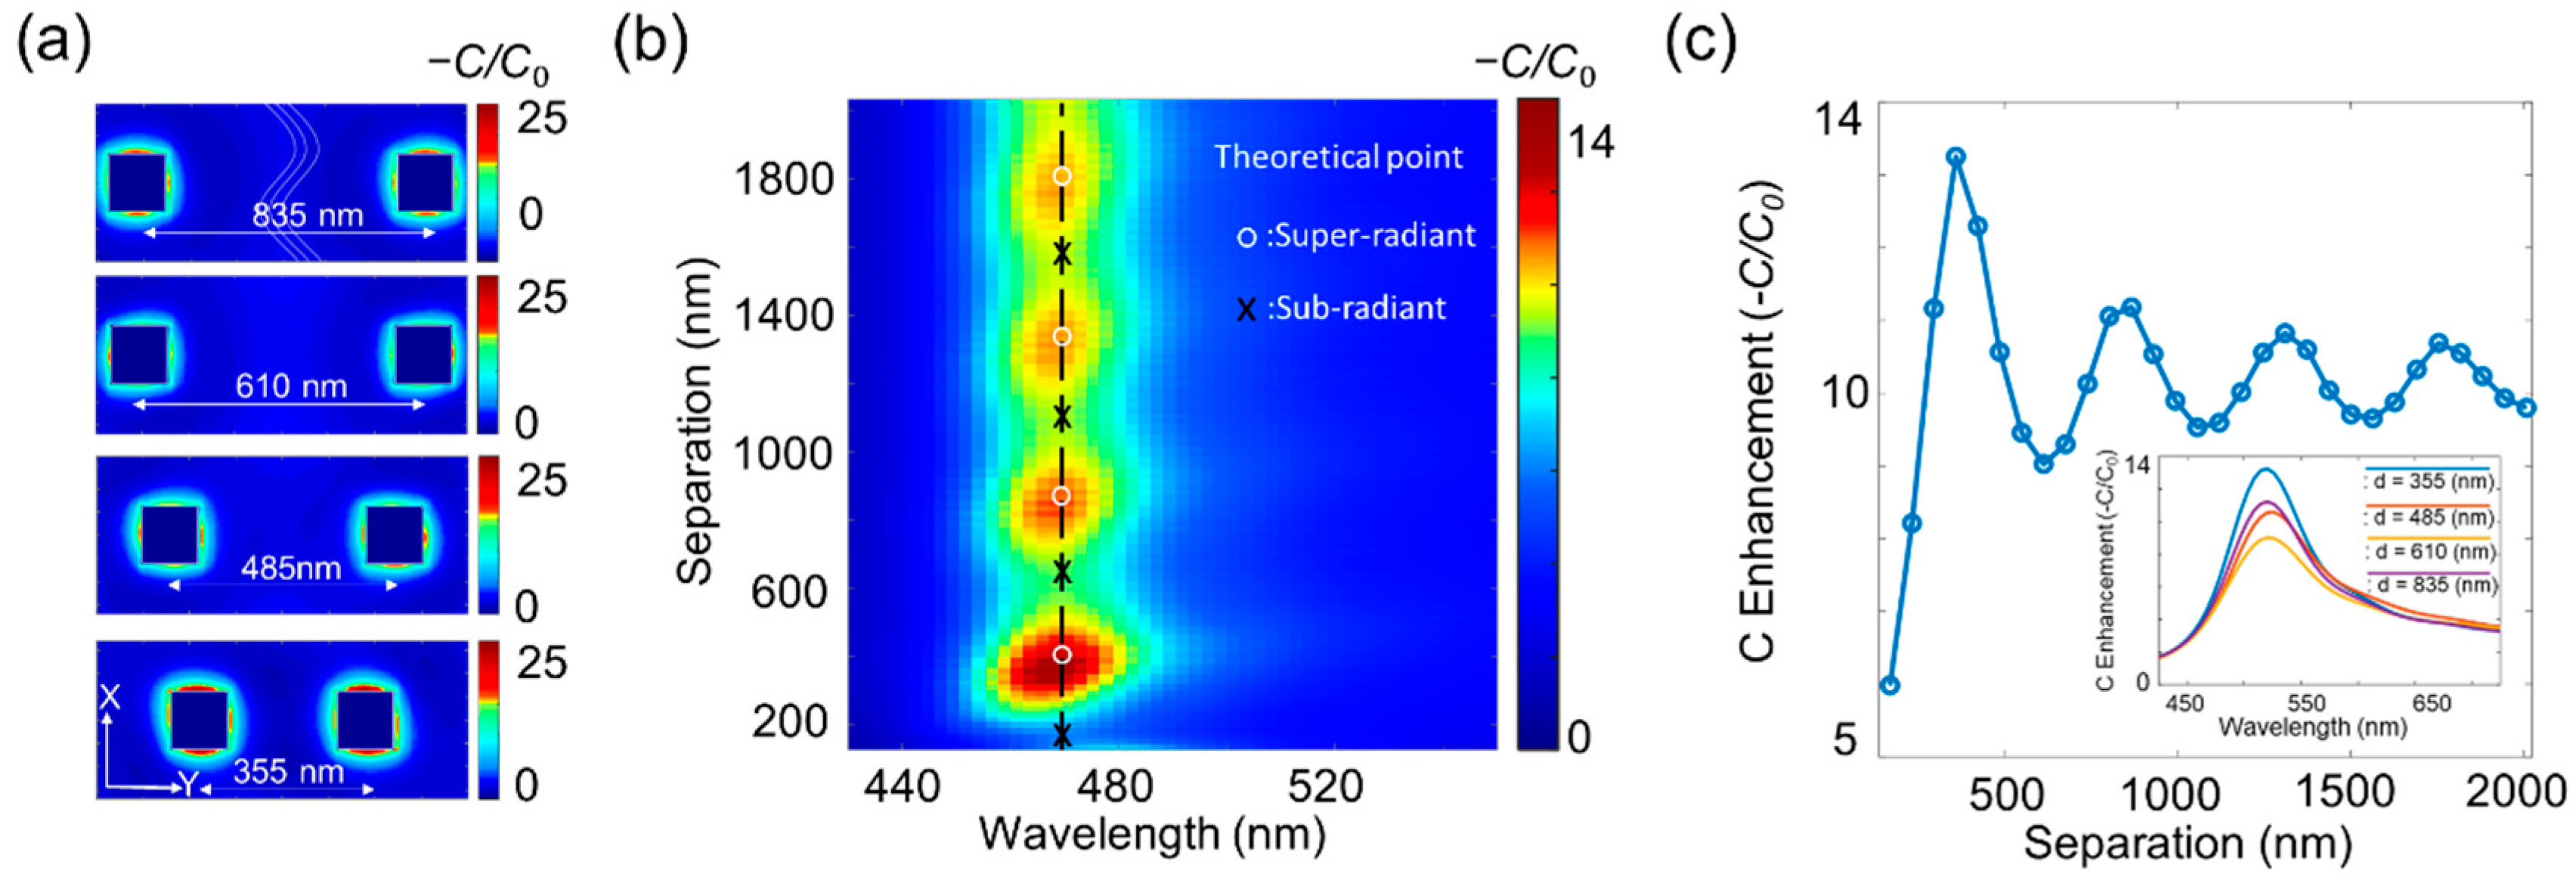
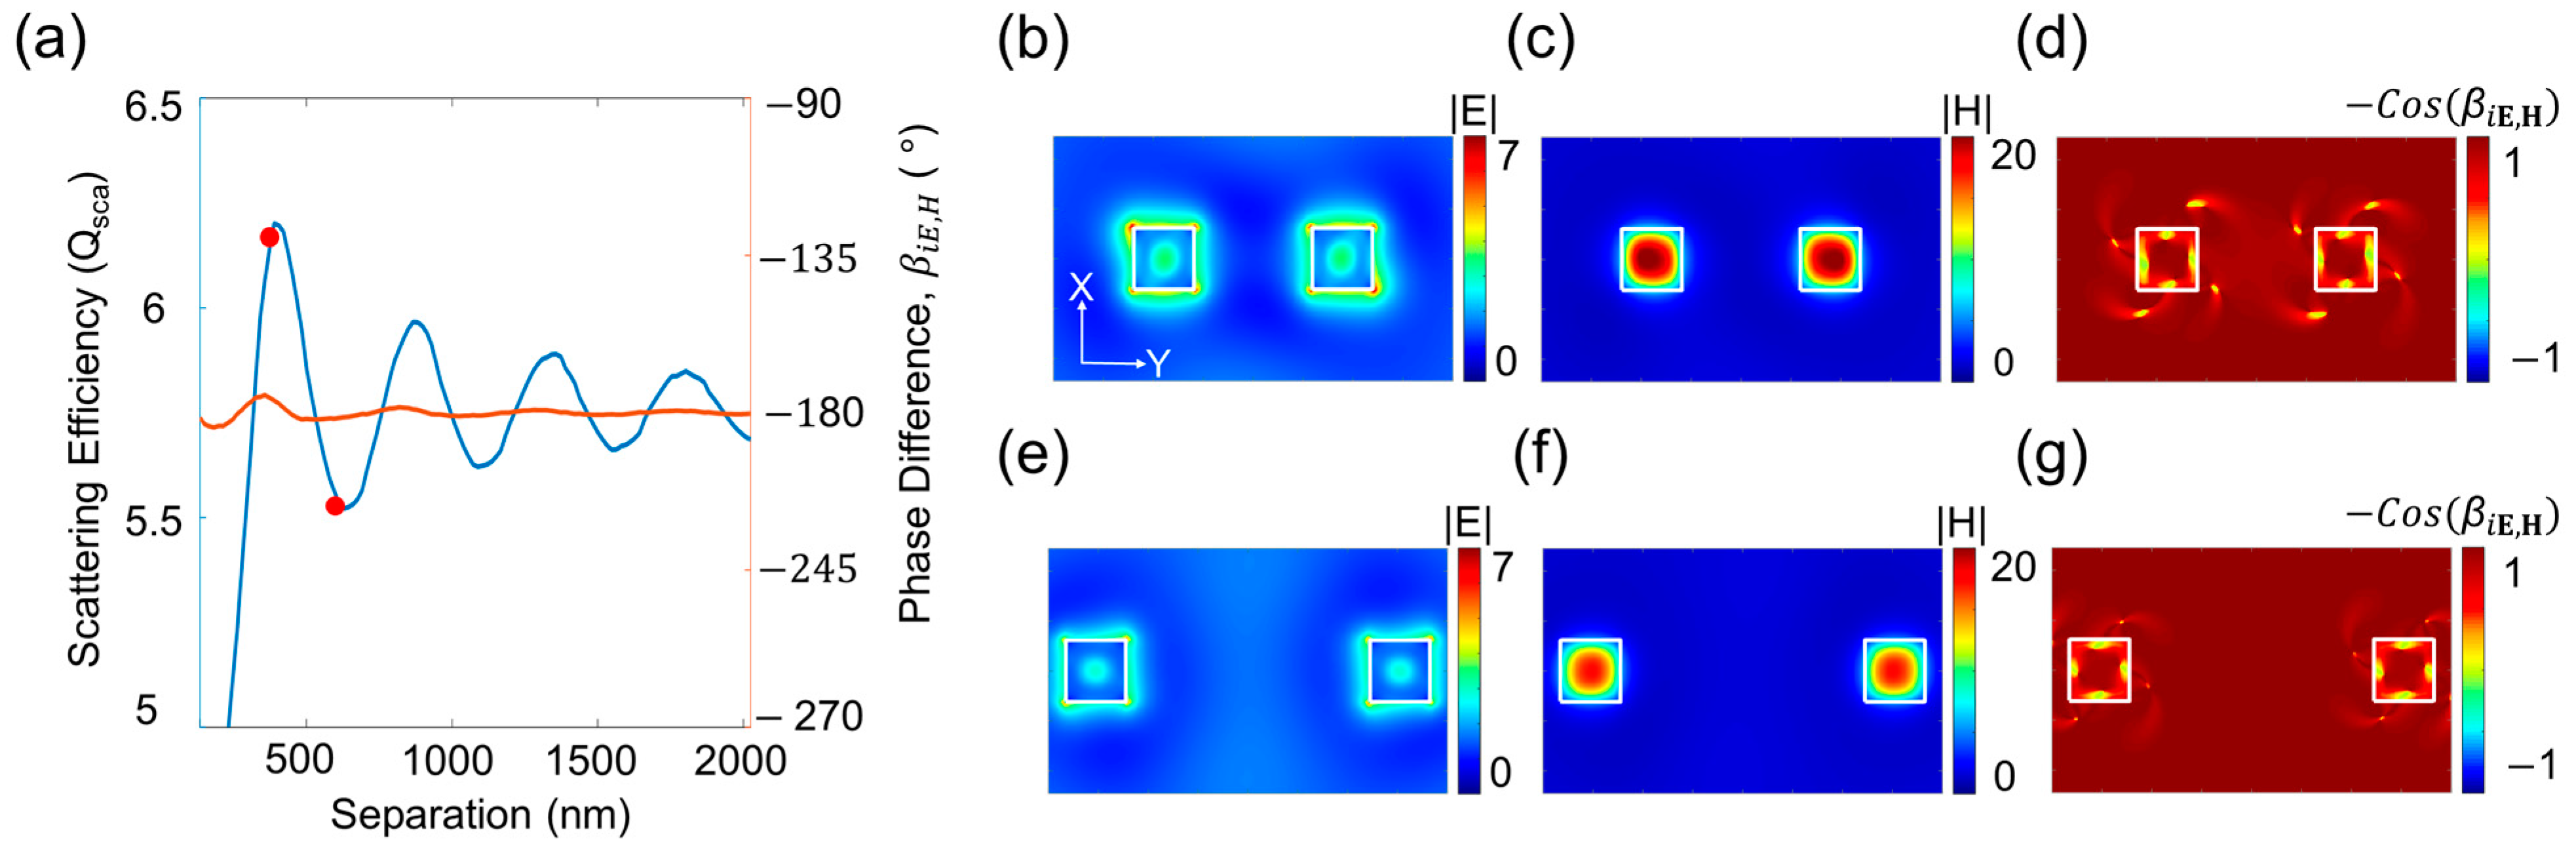
When the molecules are adsorbed on the overall surface area of the nanostructure, the average chirality near the surface region is evaluated as the separation of the dimer is tuned (Figure 4). There is an oscillatory variation of chirality as the separation is tuned from 355 nm to 835 nm (Figure 4a). At 355 nm, the chirality shows the maximum value of 25 at the overall surface area. However, as the separation increases up to 610 nm, the chirality decreases to less than 20 and increases again as the separation increases further to 835 nm. This trend of variation in the optical chirality is visualized in Figure 4b, which exhibits the average chirality calculated within 10 nm from the nanostructure surface for continuous tuning of separation. The modulated enhancement is observed with the approximated oscillation period of a wavelength, including the effective length of Si and free space. This is explained by the effect of the radiated fields generated in the resonant nanostructure interacting with each other, which influences the resonance of nearby nanostructures and induces super- or sub-radiant conditions [36,37]. Under the super-radiant condition with the optimal separation, high chirality appears by the constructive interference. Figure 4c clearly shows such modulation at the wavelength of 470 nm, which shows the maximum C enhancement in Figure 4b. The modulation that occurs in the C enhancement spectrum is determined by a simple theoretical calculation as below.
d = λ 2 n × ( 2 m ) ,   m = 0 ,   1 ,   2 ,  
d = λ 2 n × ( 2 m + 1 ) ,   m = 0 ,   1 ,   2 ,  
Equations (2) and (3) indicate the conditions for constructive interference and destructive interference of two waves, respectively, and d, n, and λ are the distance between two sources of waves, the effective refractive index, and the wavelength of a wave. Using the two equations, the radiation fields theoretically induce the super or sub-radiant condition. These points are displayed in Figure 4b, which is almost identical to the maximum and minimum points of the C enhancement. The slight difference between the tendency of C enhancement and theoretically calculated radiation fields is the result of balancing between the electric field, the magnetic field, and the relative phase changes’ intensities [38,39].
We further analyze the effect of super- and sub-radiant conditions on the C enhancement by evaluating the amplitude and relative phase of two examples (Figure 5). Figure 5a shows the scattering efficiency of the dimer for various separations (blue line) and the relative phase difference between the electric and magnetic fields (red line). The phase difference remains constant with subtle oscillations less than the angle of 5 degrees, whereas it shows significant variations of scattering power as the separation is tuned. This implies that the nature of chirality, i.e., the state of CPL, is preserved even when the separation varies, and the magnitude of electric and magnetic fields caused by the scattering power dominantly affects the C enhancement. The electromagnetic field and relative phase for the two representative cases of red dots are visually presented in Figure 5b–g. Figure 5b,c shows the electric and magnetic fields at the separations for maximum scattering of 355 nm, and Figure 5e,f shows the fields for minimum scattering of 610 nm, respectively, which closely matches the separation conditions of the C enhancement in Figure 4c. There is a clear difference in the amplitude of the fields that the substantially enhanced fields are observed at 355 nm compared to the suppressed fields at 610 nm.
In contrast, the relative phase of the two examples shows similar profiles owing to the preservation of CPL regardless of the effect of super- or sub-radiant conditions (Figure 5d,g). This implies that the C enhancement is dominantly affected by the change of the field’s magnitudes rather than the distortion of CPL.
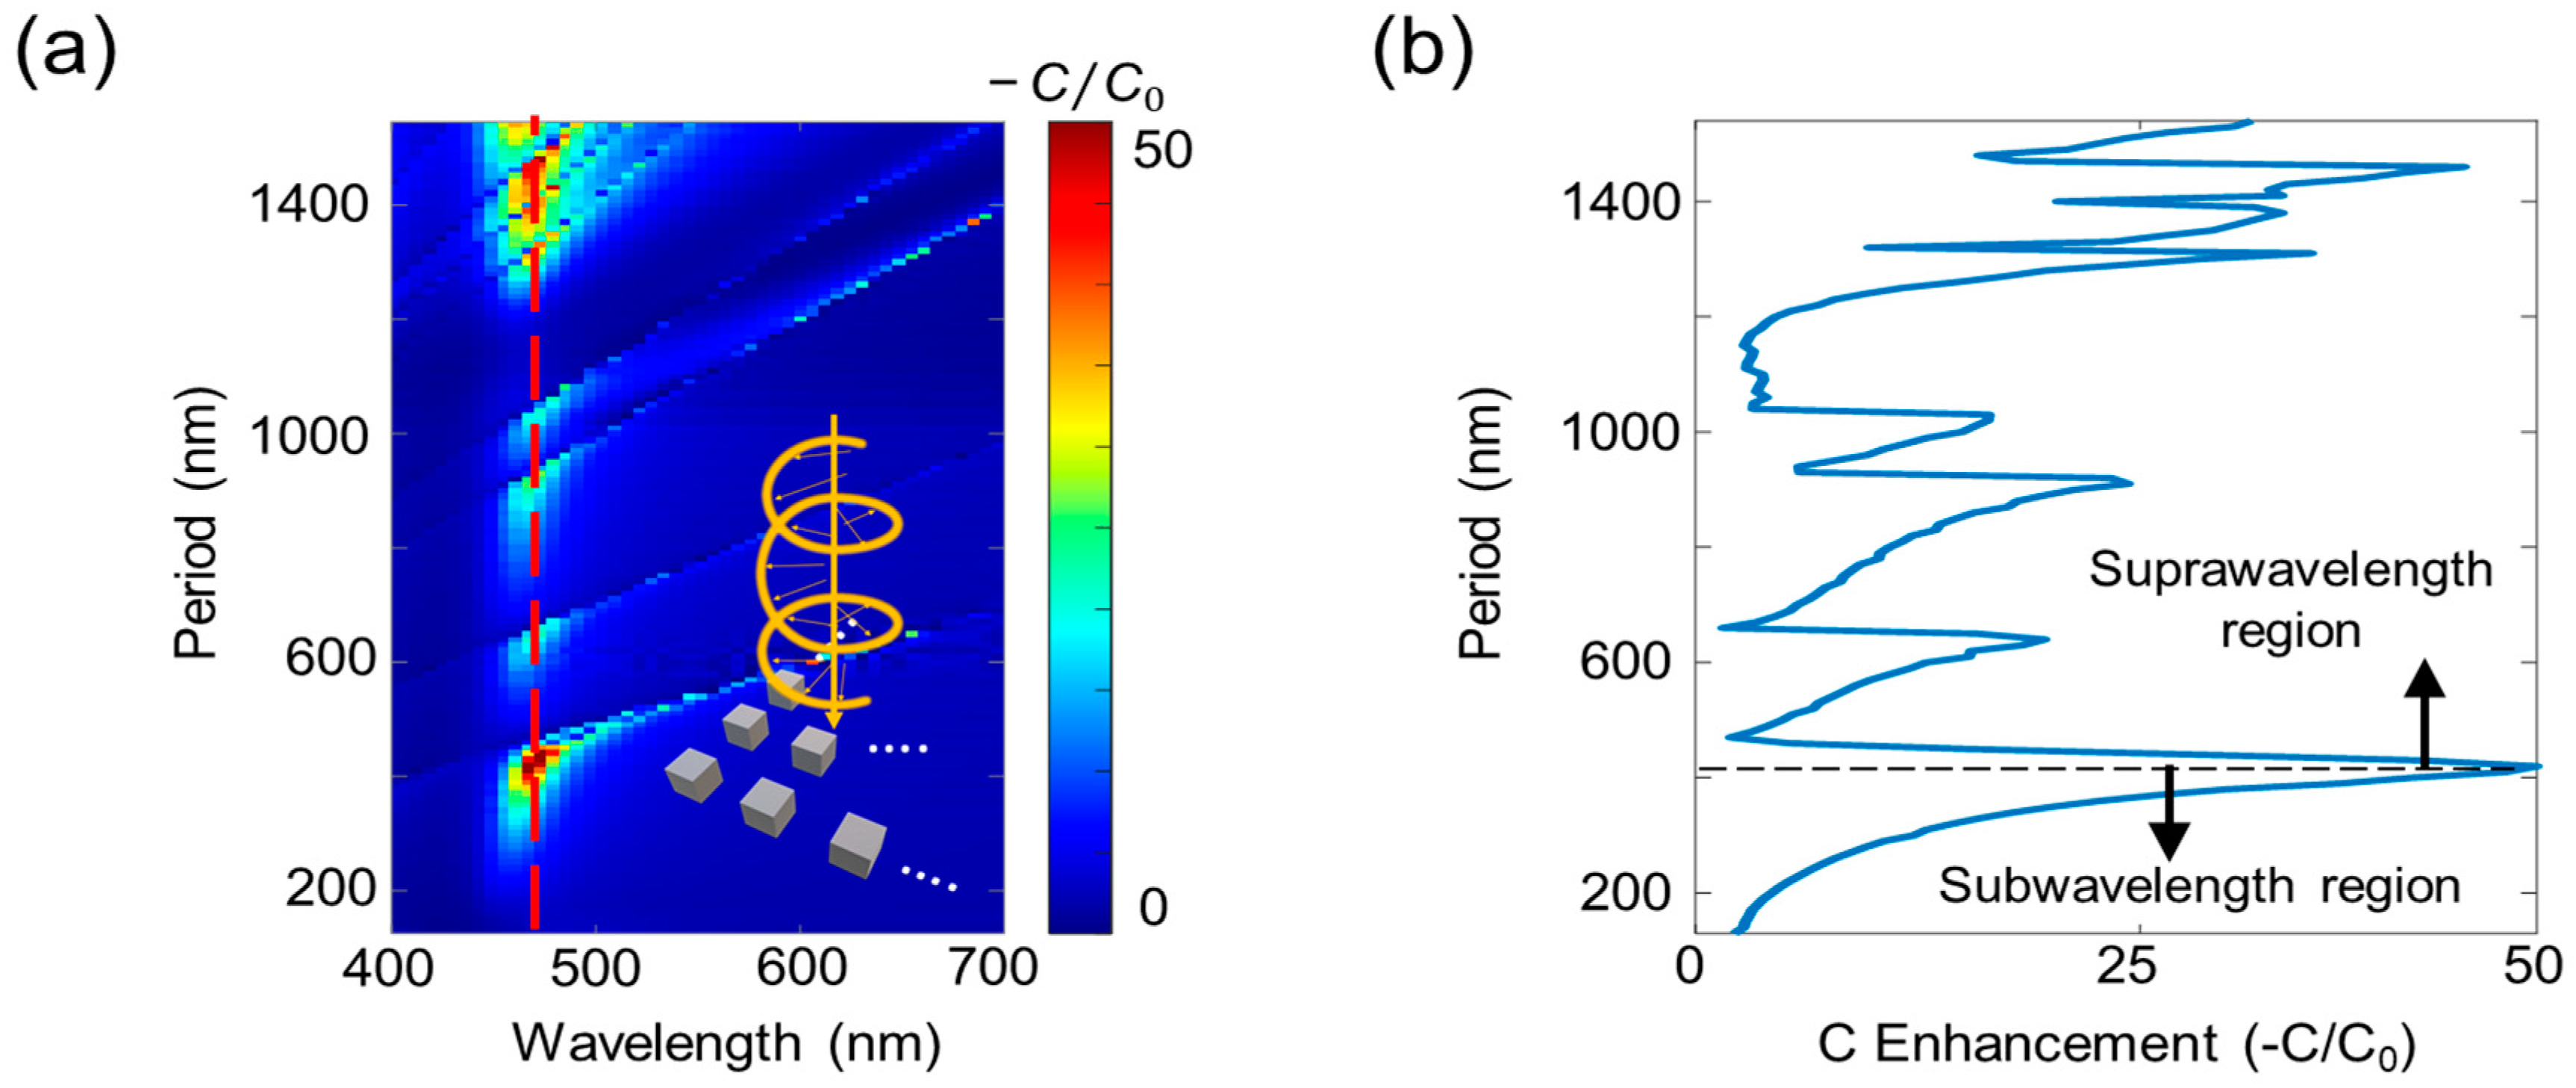
Finally, we analyze the simulation in which the designed structures were arranged periodically for sensing the molecules distributed in a large area. For this study, an array structure is simulated by setting the periodic boundary condition in a lateral direction in the FDTD simulation method. To evaluate and optimize the performance, we analyze the C enhancement for the various periods of array (Figure 6a). Several diffraction orders appear in the panel as the period increases, and the area below the first diffraction order is the subwavelength condition. It is observed that the strongly enhanced optical chirality appears near the boundary of each diffraction order. This is explained by the effect of radiation generated by every single nanostructure that induces grating coupling. Figure 6b shows the change in C enhancement at the resonance wavelength of 475 nm. It is concluded from the figure that averaged C enhancement values up to 50 are shown near the boundary of each diffraction order, including the period that induces multiple grating coupling in the two-dimensional array.

4. Conclusions

To summarize, we analyzed the relationship between resonant modes and their optical chirality by exploring diverse forms of nanostructures for C enhancement. To analyze the resonant characteristics of the nanostructures, an in-depth analysis of the chiral response was conducted with the changes in size and periodic arrangement of the designed nanostructures. By the series of analysis steps, the designing rules of achieving optimal chirality in the local near-field area and the overall nanostructured surfaces were confirmed. We believe that the presented analysis and proposed structure pave an important pathway to realize the platform for effective chiral detection.

Supplementary Materials

The following supporting information including a detailed description of simulation procedures, additional analysis and supporting figures is available online at https://www.mdpi.com/article/10.3390/app11072989/s1, Supplementary note 1: Analysis of chiral enhancement with to the control of the changes of height in squared nanoblocks, Supplementary note 2: Analysis of chiral enhancement with the control of the changes of width in nanostructures, Supplementary note 3: Theoretically calculation of Qsca based on the analysis of dipole decomposition, Supplementary note 4: Scattering efficiency and C enhancement for various siezs and shapes of nanostructures.

Author Contributions

The manuscript was written through the contributions of all authors. Both authors have read and agreed to the published version of the manuscript.

Funding

This work was supported by the National Research Foundation of Korea (NRF) grant funded by the Korea government (MSIT) (NRF-2019R1A4A1028121, NRF-2019R1C1C1004693) and in part by Samsung electronics.

Data Availability Statement

The data presented in this study are available within the article.

Conflicts of Interest

The authors declare no conflict of interest regarding this article.

References

  1. Kelvin, W.T.B. The Molecular Tactics of a Crystal; Clarendon: Oxford, UK, 1894. [Google Scholar]
  2. Kelvin, W.T.B. Baltimore Lectures on Molecular Dynamics and the Wave Theory of Light; CJ Clay and Sons: Cambridge, UK, 1904. [Google Scholar]
  3. Barron, L.D. Chirality and life. Space Sci. Rev. 2008, 135, 187–201. [Google Scholar] [CrossRef]
  4. Dobson, C.M. Protein folding and misfolding. Nature 2003, 426, 884–890. [Google Scholar] [CrossRef]
  5. Davies, N.M.; Wei Teng, X. Importance of Chirality in Drug Therapy and Pharmacy Practice: Implications for Psychiatry. Adv. Pharm. 2003, 1, 242–252. [Google Scholar]
  6. Savile, C.K.; Janey, J.M.; Mundorff, E.C.; Moore, J.C.; Tam, S.; Jarvis, W.R.; Colbeck, J.C.; Krebber, A.; Fleitz, F.J.; Brands, J.; et al. Biocatalytic asymmetric synthesis of chiral amines from ketones applied to sitagliptin manufacture. Science 2010, 329, 305–309. [Google Scholar] [CrossRef] [Green Version]
  7. Hong, A.; Choi, C.M.; Eun, H.J.; Jeong, C.; Heo, J.; Kim, N.J. Conformation-Specific Circular Dichroism Spectroscopy of Cold, Isolated Chiral Molecules. Angew. Chem. 2014, 126, 7939–7942. [Google Scholar] [CrossRef]
  8. Eun, H.J.; Min, A.; Jeon, C.W.; Yoo, I.T.; Heo, J.; Kim, N.J. Chiral and Isomeric Discrimination of Chiral Molecular Ions by Cold Ion Circular Dichroism Spectroscopy. J. Phys. Chem. Lett. 2020, 11, 4367–4371. [Google Scholar] [CrossRef]
  9. Zhang, R.; Zhao, Q.; Wang, X.; Gao, W.; Li, J.; Tam, W.Y. Measuring circular phase-dichroism of chiral metasurface. Nanophotonics 2019, 8, 909–920. [Google Scholar] [CrossRef]
  10. Khanikaev, A.B.; Arju, N.; Fan, Z.; Purtseladze, D.; Lu, F.; Lee, J.; Sarriugarte, P.; Schnell, M.; Hillenbrand, R.; Belkin, M.A.; et al. Experimental demonstration of the microscopic origin of circular dichroism in two-dimensional metamaterials. Nat. Commun. 2016, 7, 12045. [Google Scholar] [CrossRef]
  11. Wang, M.; Wang, F.; Qu, Y.; Wang, T.; Chen, Y.; Bai, Y.; Zhang, Z. Enhanced circular dichroism of crossed nanorods with nanowire. Appl. Opt. 2018, 57, 6721–6724. [Google Scholar] [CrossRef] [PubMed]
  12. Reyes Gómez, F.; Oliveira, O.N.; Albella, P.; Mejía-Salazar, J.R. Enhanced chiroptical activity with slotted high refractive index dielectric nanodisks. Phys. Rev. B 2020, 101, 155403. [Google Scholar] [CrossRef]
  13. Wang, Z.; Wang, Y.; Adamo, G.; Teh, B.H.; Wu, Q.Y.S.; Teng, J.; Sun, H. A Novel Chiral Metasurface with Controllable Circular Dichroism Induced by Coupling Localized and Propagating Modes. Adv. Opt. Mater. 2016, 4, 883–888. [Google Scholar] [CrossRef]
  14. Mohammadi, E.; Tsakmakidis, K.L.; Askarpour, A.N.; Dehkhoda, P.; Tavakoli, A.; Altug, H. Nanophotonic Platforms for Enhanced Chiral Sensing. ACS Photonics 2018, 5, 2669–2675. [Google Scholar] [CrossRef]
  15. Mandal, P. Large Circular Dichroism in MDM Plasmonic Metasurface with Subwavelength Crescent Aperture. Plasmonics 2018, 13, 2229–2237. [Google Scholar] [CrossRef]
  16. Hu, J.; Lawrence, M.; Dionne, J.A. High Quality Factor Dielectric Metasurfaces for Ultraviolet Circular Dichroism Spectroscopy. ACS Photonics 2020, 7, 36–42. [Google Scholar] [CrossRef]
  17. García-Guirado, J.; Svedendahl, M.; Puigdollers, J.; Quidant, R. Enhanced Chiral Sensing with Dielectric Nanoresonators. Nano Lett. 2020, 20, 585–591. [Google Scholar] [CrossRef] [PubMed]
  18. Solomon, M.L.; Hu, J.; Lawrence, M.; García-Etxarri, A.; Dionne, J.A. Enantiospecific Optical Enhancement of Chiral Sensing and Separation with Dielectric Metasurfaces. ACS Photonics 2019, 6, 43–49. [Google Scholar] [CrossRef]
  19. Cao, T.; Wei, C.; Li, Y. Dual-band strong extrinsic 2D chirality in a highly symmetric metal-dielectric-metal achiral metasurface. Opt. Mater. Express 2016, 6, 303–311. [Google Scholar] [CrossRef]
  20. Raziman, T.V.; Godiksen, R.H.; Müller, M.A.; Curto, A.G. Conditions for Enhancing Chiral Nanophotonics near Achiral Nanoparticles. ACS Photonics 2019, 6, 2583–2589. [Google Scholar] [CrossRef] [Green Version]
  21. Graf, F.; Feis, J.; Garcia-Santiago, X.; Wegener, M.; Rockstuhl, C.; Fernandez-Corbaton, I. Achiral, Helicity Preserving, and Resonant Structures for Enhanced Sensing of Chiral Molecules. ACS Photonics 2019, 6, 482–491. [Google Scholar] [CrossRef]
  22. Wang, X.; Sang, T.; Qi, H.; Li, G.; Yin, X.; Wang, Y. Cascaded nanorod arrays for ultrabroadband, omnidirectional and polarization-insensitive absorption. Appl. Sci. 2020, 10, 3878. [Google Scholar] [CrossRef]
  23. Park, J.; Kang, J.H.; Kim, S.J.; Liu, X.; Brongersma, M.L. Dynamic reflection phase and polarization control in metasurfaces. Nano Lett. 2017, 17, 407–413. [Google Scholar] [CrossRef] [PubMed]
  24. Shaltout, A.M.; Kim, J.; Boltasseva, A.; Shalaev, V.M.; Kildishev, A.V. Ultrathin and multicolour optical cavities with embedded metasurfaces. Nat. Commun. 2018, 9, 2673. [Google Scholar] [CrossRef] [PubMed] [Green Version]
  25. Kim, S.J.; Fan, P.; Kang, J.H.; Brongersma, M.L. Creating semiconductor metafilms with designer absorption spectra. Nat. Commun. 2015, 6, 7591. [Google Scholar] [CrossRef] [PubMed] [Green Version]
  26. Zhang, Z.; Li, T.; Jiao, X.; Song, G.; Xu, Y. High-efficiency all-dielectric metasurfaces for the generation and detection of focused optical vortex for the ultraviolet domain. Appl. Sci. 2020, 10, 5716. [Google Scholar] [CrossRef]
  27. Yao, K.; Liu, Y. Enhancing circular dichroism by chiral hotspots in silicon nanocube dimers. Nanoscale 2018, 10, 8779–8786. [Google Scholar] [CrossRef] [Green Version]
  28. Yao, K.; Zheng, Y. Near-Ultraviolet Dielectric Metasurfaces: From Surface-Enhanced Circular Dichroism Spectroscopy to Polarization-Preserving Mirrors. J. Phys. Chem. C 2019, 123, 11814–11822. [Google Scholar] [CrossRef]
  29. Zhao, X.; Reinhard, B.M. Switchable Chiroptical Hot-Spots in Silicon Nanodisk Dimers. ACS Photonics 2019, 6, 1981–1989. [Google Scholar] [CrossRef]
  30. Palik, E. Handbook of Optical Constants of Solids; Academic Press: Cambridge, MA, USA, 1998. [Google Scholar]
  31. Ee, H.S.; Kang, J.H.; Brongersma, M.L.; Seo, M.K. Shape-dependent light scattering properties of subwavelength silicon nanoblocks. Nano Lett. 2015, 15, 1759–1765. [Google Scholar] [CrossRef]
  32. Kerker, M.; Wang, D.S.; Giles, C.L. Electromagnetic Scattering By Magnetic Spheres. J. Opt. Soc. Am. 1983, 73, 765–767. [Google Scholar] [CrossRef]
  33. Staude, I.; Miroshnichenko, A.E.; Decker, M.; Fofang, N.T.; Liu, S.; Gonzales, E.; Dominguez, J.; Luk, T.S.; Neshev, D.N.; Brener, I.; et al. Tailoring directional scattering through magnetic and electric resonances in subwavelength silicon nanodisks. ACS Nano 2013, 7, 7824–7832. [Google Scholar] [CrossRef]
  34. Tang, Y.; Cohen, A.E. Optical chirality and its interaction with matter. Phys. Rev. Lett. 2010, 104, 163901. [Google Scholar] [CrossRef]
  35. Lipkin, D.M. Existence of a new conservation law in electromagnetic theory. J. Math. Phys. 1964, 5, 696–700. [Google Scholar] [CrossRef]
  36. Zhang, S.; Genov, D.A.; Wang, Y.; Liu, M.; Zhang, X. Plasmon-induced transparency in metamaterials. Phys. Rev. Lett. 2008, 101, 047401. [Google Scholar] [CrossRef] [Green Version]
  37. Hao, F.; Sonnefraud, Y.; Van Dorpe, P.; Maier, S.A.; Halas, N.J.; Nordlander, P. Symmetry breaking in plasmonic nanocavities: Subradiant LSPR sensing and a tunable Fano resonance. Nano Lett. 2008, 8, 3983–3988. [Google Scholar] [CrossRef] [PubMed]
  38. Solomon, M.L.; Dionne, J.A.; Abendroth, J.M.; Poulikakos, L.V.; Hu, J. Fluorescence-detected circular dichroism of a chiral molecular monolayer with dielectric metasurfaces. J. Am. Chem. Soc. 2020, 142, 18304–18309. [Google Scholar] [CrossRef]
  39. Ho, C.; Garcia-etxarri, A.; Zhao, Y.; Dionne, J. Enhancing Enantioselective Absorption Using Dielectric Nanospheres. ACS Photonics 2017, 4, 197–203. [Google Scholar] [CrossRef]
Figure 1. (a) Schematic of the resonant dielectric nanostructure as a unit cell. The nanostructure is designed with a constant cross-sectional area (60 nm by 125 nm) and various lengths. (b) The profiles of the scattered electric and magnetic fields for the nanorod with the length of 600 nm under the incident light that is linearly polarized parallel to the x-axis. It supports the resonances with the magnetic dipole (MD) and the electric dipole (ED) at the target wavelengths of 475 nm and 750 nm, respectively. (c) Numerically simulated scattering efficiency (Qsca) of silicon (Si) nanostructures for the continuously tuned lengths of the nanostructure. Light is illuminated with the right-handed polarization. The condition of dipole resonances in (b) is indicated as red dots. (d) The calculated chiral enhancement (C enhancement, -C/C0) of Si nanorods is in (c).
Applsci 11 02989 g001
Figure 2. The enhanced optical chirality in two types of Si structures at the wavelength of 475 nm. The first type is designed as a nanorod with a length of 250 nm (af), and the second type is designed as a squared nanoblock with a length of 125 nm (gl). (ac) The schematic of the nanorod (a), and the images of the electric field (b) and the magnetic field (c) monitored from the cross-sectional x-y plane in (a), i.e., top view. (df) The spatial distributions of the relative phase between the electric and magnetic fields for x-directed (d) and y-directed polarizations (e) and the C enhancement (f). (gi) The schematic of the squared nanoblock (g) and the images of the electric and magnetic fields in the squared nanoblock for the same conditions of (b,c). (jl) The spatial distributions of the relative phase of the electric and magnetic fields (j,k) and C enhancement (l) in the squared nanoblock for the same conditions of (df).
Applsci 11 02989 g002
Figure 3. The enhanced optical chirality at the gap point of the Si nanoblock dimer. (a) Images of enhanced optical chirality at the four representative separations (d = 220 nm, 175 nm, 150 nm, and 135 nm, from top to bottom) at the resonant wavelength of 475 nm. (b) Two-dimensional map of the optical C enhancement at the center of the gap in the nanoblock dimer for the various separations of the dimer. (c) The C enhancement for the separation of the dimer at the wavelength of 475 nm. The inset in (c) shows the spectrums in four representative dimers in (a).
Applsci 11 02989 g003
Figure 4. The average enhancement of optical chirality with changes in the separation of the Si nanoblock dimer. (a) Images of the enhanced optical chirality for four representative separations of the dimer at the wavelength of 470 nm. (b) Image of the spectrums of the optical C enhancement as the separation is tuned from 135 nm to 2025 nm. White circle marks in the map indicate the theoretical maximum point of the radiation field, and black cross marks in the map indicate the theoretical minimum point of the radiation field. (c) The C enhancement at the resonance wavelength of 470 nm. The inset in (c) shows the spectrums for four representative separations in (a).
Applsci 11 02989 g004
Figure 5. (a) The scattering efficiency and phase difference as the separation is tuned. (b) The electric field, (c) the magnetic field, and (d) the profile of cos ( β i E ,   H ) at the separations of 355 nm (b–d) and 610 nm (e–f). The peak and dip of scattering efficiency marked as red circles in (a).
Applsci 11 02989 g005
Figure 6. The optical C enhancement in the periodic structure. (a) A two-dimensional map of the optical C enhancement of a Si nanoblock array for the periods of the nanostructure. (b) The C enhancement with respect to the periods. The resonance wavelength of 475 nm indicated as the red dotted line in (a).
Applsci 11 02989 g006
Publisher’s Note: MDPI stays neutral with regard to jurisdictional claims in published maps and institutional affiliations.

