Article

Real-Time Prediction of Operating Parameter of TBM during Tunneling

1
Radioactive Waste Disposal Research Division, Korea Atomic Energy Research Institute, Daejeon 34057, Korea
2
Department of Civil Engineering, Inha University, Incheon 22212, Korea
3
School of Resources and Safety Engineering, Central South University, Changsha 410083, China
4
GS Caltex Corporation, Seoul 06141, Korea
*
Author to whom correspondence should be addressed.
Appl. Sci. 2021, 11(7), 2967; https://doi.org/10.3390/app11072967
Submission received: 11 March 2021 / Revised: 22 March 2021 / Accepted: 22 March 2021 / Published: 26 March 2021
(This article belongs to the Special Issue Advances in Geotechnical Engineering Ⅱ)

Abstract

:
With the increasing use of the tunnel boring machine (TBM), attempts have been made to predict TBM operating parameters. Prediction of operating parameters is still an important step in the adaptability of the TBM for the future. In this study, we employ a walk forward (WF) prediction method based on ARIMAX, which can consider time-varying features and geological conditions. This method is applied to two different TBM projects to evaluate its performance, and is then compared with WF based on ordinary least squares (OLS). The simulation results show that the ARIMAX predictor outperforms the OLS predictor in both projects. For practical applications, an additional analysis is carried out according to the real-time prediction distance. The results show that time series-based ARIMAX provides meaningful results in 8 rings (11 m) or less of real-time prediction distance. The WF based on ARIMAX can provide reasonable TBM operating conditions with time-varying data and can be utilized in decision-making to improve excavation performance.

1. Introduction

A tunnel boring machine (TBM) is a piece of equipment that mechanically excavates a circular full face. Unlike the drilling and blasting method, use of a TBM for rock is advantageous in preventing noise and disturbance of the surrounding rock mass because of the use of a disc cutter attached to the TBM face, the cutterhead. Therefore, the TBM method is widely used in areas with considerable urbanization for power supply, water supply, and subway construction. However, the adaptability of the TBM for the future environment is sometimes limited by geological conditions such as rock fracturing, faulting, spalling, squeezing, and high water pressure [1,2]. To ensure lower construction cost and higher project safety, it is necessary to adjust the operating parameters of the TBM depending on the geological conditions. The method for improving the adaptability of the TBM is to utilize TBM monitoring data in real time to predict the future operating values of the TBM.
There have been several studies on the prediction of operating parameters. Among them, prediction of the thrust has been considered one of the important research issues [3]. Wang et al. [4] and Zhang et al. [5] used rock mechanics-based methods to analyze the thrust force of earth pressure balance (EPB) TBM. Gertsh [6] and Cho et al. [7] analyzed the relationship between rock-related parameters and thrust per cutter using a linear cutting test. Yagiz [8] and Hassnapour et al. [9] developed empirical models to predict parameters related to thrust. Recently, some works using machine learning (ML) techniques have been reported to effectively analyze complex field data. Based on data collected from the field, Naghadehi et al. [10] employed gene expression programming (GEP) to predict thrust-related parameters. Salimi et al. [11] used support vector regression (SVR) in hard rock conditions. A study applying random forest (RF) was also conducted based on heterogeneous in situ data [12].
The aforementioned works based on experimental, numerical, and empirical methods provide insights into the prediction of thrust, but these methods have limitations in terms of field applicability because they provide thrust values in the form of a range. In addition, operating parameters such as thrust are dependent on time-varying and non-stationary features. For example, since non-time series methods such as GEP and RF only use the current inputs without the aid of previous input information, they are not suitable for thrust prediction in real time.
Recently, a time series-based method has been utilized for real-time prediction of thrust [13]. Since this method considers both current inputs and previous input information, it is suitable for application to non-stationary time series parameters, such as TBM thrust. However, the inputs of the existing model include only operating parameters and not geological conditions, which are known to be the main parameters related to TBM thrust. For example, higher thrust is generally suitable for hard rock and non-discontinuity rock conditions. The importance of geological conditions has been shown in several literature works [5,14,15].
In this study, we simulate walk forward (WF) based on ARIMAX in consideration of both geological parameters and TBM thrust. Two actual projects with different construction conditions are employed to obtain the data used for constructing empirical models, respectively. For comparative analysis, the proposed method is compared with non-time series WF based on ordinary least squares (OLS). Additionally, the thrust prediction is examined according to the real-time prediction distance to validate the field applicability.

2. Methodology

2.1. ARIMAX

An autoregressive integrated moving average (ARIMA) developed from an ARMA that considers the time series characteristics of output parameters was developed [16]. ARMA is a model that combines the autoregression (AR) proposed by Yule [17] and the moving average (MA) proposed by Slutsky [18] (Equation (1)).
Y t = c + ε t + i = 1 p ϕ i Y t i + j = 1 q θ j ε t j
where c is constant, ε is error, and p and q are the order of AR and MA, respectively. ARMA expresses the current time series using the previous time series of the output parameter and error. This model is mainly applicable to stationary conditions where the mean and variance of the time series are constant.
In social science, however, time series such as statistics, exchange rates, and prices often take non-stationary patterns that are not constant in the mean and variance. If the output parameter is non-stationary, ARIMA taking into account differences is generally used (Equation (2)).
Δ Y t = c + ε t + i = 1 p ϕ i Δ Y t i + j = 1 q θ j ε t j
where ∆Y is the differentiated output parameter. ARIMA considers not only the characteristics of the ARMA, but also the trends and momentum of the previous time series. In general, ARIMA is mainly used for short-term prediction problems.
However, ARIMA only handles previous time series parameters, and it cannot consider the influence of exogenous parameters. ARIMAX can improve ARIMA by combining exogenous parameters with ARIMA (Equation (3)):
Δ Y t = c + ε t + i = 1 p ϕ i Δ Y t i + j = 1 q θ j ε t j + k = 1 r τ k X t k
where X is the exogenous parameters, and r is the lagged order of the exogenous parameters.
Operating parameters such as thrust are dependent on time-varying and non-stationary features. For this reason, it is desirable to use ARIMAX to capture the prediction accuracy. In addition, geological parameters affecting the thrust values [19,20] can be considered as inputs, which are the exogenous parameters of ARIMAX.

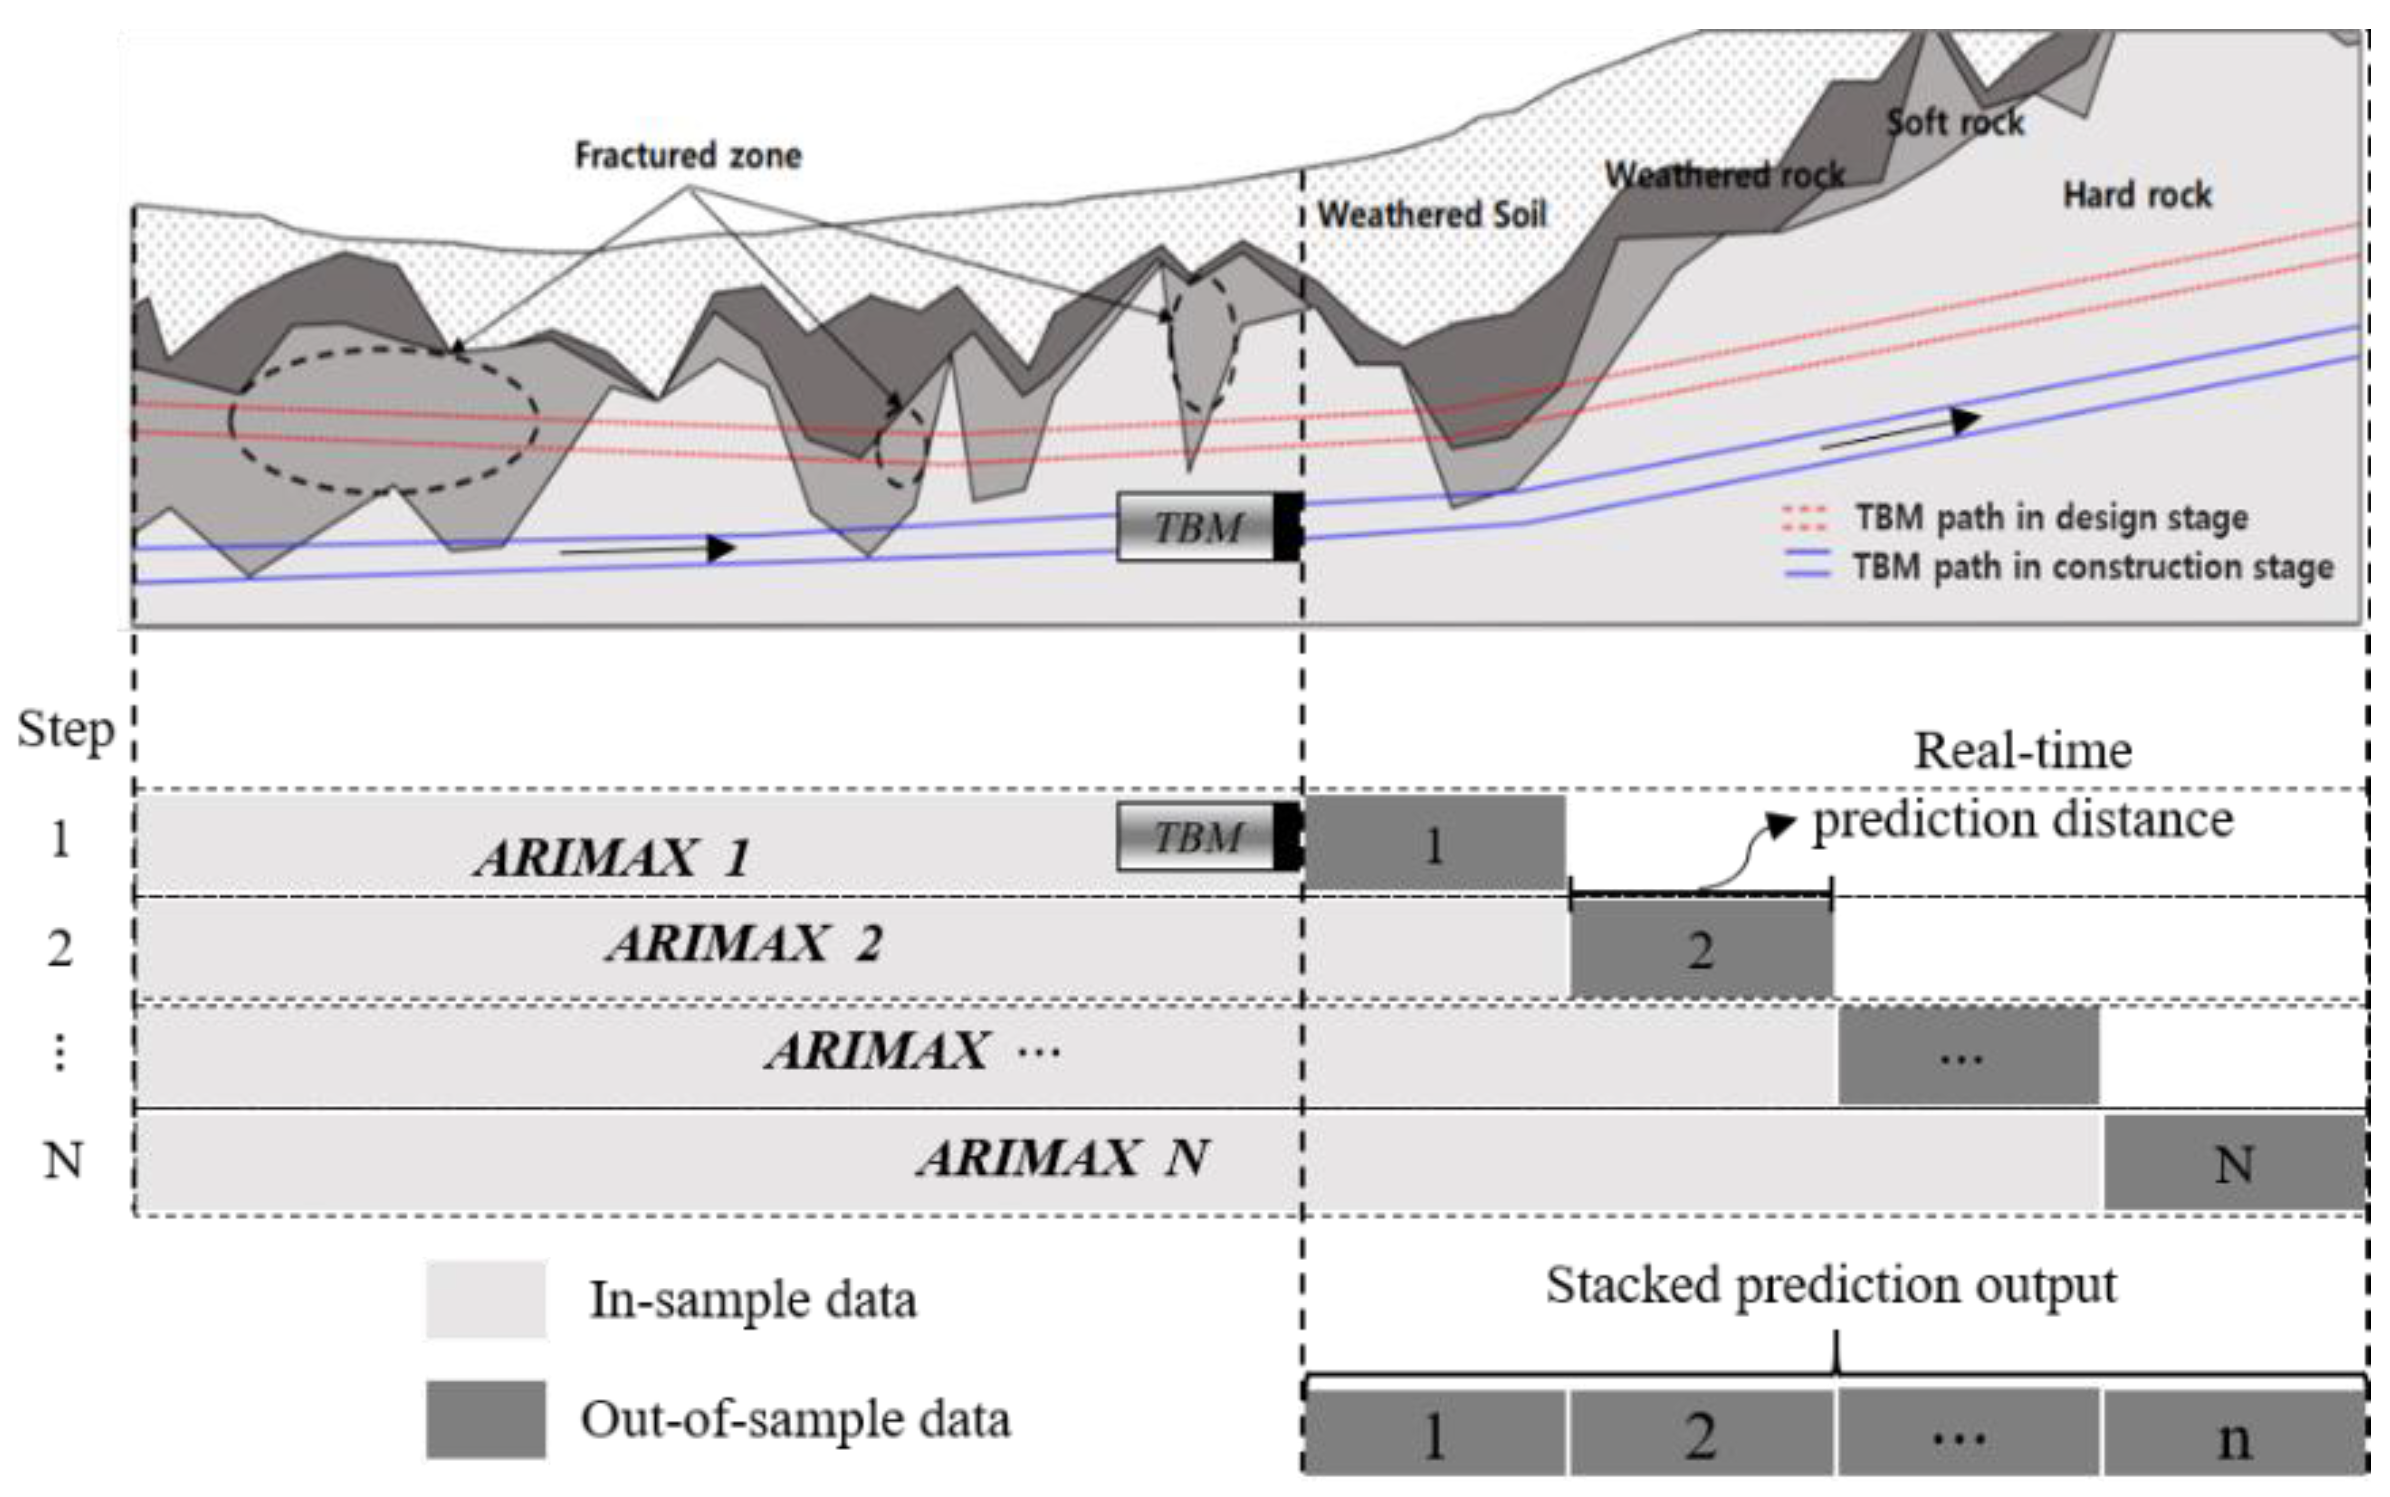
2.2. Real-Time Prediction: Walk Forward

Walk forward (WF) is a real-time prediction method mainly used in the field of time series prediction, such as real-time trading strategies, to optimize the coefficient of a model in real time [21]. As shown in Figure 1, WF optimizes a predictive model using a previous dataset called the “in-sample” and then tests it on a small period of the subsequent dataset called the “out-of-sample”. This step is repeated whenever the “in-sample” is extended to the future, and the outputs predicted in each step are sequentially stacked. In the final step, all the predicted values are evaluated at once.
WF optimizes the model’s structure or coefficients for the adaptability of the TBM to the future environment. The previous data information for the tunnel sections, where the TBM excavation is already completed, are regarded as the “in-sample”. On the other hand, the sections ahead of the TBM face to predict the thrust are considered as the “out-of-sample” (real-time prediction sections).

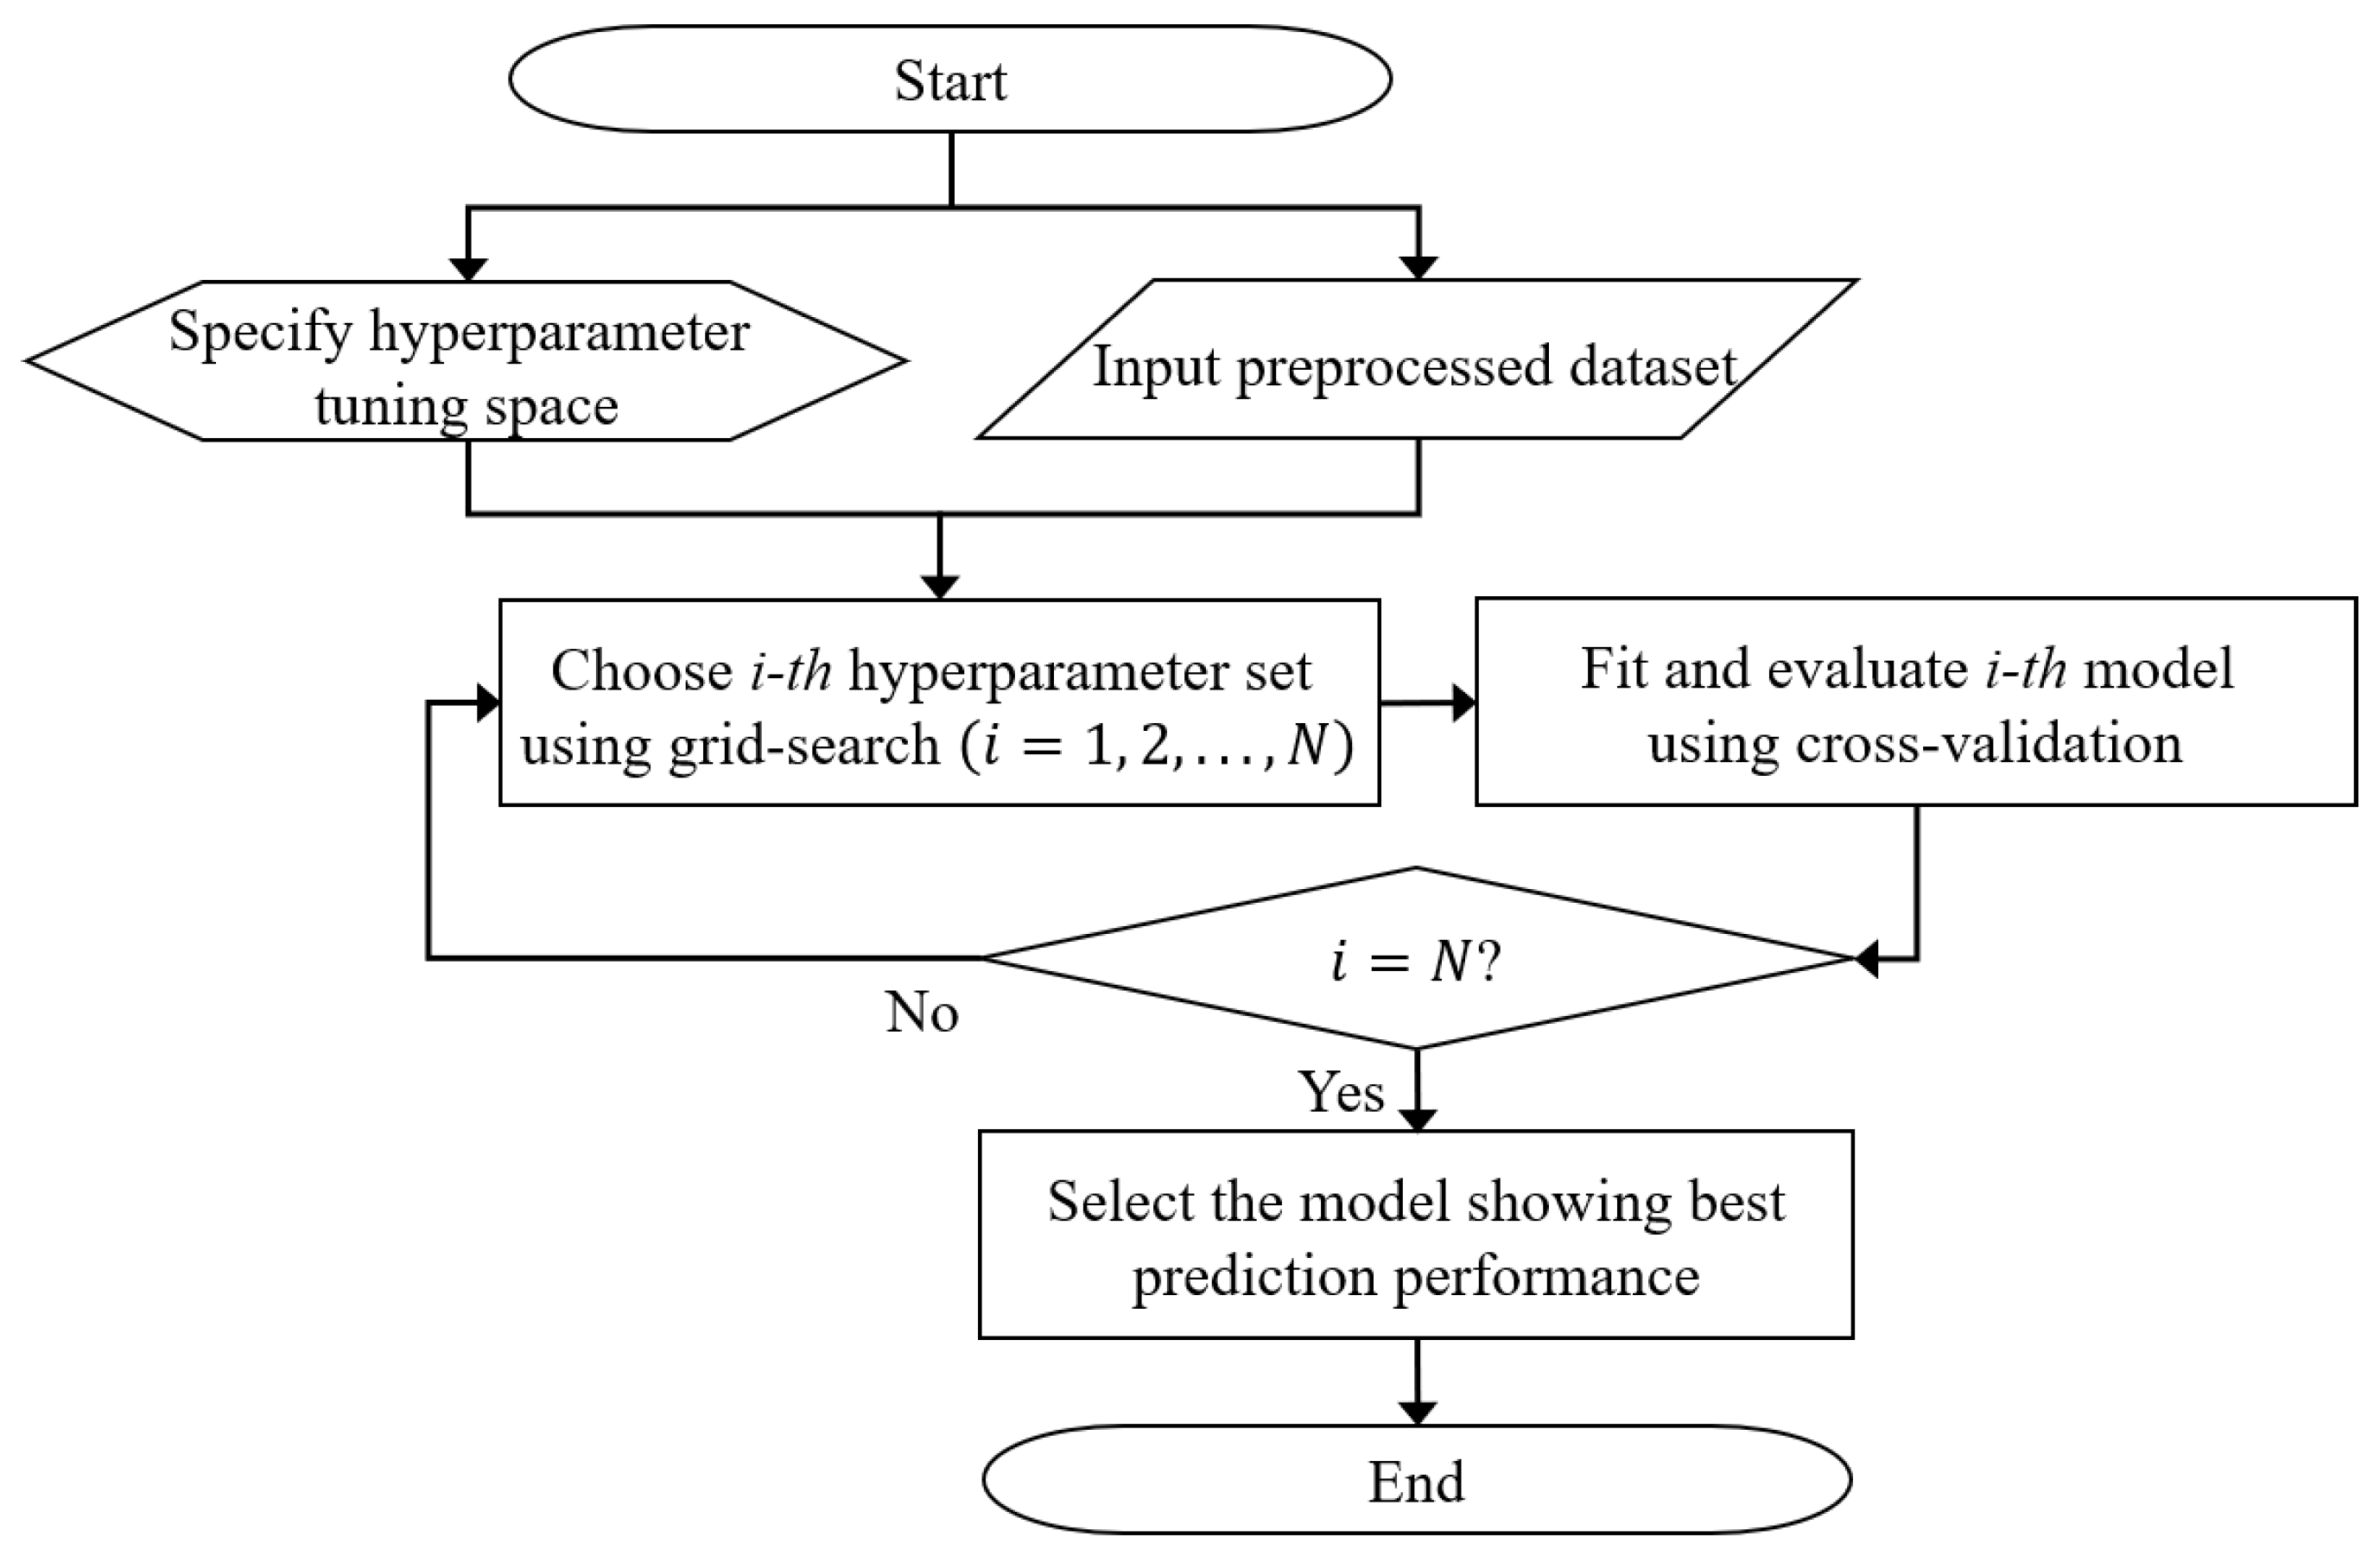
2.3. Algorithm for Real-Time Model Construction

The prediction model based on ARIMAX should be optimized automatically in every WF step to implement the WF. In accordance with this need, we develop an algorithm for model construction without the help of any human judgment (Figure 2). In the first stage, the tuning space of hyperparameters p, d, q, and r pertaining to ARIMAX must be specified. Giving a dataset to the algorithm, the i-th (i = 1, 2, …, N) hyperparameter set chosen from grid-search is used for model training. This process is repeated until N candidate models are built. Among N models, only the one with the lowest Akaike information criterion (AIC) [22] is finally selected as the predictive model.

3. Data Acquisition and Preprocessing

3.1. Brief Introduction to Projects A-1 and B-2

Project A, with a total length of 5.09 km, was constructed as a cable tunnel. The tunnel is divided into four sections according to the construction method: section A-1 as shield TBM (2.26 km), sections A-2 and A-4 (0.74, 1.63 km) as open cut, and section A-3 (0.46 km) as semi-shield TBM. The geological formation consists of predominantly Precambrian biotite banded gneiss and some intrusive rocks. In particular, small amounts of quartzite and limestone are interspersed in the metamorphic rock throughout the whole area. Section A-1, considered in this study, is located at a depth of between 45.0 and 51.5 m from the ground surface. Since the fractured zone is distributed along the tunnel alignment, an earth pressure balance (EPB) shield type was used to excavate the tunnel more efficiently.
On the other hand, project B (tunnel length is 5.22 km) was built as a subsea tunnel to supply power. The tunnel depth is 60 m from the seabed and passes through strata of soft and hard rock. In section B-2, a slurry shield type was used to resist the high water inflow. Details of equipment specifications are summarized in Table 1.

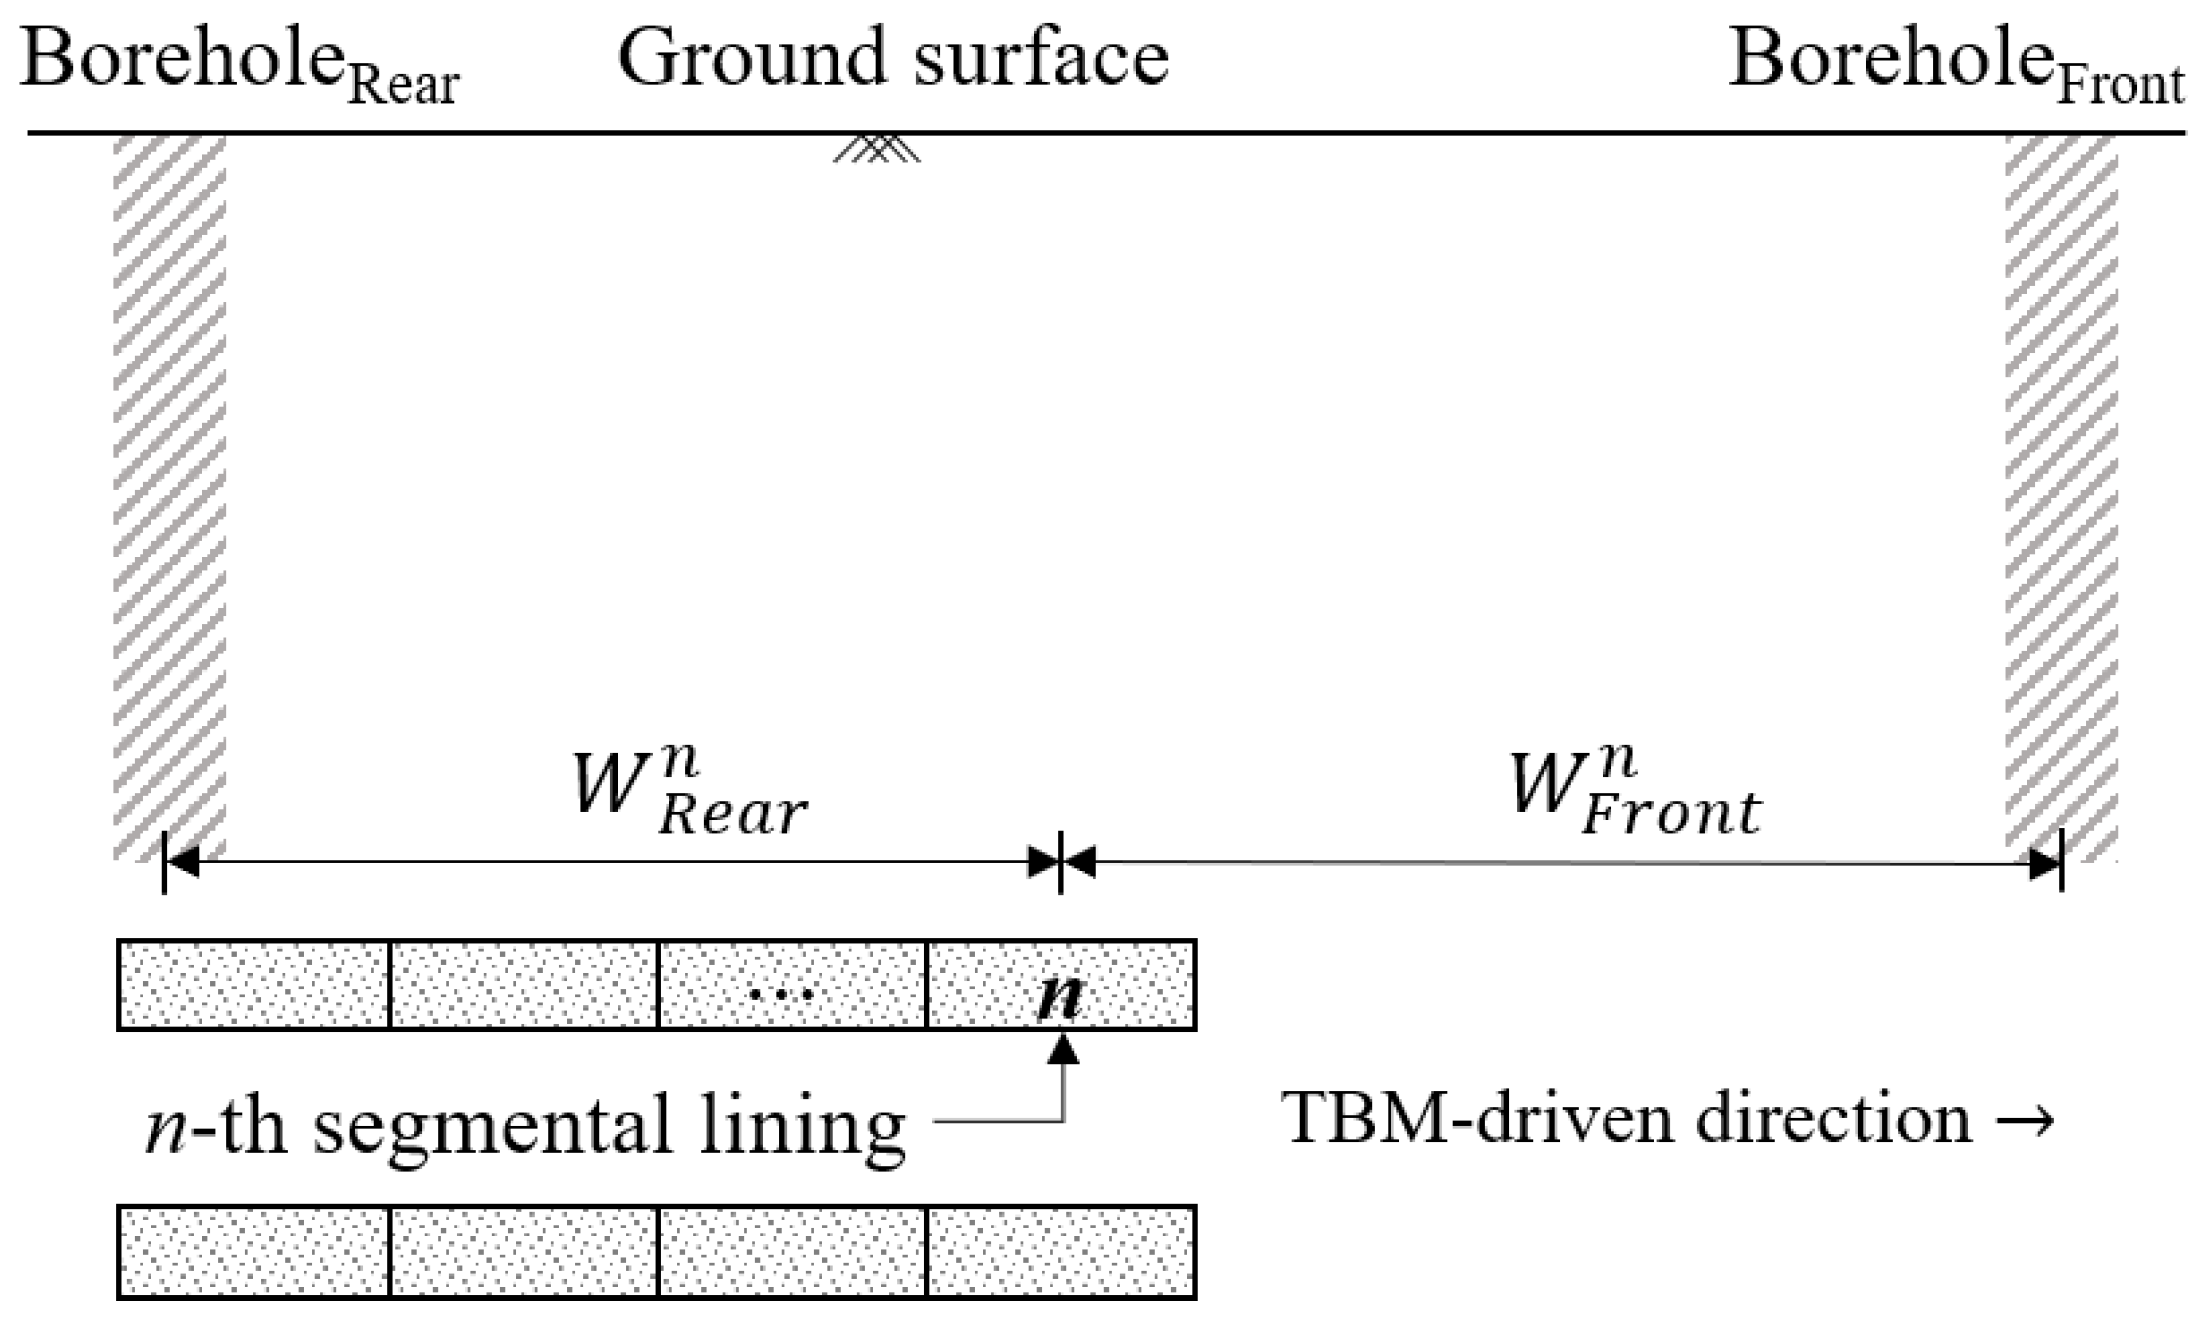
3.2. Data Augmentation

The size of borehole datasets obtained from projects is considerably smaller than the size of TBM operating datasets (Table 2). In other words, the tunnel sections positioned between the boreholes have none of the borehole information. For this reason, the loss of the TBM operating dataset between boreholes is inevitable due to the mismatch between geological information and the TBM operating dataset. Therefore, additional processing is a prerequisite to match the borehole and the TBM operating dataset.
In this study, a weight parameter expressed by a distance for the n-th segmental lining was introduced (Figure 3). The two weight parameters can be quantified as the distance between two adjacent boreholes from the n-th segmental lining position. The weight parameter makes it possible to retrieve both boreholes’ information for the n-th segmental lining. Using this parameter, we augmented the dataset with output (thrust) and input parameters, as summarized in Table 3.

4. Prediction Results

4.1. Initial Conditions and Prediction Procedure

To simulate tunneling, 30% of the entire dataset is assumed as the initial “in-sample”. The tuning spaces of the hyperparameter set concerning ARIMAX were specified by trial and error and by referring to the literature (Table 4) [23].
As mentioned in Section 2.2, prediction values for current thrust were sequentially stacked step by step until the WF’s final step is achieved, and then all of the predicted values were evaluated at once using a validation index, mean absolute percentage error (MAPE) (Equation (4)), which is a kind of indicator expressing the TBM penetration error as a percentage in reference to the actual value:
MAPE   ( % ) = 1 n × i = 1 n | actual   value i predicted   value i actual   value i | × 100

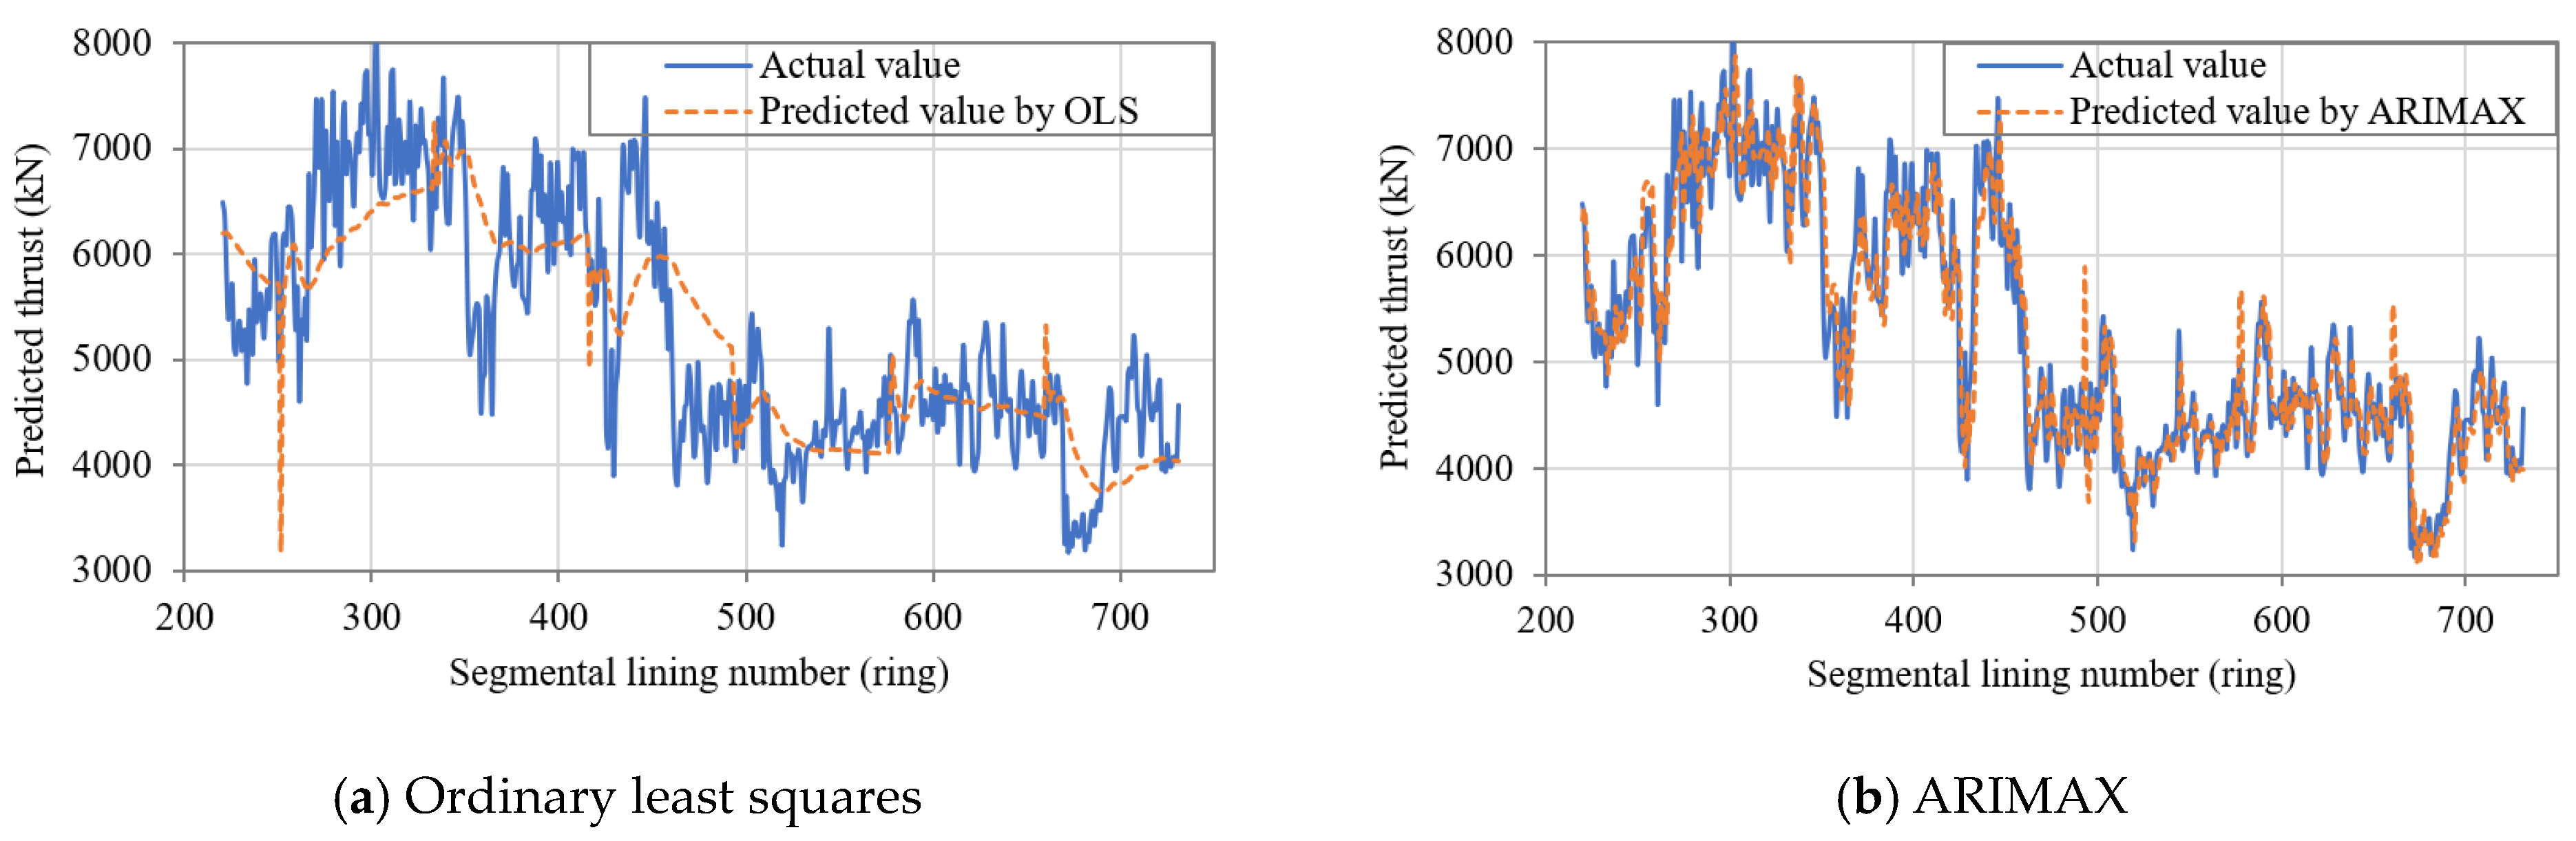
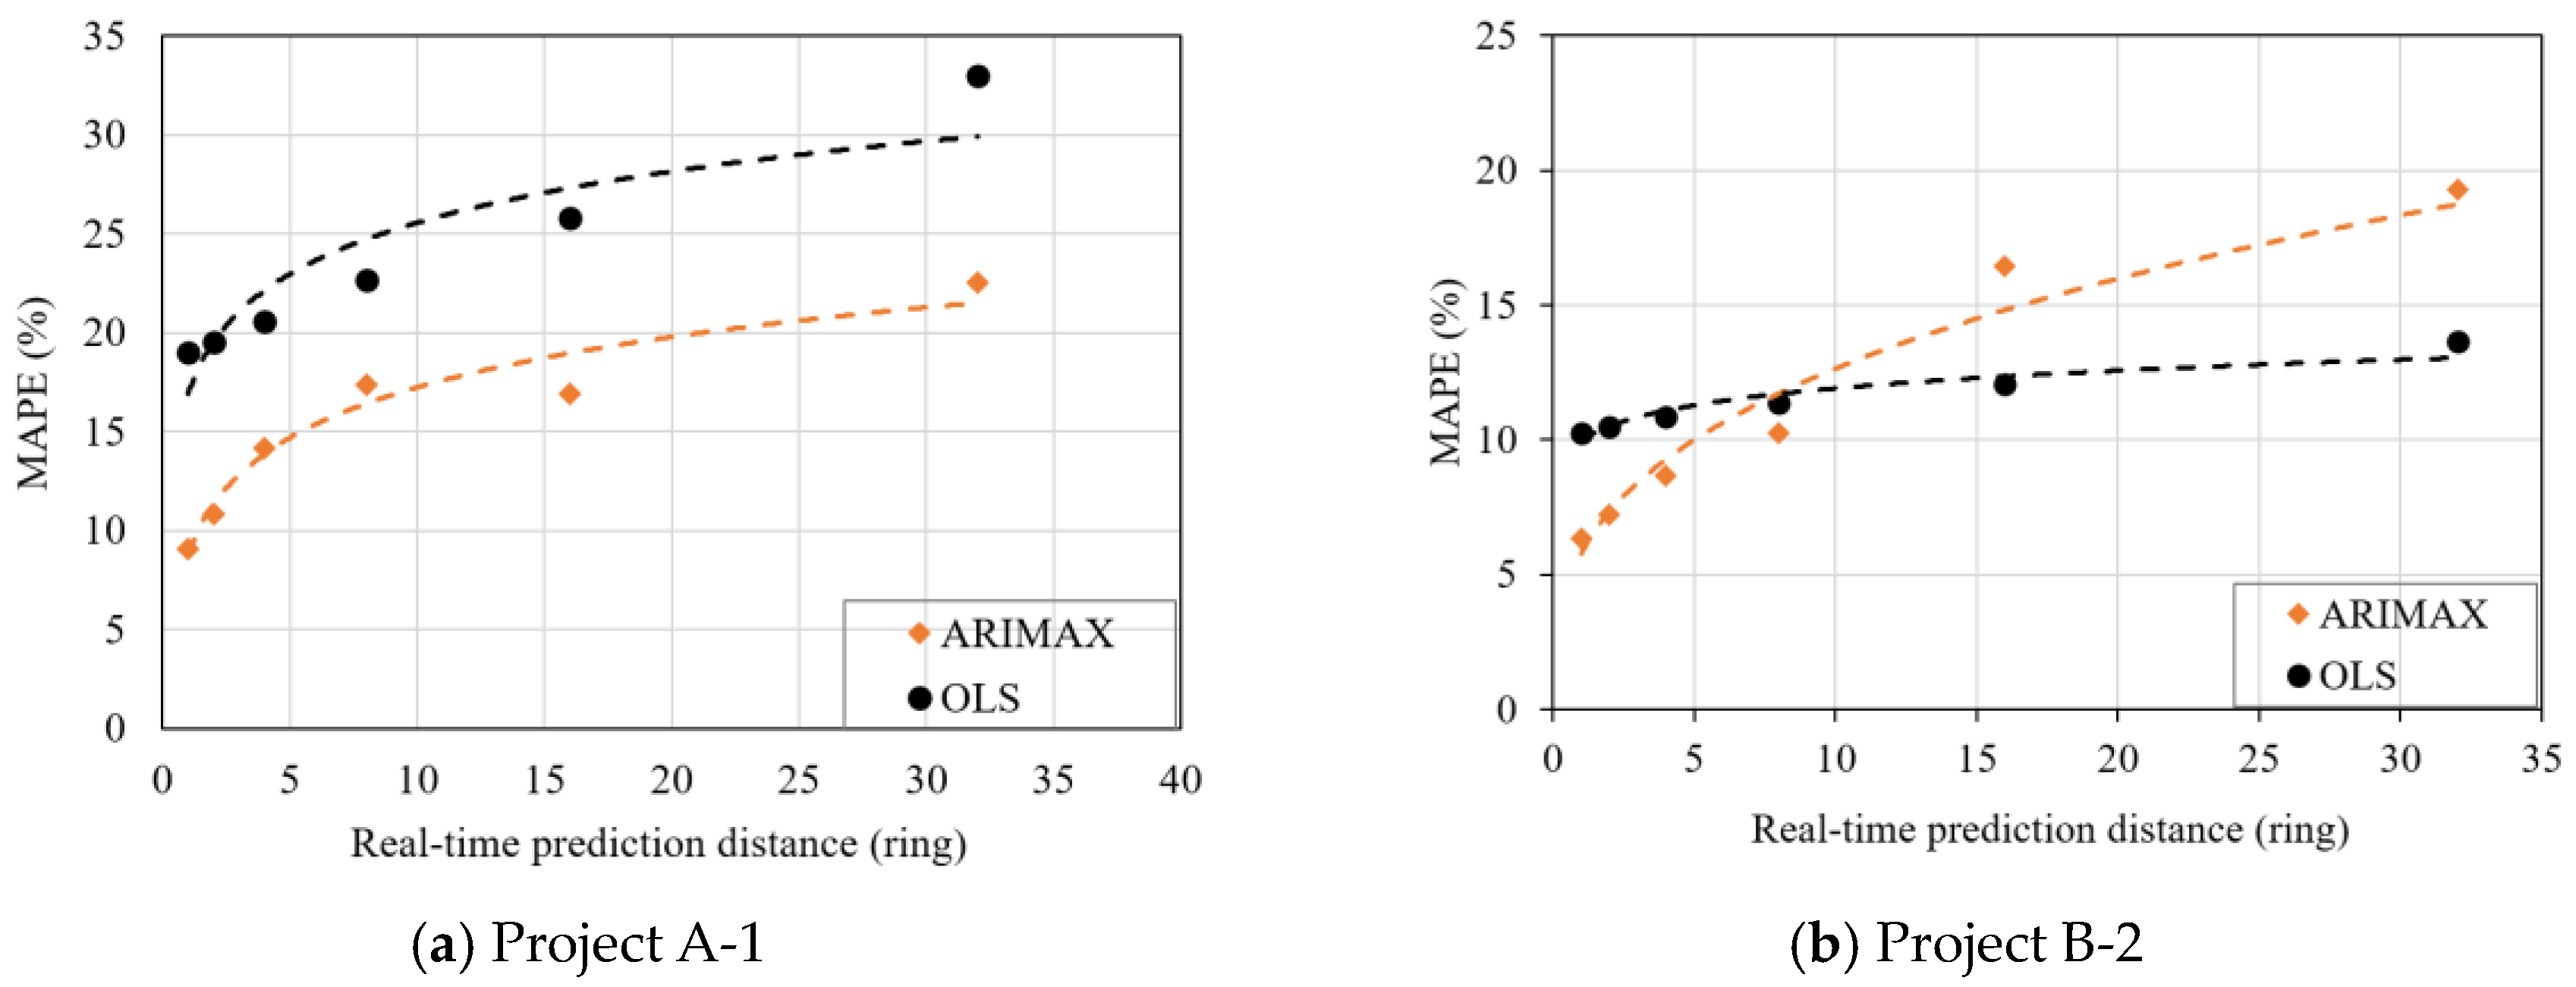
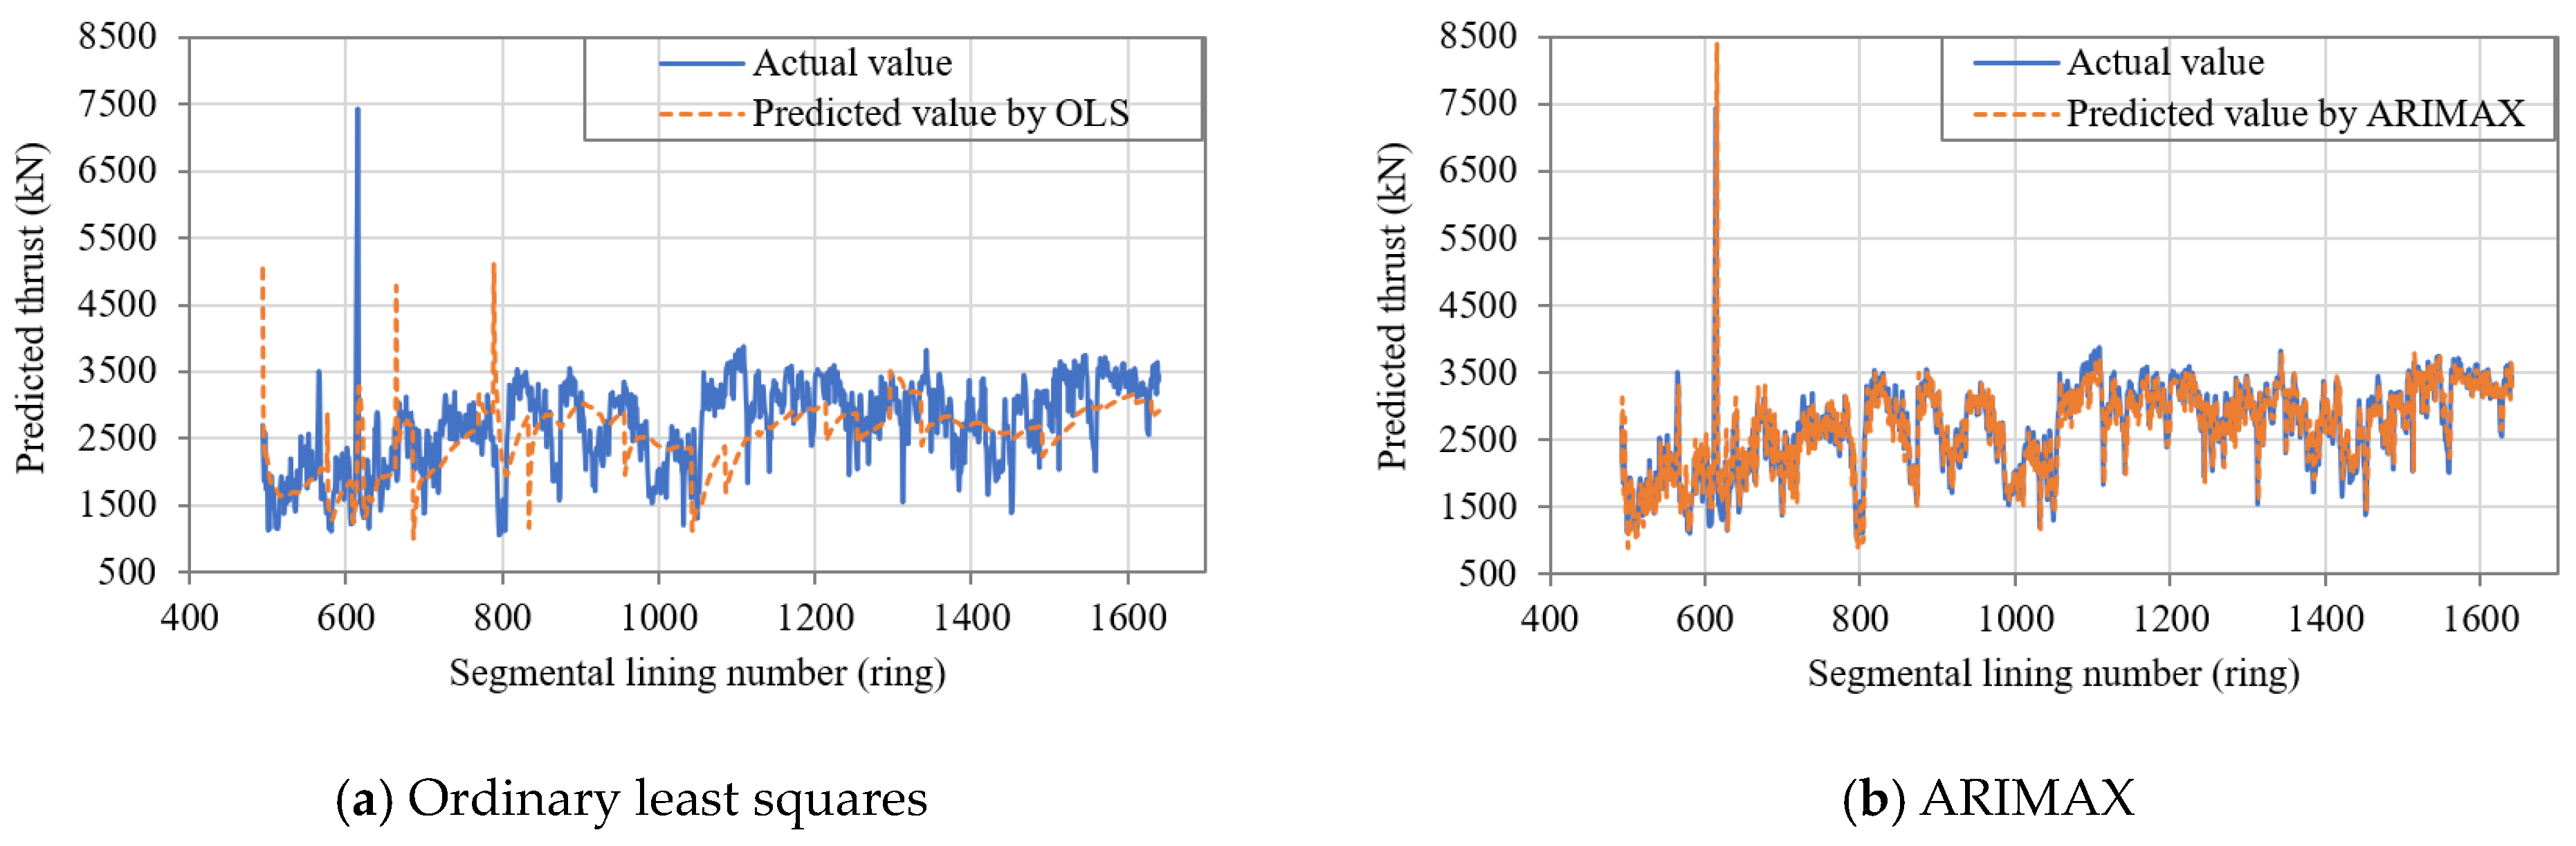
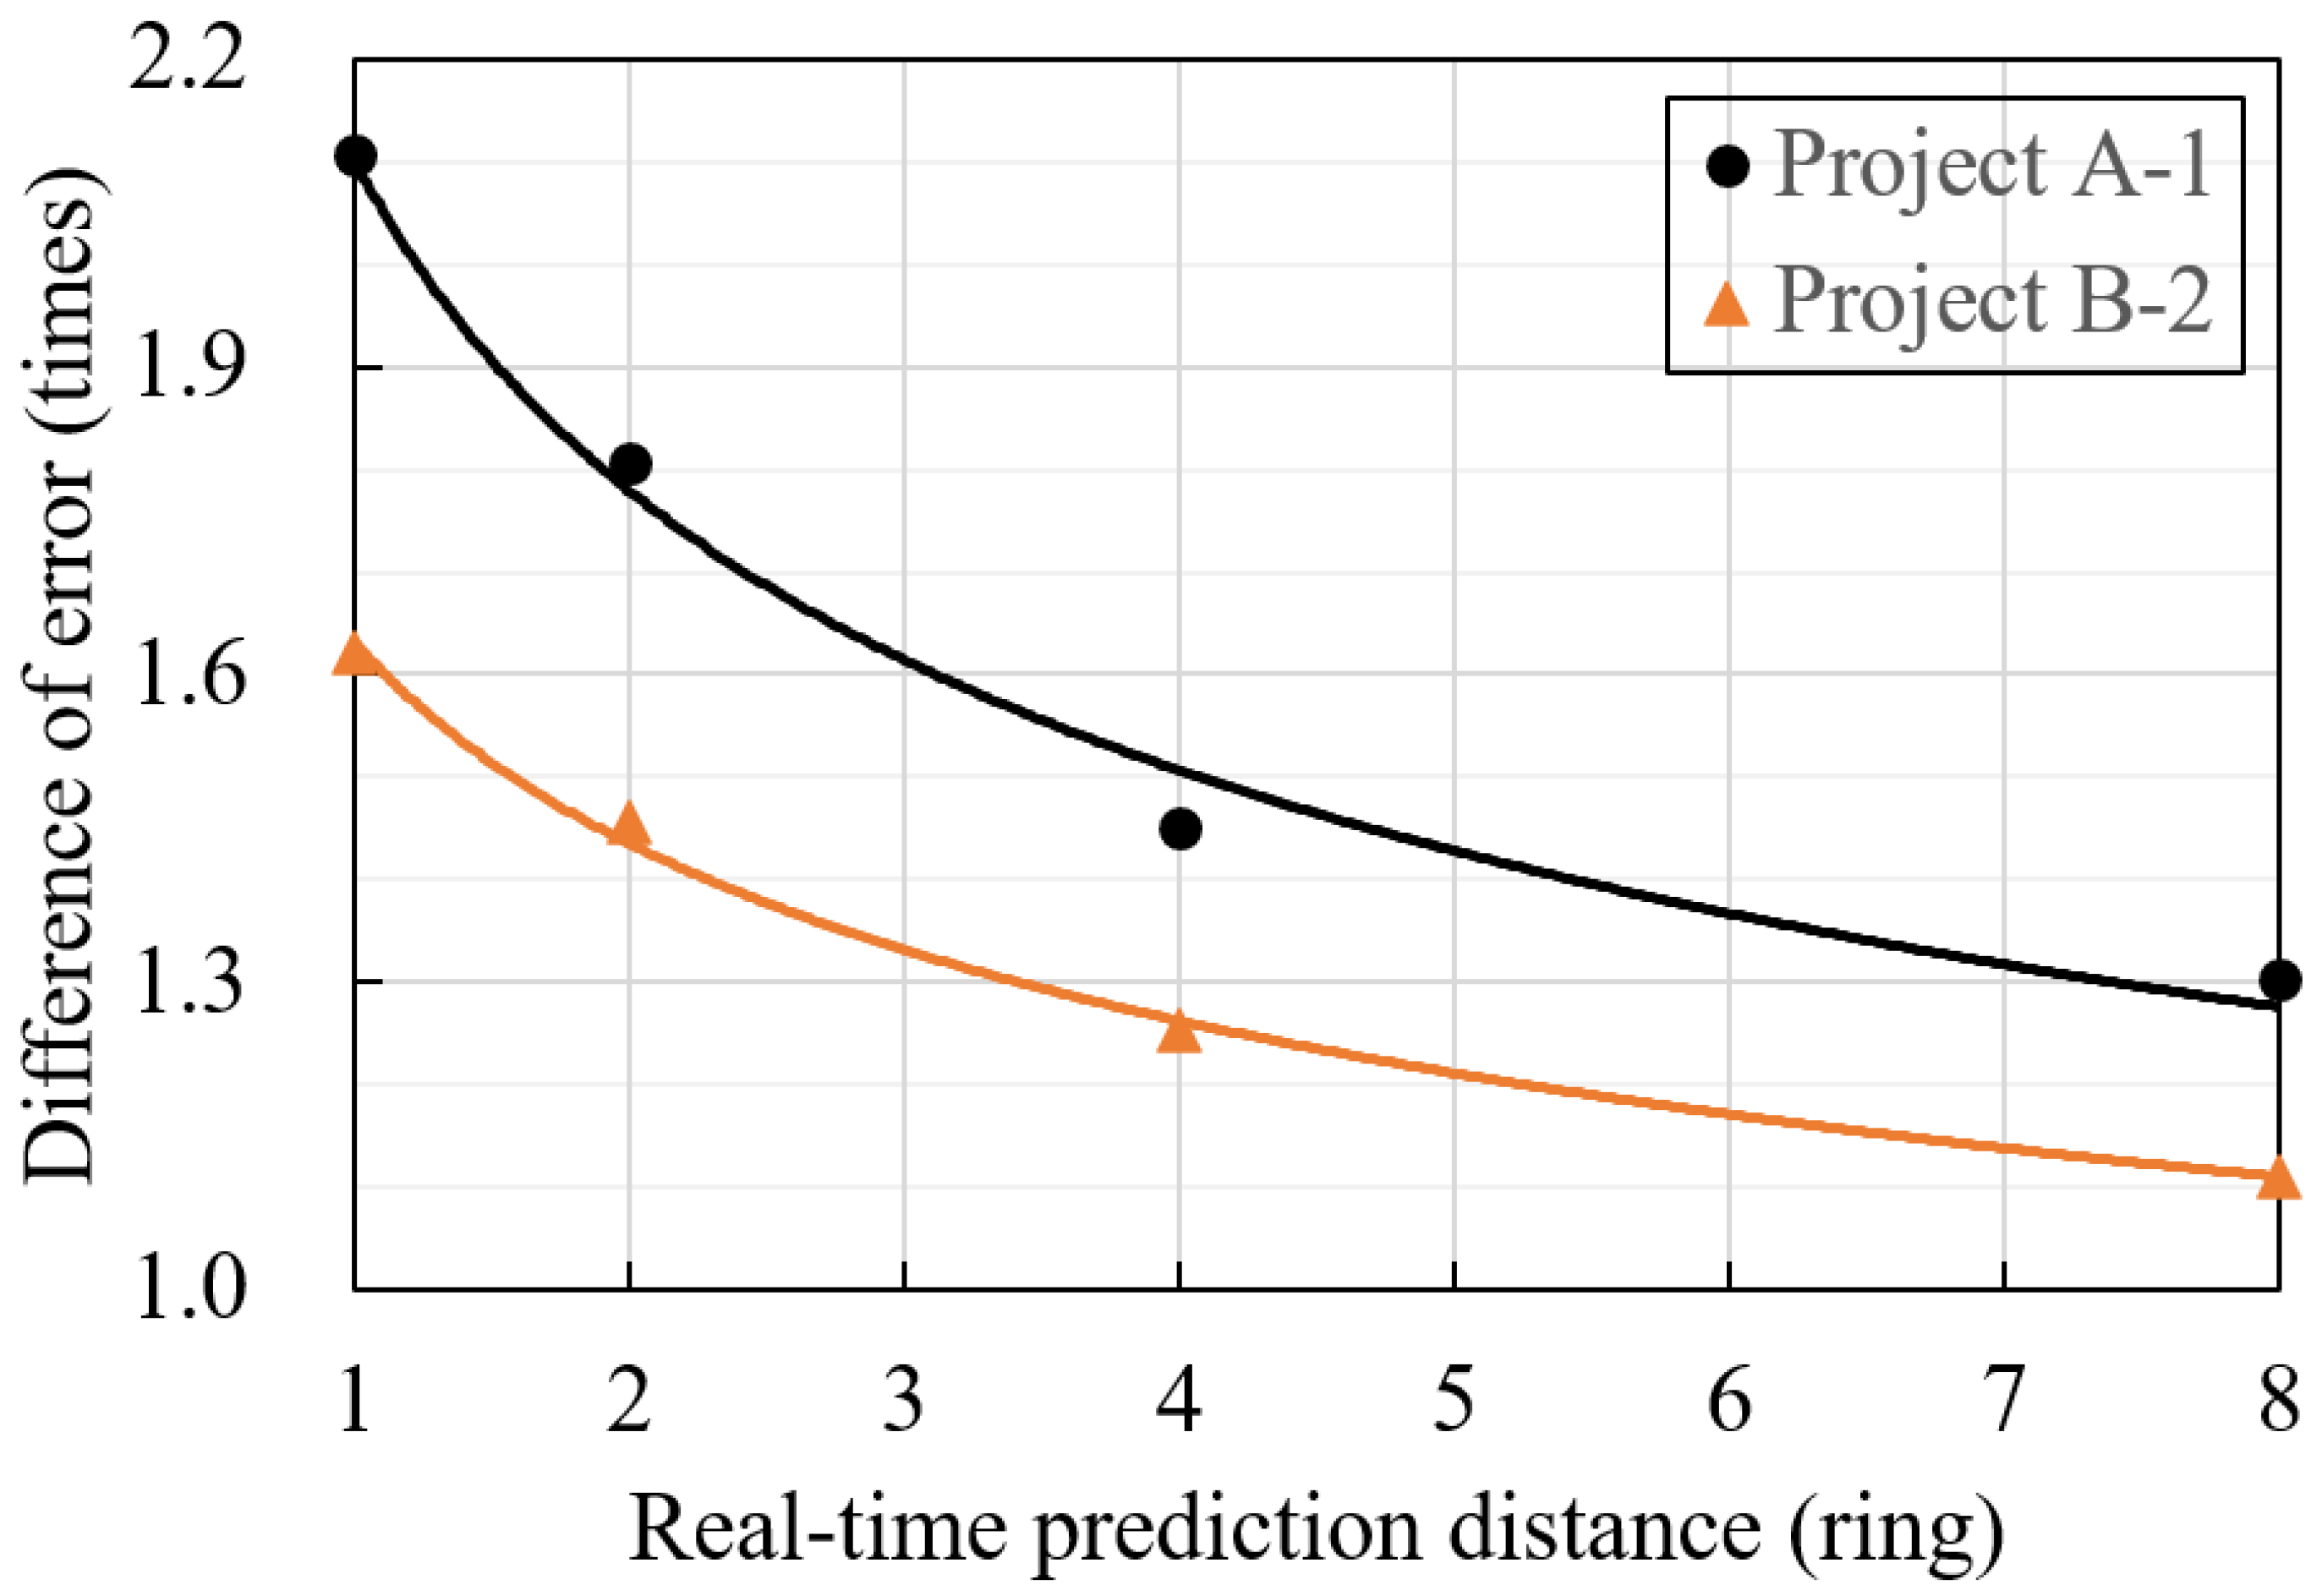
4.2. Prediction Analysis

Figure 4 and Figure 5 show the prediction results in projects A-1 and B-2, respectively. As shown in Figure 4, the ARIMAX predictor outperformed the non-time series-based ordinary least squares (OLS) predictor in project A-1. This phenomenon can also be seen in project B-2 (Figure 5). These results imply that the previous input values used in ARIMAX provide meaningful information for predicting the values of current thrust, and that the thrust has time-varying features.
Figure 4 and Figure 5 are the prediction results under the condition that the real-time prediction distance (out-of-sample size) is one segmental lining. For practical applications, an additional analysis was performed according to the real-time prediction distance (Figure 6). As the real-time prediction distance increases, the MAPE (%) also increased logarithmically in both ARIMAX and OLS. As for the comparison between the two predictors, the ARIMAX outperforms OLS regardless of the real-time prediction distance in project A-1. The result in project B-2 also showed a similar trend, but when the real-time prediction distance is more than 8 rings, the performance for the ARIMAX began to be lower than the performance of OLS. The output of the ARIMAX predictor is dependent on time series, whereas OLS is not. If the real-time prediction distance increases, that of the future period to be predicted will also increase, which means ARIMAX does not guarantee a higher prediction accuracy in a longer future period. Based on the experimental tests with the two projects, it can be interpreted that time series-based ARIMAX provides meaningful results where the real-time prediction distance is under 8 rings for practical application.
To compare the relative performance between WF based on ARIMAX and OLS, we calculated the difference in error in the unit of times (Figure 7). When the real-time prediction distance is 8 rings, the ARIMAX outperformed OLS by approximately 1.3 times in project A-1, and 1.1 times in project B-2. As the real-time prediction distance gradually decreased from 8 rings, the difference in error showed increasing patterns in both projects. The distance of 8 rings corresponds to about 10 m (1.2 m/ring), and such a time interval gives enough time for TBM operators to make a decision. However, a universal value for allowable real-time prediction distance cannot been specified because it varies with the project’s conditions. Accordingly, this value (11 m) can be used only as a reference, and application to more projects would be needed to approximate the universal value.

4.3. Contributions and Limitations

The WF based on ARIMAX can provide reasonable TBM operating conditions with time-varying data if a reliable dataset can be secured in the TBM project. This method can be utilized in decision-making to improve the excavation performance of TBM. As for the optimum real-time prediction distance, more application to various sites will be required to determine this.

5. Conclusions

We simulated WF based on ARIMAX in consideration of both geological parameters and previous TBM operating parameters. Two actual projects with different construction conditions were selected to test the performance of the method. For comparative analysis, the proposed method was compared with non-time series OLS. Additionally, the prediction of current thrust was examined depending on the real-time prediction distance to validate the practical applicability. The simulation results showed that the ARIMAX outperforms the OLS predictor in both projects. As for the analysis according to the real-time prediction distance, the results showed that time series-based ARIMAX provides meaningful results where the real-time prediction distance is under 8 rings (11 m) or less. Such a time interval gives enough time for TBM operators to make decisions. The WF based on ARIMAX can provide reasonable TBM operating conditions with time-varying data. Of course, there remain several challenges such as outlier processing for in situ data and consideration of the operator’s driving skills. Nevertheless, this study is expected to be used as an important reference for the development of predicting various operating parameters in the future.

Author Contributions

Conceptualization, H.-L.L., K.-I.S. and C.Q.; Methodology, H.-L.L. and C.Q.; Writing—original draft, H.-L.L., K.-I.S., C.Q., J.-S.K. and K.-S.K.; Writing—review & editing, H.-L.L., K.-I.S., C.Q., J.-S.K. and K.-S.K. All authors have read and agreed to the published version of the manuscript.

Funding

This work was supported by a National Research Foundation of Korea (NRF) grant funded by the Korea government (MSIT) (no. NRF-2020R1F1A1075881). This research was also supported by the Nuclear Research and Development Program of the National Research Foundation of Korea (NRF-2021M2C9A1018633) funded by the Minister of Science and ICT.

Conflicts of Interest

The authors declare no conflict of interest.

References

  1. Delisio, A.; Zhao, J. A new model for TBM performance prediction in blocky rock conditions. Tunn. Undergr. Space Technol. 2014, 43, 440–452. [Google Scholar] [CrossRef]
  2. Rostami, J. Performance prediction of hard rock Tunnel Boring Machines (TBMs) in difficult ground. Tunn. Undergr. Space Technol. 2016, 57, 173–182. [Google Scholar] [CrossRef]
  3. Maidl, B.; Herrenknecht, M.; Maidl, U.; Wehrmeyer, G. Mechanised Shield Tunnelling; John Wiley & Sons: Berlin, Germamy, 2013. [Google Scholar]
  4. Wang, L.; Gong, G.; Shi, H.; Yang, H. Modeling and analysis of thrust force for EPB shield tunneling machine. Autom. Constr. 2012, 27, 138–146. [Google Scholar] [CrossRef]
  5. Zhang, Q.; Su, C.X.; Qin, Q.H.; Cai, Z.X.; Hou, Z.D.; Kang, Y.L. Modeling and prediction for the thrust on EPB TBMs under different geological condi-tions by considering mechanical decoupling. Sci. China Technol. Sci. 2016, 59, 1428–1434. [Google Scholar] [CrossRef]
  6. Gertsch, R.; Gertsch, L.; Rostami, J. Disc cutting tests in Colorado Red Granite: Implications for TBM performance prediction. Int. J. Rock Mech. Min. Sci. 2007, 44, 238–246. [Google Scholar] [CrossRef]
  7. Cho, J.-W.; Jeon, S.; Jeong, H.-Y.; Chang, S.-H. Evaluation of cutting efficiency during TBM disc cutter excavation within a Korean granitic rock using linear-cutting-machine testing and photogrammetric measurement. Tunn. Undergr. Space Technol. 2013, 35, 37–54. [Google Scholar] [CrossRef]
  8. Yagiz, S. New equations for predicting the field penetration index of tunnel boring machines in frac-tured rock mass. Arab. J. Geosci. 2017, 10, 33. [Google Scholar] [CrossRef]
  9. Hassanpour, J.; Firouzei, Y.; Hajipour, G. Actual performance analysis of a double shield TBM through sedimentary and low to medium grade metamorphic rocks of Ghomrood water conveyance tunnel project (lots 3 and 4). Bull. Int. Assoc. Eng. Geol. 2021, 80, 1419–1432. [Google Scholar] [CrossRef]
  10. Naghadehi, M.Z.; Samaei, M.; Ranjbarnia, M.; Nourani, V. State-of-the-art predictive modeling of TBM performance in changing geolog-ical conditions through gene expression programming. Measurement 2018, 126, 46–57. [Google Scholar] [CrossRef]
  11. Salimi, A.; Rostami, J.; Moormann, C.; Delisio, A. Application of non-linear regression analysis and artificial intelligence algorithms for performance prediction of hard rock TBMs. Tunn. Undergr. Space Technol. 2016, 58, 236–246. [Google Scholar] [CrossRef]
  12. Sun, W.; Shi, M.; Zhang, C.; Zhao, J.; Song, X. Dynamic load prediction of tunnel boring machine (TBM) based on heterogeneous in-situ data. Autom. Constr. 2018, 92, 23–34. [Google Scholar] [CrossRef]
  13. Gao, X.; Shi, M.; Song, X.; Zhang, C.; Zhang, H. Recurrent neural networks for real-time prediction of TBM operating parameters. Autom. Constr. 2019, 98, 225–235. [Google Scholar] [CrossRef]
  14. Delisio, A.; Zhao, J.; Einstein, H.H. Analysis and prediction of TBM performance in blocky rock conditions at the Lötschberg Base Tunnel. Tunn. Undergr. Space Technol. 2013, 33, 131–142. [Google Scholar] [CrossRef]
  15. Villeneuve, M. Using Tunnel Boring Machine Penetration Tests to Quantify Performance in Hard Rock; UC Research Repository: Napier, Italy, 2017. [Google Scholar]
  16. Box, G.E.; Jenkins, G.M.; Reinsel, G.C.; Ljung, G.M. Time Series Analysis: Forecasting and Control; John Wiley & Son: Hoboken, NJ, USA, 2015. [Google Scholar]
  17. Yule, G.U. Why do we sometimes get nonsense-correlations between Time-Series?—A study in sam-pling and the nature of time-series. J. R. Stat. Soc. 1926, 89, 1–63. [Google Scholar] [CrossRef]
  18. Slutsky, E. Problems of Economic Conditions, 3, 1 (1927). Engl. Transl. Econom. 1937, 5, 105. [Google Scholar]
  19. Bruland, A. Hard Rock Tunnel Boring; Fakultet for ingeniørvitenskap og teknologi: Trondheim, Norway, 2000. [Google Scholar]
  20. Rostami, J. Development of a Force Estimation Model for Rock Fragmentation with Disc Cutters through Theoretical Modeling and Physical Measurement of Crushed Zone Pressure. Ph.D. Thesis, Colorado School of Mines Golden, Golden, CO, USA, 1997. [Google Scholar]
  21. Kirkpatrick, C.D., II; Dahlquist, J.A. Technical Analysis: The Complete Resource for Financial Market Technicians; FT Press: Upper Saddle River, NJ, USA, 2010. [Google Scholar]
  22. Akaike, H. Information theory and an extension of the maximum likelihood principle. In Selected Papers of Hirotugu Akaike; Springer: Berlin/Heidelberg, Germany, 1998; pp. 199–213. [Google Scholar]
  23. Williams, B.M. Multivariate Vehicular Traffic Flow Prediction: Evaluation of ARIMAX Modeling. Transp. Res. Rec. 2001, 1776, 194–200. [Google Scholar] [CrossRef]
Figure 1. Example of real-time prediction procedure for walk forward (WF) in project A-1.
Applsci 11 02967 g001
Figure 2. ARIMAX-based algorithm for constructing model.
Applsci 11 02967 g002
Figure 3. n-th weight parameters corresponding to n-th segmental lining.
Applsci 11 02967 g003
Figure 4. Prediction results of current thrust in project A-1.
Applsci 11 02967 g004
Figure 5. Prediction results of current thrust in project B-2.
Applsci 11 02967 g005
Figure 6. Prediction error for the stacked values of current thrust in projects A-1 and B-2 according to real-time prediction distance.
Applsci 11 02967 g006
Figure 7. Difference in error (mean absolute percentage error (MAPE)) of ordinary least squares (OLS) with reference to ARIMAX in projects A-1 and B-2.
Applsci 11 02967 g007
Table 1. Specifications of shield tunnel boring machine (TBM) applied to projects A-1 and B-2.
ListProject
A-1B-2
TBM typeEPB shieldSlurry shield
Excavation diameter3.40 m353 m
Maximum thrust9600 kN12,000 kN
Maximum cutterhead revolution per minute90 rev/min4.6 rev/min
Maximum cutterhead power630 kW440 kW
Maximum cutterhead torque1250 kN·m1410 kN·m
Table 2. The size of the dataset for borehole and TBM operating parameters.
ProjectNumber of Data
Borehole DatasetTBM Operating Dataset
A-1411641
B-210731
Table 3. Input parameters for predicting the current value of thrust.
Input CategoryContents
Geological parameterUCS, RQD, RMR, Pw, Sw, De, Ab
Weight parameterW
Operating parameterThrust (previous)
W, weight parameter; UCS, uniaxial compressive strength; RQD, rock quality designation; RMR, rock mass rating; Pw, P-wave velocity; Sw, S-wave velocity; De, deformation modulus; Ab, absorption ratio.
Table 4. Hyperparameter tuning space related to ARIMAX.
HyperparameterRangeSampling Method
p and r 1–5Grid search
d 0–2
q 0–2
Publisher’s Note: MDPI stays neutral with regard to jurisdictional claims in published maps and institutional affiliations.

