Abstract
This paper deals with the control problems of a wind turbine working in its nominal zone. In this region, the wind turbine speed is controlled by means of the pitch angle, which keeps the nominal power constant against wind fluctuations. The non-uniform profile of the wind causes tower displacements that must be reduced to improve the wind turbine lifetime. In this work, an adaptive control structure operating on the pitch angle variable is proposed for a nonlinear model of a wind turbine provided by FAST software. The proposed control structure is composed of a gain scheduling proportional–integral (PI) controller, an adaptive feedforward compensation for the wind speed, and an adaptive gain compensation for the tower damping. The tuning of the controller parameters is formulated as a Pareto optimization problem that minimizes the tower fore-aft displacements and the deviation of the generator speed using multi-objective genetic algorithms. Three multi-criteria decision making (MCDM) methods are compared, and a satisfactory solution is selected. The optimal solutions for power generation and for tower fore-aft displacement reduction are also obtained. The performance of these three proposed solutions is evaluated for a set of wind pattern conditions and compared with that achieved by a classical baseline PI controller.
1. Introduction
Wind energy has a leading role in the current great demand for renewable energy and is one of the sources that has experienced a greater growth in recent decades [1]. In order for this energy to be competitive, it is necessary to reduce its production and maintenance costs [2]. From a control point of view, this can be achieved by operating wind turbines to generate energy captured from the wind more efficiently and to reduce their different structural loads improving their reliability [3]. Furthermore, the control system design of wind turbines is even more difficult due to the fact that wind turbines are non-linear systems with multiple outputs to be controlled and are subjected to intermittent and variable disturbances such as the wind direction and wind magnitude [4,5].
Traditionally, single controllers have been used in the different operating zones of the turbine, either to extract as much energy as possible for low wind speeds or to limit the generated power to its nominal value and thus avoid potential damages at high wind speeds [6]. Nowadays, horizontal axis variable speed and variable blade pitch (VS–VP) wind turbines with three blades are the most widespread because they allow the generation of optimal power at different wind speeds [7]. VS–VP wind turbines can work in several operational regions depending on the wind speed [8]: cut-in (I), partial load (II), transition (III), full load (IV), and cut-out (V). The ideal power curve of a wind turbine is illustrated in Figure 1, where the potential generated power according to the wind speed is shown, and the different operation regions are marked.
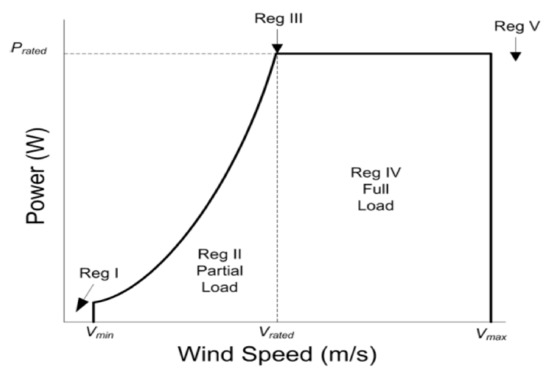
Figure 1.
Operation regions of a wind turbine [9].
This work is focused on region IV (full load region), where the effect of the high wind speed has to be reduced in order to avoid damages on the system. In this case, it is necessary to maintain the generator power and, consequently, the generator speed, at their nominal values. This is performed by means of controllers that act on the blade pitch angle to modify the wind turbine aerodynamics limiting the energy extracted from the wind [10]. In this region, the generated power (Pg) depends exclusively on the generator speed (ωg) according to Equation (1), since the generator torque is kept constant at its rated value.
On the other hand, unmitigated structural loads can cause undesirable performance or even lead to early failure of the whole wind turbine system. The various types of these loads are commonly caused by the different deflection modes in the tower and rotor blades or vibrations in the turbine drive train. The tower structure mainly shows two vibration modes: fore-aft and side-to-side. The fore-aft movement is the tower rocking from back to front. There is a wide variety of works dealing with the mitigation of this vibration mode [11,12,13].
Devices such as calibrated liquid column dampers (TLCDs) can be used in order to reduce these undesired oscillations. They can be fully passive [14] or semi-actively controlled [15,16]. Another option is to use active control methods. Some commercial controllers use pitch control to actively mitigate the tower fore-aft (f-a) movement when the wind turbine is operating at region IV. This is called Active Tower Damping Control (ATDC) and is usually performed adding another control loop to the basic turbine speed controller [17].
Feedforward control is another strategy that can be used to decrease structural fatigue and improve reference tracking of the generator speed. Traditionally, wind speed was measured in wind turbines through an anemometer, which was placed on the top of the nacelle. Nowadays, a more precise wind speed measurement can be obtained by means of technology based on light detection and ranging (LIDAR) [18]. LIDAR sensors allow a better implementation of those control strategies that take into account such measured variables. There is a wide variety of studies using feedforward pitch control in wind turbines to reduce fatigue in different parts, such as the longitudinal bending moment of the tower base [19,20,21]. As for the ATDC case, feedforward is usually combined with a closed loop proportional-integral-derivative (PID) control to take advantage of both strategies. This can significantly improve the performance of the system in those cases in which the disturbance can be measured before affecting the controlled variable.
Considering all the control elements discussed previously, computational intelligence methods seem to be a practicable alternative to address wind turbine control problems. These methods such as Artificial Neural Networks (ANN) and the Genetic Algorithm (GA) are well known to be computational tools to improve the performance of control techniques [22]. As recent applications in wind turbines, in [23] the use of a neuro-estimator based on neural networks is implemented, obtaining relevant improvements in the performance of the wind turbine pitch control. In another work [24], a neural controller for wind turbine pitch control based on a radial basis function (RBF) network is compared with a tuned PID obtaining better results. There are other works in technical optimization on wind turbines where the use of genetic algorithms helps the artificial neural network to reduce the computational cost and obtain better results in the optimization [25].
Wind turbine control problem can also be treated as a multi-objective problem considering a trade-off between optimizing power performance and lowering the structural loads on the wind turbine [26]. The Multi-Objective Genetic Algorithm (MOGA) method leads always to a correct and accurate identification of the whole Pareto front [27]. The results obtained by implementing the MOGA method do not depend on the analyzed objective and constraint functions. The drawback of the MOGA method is the large number of iterations required and, consequently, the large computational effort required to identify the Pareto front [27,28]. Recent works use multi-objective optimization techniques to obtain a more efficient control of wind turbines with the help of emulated models. In [29], a coordination strategy between the blade pitch controller and generator torque and power controller is proposed through the Pareto optimization theory. In another work [30], a multi-objective optimization using a genetic algorithm is used to provide an optimal selection of the orthogonal TLCDs designs which reduce the fore-aft and side-to-side fatigue and extreme loads.
Other scientific works use this methodology applied on real wind turbines, although the latter are scarcer. In [31], an intelligent optimization method has been proposed to optimize the potential performance though yaw control strategy of a real wind turbine manufactured by China Ming Yang Wind Power (CMYWP). In this case, the Pareto front had two conflicting objectives: the minimization of the power reduction factor and the minimization of the yaw actuator.
The testing of optimization and control strategies applied directly to real wind turbines is unusual [32]. There is software that allows representing the aeroelastic and dynamic characteristics of a wind turbine without physically depending on the natural resources of the wind and a real wind turbine. Wind energy industry often uses aeroelastic simulators for horizontal-axis wind turbines and can analyze its turbines. FAST software is the primary physics-based engineering tool created by National Renewable Energy Laboratory (NREL) for simulating the coupled dynamic response of wind turbines. Germanischer Lloyd (GL) WindEnergie GmbH, the world’s foremost certifying body for wind turbines and currently called Det Norske Veritas (DNV), issued a statement that it is acceptable for manufacturers to use the NREL codes for wind turbine certification [32]. Recent works of great scientific impact have been developed using FAST software related to wind turbine control [33,34,35,36]. In [37], a particle swarm optimization (PSO) and Pareto front-based algorithm have been developed in order to find the optimal actions that satisfy the compromise between the power gain and the mechanical loads due to the yaw rotation.
In this work, an adaptive wind turbine control structure operating on the pitch variable in the nominal zone is developed. The proposed control strategy mainly combines two control loops, the first one to maintain the generator speed at its nominal value, and the second one to reduce the tower f-a displacements. The three elements of the control scheme are the following ones: a gain scheduling proportional–integral (PI) controller that regulates the turbine speed by actuating on the pitch angle, an adaptive feedforward that compensates for the changes in wind speed, and an active tower damping control that generates an extra pitch control component proportional to the tower f-a velocity for reducing the tower’s structural fatigue.
Because of the non-linearity of the system, these three proposed components are adaptive by gain scheduling according to the generator speed and/or the wind speed. An identification of six linear models at different operating points has been performed for tuning these controllers. For each identified model, a PI controller with fore-aft control and feedforward compensation is tuned by means of a multi-objective genetic algorithm (MGA) using two objective functions: one related to the generator speed error and other one related to the tower f-a displacements. To perform the optimization, the wind turbine model is simulated using Matlab/Simulink with the assistance of FAST (Fatigue, Aerodynamics, Structures, and Turbulence) software [38,39]. The different obtained solutions are analyzed with multiple criteria decision-making (MCDM) methods, and an average solution of the chosen MCDM methods is calculated as the optimal solution for each operating point.
The paper is organized as follows: Section 2 introduces a preliminary background about Pareto optimization and multiple criteria decision-making methods. In Section 3, the proposed adaptive control scheme is described. Section 4 shows a comparative analysis between the proposed controllers and a baseline controller. Finally, the conclusions are summarized in Section 5.
2. Background on Multi-Objective Optimization
In this section, some elements of the control methodology used in this work are summarized.
In multi-objective optimization problems, a number of optimal solutions can be found given a set of conflicting objectives. A Pareto front solution is a methodology that provides data for decision-making considering a trade-off between the divergent objective functions [40].
For these multi-objective problems, diverse strategies first define a cost function with weights for different goals, and later the optimization problem is solved. An optimization strategy based on Pareto efficiency to optimize two objective optimization problem was developed in [26,40]. The essential concepts of multi-objective optimization, definitions of Pareto optimal solutions, and Pareto efficiency are described in [29,40,41].
Multi-objective optimization problems are often solved by means of evolutionary algorithms, such as genetic algorithms, due to their practical benefits over traditional optimization techniques [42]. Genetic algorithms can be combined with local searching methods, achieving better computational efficiency [43,44]. In 2002, a fast elitist non-dominated sorting genetic algorithm (NSGA-II) was designed [44]; it is an enhanced version of the traditional nondominated sorting genetic algorithm (NSGA) [43]. In the current work, the algorithm NSGA-II for tuning the parameters of the proposed control scheme is employed.
A representative example of a Pareto frontier is shown in Figure 2. The boxed points represent viable solutions to an optimization problem with two objectives to be optimized. Smaller values are preferred to larger ones; that is, the smaller the objective functions F1 and F2 for each alternative are, the better the choice is. Point C is dominated by both point A and point B for both criterion (F1(A) < F1(C), F1(B) < F1(C), F2(A) < F2(C), and F2(B) < F2(C)); hence, point C cannot be part of the Pareto frontier. Points A and B are not exclusively dominated by any other, and therefore they lie on the Pareto frontier.
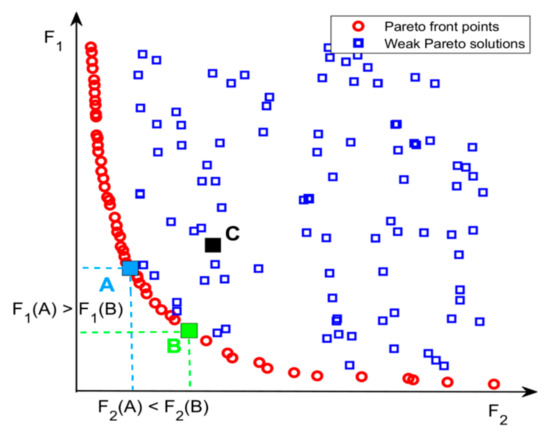
Figure 2.
Pareto frontier example.
In cases where the different objectives are complex and cannot converge at the same point, an optimal solution can possibly be different from a satisfactory solution. In general, some objectives reach a Pareto frontier and every solution on the frontier are optimal. However, a high-level optimization objective is necessary to analyze the optimal solutions and chose the satisfactory one. MCDM methods are necessary to evaluate the set of different optimal solutions and then select one accordingly to specific preferences. MCDM methods are becoming an increasingly trendy in resolving renewable energy problems because these problems imply multiple and frequent conflicting criteria. As an example, in [45] a comparative analysis of ranking renewable energy sources for electricity generation in Taiwan was carried out using different MCDM methods. Then, they were utilized to quantitatively evaluate and rank all available alternatives. Next, three common MCDM methods are described.
2.1. Simple Additive Weighting (SAW) Method
Simple Additive Weighting (SAW) is considered the most intuitive and simple way to deal with MCDM problems [46,47]. The aggregated SAW is applied in [48] to assess the best wind power plant in evaluating economic, technical and environmental criteria. The SAW method requires a normalization process in order to compare all the ratings of existing alternatives. For a possible solution i, is the value obtained with respect to objective j. The normalized value of each objective (or attribute) j is calculated according to (2) for cost attributes (smaller is better). The performance value of each solution i ( is determined by (3), where denotes the weight of the criterion j, and is the normalized preferred ratings of the alternative i of the criterion j. The best alternative is that one with the highest total score .
2.2. Technique for Order of Preference by Similarity to Ideal Solution (TOPSIS) Method
The Technique for Order of Preference by Similarity to Ideal Solution (TOPSIS) was presented by Huang and Yoon in 1981 [49] and has been extensively adopted to solve MCDM problems in numerous diverse fields [50]. In the field of energy, several studies have used TOPSIS to rank the sustainable electricity production technologies [51] and to evaluate offshore wind turbines [52]. TOPSIS was suggested to determine the best alternative based on the concepts of the compromise solution. This can be considered as choosing the solution with the shortest Euclidean distance from the ideal solution and the farthest Euclidean distance from the negative ideal solution [53]. The vector normalized value in (4) is used for the calculation of each weighted normalized value according to (5).
The positive ideal solution (PIS) and negative ideal solution (NIS) are derived from (6) for cost attributes:
The next step is to calculate the separation from the PIS and the NIS between alternative solutions. The separation values can be measured using the Euclidean distance (7).
The relative closeness to the ideal solution () of all alternatives is calculated according to (8). Finally, the preferred sorting can be obtained according to the similarities to the PIS () in descending order to choose the best alternatives. As closer to 1 is , alternative i is closer to the PIS.
2.3. VlseKriterijumska Optimizacija I Kompromisno Resenje (VIKOR) Method
The VlseKriterijumska Optimizacija i Kompromisno Resenje (VIKOR) method [54] was created for multicriteria optimization of complex systems in order to find the solution in decision problems with conflicting and noncommensurable criteria [55]. In the VIKOR model, a compromise ranking can be obtained by comparing the measure of closeness to the ideal solution [53]. Each alternative is evaluated according to each criterion function. Thus, a compromise ranking is estimated by comparing the measure of closeness to the ideal alternative. This method has been used for the assessment of sustainable and renewable energy system problems, considering technical, economic, and environmental aspects [56,57]. The following steps are used for the algorithm VIKOR:
First, the best and worst values of all attribute functions are determined according to (9). is the positive ideal solution for the j criteria, and is the negative ideal solution for the j criteria.
Next, the distances from each alternative to the positive ideal solution are calculated and added according to (10) and (11) to obtain Si and Ri. Si represents the distance rate of the i alternative to the positive ideal solution (best combination), and Ri represents the distance rate of the i alternative to the negative ideal solution (worst combination). The best ranking will be based on Si values, and the worst ranking will be based on Ri values.
Finally, the VIKOR values are calculated as (12).
where , , and v is the weight of the strategy of “the majority of criteria’’ (or ‘‘the maximum group utility’’). represents the distance rate from the positive ideal solution of the i alternative’s achievements. represents the distance rate from the negative ideal solution of the i alternative. In general, a v value of 0.5 is a compromise attitude of evaluation experts.
The diverse alternatives are sorted in decreasing order according to Qi. The best alternative is the one with the minimum value of Q.
3. Control Methodology
The control strategy proposed in this work incorporates two control loops: one loop to maintain the generator speed at its rated value and another loop to reduce the tower f-a displacements. The control scheme is depicted in Figure 3. There is a gain scheduling PI controller regulating the generator speed by actuating on the pitch angle (βPI). This loop also contains an adaptive feedforward action (βFF) to compensate for the wind speed, considered a measured disturbance. In addition, there is an adaptive gain to mitigate the tower f-a oscillation that generates an extra pitch control component (βf-a) proportional to the tower f-a velocity . This is also added to the pitch control signal.
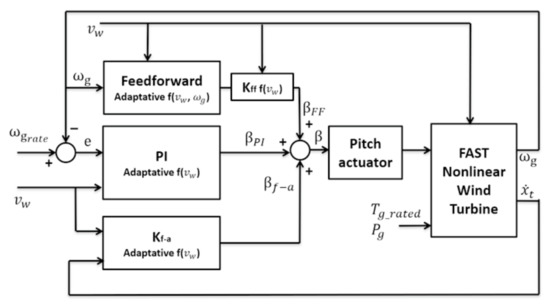
Figure 3.
Proposed control system scheme for the nominal region.
It is important to highlight that the control system is underactuated. It has only a single actuator, the pitch (β), and two controlled variables: the generator speed controlled by the PI feedforward controller and the tower f-a displacement compensated by the adaptive gain Kf-a.
In the next subsections, the procedure of the proposed methodology is described. First, linear models are identified at different operating points within the nominal region. Then, the proposed control scheme of Figure 3 is implemented. The parameters of the blocks of this control scheme are tuned by means of multi-objective algorithms looking for a compromise between two conflicting objectives (tower f-a oscillations and generator speed) at each operation point and obtaining multiple possible solutions. Each solution in the Pareto frontier is analyzed through the aforementioned MCDM methods (SAW, TOSIS, VIKOR) and a ranking is generated with the results. Furthermore, the different MCDM ranking methods are averaged to determine the best solution (satisfactory solution) at each operation point. Finally, three solutions (satisfactory, optimal objective 1, and 2 solutions) with their corresponding control parameters are selected to be implemented and compared in the simulation with different wind patterns.
3.1. Identification of Linear Models of the Wind Turbine
A representative utility-scale multimegawatt turbine known as the “NREL offshore 5-MW baseline wind turbine” has been used in this work. This wind turbine is a conventional three-bladed upwind variable-speed variable-blade-pitch-to-feather-controlled turbine based on the REpower 5 MW commercial model [26]. The NREL 5-MW turbine model has been implemented by using software FAST version 8. Table 1 shows the properties for the NREL 5-MW Baseline Wind Turbine. More information on the parameters of the analyzed turbine can be found in [58,59,60].

Table 1.
Properties of the NREL 5-MW Turbine and Drivetrain.
The proposed design is based on linear models. Due to the nonlinearity of the system, their approximated linear models vary considerably depending on the operational point. In this study, approximated linear models are identified at the six operation conditions considered according to the wind speed (12, 14, 16, 18, 20 and 22 m/s) within the nominal region (where is 1173.7 rpm).
The linear models are given by the transfer functions from (13) to (16), where (s) is the transfer function relating the generator speed () in rpm to the pitch angle (β) in degrees; (s) is the transfer function relating the controlled variable to the wind speed () in m/s as disturbance input; (s) is the transfer function of the tower f-a displacement () in m as output and the pitch angle (β) as input, and (s) is the transfer function relating the controlled variable to the wind speed .
Although the model parameters at the different operation points are not shown, the obtained open loop dynamics of all these models are stable.
3.2. Description of the Control Blocks
3.2.1. Gain Scheduling PI Control
Gain scheduling control consists of pre-setting a controller for various operating points, and subsequently updating its parameters based on these previous designs according to the operating point where the plant is working. There are different gain scheduling schemes in the literature. One of the possible strategies is equivalent to several controllers working in parallel where only the output of one of them is chosen depending on the operating conditions [61]. A very simple scheme of gain scheduling PI control is shown in Figure 4, where there are six previously designed controllers running in parallel. The most appropriate one is selected based on the disturbance d, whereas the other five controllers are configured in integral tracking mode. The other five controllers not selected are configured in the integral tracking mode. Using a similar scheme in this work, an adaptive PI control is designed. It is composed of six PI controllers tuned for each linear model obtained in the previous section. The value of the wind speed determines the PI controller that must be selected.
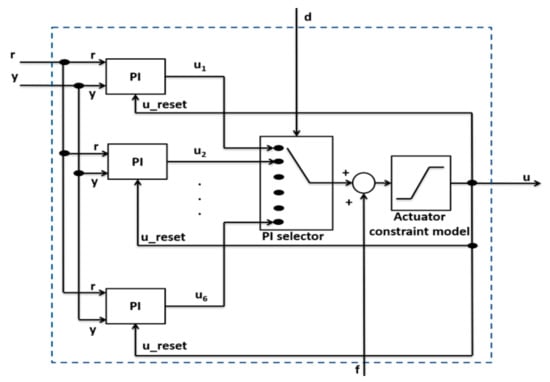
Figure 4.
Adaptive proportional–integral (PI) control scheme.
In order to assure a bumpless transfer between controllers without sudden changes in the control signal, all the PI controllers work in the integral tracking mode updating their integral action so that the output of the unselected controllers matches with that of the active controller. It is similar to the mechanism used to achieve anti-windup and bumpless transfer between automatic/manual modes in PID controllers [62,63]. The equation of a non-interactive PI controller is as follows:
where u(s) is the control signal, r(s) is the reference, y(s) is the controlled signal, Kp is the proportional gain, and Ti is the integral time constant. This continuous control law is discretized using the Tustin approximation. The proportional P(k) and integral I(k) actions of this implementation in the k-th iteration are detailed below:
where e(k) is the error signal r(k) − y(k). The constant Kpi is given by:
where h is the sample time (with a value of 0.02 s in this work). The control signal is the sum of these two actions P(k) and I(k). Additionally, as shown in Figure 4, there can be an extra control action from the input f. In this work, this input is used to add the feedforward action FF(k) to compensate for the wind speed changes, and the action FA(k) to reduce the tower f-a displacements. Therefore, the control signal is given by u(k) = P(k) + I(k) + FF(k) + FA(k).
To cope with the input constraints of the process, an anti-windup mechanism is implemented using an actuator constraint model that considers the process input saturations. When the final control signal u(k) is out of its limits, this mechanism updates the integral term I(k), constraining u(k) to the exceeded limit.
The mechanism is shown in (20). In addition, to ensure the tracking of the rest of the controllers to the final control signal u(k), it must be considered that the variables P(k) and I(k) are vector signals of six elements, one for each controller of the adaptive control. As a result, the signal I(k) is updated in the else statement in such a way that the rest of the non-active controllers follow the final signal u(k):
3.2.2. Adaptive Feedforward Compensation
Adaptive feedforward control is performed based on the multiple linear models identified previously in (13) and (14). Depending on the wind speed and generator speed ωg, the value of the gain and time constant of the dynamics and are linearly modified, and then the transfer function of the feedforward compensator Ca(s) is updated and calculated according to (21). From the wind speed estimation, it provides the control action FF(k) of Equation (20) (or βFF signal in the proposed control scheme in Figure 3).
Kff is a gain to be tuned from 0 to 1 and is aimed to reduce the control action of the feedforward strategy depending on the operating point.
Adaptive feedforward compensation (Ca) is designed for all possible operating points within the nominal zone. To cover this entire operating range, a linearization of both dynamics has been carried out in a pitch range from 0 to 25 degrees in intervals of 0.5 degrees and wind values from 11.5 to 24 m/s in intervals of 0.5 m/s. A linear interpolation of both dynamics is performed as a function of ωg for each model. The parameters obtained from both dynamics as a function of ωg and vw are shown in Figure 5. The four parameters are updated in the adaptive controller through interpolations according to the wind speed and the generator speed.
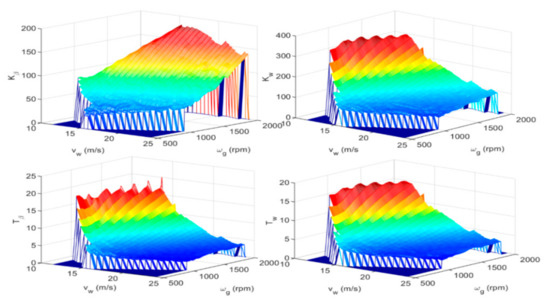
Figure 5.
Parameters obtained for and .
3.2.3. Active Tower Damping Control (ATDC)
The main way to deal with the mitigation of fore-aft movement tower in region IV is operating on pitch control through the ATDC. Tower motion can be measured instantly using an accelerometer mounted in the nacelle [64]. ATDC allows to reduce tower loads considerably without adversely affecting the quality of power or speed regulation. The tower dynamics can be modelled as a second-order system exhibiting damped simple harmonic motion [65]:
where xt is the tower f-a displacement; F is the applied force, which in this case is predominantly the rotor thrust; ∂F is the extra thrust added by the pitch angle action; M and K are related to the tower modal mass and the modal stiffness, respectively; and D is the damping term, which is usually small. Nevertheless, the effective damping of equation (22) can be increased with a particular additional damping Dp if ∂F is made proportional to − by means of an extra pitch angle action ∂β. Since measuring acceleration is less complicated than measuring velocity, the tower acceleration is measured and then integrated to provide an estimate of . Then, according to the equations in (23), the extra pitch action ∂β can be obtained from the partial derivative of the thrust with respect to the pitch (∂F/∂β), the estimate of , and the additional damping Dp [65]. The fraction with Dp and ∂F/∂β terms is included into a gain Kf-a, which is the design parameter to be tuned in the ATDC.
The increment of pitch action ∂β is added to the pitch control signal of the generator power (or speed) controller, which provides the control action FA(k) of Equation (20) (or βf-a signal in the proposed control scheme in Figure 3).
3.3. Multi-Objective Optimization by Genetic Algorithms
In previous sections, the blocks contained in the proposed control scheme have been explained. In this section, the methodology for tuning the parameters of these control blocks is described. It is addressed as an optimization problem that combines two objective functions f1 and f2 to be minimized. These indices correspond to the integral of absolute error (IAE) of the generator speed ωg and the cumulative variation rate (CVR) of the tower f-a displacement xt, and they are given in (24):
The two conflicting objectives in (24) are combined to be optimized using multi-objective genetic algorithms. The proposed cost function seeks simultaneously to reduce the tower fatigue by minimizing fore-aft displacements while tries to maintain the generator speed close to its rated value. Due to the nonlinearity of these performance indices, the PI tuning that minimizes them must be formulated as a nonlinear optimization problem [66,67].
The optimization procedure is performed by means of simulations of each identified linear model in its operation point where the controller must maintain the generator speed at its rated value of 1173.7 rpm for wind step changes of 0.5 m/s from its nominal value at that point. The six operation points are related to the wind speed values: 12, 14, 16, 18, 20, and 22 m/s. The simulations also consider the noise presented by the nonlinear model on the variables and to obtain more realistic results.
Each controller has four parameters to be tuned: Kp and Ti (PI controller), Kf-a (ATDC), and Kff feedforward gain. The search range of the Kp, Ti, and Kf-a is limited from 10−4 to 30, being negative for Kp. The Kff gain ranges from 0 to 1. The main options configured in the genetic algorithm are as follows: a population size of 1000, an elite count of 0.05 times the population size for reproduction with a crossover fraction of 0.8.
Due to the presence of two objective functions, a set of Pareto-optimal solutions with 50 possible solutions is derived in each operation point. In each Pareto front of solutions, there is one optimal solution based on each objective function. Figure 6 shows the resultant Pareto front for the operating point with wind speed of 12 m/s. The optimal solutions based on each single objective function f1 = IAEωg and f2 = CVRxt are also pointed out.
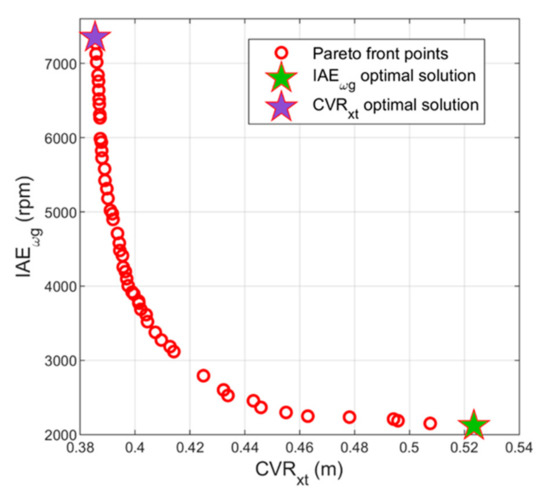
Figure 6.
Pareto front points obtained for a wind speed of 12 m/s.
MCDM methods help to evaluate the different alternatives according to various criteria to obtain the most suitable solutions. Each approach has its advantages and disadvantages. There is no method which is better than another; however, the selection of an approach depends mainly on the preferences of the selected criteria. Therefore, decision makers do not restrict themselves to one method and may achieve nonidentical results using different methods. In this case, decision-makers require using integrated methods for the final decision. The average ranking of alternatives obtained by different methods can be a good choice [68].
For each Pareto front, the following procedure is performed: first, the SAW, TOPSIS, and VIKOR method are applied to each one of the 50 possible solutions of the front. Next, the solutions are sorted from the best to the worst for each method. Then, the average of the three methods applied in each solution is calculated, and the solution with ranking equal to 1 is considered the best satisfactory solution. The results of the average ranking method for the ten best possible solutions obtained at the operation point with wind speed of 12 m/s are shown in Table 2. In this case, the best average solution coincides with the best solution obtained by the TOPSIS method.

Table 2.
The ten best solutions according to the average ranking method in the Pareto front obtained for a wind speed of 12 m/s.
Figure 7 shows the Pareto front obtained for each operation point. In each one, the best solution according to the different MCDM methods and the average ranking solution are also highlighted. As the wind speed increases, the IAEωg index decreases, and the CVRxt index increases. For the operating points associated to wind speed of 12 and 22 m/s, the average ranking solution coincides with the TOPSIS optimal solution. In the case wind speed of 14, 16, and 18 m/s, the TOPSIS solution coincides with the optimal VIKOR solution.
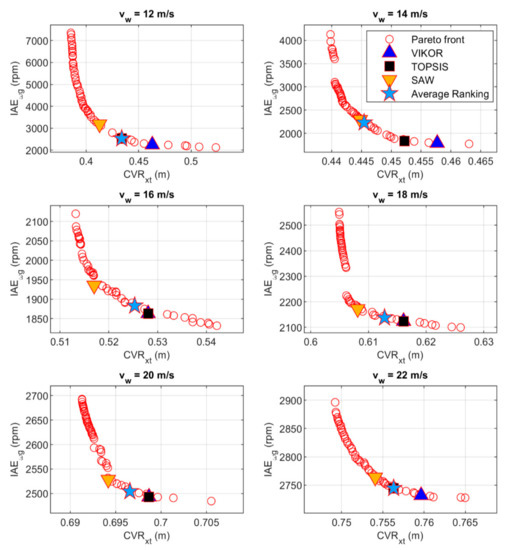
Figure 7.
Pareto fronts obtained at the six operating points.
Table 3 shows the control parameters obtained for the satisfactory solution at each operation point. They are also depicted in Figure 8 together with the obtained parameters for the IAEωg optimal solution and CVRxt optimal solution at each operation point. The optimal CVRxt solution has only the objective function of reducing the tower f-a displacements as much as possible, while the optimal IAEωg solution only considers minimizing the deviation of the generator speed from its nominal value.

Table 3.
Control parameters obtained for the satisfactory solution for each operation point.
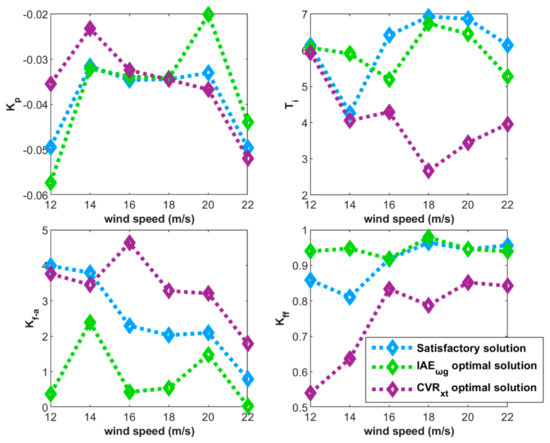
Figure 8.
Control parameters at each operation point for different solutions.
From Figure 8, it can be deduced how the different components that collaborate in the proposed control scheme cause an effect on the objective functions IAEωg and CVRxt with a certain degree of opposition between them. The following points can be pointed out:
- To minimize the deviation of the generator speed from its nominal value (optimal IAEωg solution), it is necessary a strong participation of the feedforward control (Kff) and a low intervention of the active tower damping control (Kf-a).
- To minimize the tower f-a displacements (optimal CVRxt solution), it is necessary to combine the PI controller with a low Ti together with a lower participation of the feedforward control (Kff) and a higher intervention of active tower damping control (Kf-a).
- Satisfactory solutions achieve a compromise of both objectives combining an intermediate Kp value of the PI controller with a strong participation of the feedforward control (Kff) and a medium intervention of the active tower damping control (Kf-a).
4. Proposed Design Evaluation
In this section, the performance of the proposed gain scheduling controller (GSC) obtained for the previous satisfactory solution is evaluated through two simulations with different wind speed profiles. The wind turbine is operated at Region IV, where the rated generator speed is 1173.7 rpm. The achieved responses are compared to those obtained by a traditional gain scheduling PI controller as baseline controller (BSC). For each simulation, a comparative quantitative analysis of the system responses is detailed by means of different performance indices. The indices of the responses obtained by the proposed GSC tuned with the parameters of the IAEωg optimal solution and CVRxt optimal solution are also collected. However, their simulation curves are not plotted in figures since the difference between the three GSC solutions is not clear enough to be distinguished.
The BSC used for comparison in this research is the gain scheduled proportional integral control originally developed by Jonkman [39]. Its structure is shown in Figure 9. The proportional gain Kp and integral gain Ki of the PI controller are updated as shown in (25) according to a scheduling function f(β) depending on the pitch angle value [39].
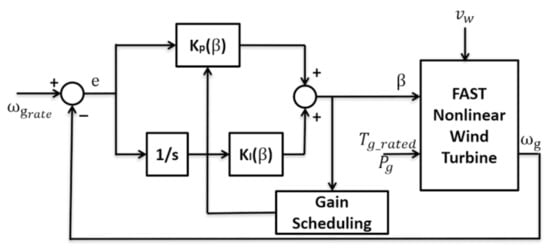
Figure 9.
Baseline controller structure within the nominal.
4.1. Simulation with Step Change Wind Speed Profile
In the first simulation, the wind speed profile is composed of different upward and downward step changes. It starts at 12 m/s and increases its value +2 m/s every 100 s until reaching 22 m/s; then, the rest of wind profile is a descending mirror of this part, as shown in Figure 10. This wind profile allows evaluating the control response of system through the six operation points used in the design stage. Figure 10 shows the responses of the proposed GSC obtained for the satisfactory solution (satisfactory GSC) in previous section and those achieved by the BSC. The wind speed profile vw, generator speed ωg, tower f-a displacement xt, and pitch angle β responses are depicted. The simulation results show that the proposed GSC performs better than the baseline controller for all wind speeds. In Figure 11, a part of these responses is zoomed to obtain a better appreciation of the improvement of the proposed design. The GSC achieves a faster wind speed disturbance rejection improving the tracking of , and the fluctuations in the controlled variable are smaller.
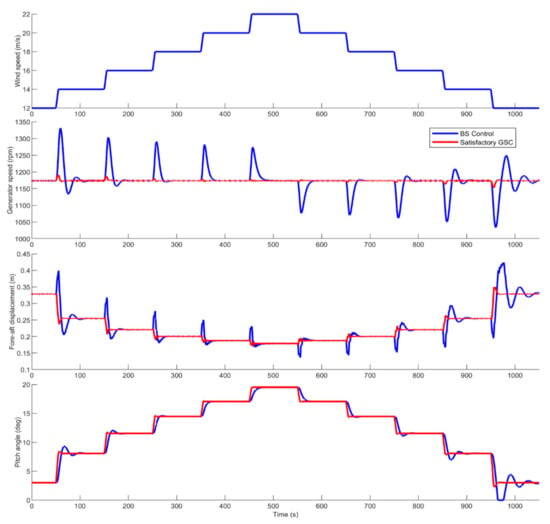
Figure 10.
Simulation responses for first simulation.
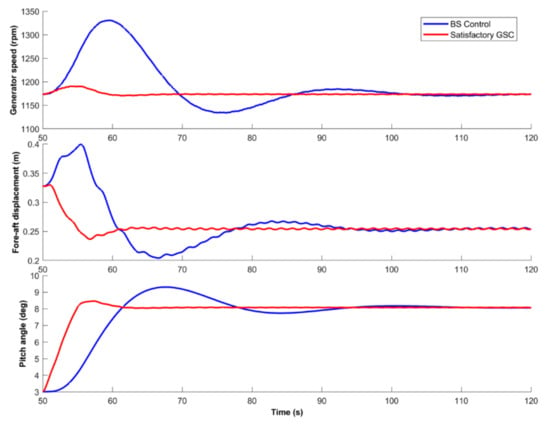
Figure 11.
Zoomed simulation responses for a wind speed step change from 12 to 14 m/s.
In order to analyze a fair comparison, the obtained GSC tuned with the satisfactory solution parameters is also compared with this same GSC tuned with the parameters of the two optimal solutions based on each objective functions f1 = IAEωg and f2 = CVRxt. Different performance indices are calculated from the simulation data for the comparative quantitative analysis. These indices are the following: the two conflicting objectives used for optimization in the proposed designs (IAEωg and CVRxt), the cumulative variation rate of the pitch angle CVRβ, and the cumulative variation rates CVRMfa and CVRMss of the lifetime damage equivalent moments at the tower base in the fore-aft and side-to-side direction (Mfa and Mss), respectively [30,69]. The expressions of the three last indices are calculated from the simulation data according to (26). These last indices have not been used in the optimization process; however, they have been calculated to perform a more complete quantitative analysis. Table 4 shows all these indices for the four controllers: satisfactory GSC, IAEωg optimal GSC, CVRxt optimal GSC, and BC.

Table 4.
Performance indices for steps change wind speed profiles.
The IAEωg index related to the error has been improved at the expense of a greater control effort CVRβ in the manipulated variable β. It is important to clarify that the variations of step changes in wind speed are unrealistic. However, this is a very strong requirement for the control system, which must overcome the abrupt wind change.
Observing the qualitative and quantitative results with step wind, the following points can be highlighted: the proposed GSC tuned with satisfactory solution parameters obtains a better CVRxt index value, reducing its index by 42.3% compared to that obtained by the baseline controller. With respect to the IAEωg value, the designed controller reduces this index by 93.3% in comparison with that obtained using the baseline controller.
Figure 12 shows the spider diagrams obtained for the previously performed simulations. These diagrams show the load comparisons (CVRMfa and CVRMss) versus objective functions (IAEωg and CVRxt) and the control effort CVRβ of the baseline control with all three controller solutions. The left spider diagram shows a comparison of the index values of the different controllers with respect to the BSC, and the right spider diagram displays the comparison for the three obtained GSC with respect to the satisfactory GSC.
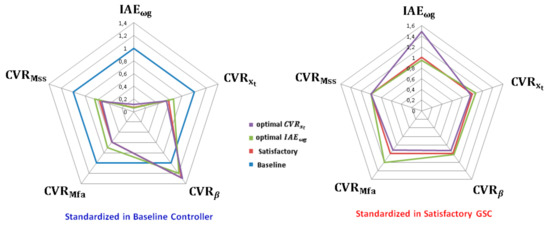
Figure 12.
Spider diagrams for first simulation.
The results of the normalized spider diagrams with respect to the baseline control for step wind simulation show a significant improvement in the indices for the three designed GSC. The results reflect a substantial improvement of the satisfactory, optimal IAEωg, and optimal CVRxt with a respective reduction of 93.3%, 93.9%, and 88.2% in the IAEωg index; 42.3%, 33.9%, and 46.1% in the CVRxt index; 37.7%, 30.4%, and 41.3% in the CVRMfa index; and 43.6%, 35.4%, and 46.8% in the CVRMss index with respect to the baseline control.
Although at first glance it seems that the results in the indices are similar for the three designed GSC, if these controllers are compared with each other with respect to the satisfactory solutions (right spider diagram in Figure 12), the satisfactory solution achieves a good balance. The satisfactory solution reduces the IAEωg index by 75.1% with respect to the optimal CVRxt solution and by 14.5%, 11.8%, and 14.7% for the CVRxt, CVRMfa, and CVRMss with respect to optimal IAEωg solutions. Table 5 shows the previously commented results.

Table 5.
Performance indices from Table 4 standardized to baseline control and satisfactory gain scheduling controller (GSC).
4.2. Simulation with Stochastic Wind Speed Profile
The second simulation was performed using a more realistic wind speed profile with the following characteristics: a mean value of 17 m/s, a turbulent component with standard deviation of 10%, and a sine component with amplitude of 1 m/s and period of 100 s. Figure 13 shows the simulation results using this wind speed profile.
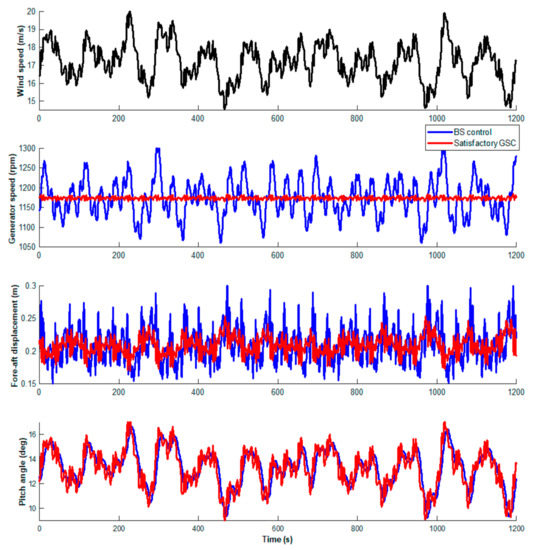
Figure 13.
Simulation responses for second simulation.
The corresponding performance indices are collected in Table 6, where a comparative quantitative summary analysis of the three GSC tuning solutions (satisfactory, optimal IAEωg, and optimal CVRxt solutions) is shown in comparison with the baseline control for stochastic wind speeds.

Table 6.
Performance indices for stochastic change wind speed profiles.
Regarding the results in this second simulation, similar conclusions can be obtained: the designed GSC tuned with satisfactory solution obtains a better CVRxt index value, reducing it by 41% in comparison to that of the BSC. With respect to the IAEωg index value, the designed controller reduces this index by 92.9% compared to BSC.
Figure 14 shows the spider diagrams obtained from the simulations performed with stochastic wind.
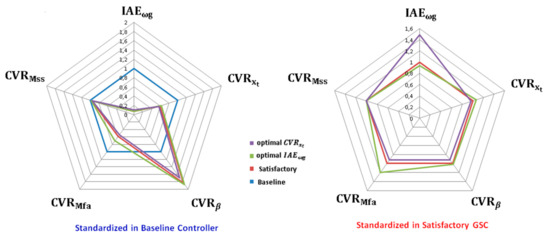
Figure 14.
Spider diagrams obtained with stochastic wind.
In a similar way to the results obtained for step wind, the results for stochastic wind show that a relevant improvement with respect to the base controller is achieved in the indices IAEωg, CVRxt, and CVRMfa for the three GSC designed. However, the same does not happen for the index CVRMss, which is hardly improved, since the objective functions designed for tuning the GSC did not consider this type of structural tower load.
The results show a significant improvement of 92.9%, 93.3, and 89.5 in the IAEωg index; 41%, 37.3%, and 43% in the CVRxt index; 41.1%, 29.4%, and 45.9 in the CVRMfa index; and 3.6%, 2.7%, and 4.5% in the CVRMss index of the satisfactory solutions, optimal IAEωg, and optimal CVRxt with respect to the BSC.
If the satisfactory solution is compared to the other optimal IAEωg and optimal CVRxt solutions, the satisfactory solution achieves an optimal compromise between both alternatives, reducing the index IAEωg by 48.5% with respect to optimal CVRxt solutions and 6.3% and 19.9% in CVRxt and CVRMfa indices with respect to optimal IAEωg solutions. Table 7 shows the results that have been discussed previously.

Table 7.
Performance indices from Table 6 standardized to baseline control and satisfactory GSC.
If the two objectives, IAEωg and CVRxt, are globally analyzed, the satisfactory solution achieves better dynamic responses than the baseline controller for both wind patterns, translating into a significant improvement in the generator angular speed control and reduction in the wind turbine tower fluctuations.
As shown on the left spider diagrams of Figure 12 and Figure 14, the blue pentagon is the outermost, which shows that any of the three proposed solutions for tuning the GSC (satisfactory, optimal IAEωg, and optimal CVRxt solutions) improves the system response compared to the BSC. Furthermore, the satisfactory solution achieves a good balance between the optimal IAEωg optimal and CVRxt optimal solutions for both wind patterns.
5. Conclusions
A wind turbine adaptive control structure operating on the pitch variable in the nominal zone is developed in this work. The proposed control strategy is based on the following control loops: the first loop to maintain the generator speed at its nominal value reducing the fluctuations and consequently keeping the generated power constant through a gain scheduling PI controller with adaptive feedforward control, and the second loop to reduce the tower fore-aft displacements through an active tower damping control (ATDC).
The gain scheduling PI controller with adaptive feedforward regulates the turbine speed by actuating on the pitch angle, and the ATDC generates an extra pitch control component proportional to the tower fore-aft velocity reducing the structural fatigue of the tower.
The tuning procedure of the PI controller parameters with fore-aft control and feedforward compensation is treated as an optimization problem with two objectives using multi-objective genetic algorithm: minimizing structural loads and keeping constant the nominal generator speed. The computed Pareto curves of the trade-off between tower fore-aft fatigue load and deviation of the generator speed for different operation points demonstrate a potential tool for seeking possible solutions in tuning controllers for wind turbines. The average ranking of the MCDM methods SAW, TOSIS, and VIKOR is selected as satisfactory solution.
The proposed controller tuned with the satisfactory solution parameters is evaluated with different wind conditions (step and stochastic wind profiles) and compared with a classic adaptive baseline controller as well as with the same controller tuned with each one of the two other optimal solutions (minimum fore-aft tower displacements and minimum generator speed deviations). Comparing the qualitative and quantitative results for both wind patterns between the satisfactory and baseline controller, it is important to highlight that the improvement of the IAEωg, CVRxt, and CVRMfa indices fully compensates for the increase in the CVRβ index. The simulation and spider diagrams results show a significant performance improvement of the proposed controller tuned with the satisfactory solution parameters in comparison to those of the baseline controller for both step and stochastic wind profiles. An improvement in the reference tracking of the generator speed and in the mitigation of the tower fore-aft oscillations has been achieved for both wind conditions. With respect to the other two optimal solutions, the satisfactory solution reaches a good balance between the two objectives to minimize with negligible effect on the CVRβ index.
The simulation results show a good compromise between the different objectives, which is one of the main advantages of the proposed methodology in this work. Nevertheless, the multi-objective genetic approach requires a large number of iterations and, consequently, a considerable computational effort to identify the Pareto front. This drawback can be addressed and partially solved by using parallel computing.
Finally, it is important to note that the study of the proposed methodology has been carried out by means of the aeroelastic FAST turbine model. This software has been sufficiently validated against field measurements, and thus provides a good benchmark tool for the future implementation of the proposed controllers in a real turbine. The procedure performed in this work is general and can be extended to mitigating other types of loads on wind turbines. Although the work has been implemented on a 5 MW wind turbine, this methodology might be implemented in all types of large-scale horizontal axis wind turbines (HAWT) and variable-speed–variable-pitch (VS–VP) turbines, off-shore or on-shore.
Author Contributions
Conceptualization, M.L.; methodology, M.L. and J.G.; resources, F.V.; software, M.L. and M.L.R.; validation, M.L.; investigation, M.L.; writing—original draft preparation, M.L. and J.G.; writing—review and editing, J.G., F.V. and M.L.R.; supervision, J.G. and F.V. All authors have read and agreed to the published version of the manuscript.
Funding
This research received no external funding.
Institutional Review Board Statement
Not applicable.
Informed Consent Statement
Not applicable.
Data Availability Statement
Not applicable.
Acknowledgments
M. Lara would like to express appreciation for the FPU fellowship (FPU17/02747) from the Spanish Ministry of Education, Culture, and Sports.
Conflicts of Interest
The authors declare no conflict of interest.
References
- Njiri, J.G.; Söffker, D. State-of-the-art in wind turbine control: Trends and challenges. Renew. Sustain. Energy Rev. 2016, 60, 377–393. [Google Scholar] [CrossRef]
- Luo, L.; Zhang, X.; Song, D.; Tang, W.; Li, L.; Tian, X. Minimizing the Energy Cost of Offshore Wind Farms by Simultaneously Optimizing Wind Turbines and Their Layout. Appl. Sci. 2019, 9, 835. [Google Scholar] [CrossRef]
- Kong, X.; Cai, C.-S.; Hu, J. The State-of-the-Art on Framework of Vibration-Based Structural Damage Identification for Decision Making. Appl. Sci. 2017, 7, 497. [Google Scholar] [CrossRef]
- Ancuti, M.-C.; Musuroi, S.; Sorandaru, C.; Dordescu, M.; Erdodi, G.M. Wind Turbines Optimal Operation at Time Variable Wind Speeds. Appl. Sci. 2020, 10, 4232. [Google Scholar] [CrossRef]
- Ruz, M.L.; Garrido, J.; Fragoso, S.; Vazquez, F. Improvement of Small Wind Turbine Control in the Transition Region. Processes 2020, 8, 244. [Google Scholar] [CrossRef]
- Kumar, D.; Chatterjee, K. A review of conventional and advanced MPPT algorithms for wind energy systems. Renew. Sustain. Energy Rev. 2016, 55, 957–970. [Google Scholar] [CrossRef]
- Yaramasu, V.; Wu, B.; Sen, P.C.; Kouro, S.; Narimani, M. High-power wind energy conversion systems: State-of-the-art and emerging technologies. Proc. IEEE 2015, 103, 740–788. [Google Scholar] [CrossRef]
- Fragoso, S.; Ruz, M.L.; Garrido, J.; Vázquez, F.; Morilla, F. Educational software tool for decoupling control in wind turbines applied to a lab-scale system. Comput. Appl. Eng. Educ. 2016, 24, 400–411. [Google Scholar] [CrossRef]
- Fragoso, S.; Garrido, J.; Vázquez, F.; Morilla, F. Comparative Analysis of Decoupling Control Methodologies and H∞ Multivariable Robust Control for Variable-Speed, Variable-Pitch Wind Turbines: Application to a Lab-Scale Wind Turbine. Sustainability 2017, 9, 713. [Google Scholar] [CrossRef]
- Simani, S.; Castaldi, P. Robust Control Examples Applied to a Wind Turbine Simulated Model. Appl. Sci. 2017, 8, 29. [Google Scholar] [CrossRef]
- Liu, H.; Tang, Q.; Chi, Y.; Zhang, Z.; Yuan, X. Vibration reduction strategy for wind turbine based on individual pitch control and torque damping control. Int. Trans. Electr. Energy Syst. 2016, 26, 2230–2243. [Google Scholar] [CrossRef]
- Mohammadi, E.; Fadaeinedjad, R.; Moschopoulos, G. Implementation of internal model based control and individual pitch control to reduce fatigue loads and tower vibrations in wind turbines. J. Sound Vib. 2018, 421, 132–152. [Google Scholar] [CrossRef]
- Gambier, A.; Nazaruddin, Y.Y. Collective Pitch Control with Active Tower Damping of a Wind Turbine by Using a Nonlinear PID Approach. IFAC-PapersOnLine 2018, 51, 238–243. [Google Scholar] [CrossRef]
- Murtagh, P.J.; Ghosh, A.; Basu, B.; Broderick, B.M. Passive control of wind turbine vibrations including blade/tower interaction and rotationally sampled turbulence. Wind. Energy 2007, 11, 305–317. [Google Scholar] [CrossRef]
- Mensah, A.F.; Dueñas-Osorio, L. Improved reliability of wind turbine towers with tuned liquid column dampers (TLCDs). Struct. Saf. 2014, 47, 78–86. [Google Scholar] [CrossRef]
- Fitzgerald, B.; Basu, B.; Nielsen, S.R.K. Active tuned mass dampers for control of in-plane vibrations of wind turbine blades. Struct. Control. Heal. Monit. 2013, 20, 1377–1396. [Google Scholar] [CrossRef]
- Pascu, V.; Kanev, S.; Van Wingerden, J.-W. Adaptive tower damping control for offshore wind turbines. Wind. Energy 2016, 20, 765–781. [Google Scholar] [CrossRef]
- Scholbrock, A.; Fleming, P.; Schlipf, D.; Wright, A.; Johnson, K.; Wang, N. Lidar-enhanced wind turbine control: Past, present, and future. In Proceedings of the American Control Conference, Boston, MA, USA, 8 July 2016; pp. 1399–1406. [Google Scholar] [CrossRef]
- Ungurán, R.; Petrović, V.; Pao, L.Y.; Kühn, M. Uncertainty identification of blade-mounted lidar-based inflow wind speed measurements for robust feedback–feedforward control synthesis. Wind. Energy Sci. 2019, 4, 677–692. [Google Scholar] [CrossRef]
- Yu, C.; Li, D. Fuzzy-PI and feedforward control strategy of DFIG wind turbine. In Proceedings of the IEEE PES Innovative Smart Grid Technologies, Tianjin, China, 21–24 May 2012; pp. 1–5. [Google Scholar]
- Kumar, A.A.; Bossanyi, E.A.; Scholbrock, A.K.; Fleming, P.A.; Boquet, M.; Krishnamurthy, R. Field testing of LIDAR assisted feedforward control algorithms for improved speed control and fatigue load reduction on a 600 kW wind turbine. In Proceedings of the European Wind Energy Association Annual Conference and Exhibition 2015, Paris, France, 17–20 November 2015; pp. 31–35. [Google Scholar]
- Patrascu, M.; Ion, A. Evolutionary Modeling of Industrial Plants and Design of PID Controllers. Stud. Syst. Decis. Control 2015, 40, 73–119. [Google Scholar] [CrossRef]
- Sierra-Garcia, J.E.; Santos, M. Improving Wind Turbine Pitch Control by Effective Wind Neuro-Estimators. IEEE Access 2021, 9, 10413–10425. [Google Scholar] [CrossRef]
- Sierra-Garcia, J.E.; Santos, M. Performance Analysis of a Wind Turbine Pitch Neurocontroller with Unsupervised Learning. Complexity 2020, 2020, 1–15. [Google Scholar] [CrossRef]
- Schaffer, J.D.; Whitley, D.; Eshelman, L.J. Combinations of genetic algorithms and neural networks: A survey of the state of the art. In COGANN 1992-International Workshop on Combinations of Genetic Algorithms and Neural Networks; IEEE Computer Society Press: Washington, DC, USA, 1992; pp. 1–37. [Google Scholar] [CrossRef]
- Odgaard, P.F. On usage of pareto curves to select wind turbine controller tunings to the wind turbulence level. In Proceedings of the 2015 European Control Conference, Linz, Austria, 15–17 July 2015; pp. 1534–1539. [Google Scholar] [CrossRef]
- Chiandussi, G.; Codegone, M.; Ferrero, S.; Varesio, F. Comparison of multi-objective optimization methodologies for engineering applications. Comput. Math. Appl. 2012, 63, 912–942. [Google Scholar] [CrossRef]
- Magnier, L.; Haghighat, F. Multiobjective optimization of building design using TRNSYS simulations, genetic algorithm, and Artificial Neural Network. Build. Environ. 2010, 45, 739–746. [Google Scholar] [CrossRef]
- Lin, Z.; Chen, Z.; Wu, Q.; Yang, S.; Meng, H. Coordinated pitch & torque control of large-scale wind turbine based on Pareto efficiency analysis. Energy 2018, 147, 812–825. [Google Scholar] [CrossRef]
- Park, S.; Glade, M.; Lackner, M.A. Multi-objective optimization of orthogonal TLCDs for reducing fatigue and extreme loads of a floating offshore wind turbine. Eng. Struct. 2020, 209, 110260. [Google Scholar] [CrossRef]
- Song, D.; Fan, X.; Yang, J.; Liu, A.; Chen, S.; Joo, Y.H. Power extraction efficiency optimization of horizontal-axis wind turbines through optimizing control parameters of yaw control systems using an intelligent method. Appl. Energy 2018, 224, 267–279. [Google Scholar] [CrossRef]
- Buhl, M.; Manjock, A. A Comparison of Wind Turbine Aeroelastic Codes Used for Certification. In Proceedings of the 44th AIAA Aerospace Sciences Meeting and Exhibit, Reno, NV, USA, 9–12 January 2006; pp. 9456–9469. [Google Scholar] [CrossRef]
- Beltran, B.; Ahmed-Ali, T.; Benbouzid, M.E.H. Sliding Mode Power Control of Variable-Speed Wind Energy Conversion Systems. IEEE Trans. Energy Convers. 2008, 23, 551–558. [Google Scholar] [CrossRef]
- Hassan, H.M.; Elshafei, A.; Farag, W.; Saad, M. A robust LMI-based pitch controller for large wind turbines. Renew. Energy 2012, 44, 63–71. [Google Scholar] [CrossRef]
- Bakka, T.; Karimi, H.; Christiansen, S. Linear parameter-varying modelling and control of an offshore wind turbine with constrained information. IET Control. Theory Appl. 2014, 8, 22–29. [Google Scholar] [CrossRef]
- Jafarnejadsani, H.; Pieper, J. Gain-scheduled λ1-optimal control of variable-speed-variable-pitch Wind Turbines. IEEE Trans. Control. Syst. Technol. 2014, 23, 372–379. [Google Scholar] [CrossRef]
- Saenz-Aguirre, A.; Zulueta, E.; Fernandez-Gamiz, U.; Ulazia, A.; Teso-Fz-Betono, D. Performance enhancement of the artificial neural network–based reinforcement learning for wind turbine yaw control. Wind. Energy 2019, 23, 676–690. [Google Scholar] [CrossRef]
- Jonkman, J. NWTC Information Portal (FAST). Available online: https://www.nrel.gov/wind/nwtc/fastv8.html (accessed on 29 December 2020).
- Jonkman, J.; Butterfield, S.; Musial, W.; Scott, G. Definition of a 5-MW reference wind turbine for offshore system de-velopment. Tech. Rep. 2009, 1–75. [Google Scholar] [CrossRef]
- Odgaard, P.F.; Larsen, L.F.; Wisniewski, R.; Hovgaard, T.G. On using Pareto optimality to tune a linear model predictive controller for wind turbines. Renew. Energy 2016, 87, 884–891. [Google Scholar] [CrossRef]
- Cui, Y.; Geng, Z.; Zhu, Q.; Han, Y. Review: Multi-objective optimization methods and application in energy saving. Energy 2017, 125, 681–704. [Google Scholar] [CrossRef]
- Fogel, D.B. The Advantages of Evolutionary Computation. In Proceedings of the Biocomputing And Emergent Computation-Proceedings of Bcec97, Skövde, Sweden, 1–2 September 1997; pp. 1–11. [Google Scholar]
- Srinivas, N.; Deb, K. Muiltiobjective Optimization Using Nondominated Sorting in Genetic Algorithms. Evol. Comput. 1994, 2, 221–248. [Google Scholar] [CrossRef]
- Deb, K.; Pratap, A.; Agarwal, S.; Meyarivan, T. A fast and elitist multiobjective genetic algorithm: NSGA-II. IEEE Trans. Evolut. Comput. 2002, 6, 182–197. [Google Scholar] [CrossRef]
- Lee, H.-C.; Chang, C.-T. Comparative analysis of MCDM methods for ranking renewable energy sources in Taiwan. Renew. Sustain. Energy Rev. 2018, 92, 883–896. [Google Scholar] [CrossRef]
- Fishburn, P.C. Letter to the Editor—Additive Utilities with Incomplete Product Sets: Application to Priorities and Assignments. Oper. Res. 1967, 15, 537–542. [Google Scholar] [CrossRef]
- Churchman, C.W.; Ackoff, R.L. An Approximate Measure of Value. J. Oper. Res. Soc. Am. 1954, 2, 172–187. [Google Scholar] [CrossRef]
- Bagočius, V.; Zavadskas, E.K.; Turskis, Z. Multi-person selection of the best wind turbine based on the multi-criteria integrated additive-multiplicative utility function. J. Civ. Eng. Manag. 2014, 20, 590–599. [Google Scholar] [CrossRef]
- Tzeng, G.-H.; Huang, J.-J. Multiple Attribute Decision Making; Apple Academic Press: Waretown, NJ, USA, 2011. [Google Scholar]
- Hwang, C.-L.; Yoon, K. Methods for Multiple Attribute Decision Making; Springer: Berlin/Heidelberg, Germany, 1981; pp. 58–191. [Google Scholar]
- Şengül, Ü.; Eren, M.; Shiraz, S.E.; Gezder, V.; Şengül, A.B. Fuzzy TOPSIS method for ranking renewable energy supply systems in Turkey. Renew. Energy 2015, 75, 617–625. [Google Scholar] [CrossRef]
- Minguez, E.L.; Kolios, A.J.; Brennan, F.P. Multi-criteria assessment of offshore wind turbine support structures. Renew. Energy 2011, 36, 2831–2837. [Google Scholar] [CrossRef]
- Chitsaz, N.; Banihabib, M.E. Comparison of Different Multi Criteria Decision-Making Models in Prioritizing Flood Management Alternatives. Water Resour. Manag. 2015, 29, 2503–2525. [Google Scholar] [CrossRef]
- Kaya, T.; Kahraman, C. Multicriteria renewable energy planning using an integrated fuzzy VIKOR & AHP methodology: The case of Istanbul. Energy 2010, 35, 2517–2527. [Google Scholar] [CrossRef]
- Opricovic, S. Multicriteria optimization of civil engineering systems. Fac. Civ. Eng. Belgrade 1998, 2, 5–21. [Google Scholar]
- Cristóbal, J.S. Multi-criteria decision-making in the selection of a renewable energy project in spain: The Vikor method. Renew. Energy 2011, 36, 498–502. [Google Scholar] [CrossRef]
- Büyüközkan, G.; Karabulut, Y. Energy project performance evaluation with sustainability perspective. Energy 2017, 119, 549–560. [Google Scholar] [CrossRef]
- Jonkman, J.M.; Buhl, M.L.J. FAST User’s Guide; National Renewable Energy Laboratory: Golden, CO, USA, 2005.
- Jafari, S.; Pishkenari, M.M.; Sohrabi, S.; Feizarefi, M. Advanced modeling and control of 5 MW wind turbine using global optimization algorithms. Wind. Eng. 2019, 43, 488–505. [Google Scholar] [CrossRef]
- Yang, F.; Li, S.-S.; Wang, L.; Zuo, S.; Song, Q.-W. Adaptive Backstepping Control Based on Floating Offshore High Temperature Superconductor Generator for Wind Turbines. Abstr. Appl. Anal. 2014, 2014, 1–11. [Google Scholar] [CrossRef]
- Albertos, P.; Mareels, I. Feedback and Control for Everyone; Springer: Berlin/Heidelberg, Germany, 2010; pp. 3–27. [Google Scholar]
- Garrido, J.; Lara, M.; Ruz, M.; Vázquez, F.; Alfaya, J.; Morilla, F. Decentralized PID control with inverted decoupling and superheating reference generation for efficient operation: Application to the Benchmark PID. IFAC 2018, 51, 710–715. [Google Scholar] [CrossRef]
- Lara, M.; Garrido, J.; Vázquez, F. Adaptive PI control and active tower damping compensation of a wind turbine. Renew. Energy Power Qual. J. 2020, 18, 339–344. [Google Scholar] [CrossRef]
- Bossanyi, E.A. The Design of closed loop controllers for wind turbines. Wind. Energy 2000, 3, 149–163. [Google Scholar] [CrossRef]
- Bossanyi, E.A. Wind Turbine Control for Load Reduction. Wind. Energy 2003, 6, 229–244. [Google Scholar] [CrossRef]
- Goldberg, D.E. Genetic Algorithms in Search, Optimization, and Machine Learning; Addison-Wesley Professional: Boston, MA, USA, 1989. [Google Scholar]
- Wang, P.; Kwok, D. Optimal design of PID process controllers based on genetic algorithms. Control. Eng. Pract. 1994, 2, 641–648. [Google Scholar] [CrossRef]
- Shakoor, A. Adaptive application of multi-attribute decision making methods in determining the level of existence of a case study: Rural areas of Kamyaran Towns. Rural Stud. 2015, 6, 679–698. [Google Scholar]
- Sun, C.; Jahangiri, V. Bi-directional vibration control of offshore wind turbines using a 3D pendulum tuned mass damper. Mech. Syst. Signal Process. 2018, 105, 338–360. [Google Scholar] [CrossRef]
Publisher’s Note: MDPI stays neutral with regard to jurisdictional claims in published maps and institutional affiliations. |
© 2021 by the authors. Licensee MDPI, Basel, Switzerland. This article is an open access article distributed under the terms and conditions of the Creative Commons Attribution (CC BY) license (http://creativecommons.org/licenses/by/4.0/).