Article

Rising Temperature Is a More Important Driver Than Increasing Carbon Dioxide Concentrations in the Trait Responses of Enhalus acoroides Seedlings

by
Suci Rahmadani Artika
1,
Rohani Ambo-Rappe
1,
Muhammad Farid Samawi
1,
Mirta Teichberg
2,
Agustín Moreira-Saporiti
2,3 and
Inés G. Viana
2,4,5,*
1
Department of Marine Science, Faculty of Marine Science and Fisheries, Hasanuddin University, Makassar, Sulawesi Selatan 90245, Indonesia
2
Department of Ecology, Leibniz Centre for Tropical Marine Research, 28359 Bremen, Germany
3
Faculty of Biology and Chemistry, University of Bremen, 28359 Bremen, Germany
4
Department of Ecology and Animal Biology, Faculty of Sciences, University of Vigo, 36310 Vigo, Spain
5
Instituto Español de Oceanografía (IEO), Centro Oceanográfico de A Coruña, 15001 A Coruña, Spain
*
Author to whom correspondence should be addressed.
Appl. Sci. 2021, 11(6), 2730; https://doi.org/10.3390/app11062730
Submission received: 24 February 2021 / Revised: 12 March 2021 / Accepted: 14 March 2021 / Published: 18 March 2021
(This article belongs to the Special Issue Impacts of Climate Change on Marine Organisms)

Abstract

:
Increasing temperature and CO2 concentration are among the most important factors affecting marine ecosystems under climate change. We investigated the morphological, biochemical, and physiological trait responses of seedlings of the tropical seagrass Enhalus acoroides under experimental conditions. Trait responses were greater under temperature effects than increasing CO2 concentration. Seedlings under rising temperatures showed enhanced leaf growth, lower leaf nutrient content, and stimulated down-regulating mechanisms in terms of photo-physiology. Increasing CO2 concentrations did not show any significant effects independently. There was a significant interaction for some of the trait responses considered, such as leaf number and carbon content in the roots, and trends of higher starch concentrations in the leaves and lower rETRmax under combined enriched CO2 and high temperature, even though none of these interactions were synergistic. Understanding the single and interactive trait responses of seagrass seedlings to increasing temperature and CO2 concentration is of importance to determine the relative responses of early life stages of seagrasses, which may differ from adult plants, in order to form a more holistic view of seagrass ecosystem health under climate change.

1. Introduction

Seagrasses are important ecosystem engineers that are globally distributed and provide important ecosystem services [1]. They are one of the most threatened marine ecosystems due to their presence in shallow coastal areas resulting in accelerated seagrass biomass loss in recent decades [2]. While there is some space for optimism in temperate and subtropical areas [3,4,5], regional losses can still be high in the tropics, such as in Indonesia, where a 75% loss has been reported in the last five years [6].
Before seagrass loss occurs, changes in environmental conditions can be evaluated by seagrass trait responses, which can be used as indicators of environmental change in coastal management [7,8]. They have been described as valuable bioindicators since they integrate environmental impacts over measurable and definable timescales [9]. The relative sensitivity of seagrass trait responses to specific stressors or the suitability of different species is unknown. However, its understanding is critical in the selection of seagrass indicators for the assessment of different stressors [8]. As a solution, laboratory experiments have helped to isolate the responses of seagrass traits to single and multiple stressors [10,11,12].
Single effects of climate change have been widely studied in adult seagrasses (see Reference [13] for a review about this topic) although less information is available for seedlings, especially for tropical species. In seedlings, temperature responses varied from increased mortality due to inhibition of the photosynthetic system [14,15] or an increase on germination speed [16], and sublethal effects on photo-physiological performance and leaf or root development [17] to positive effects in terms of enhanced above-ground biomass [18,19]. The previously mentioned studies have also shown that the effects of temperature on seedlings vary depending on the age of the seedling, the temperature tested, or the length of the exposure. In contrast, CO2 enrichment increases the rate of the dark reaction in P/S and, thus, growth and storage capacity, increasing carbon reserves in the below-ground tissues and lowering nitrogen content in leaves, as shown in Posidonia oceanica seedlings [20].
In the context of global climate change, seagrasses are rarely affected by just one stressor [11,12,13]. Species-specific trait responses to interactive effects of climate change stressors have been examined on adult seagrass plants [10,21,22,23,24,25], but little information is available on seagrass early life stages, and even less in tropical species. From these studies on adult seagrasses, we know that it is possible that CO2 enrichment could ameliorate or enhance the effects of warming in seagrass seedlings, but more studies are needed to provide a better understanding.
Enhalus acoroides is a common tropical Indo-Pacific foundation seagrass species widely distributed within the region. It is found from shallow intertidal to subtidal areas, being especially exposed to local and global disturbances, including climate change. E. acoroides is the biggest seagrass species in terms of its architectural properties [26] with shoots up to 1 m long [27]. It shows both horizontal clonal growth and production of new plants from seeds that are genetically unique individuals (genets). Sexual reproduction is a major sink of resources in E. acoroides compared to other co-habiting species [28,29], and seeds are large and full of carbon reserves [18]. The photosynthetic process in E. acoroides potentially has a very unique carbon concentrating mechanism more dependent on the uptake of CO2 rather than HCO3 [30] and is potentially Ci limited at current concentrations [31]. As large seagrasses show low growth rates and biomass turnover [32], environmental changes could be detected more quickly in the seedling phase. Moreover, seedling development and growth are the most critical steps in seagrass survival [33] and could be more sensitive to changes than adult individuals from the same species. However, there is a lack of research conducted on responses of E. acoroides to environmental changes, especially on seeds and seedlings [18,29,30,34,35,36,37,38,39]. The understanding of seedling trait responses under different environmental conditions may help to understand the effect of those changes, but also enhance future restoration plans of these threatened ecosystems. The conservation and management of these ecosystems requires knowledge about how they perform at the individual plant level in both early and adult life stages.
This study aims to measure the morphological, biochemical, and physiological trait responses of E. acoroides in the seedling phase under an increased average temperature and increased CO2 concentrations. We conducted a laboratory experiment using seedlings of E. acoroides to test the hypothesis that seagrass seedling development would be enhanced (synergistic effect) by independent and combined increases in temperature and CO2 concentrations in terms of growth and photosynthetic performance. The results of this study will help to understand the success of seedlings of E. acoroides under extended exposure to high temperatures and increasing CO2 concentrations, which are predicted to occur under global climate change scenarios.

2. Material and Methods

2.1. Collection and Maintenance of Seagrass Seedlings

Fruits of E. acoroides were collected on 12 January, 2017 on the southwest side of Barrang Lompo Island, South Sulawesi, Indonesia (S 5°03′05, E 119°19′37) where E. acoroides is abundant in a depth range of 1–3 m. Annual seawater temperature range in the dry season varies in this area between 26 and 32 °C [40], and light intensity ranges between 100 and 250 µmol photons m−2 s−1 [41]. The ripe seagrass fruits were opened, packed in a Styrofoam box with wet cotton, and then transported to the Marine Experimental facilities (MAREE) at the Leibniz Centre for Tropical Marine Research (ZMT) in Bremen (Germany) in less than 24 h. Once at the MAREE, seeds were planted directly in polypropylene trays previously filled with silicate sediment of at least 10 cm in depth.
The trays were kept in 250-l aquaria filled with artificial seawater (Red Sea Salt, Red Sea Europe Company, 27130 Verneuil d’Avre et d’Iton, France) under controlled fluorescent light (200 ± 30 µmol photons m−2 s−1, 12:12 h light:dark), temperature (26 ± 1 °C), and salinity (35) conditions. Seagrass seeds were maintained under these controlled conditions for approximately 8 weeks until the experiment began. During this time, seeds developed into seedlings with both short leaves and roots (see below for average size).

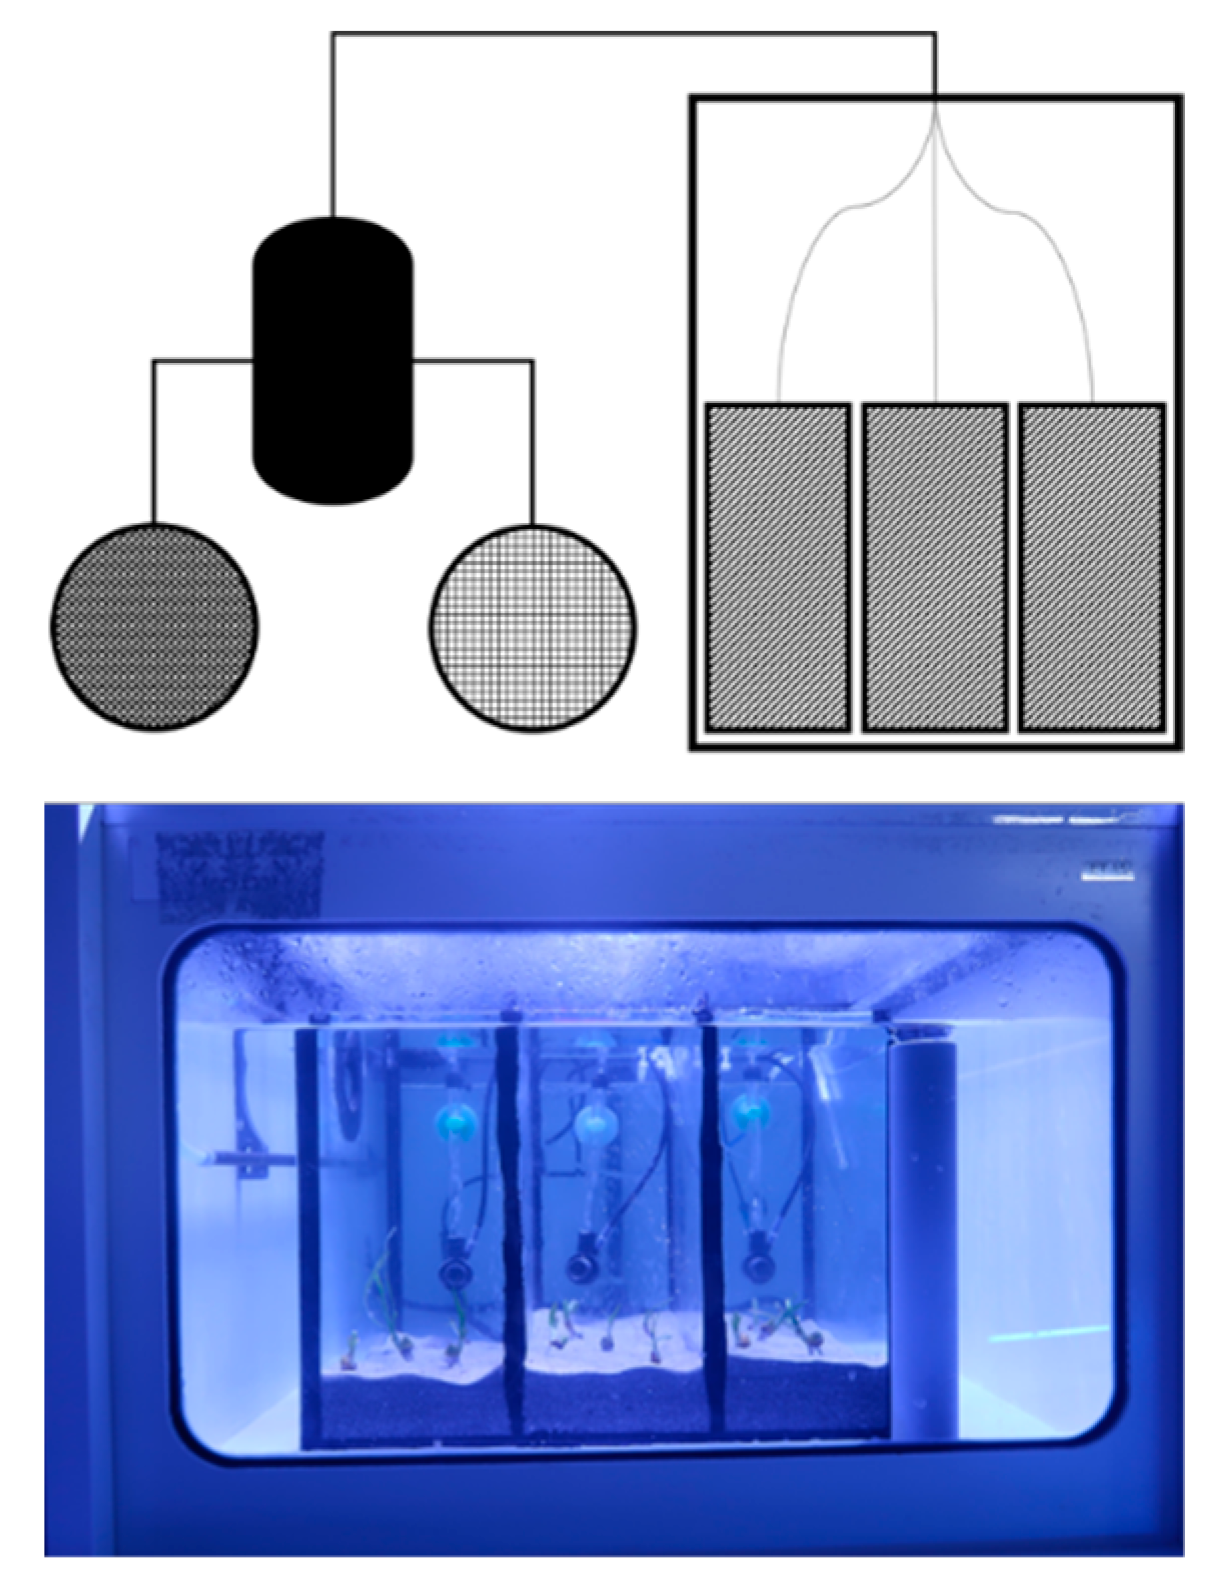
2.2. Experimental Design and Setup

We conducted a fully crossed two-factorial experiment (Figure 1) to study the effects of temperature, CO2, and their interaction on the trait responses of E. acoroides seedlings. We ran the experiment using an indoor flow-through system with 24 aquaria (10 × 29 × 50 cm) in a temperature-controlled room set at 26 °C (MAREE, ZMT, Bremen, Germany).
In each aquarium, three seagrass seedlings were carefully planted by hand. Each seedling had leaves and roots fully developed with an average (±standard error, SE) of 1.93 ± 0.06 cm in leaf length, 6.27 ± 0.22 cm of root length, 1.10 ± 0.02 cm of seed diameter, and 0.9–5.5 g fresh weight (FW). Each aquarium was previously filled with pre-cleaned silicate sediments (~7 cm depth) and 10 L of natural seawater (NSW, North Sea). The NSW was pre-filtered before storage to remove plankton and avoid organic matter remineralization. A pump was placed in each aquarium to ensure the water aeration and homogeneous mixing by moving water from the bottom to the top, reducing the diffusive boundary layer.
We applied two levels of temperature: low and high (27 and 31 °C) and two levels of CO2 concentrations (ambient, 400 µatm, and enriched, 700 µatm) and all the possible combinations, yielding in four different treatments: low temperature and ambient CO2 concentrations, low temperature and enriched CO2 concentrations, high temperature and ambient CO2 concentrations, and high temperature and enriched CO2 concentrations. Each of the 24 aquaria were independent and served as replicates (n = 6) of the four treatments. Experimental temperature levels were selected based on lower and higher average temperatures in seagrass meadows in the region. The levels of CO2 concentrations were selected according to scenarios forecasted by the Intergovernmental Panel on Climate Change (IPCC). Therefore, the selection of experimental temperature and CO2 concentration levels was based on obtaining realistic future trait responses rather than to obtain stress-related responses.
The experimental temperatures were obtained by placing aquaria in eight experimental tanks (ET) (42 × 87 × 58 cm) of 250 L (three aquaria in each ET), which served as water baths maintaining a constant water temperature. The water temperature was continuously controlled in each ET using heaters (EHEIM GmbH, Germany) connected to a digital controller and probe (±0.2 °C). A pump was also placed in each ET to ensure that the water was mixed to keep the temperature constant.
Each of the two CO2 concentrations, termed ambient and enriched, were applied to two 115-l water reservoirs. We achieved the desired concentration in each water reservoir by constantly bubbling NSW with CO2 from the gas cylinder’s main tank. Each water reservoir was used to provide an equal and constant water flow to aquaria at a rate of ~4 mL min−1 by using a 24-channel peristaltic pump (ISMATEC, Cole-Parmer GmbH, Germany) ensuring total water renovation inside each aquarium every ~1.5 days. Therefore, each water reservoir pumped NSW to half of the total aquaria. Water reservoirs were manually emptied from any remaining water and refilled with fresh NSW every other day. A stock nutrient solution was added and gently mixed with NSW in each water reservoir during refill to achieve a final concentration of 1 μM NH4NO3 and 0.1 μM KH2PO4 (Merck, Germany) to avoid nutrient limitation during the experiment. The desired CO2 concentrations (ambient or enriched) were maintained by also directly bubbling each aquarium with CO2 from the gas cylinder’s main tank. The loss of CO2 in the aquaria was avoided by covering each ET with a transparent PVC lid that also reduced water evaporation. Water constantly overflowed from the aquaria to the water bath of the ETs, ensuring water renewal. At the same time, ETs were drained of the surplus water flowing out of the aquaria. The light was provided with two LED (light emitting diode) lamps (Hydra Fifty-two HD, AquaIllumination®, Iowa) placed at the same height at the top part of each ET, providing the aquaria with a light intensity of 200 ± 20 μmol photons m−2 s−1 set on a 12:12 h light:dark cycle with sunrise and sunset simulation.
Seedlings were acclimated in the experimental setup at 27 °C and no CO2 additions for five days. During this phase, all ETs were controlled by the same circulation system. Therefore, they were all connected to ensure the same initial conditions for all seedlings. Physico-chemical parameters were regularly controlled to ensure that the desired conditions were maintained. After this acclimation phase, ETs were separated according to the experimental treatments described above. The temperature of four random ETs (i.e., 12 aquaria) was increased by 1 °C per day from 27 to 31 °C, while the other four ETs were maintained at the same temperature as during the acclimation phase. Once the temperature of each aquarium was stable, CO2 enrichment began and the experimental treatments lasted 35 days (20 March 2017 to 24 April 2017).

2.3. Water Sampling

Water parameters, including pH, dissolved oxygen, temperature, conductivity, and salinity, were measured in each aquarium every three days using a multi-parameter probe (WTW Multiprobe). Water samples for silicate and phosphate were taken every week from random aquaria of each treatment (n = 2) and from both water reservoirs with a syringe, immediately filtered (0.45 µm pore size) in pre-rinsed polyethylene bottles, and frozen (−20 °C). Analysis was performed using a continuous flow injection analyzing system (Skalar SAN++-System) following standard methods for nutrient analysis [42].
For alkalinity measurements, water was sampled directly from the aquaria and immediately filtered (0.45 µm in pore size) and stored in the fridge (4 °C) in the dark. Samples were analyzed within two days, and mercury chloride was added to samples that were not analyzed within this period. Alkalinity was photometrically measured with Metrohm Dosimat® using an Open Vessel Titration [43]. pCO2 values were estimated based on salinity, conductivity, alkalinity, pH, and dissolved phosphate and silicate concentrations [44].

2.4. Seedling Trait Responses to Treatments

2.4.1. Morphological Traits

At the end of the experiment, seedlings were removed from the aquaria and separated with a glass spatula into three parts (leaves, seeds, and roots) and were weighed separately to get a biomass of each plant tissue. The number, maximum length, width, and surface area (SA) of the leaves were measured. Leaf length measurements were taken from the leaf base to the tip. The leaf SA was calculated by multiplying the leaf length by the width. In the seeds, the diameter and height were estimated while, in the roots, the number and maximum length were measured.

2.4.2. Biochemical Traits

The nutrient content was analyzed in the pooled material of the three seedlings from each aquarium. The nitrogen and carbon content (%N and %C, respectively) were analyzed in leaves, seeds, and roots that were previously dried (60 °C for 48 h) and ground to a fine powder with mortar and pestle. Aliquots of the ground sample were weighed into tin capsules using an analytical scale prior to analysis (Euro EA3000 Elemental Analyzer).
The concentrations of soluble sugars (sucrose) and starch were measured on leaf and seed material that was frozen (−80 °C), subsequently freeze-dried (48 h), and ground to a fine powder with mortar and pestle. Sucrose was extracted from plant tissue by heating (80 °C) the sample in EtOH 95%. The ethanol extracts were then evaporated by bubbling the samples with N2, and the remaining residues were dissolved in deionized water. Starch was extracted after having the ethanol-insoluble residue in 0.1 N NaOH for 24 h. The sucrose and starch concentrations were determined spectrophotometrically (486 and 640 nm, respectively) using a F200-Pro TECAN© plate reader. Resorcinol and anthrone assays were respectively used for sucrose and starch determination, while sucrose was used as the standard for calibration curves [45,46]. Results were reported in sucrose equivalents g dry weight (DW). Current testing of this method has shown that NaOH extracts both starch and cellulose, which can confound the results. Regarding the sucrose determination, this method only determines ketoses (as fructose), so we are ignoring glucose, which is the other component of sucrose, which may lead to an underestimation of the final concentrations (M. Birkicht, personal communication).

2.4.3. Physiological Traits

Seedling growth rate was measured using the leaf marking method [47]. At the beginning of the experiment, leaves were perforated close to the seed using a needle. At the end of the experiment, the elongation of the leaf, known as the length from the base of the leaf to the mark, was measured. Leaf SA growth rates were obtained by multiplying the leaf elongation by the leaf width and dividing the result by the number of days since the seagrass leaves were marked. Leaves without holes were considered new leaves and were measured from the leaf base to the tip of the leaves.
Responses of photosynthetic performance were measured at the end of the experiment using a PAM-2500 chlorophyll fluorometer (Walz, Germany) with rapid light curves (RLC). The PAM optical cable was attached to the mid part of the second leaf of the seedling by using a leaf clip, and ~3 mm in distance from the tissue. This position was chosen since it represents similar distances from the water surface (and, thus, from the light source) among plants with different leaf lengths [48]. Before measurements, the leaves were adapted in the dark for 5 min while maintained in NSW. The RLC consisted of 12 saturating light pulses (separated by 30-s intervals) increasing photosynthetic active radiation (PAR) between pulses until 3001 µmol photons m−2 s s−1. From the RLC data, several parameters were calculated. The maximum quantum yield (Fv/Fm), the relative maximum electron transport rate (rETRmax), the light saturation coefficient (Ek), and the slope of the light limited part of the curve (α) calculated using Phytotools [49] under R software [50], following the model in Reference [51]. Efficient utilization of Fv/Fm was calculated by following Equation (1) [52].
Maximum quantum yield:
( F v / F m ) = ( F m F o ) F m
where Fm is the maximum dark-adapted fluorescence and Fo is the minimum dark-adapted fluorescence. The relative electron transport rate (rETR) was calculated for each step of the curve following Equation (2) [53].
r E T R = F m F F m P A R 2
where Fm′ is the light-adapted maximum fluorescence, F′ is the fluorescence yield at a particular light level, and PAR is the photosynthetic active radiation. The maximum rETR value (rETRmax) was calculated as the inflection point of the fitted rETR curve.

2.5. Statistical Analysis

Average values of the three seedlings within each aquarium were calculated for physiological and morphological trait responses with no calculation of the deviation of the data. Descriptive statistics as mean values and standard error (SE) were estimated within treatments (n = 6). Prior to statistical analysis, the variance of the residuals was checked for normality (Shapiro-Wilk test) and homoscedasticity (Levene test). A two-way analysis of variance (ANOVA) was performed to detect the influence of temperature (two levels: 26 and 31 °C), CO2 (two levels: ambient and enriched), and the interaction between these two factors on E. acoroides seedling performance. The statistical tests were carried out with SPSS (Statistical Package for the Social Sciences, IBM SPSS Statistics for Windows v.24, Armonk, NW, USA). All comparisons were considered significant at p-values < 0.05.

3. Results

3.1. Water Parameters

Salinity and conductivity were constant across all experimental treatments (Table 1). Within each defined treatment, the temperature was nearly constant. The pCO2 concentrations in the two water reservoirs were ~485 and ~972 µatm for the ambient and enriched treatments, respectively. In aquaria, carbonate system parameters of the ambient CO2 treatments remained well within the target concentration of 400 µatm (calculated pCO2 ~379 µatm). On the contrary, the concentrations in aquaria under enriched CO2 treatments were lower than the target concentration (700 µatm) and the concentration in the water reservoir, but higher than the ambient treatments, with mean values of 464 and 624 µatm in the 27 °C-enriched CO2 and 31 °C-enriched CO2 treatments, respectively (Table 1).
Among all treatments, pCO2 and alkalinity values were the highest in the 31 °C-enriched CO2 treatment. This is in line with the low pH observed in this treatment, showing that the CO2 enrichment reduced the pH of the water. Dissolved oxygen was lower in the regimes of 31 °C when compared to the regimes of 27 °C. Phosphate and silicate concentrations remained very low throughout the experiment and were similar in all treatments during all the experimental periods.

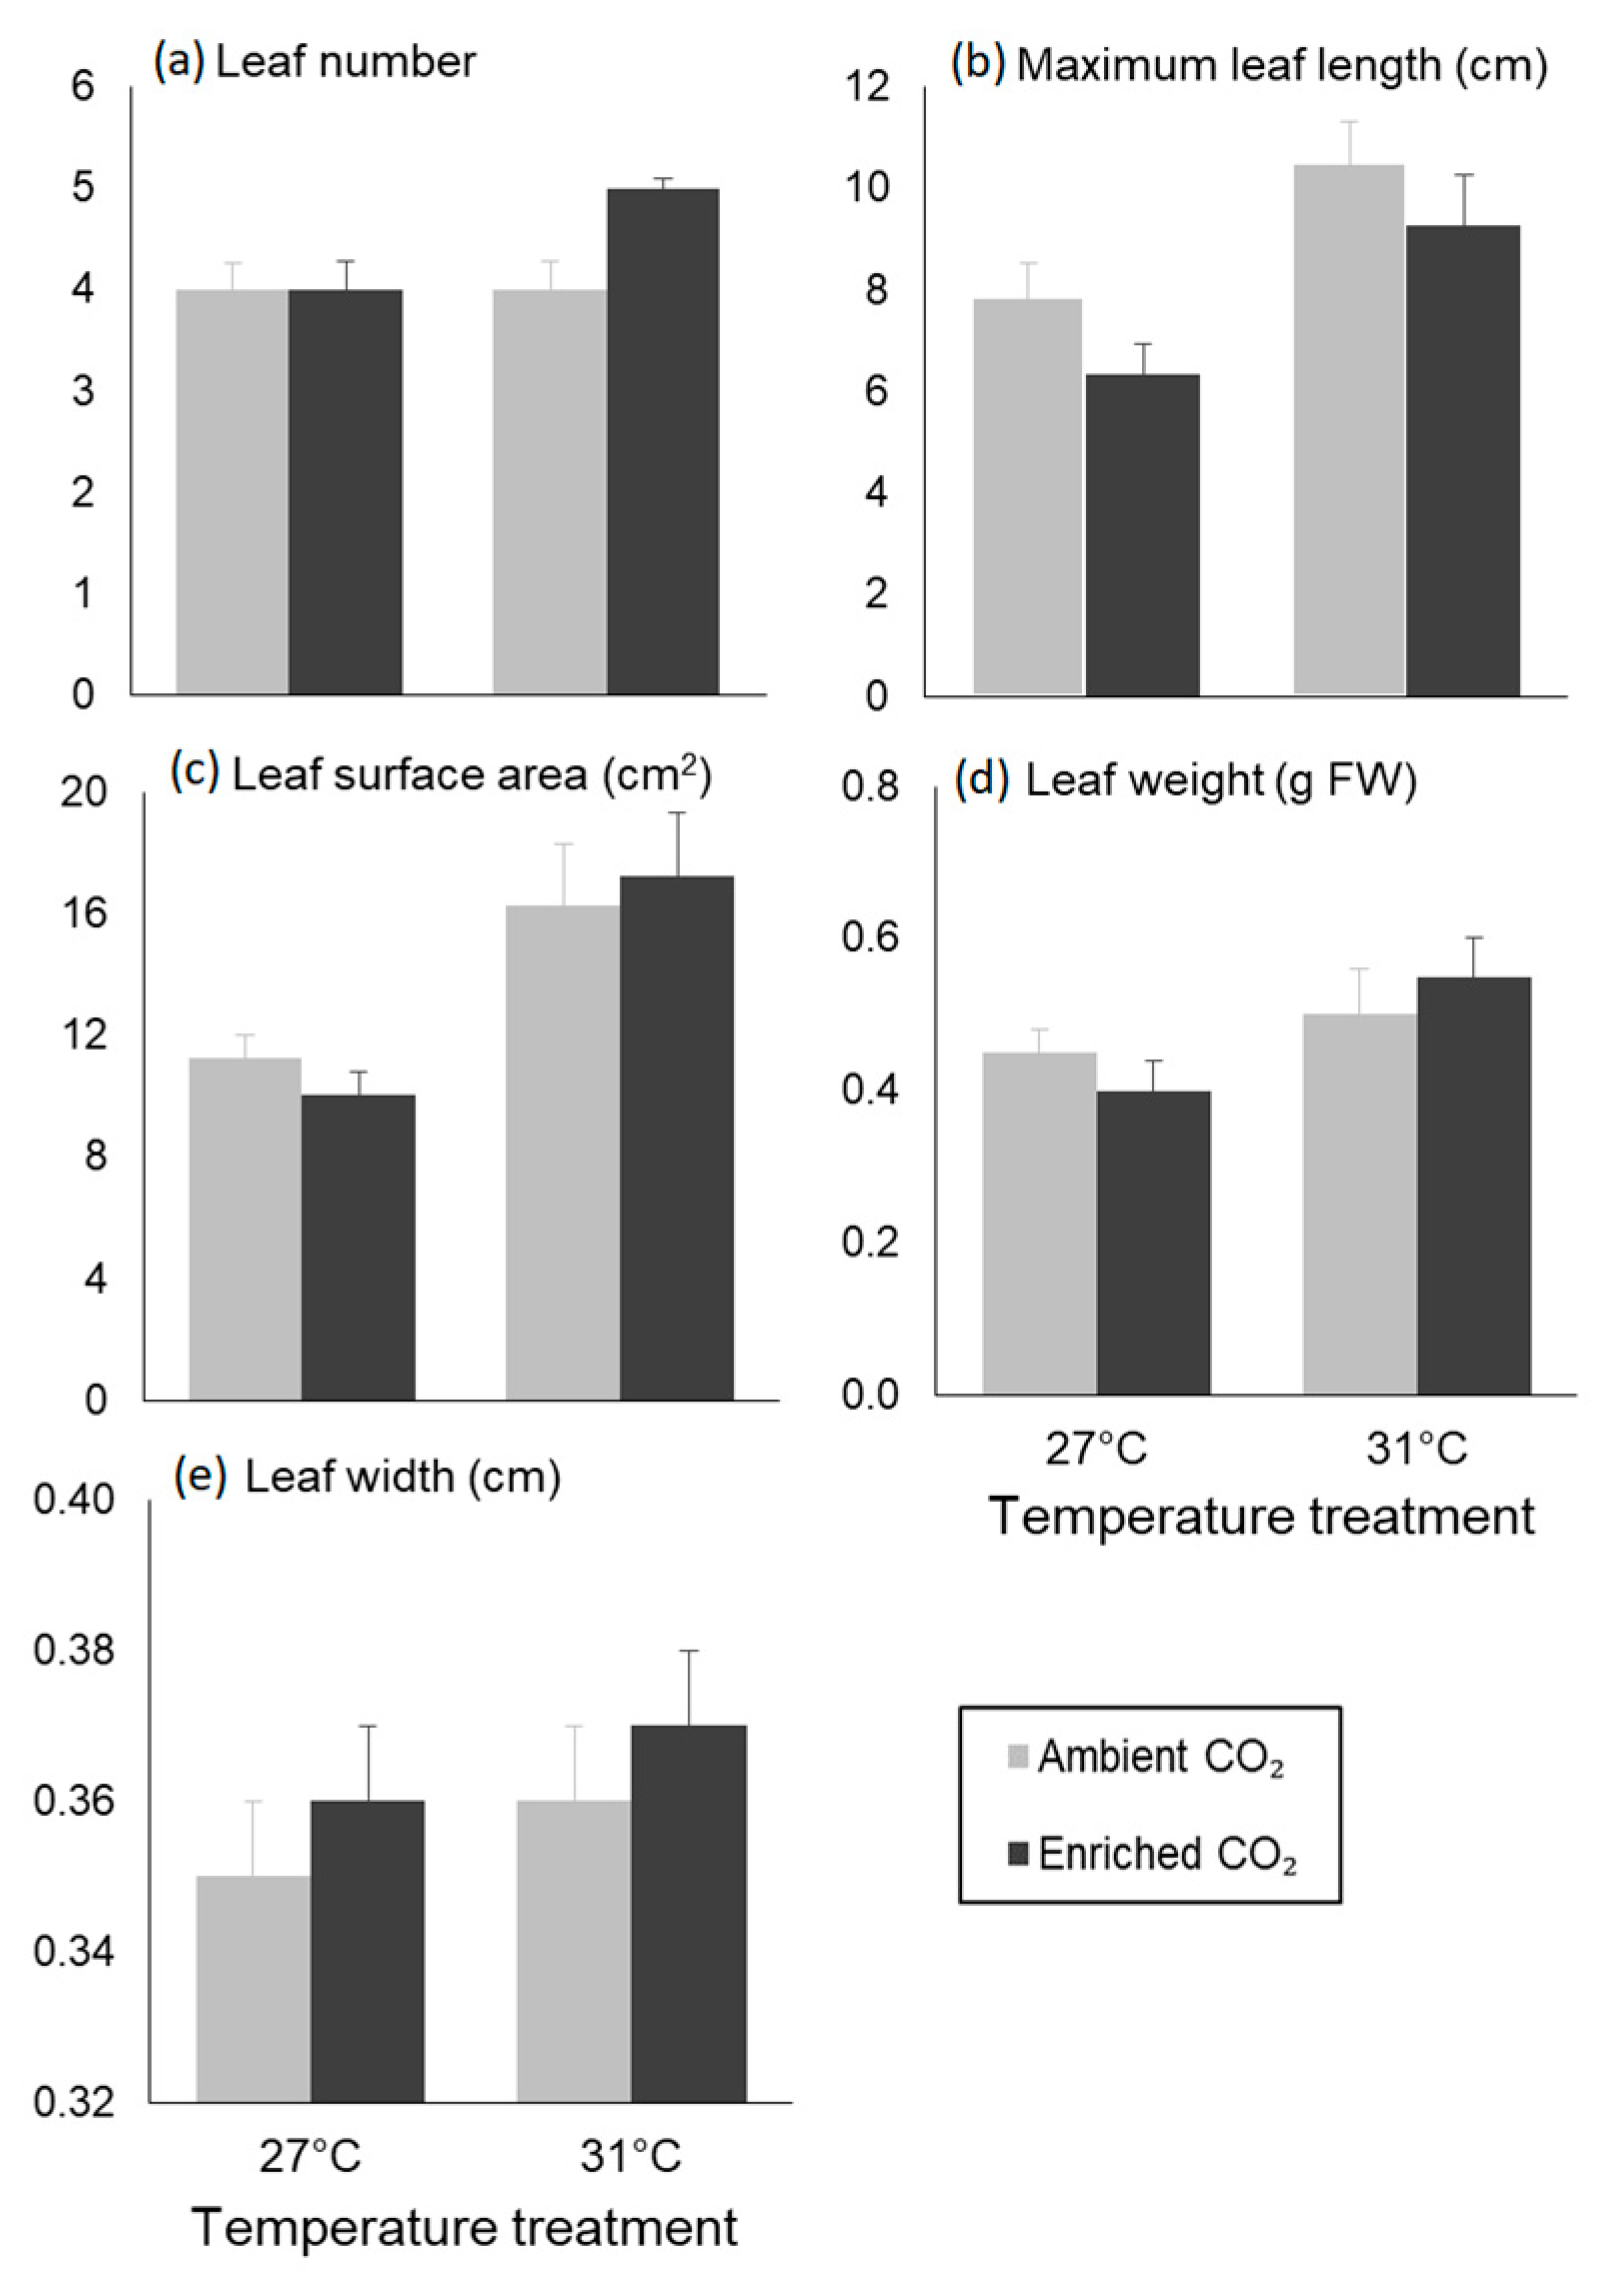
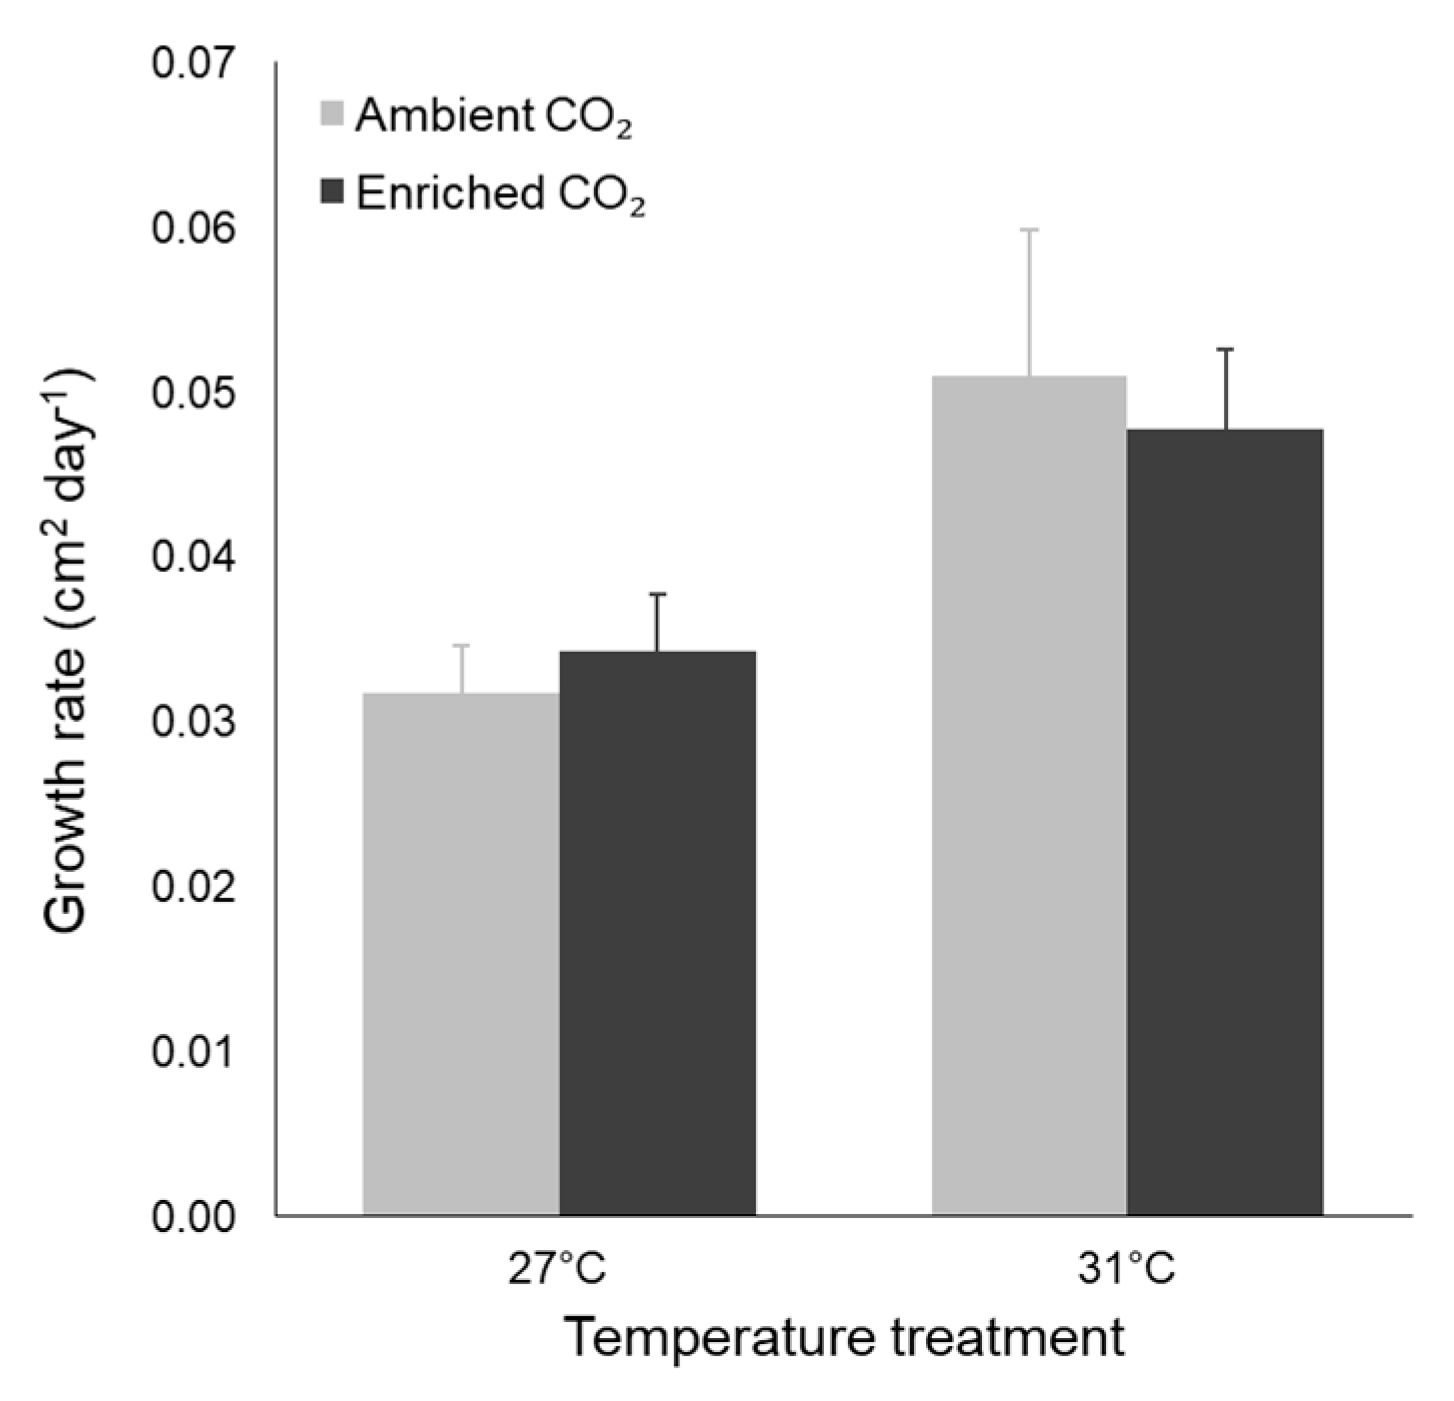
3.2. Morphological Traits

The responses of leaves to the temperature and CO2 treatments differed across morphological traits (Figure 2 and Table 2). The highest leaf number was found in the 31 °C-enriched CO2 treatment with a mean of five leaves per seedling, showing a significant interaction effect (Figure 2a and Table 2).
In comparison, the maximum leaf length, leaf SA, and leaf weight values were significantly higher at a high temperature (31 °C) regardless of the CO2 treatment (Figure 2b–d and Table 2). Even though CO2 treatments did not show a significant effect in most morphological traits, some trends were observed in terms of leaf length, with longer leaves under ambient CO2 compared to enriched CO2 treatments (p-value = 0.065, Table 2). The leaf width did not show any significant difference among treatments (Figure 2e and Table 2). For the seeds and roots, there were no differences among any of the treatments (Figure S1 and Table S1).

3.3. Physiological Traits

Leaf growth rates were significantly higher under the regimes of 31 °C while there was no influence of CO2 treatments (Figure 3, Table 2).
The photosynthetic performance of the leaves was significantly higher under regimes of 27 °C (Figure 4), as indicated by higher rETRmax values calculated from the rapid light curves (Table 3 and Table 4).
Additionally, there was an interaction (p-value = 0.078, Table 4) between the two factors, which are temperature and CO2 concentration, in rETRmax and Ek parameters, with the highest values observed under the 27 °C-enriched CO2 treatment (Table 3). In contrast, the 31 °C-enriched CO2 treatment showed the lowest rETRmax and Ek values (Table 3). Fv/Fm and α measures of the photosynthetic maximum quantum yield and efficiency did not show significant differences among the four treatments, nor any interaction between temperature regimes or CO2 concentrations (Table 3 and Table 4).

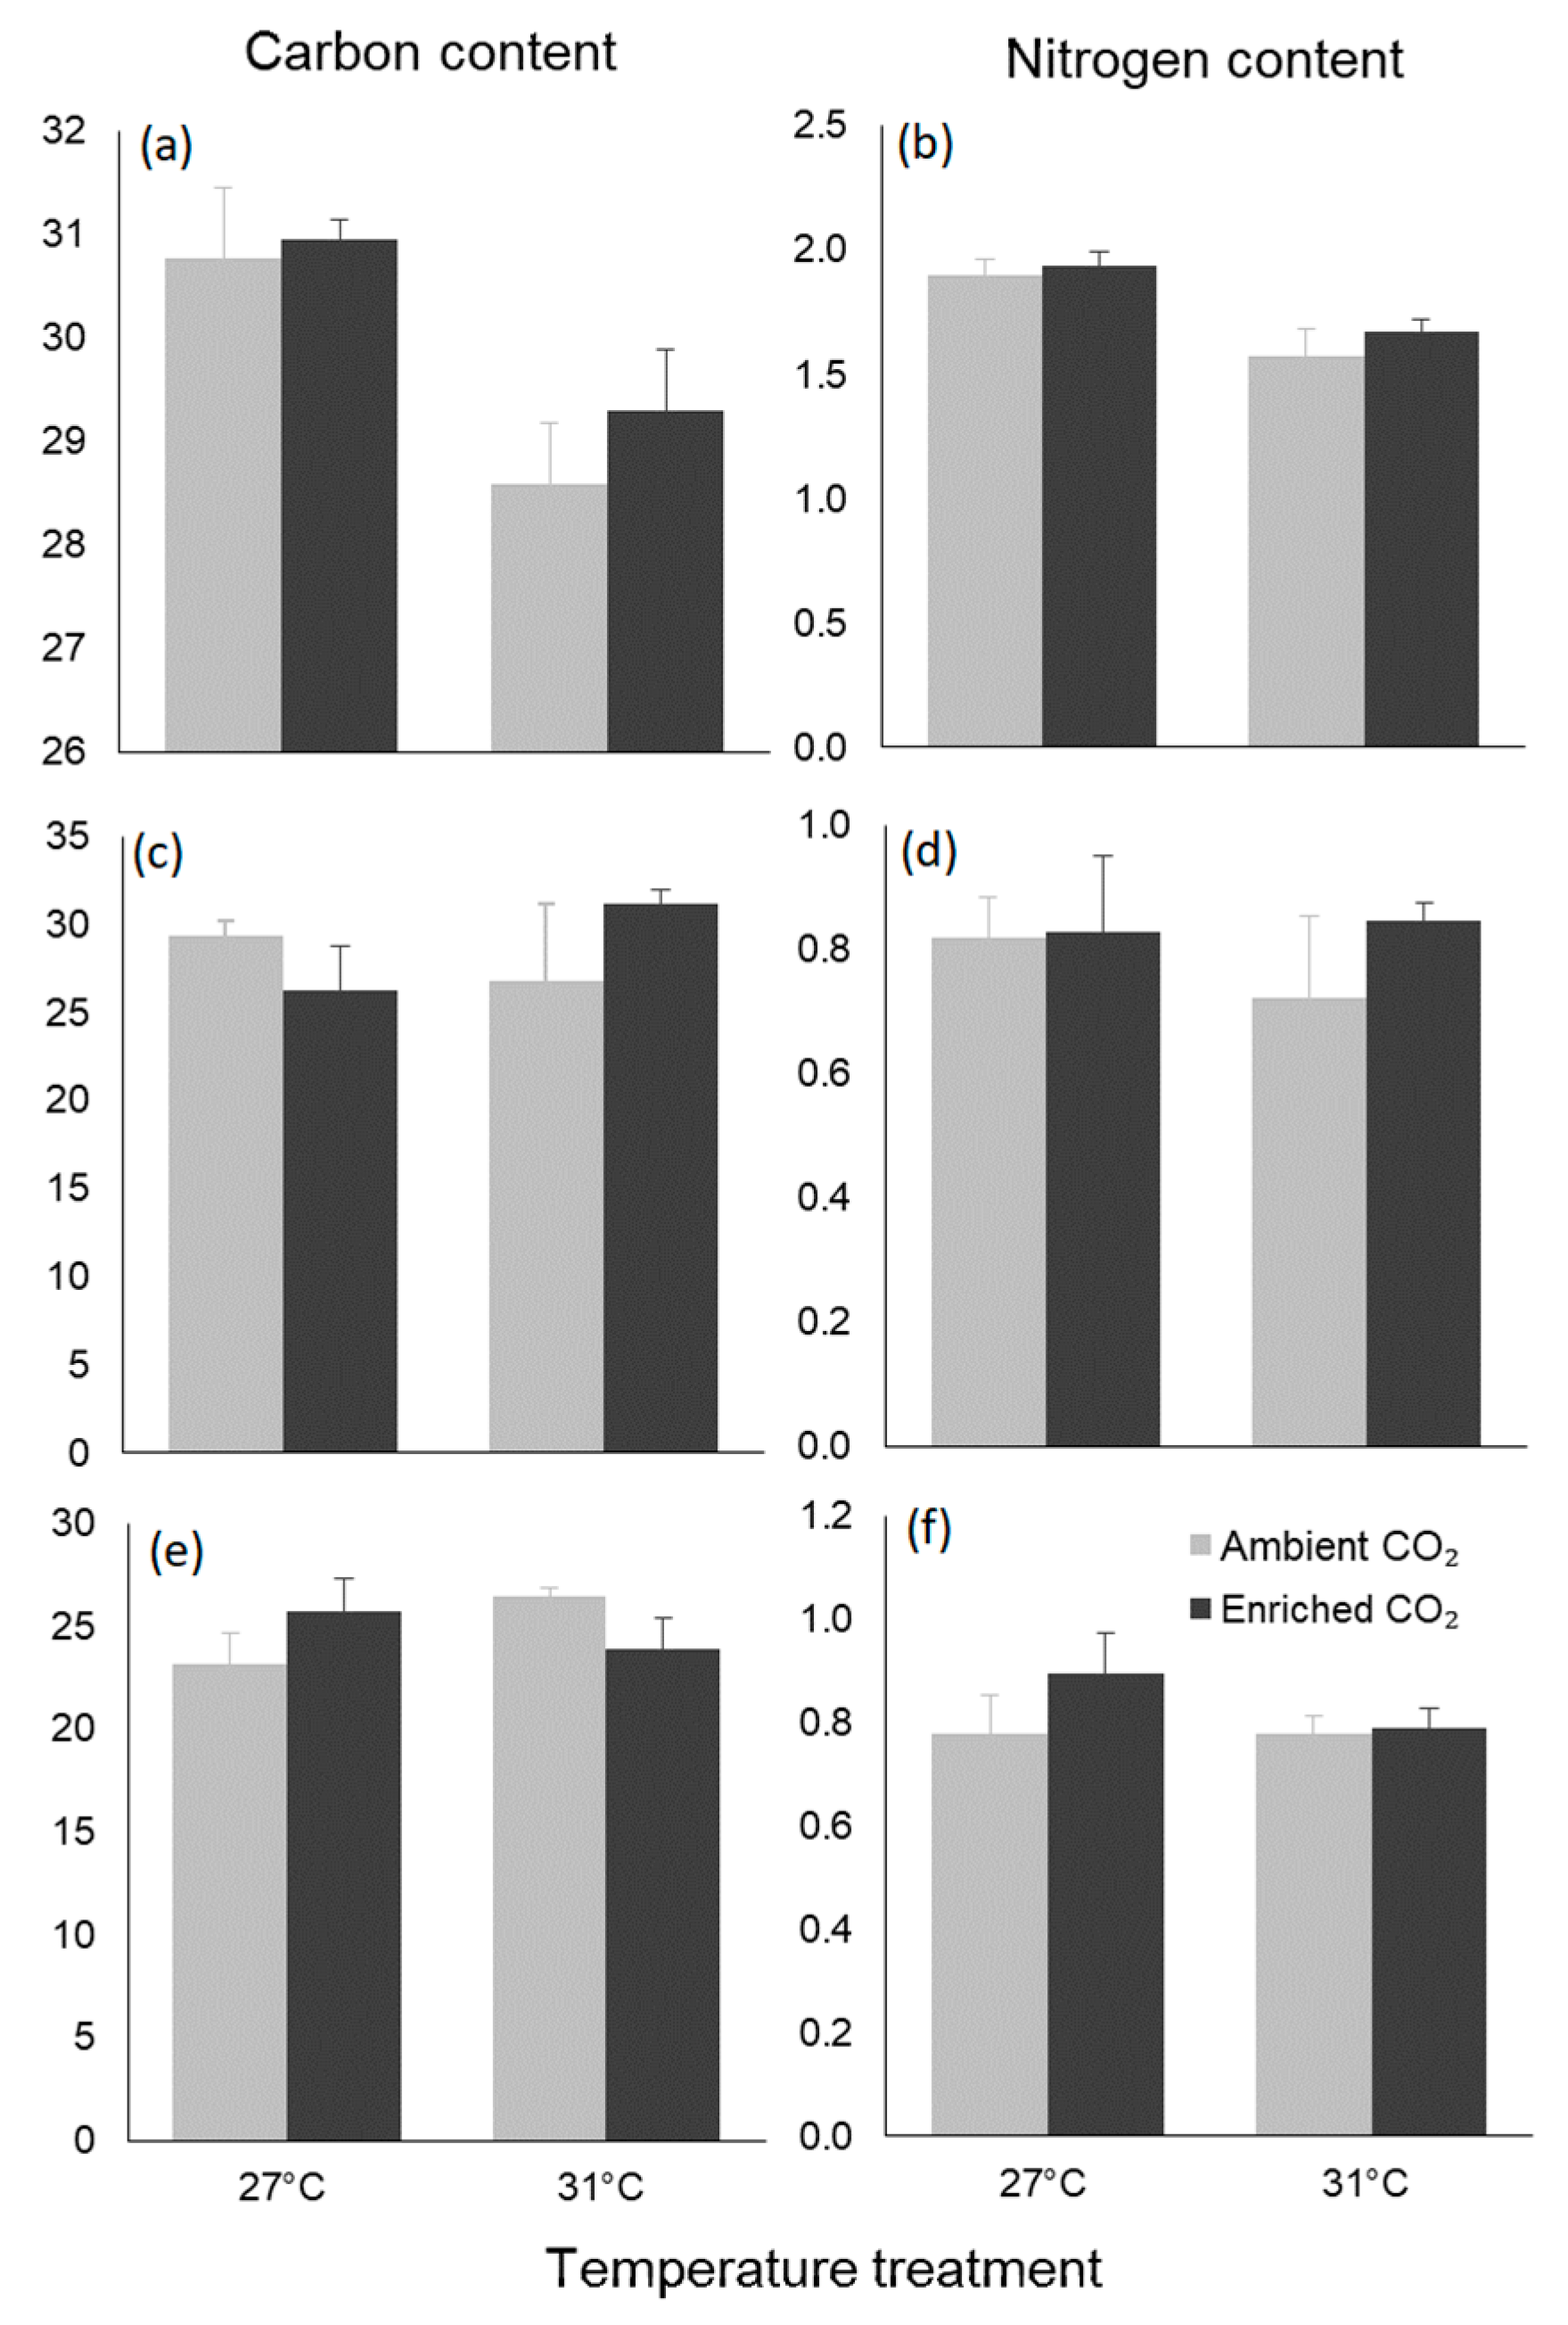
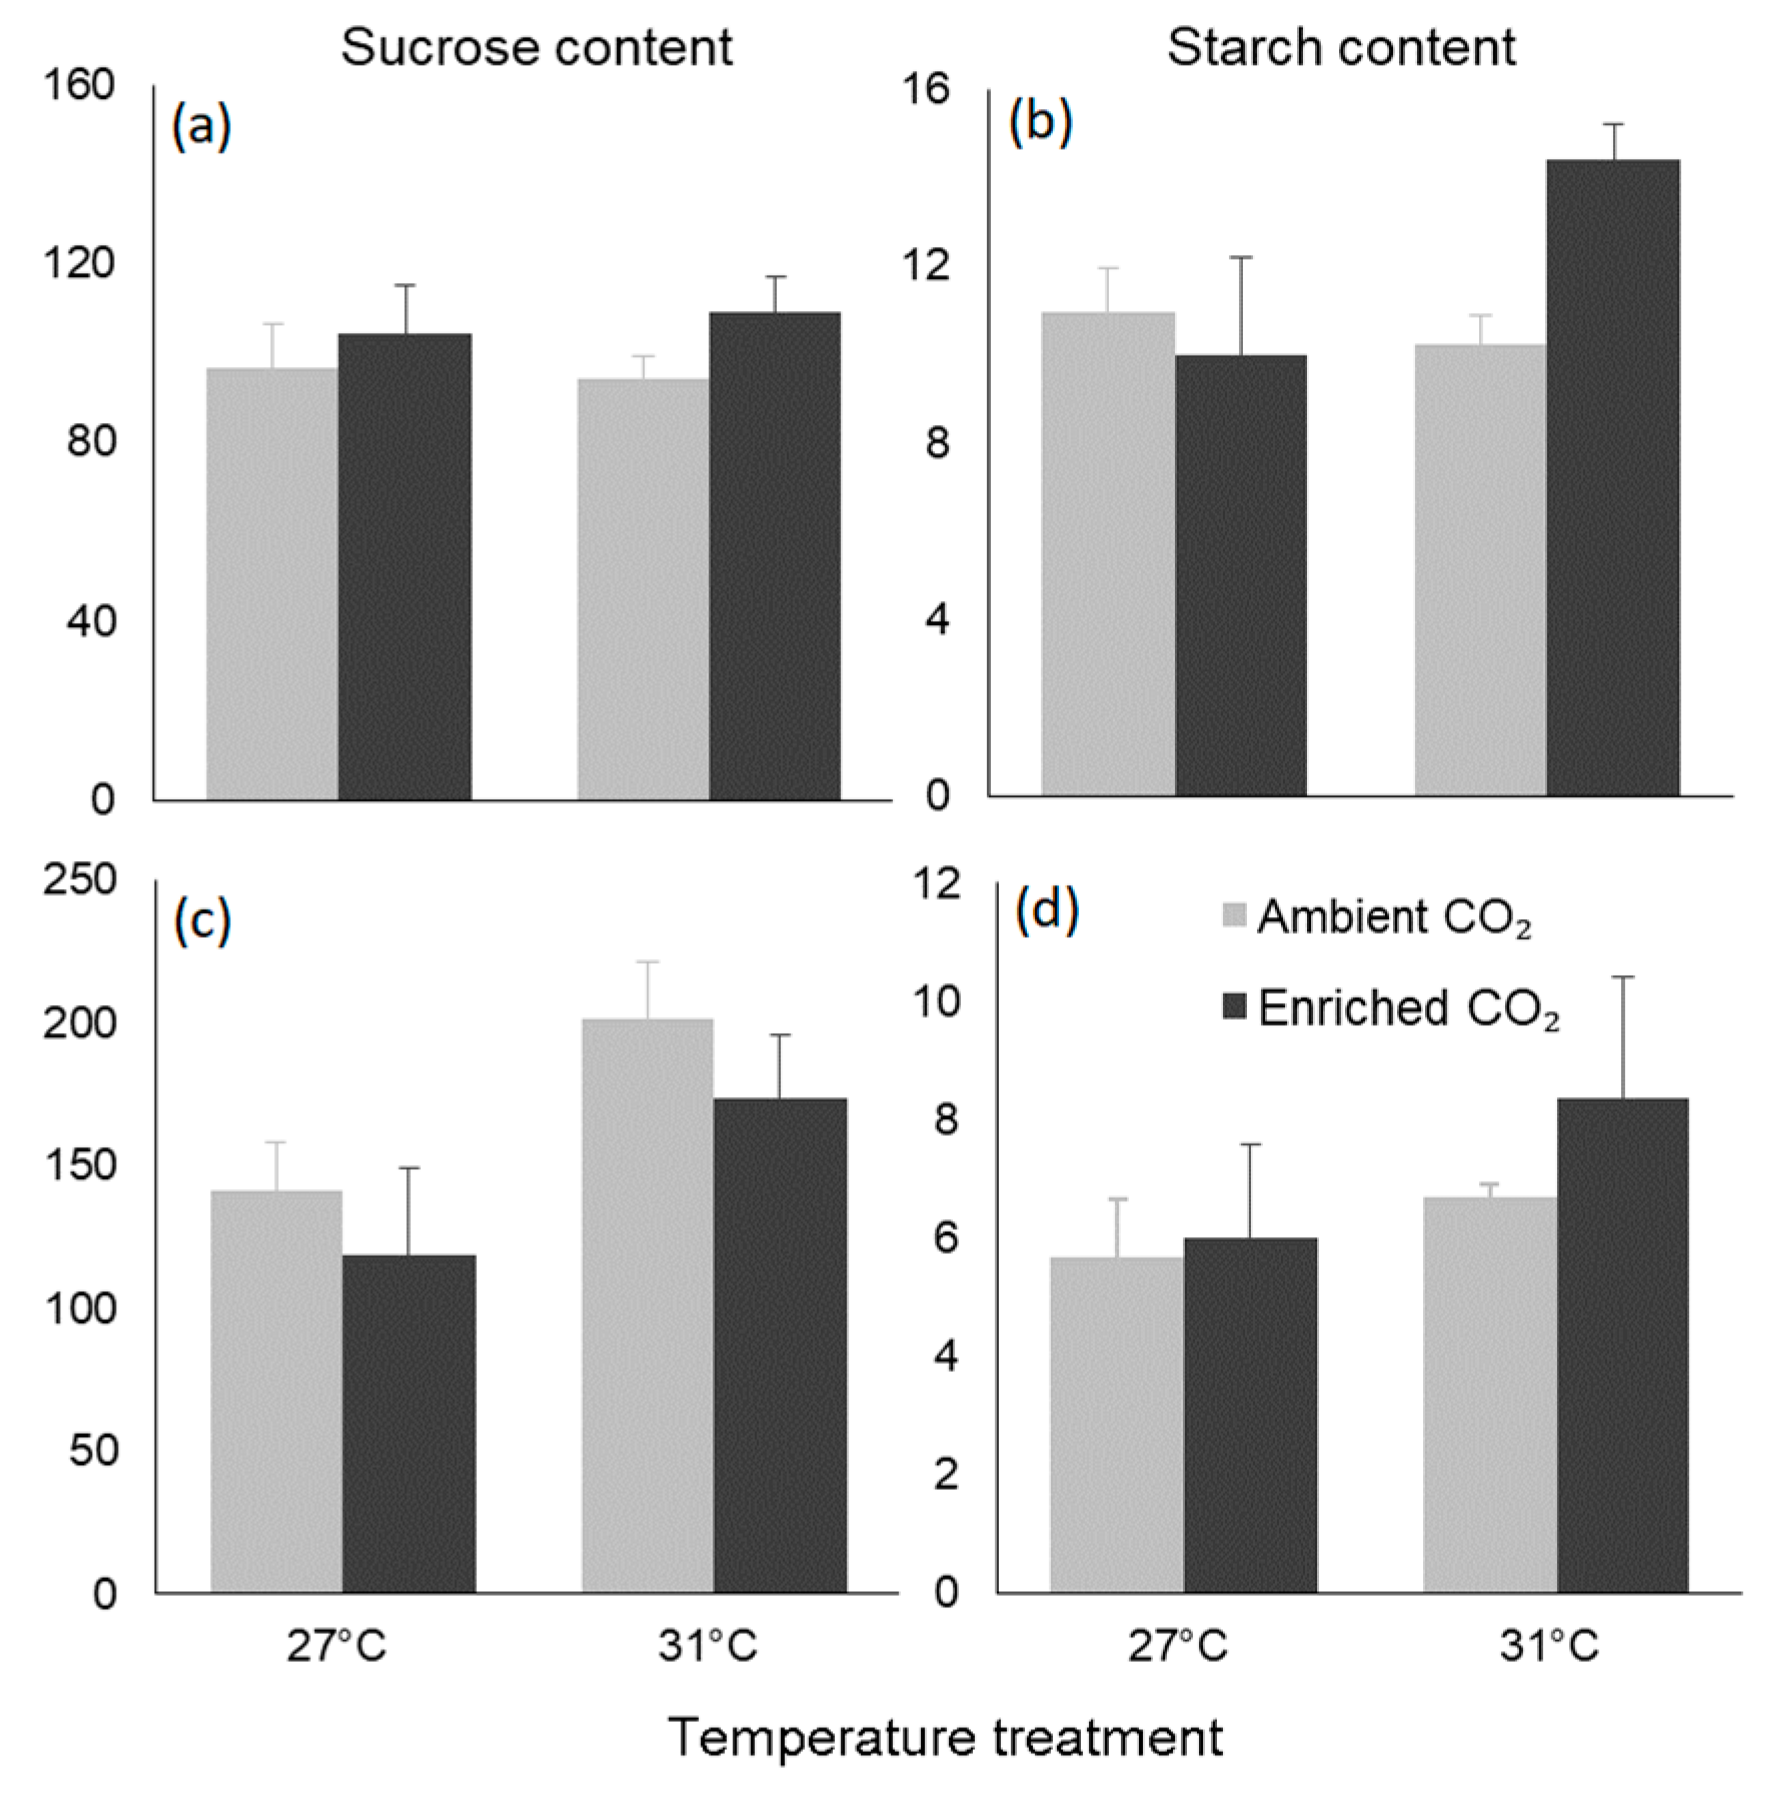
3.4. Biochemical Traits

Biochemical traits, namely carbon, nitrogen, sucrose, and starch content, showed different responses in leaves, seeds, and root tissues in the four experimental treatments considered in the study (Figure 5 and Figure 6, Table 5 and Table 6). With increasing temperatures, the percentage of carbon and nitrogen significantly decreased within the leaves (Figure 5a,b and Table 5).
In contrast, there were no significant differences in single factor effects of temperature or CO2 in the carbon and nitrogen content within the seeds (Figure 5c,d and Table 5) or in the roots (Figure 5e,f and Table 5). However, there was an interactive effect between temperature regimes and CO2 concentration in the carbon content in the root tissue, which showed the highest concentrations in the 31 °C-ambient CO2 and 27 °C-enriched CO2 treatments (Figure 5e and Table 5).
Leaf sucrose and starch concentrations were generally higher in enriched CO2 treatments (Figure 6a,b and Table 6). However, these differences were not statistically significant. There was an interaction effect on starch concentrations in the leaves (p-value = 0.07), which was especially high in the 31 °C-enriched CO2 treatment. In contrast to carbon or nitrogen content, sucrose concentrations significantly responded to an increasing temperature on seed tissues, which are less used in regimes of 31 °C (Figure 6c and Table 6). The highest concentrations of sucrose in the seeds were found in the 31 °C-ambient CO2 treatment, whereas the highest starch concentration in the seeds was found in the 31 °C-enriched CO2 treatment, even though differences were not significant (Figure 6c,d and Table 6).

4. Discussion

4.1. Temperature as the Main Driver of Seedling’s Trait Responses

Temperature was the dominant driver of E. acoroides seedling’s trait responses within this experiment, and there were no synergistic effects in the interaction of both factors. Therefore, our initial hypothesis was rejected. In general, our results showed that seedlings of seagrass E. acoroides perform better at the higher temperature treatments, as bigger leaves with high maximum leaf lengths, leaf SA, and weight were always observed. This is in accordance with what was observed in the field in previous studies with adult individuals, as the temperature was also the major factor influencing the growth rate with increasing values above 30 °C [27]. This pattern of an enhanced size of leaves under an increasing temperature has also been observed in seedlings of Zostera marina [19] while detrimental or no changes were observed in above-ground traits of other persistent species with big-size seedlings, such as P. oceanica, at sub-lethal temperatures [15,17]. The optimum temperature for photosynthesis in adult E. acoroides from Philippines ranged between 24 and 33 °C, with an optimal temperature set at 27 °C [35] or 33 °C [30]. Thus, based on the photosynthetic potential of PSII (Fv/Fm) observed in this study, seedlings are still within the species’ optimal range. However, rETRmax (photosynthetic capacity) and Ek (saturation irradiance) values were higher in the seedlings’ grown at regimes of 27 °C than in the ones grown at 31 °C, showing that some down-regulating mechanism might be potentially initiated at high target temperatures. These detrimental effects on photo-physiology were also observed in P. oceanica seedlings at increasing temperatures [14,17]. Even though, rETR values were higher than in younger seedlings of the same species [18], which indicates a higher independence in maternal reserves in comparison to the younger leaves.
Leaf nitrogen content under regimes of 27 °C was within the range observed in adult E. acoroides plants under natural conditions in South-East Asia meadows [34]. Contrary to this, carbon content was lower than in younger E. acoroides seedlings [18] showing that internal reserves were being used. This has also been observed in P. oceanica seedlings of a similar age [20]. Both leaf nitrogen and carbon contents, however, were also significantly affected by an increasing temperature. Lower leaf nutrient content under regimes of 31 °C was observed, which was likely related to nutrient reabsorption, often occurring under higher growth rates due to dilution of nutrients in leaf tissue [54,55]. On the contrary, higher carbon content in below-ground tissues were detected at the high target temperature, which has been shown in previous studies with P. oceanica and E. acoroides seedlings [17,18]. Higher sucrose concentrations observed in seeds might be a consequence of nutrient reallocation, which is a common mechanism in adult seagrasses under unfavorable environmental conditions [13].
Therefore, while higher temperatures are positive in terms of growth, performance in the regimes of 31 °C suggests that seedlings were close to suboptimal temperatures in terms of photo-physiology and nutrient content. To further test temperature tolerance of seedlings, experiments under higher temperatures (above 32 °C) would be necessary. Therefore, the small differences observed could suggest that higher average temperatures within the current climate change scenario are not detrimental for seedling performance as they can depend on their internal reserves from weeks until months [18,29,56,57,58,59]. This physiological dependence on maternal seed reserves might help them to ameliorate the effects of environmental factors, as shown in this study.

4.2. Interactions of Temperature and CO2 Concentrations on Seedling’s Trait Responses

In our study, enriched CO2 concentrations alone did not significantly affect performance of E. acoroides seedlings in terms of its photo-physiology or growth, nor did they affect the carbon balance of the seedlings, suggesting that they are still dependent on their internal carbon reserves. Previous studies have shown that, in many cases, seagrass are Ci-limited at the current oceanic concentrations. Therefore, an increasing CO2 concentration has often been related to an overall better performance, in terms of growth or photosynthetic rates, in both temperate and tropical species, including E. acoroides [31,60,61,62,63]. For instance, Thalassia hemprichii, which is another persistent tropical seagrass species, can increase its growth rate under CO2 enrichment (~1000 µmol L−1) [64] as well as Z. marina, which showed an increase in growth in CO2 cultures enriched two-fold when compared to the control [65].
In terms of the biochemical traits, the absence of effects of CO2 on leaf nutrient contents suggests, as previously observed with increasing nitrogen concentrations in seawater, that seedlings are still sustained by internal nutrient reserves [18]. Carbon balance in the body of a plant is a major factor determining the rate of growth, which also occurs in seagrass [66]. Changes in carbon balance increasing the storage in below-ground tissues have been observed in other seagrass species under enriched CO2 concentrations for longer periods than in this study [20,67], suggesting it may be a long-term strategy of plant survival.
Therefore, contrary to the beneficial effects shown in other previous studies in marine primary producers [13], our results did not show any clear positive effect of CO2 enrichment. We did, however, observe interactions with temperature that could benefit seagrass development in this initial seedling phase. This interaction of increasing CO2 concentrations on thermal acclimation, even within sublethal temperatures, is still not well understood in seagrasses.
The study results showed enhanced photo-physiological activity in terms of higher rETRmax and Ek values in the 27 °C-enriched CO2 treatment, but not under the regimes of 31 °C, showing a weak interactive effect of both factors (p-value = 0.078). Even though CO2 concentrations in the 31 °C-enriched treatment were greater (~600 µatm) than in the 27 °C-enriched CO2 treatment (~465 µatm) due to increased CO2 solubility with temperature, we did not observe an enhanced performance in the 31 °C-enriched CO2 treatment. This higher rETRmax (photosynthetic capacity) was not related to the biggest leaf morphological traits, which were observed under the 31 °C-enriched CO2 treatment nor with higher internal nutrient contents. However, a trend of increasing concentrations was observed in enriched CO2 treatment. This interaction could be more important in a tropical environmental as, even though some sites where E. acoroides grows are highly eutrophic [68,69], these systems are typically oligotrophic and dissolved nutrients are usually the limiting factor [34]. A better understanding of responses at a biochemical or morphological level has shown that the high photosynthetic performance observed in some studies is more a short-term response to Ci limitation that is difficult to maintain over time due to the potential limitation of other factors [22,70,71]. This was also observed with P. oceanica seedlings, which showed higher photosynthetic performance after two months of study than at the end of the study period [20].
We also found a significant interactive effect in the carbon content in roots (p-value = 0.049), with the highest concentration in the 27 °C-enriched CO2 treatment, but with no relation to root biomass. In this treatment, we also observed the highest nutrient content in leaves. Therefore, the relative contribution of root versus leaves in meeting carbon or nitrogen requirements might be influenced by the higher photosynthetic performance under enriched CO2 treatments (i.e., the highest value of rETRmax).
These surprising results are becoming more common in recent studies [72,73], showing that seagrass responses to CO2 enrichment are more complex than suggested in previous studies [74].

4.3. Different Trait Responses and Dependence on the Internal Reserves

From the discussion above, it is clear that there is no single trait that can clearly indicate the effect of different stressors, and results are even more confounding when multiple stressors are influencing seedling performance. Physiological and biochemical traits in seagrass have usually been highlighted to be the first to respond under different stressors [75], which is followed by morphological and community traits (i.e., biomass loss). After 35 days, most leaf traits have been influenced by temperature, enhancing their production in terms of size. However, physiological and biochemical traits were negatively influenced by this factor, including photo-physiological activity and nutrient content in leaves. This also suggests that it is important to look to a combination of traits to get a more holistic picture of plant responses.
Overall, leaf traits responded more quickly to the experimental treatments, as we observed no responses in seeds or roots, with the exception of carbon content in this latter tissue. Therefore, leaf tissue is a better early indicator of temperature or interactive CO2 effects in seedlings. Although there is not much experimental evidence with adult E. acoroides individuals, based on their life-history traits, this species is classified as persistent with very large blades and slow growth. Therefore, using seedling traits as indicators of climate change effects in this species might be an advantage as faster responses could be obtained.
Seedlings have large maternally derived nutrient resources, so they do not appear to be limited by carbon, or other nutrients [18]. This lack of physiological independence likely buffers the seedlings from environmental stressors, leading to small differences in the responses. Additionally, seedlings are genetically unique individuals that have not been selected for by the natural environment via the “environmental sieve” (sensu Harper). Consequently, they may not respond the same as genotypes that have been selected by survival in the field (adult plants) and may not be representative samples of the population. In summary, we observed deleterious effects on seedlings, as lower nutrient content in leaves, photo-physiological performance, or the prioritization of the development of above-ground tissues. However, contrary to what was observed with adult seagrass, CO2 enrichment did not help seedlings to cope with high temperatures. Further studies on the long-term ecological consequences of the changes in these traits are needed to better understand how seedling’s development influences adult populations.

Supplementary Materials

The following are available online at https://www.mdpi.com/2076-3417/11/6/2730/s1. Figure S1: The effect of increasing temperature and CO2 enrichment on (a) seed diameter, (b) seed height, (c) seed weight, (d) root number, (e) maximum root length, and (f) root weight of Enhalus acoroides seedlings at the end of the experimental period. Values are mean ± SE (n = 6). Table S1: Results of analysis of variance (two-way ANOVA test) of the effects of temperature and CO2 and their interaction on the morphological seed and root traits (Figure S1). No statistical differences were detected (p-value < 0.05).

Author Contributions

S.R.A.: Methodology, Sampling, Data Analysis, Writing. R.A.-R.: Writing, Supervising. M.F.S.: Writing, Supervising. M.T.: Conceptualization, Methodology, Writing, Supervising. A.M.-S.: Sampling. I.G.V.: Methodology, Sampling, Data Analysis, Writing. All authors have read and agreed to the published version of the manuscript.

Funding

This research was supported by PMDSU (Program Mahasiswa Doktoral Sarjana Unggulan) Scholarship (SP DIPA-042.06.1401516/2018) from the Ministry of Research and Technology of Higher Education in collaboration with Hasanuddin University awarded to Suci Rahmadani Artika. This research is also a part of the project SEAMAC (Seagrass and macroalgal community dynamics and performance under environmental change) funded by the German Research Foundation (DFG, TE 1046/3-1) awarded to MT. IGV was awarded with a postdoctoral fellowship of Xunta de Galicia (Consellería de Educación, Universidad e Formación Profesional) postdoctoral programme (ED481B-2016/189-0) and Juan de la Cierva-Incorporación postdoctoral programme (IJC2019-040554-I).

Institutional Review Board Statement

Not applicable.

Informed Consent Statement

Not applicable.

Data Availability Statement

The data presented in this study are available on request from the corresponding author.

Acknowledgments

We would like to thank the Barrang Lompo field team, Daeng Munir, Pak Ridwan, Aswin Wardana Putra, Pajar Pajrin, Taufikkurrahman, and Arwan Arif Rahman. We would also like to thank the Chemistry laboratory and MAREE facilities at the ZMT for the technical support during the experiment and the sample analysis.

Conflicts of Interest

The authors declare no conflict of interest.

References

  1. Short, F.; Carruthers, T.; Dennison, W.; Waycott, M. Global seagrass distribution and diversity: A bioregional model. J. Exp. Mar. Biol. Ecol. 2007, 350, 3–20. [Google Scholar] [CrossRef]
  2. Waycott, M.; Duarte, C.M.; Carruthers, T.J.B.; Orth, R.J.; Dennison, W.C.; Olyarnik, S.; Calladine, A.; Fourqurean, J.W.; Heck, K.L.; Hughes, A.R.; et al. Accelerating loss of seagrasses across the globe threatens coastal ecosystems. Proc. Natl. Acad. Sci. USA 2009, 106, 12377–12381. [Google Scholar] [CrossRef] [Green Version]
  3. De los Santos, C.B.; Krause-Jensen, D.; Alcoverro, T.; Marbà, N.; Duarte, C.M.; van Katwijk, M.M.; Pérez, M.; Romero, J.; Sánchez-Lizaso, J.L.; Roca, G.; et al. Recent trend reversal for declining European seagrass meadows. Nat. Commun. 2019, 10, 3356. [Google Scholar] [CrossRef] [Green Version]
  4. Schäfer, S.; Monteiro, J.; Castro, N.; Gizzi, F.; Henriques, F.; Ramalhosa, P.; Parente, M.I.; Rilov, G.; Gestoso, I.; Canning-Clode, J. Lost and found: A new hope for the seagrass Cymodocea nodosa in the marine ecosystem of a subtropical Atlantic island. Reg. Stud. Mar. Sci. 2021, 41, 101575. [Google Scholar] [CrossRef]
  5. Guerrero-Meseguer, L.; Veiga, P.; Sampaio, L.; Rubal, M. Resurgence of Zostera marina in the Ria de Aveiro Lagoon, Portugal. Aquat. Bot. 2021, 169, 103338. [Google Scholar] [CrossRef]
  6. Unsworth, R.K.F.; Ambo-Rappe, R.; Jones, B.L.; La Nafie, Y.A.; Irawan, A.; Hernawan, U.E.; Moore, A.M.; Cullen-Unsworth, L.C. Indonesia’s globally significant seagrass meadows are under widespread threat. Sci. Total Environ. 2018, 634, 279–286. [Google Scholar] [CrossRef] [PubMed]
  7. Lee, K.S.; Short, F.T.; Burdick, D.M. Development of a nutrient pollution indicator using the seagrass, Zostera marina, along nutrient gradients in three New England estuaries. Aquat. Bot. 2004, 78, 197–216. [Google Scholar] [CrossRef]
  8. Roca, G.; Alcoverro, T.; Krause-Jensen, D.; Balsby, T.J.S.; Van Katwijk, M.M.; Marbà, N.; Santos, R.; Arthur, R.; Mascaró, O.; Fernández-Torquemada, Y.; et al. Response of seagrass indicators to shifts in environmental stressors: A global review and management synthesis. Ecol. Indic. 2016, 63, 310–323. [Google Scholar] [CrossRef] [Green Version]
  9. Carruthers, T.J.B.; Dennison, W.C.; Longstaff, B.J.; Waycott, M.; Abal, E.G.; McKenzie, L.J.; Lee Long, W.J. Seagrass habitats of Northeast Australia: Models of key processes and controls. Bull. Mar. Sci. 2002, 71, 1153–1169. [Google Scholar]
  10. Egea, L.G.; Jiménez-Ramos, R.; Vergara, J.J.; Hernández, I.; Brun, F.G. Interactive effect of temperature, acidification and ammonium enrichment on the seagrass Cymodocea nodosa. Mar. Pollut. Bull. 2018, 134, 14–26. [Google Scholar] [CrossRef]
  11. Gunderson, A.R.; Armstrong, E.J.; Stillman, J.H. Multiple stressors in a changing world: The need for an improved perspective on physiological responses to the dynamic marine environment. Ann. Rev. Mar. Sci. 2016, 8, 357–378. [Google Scholar] [CrossRef] [PubMed]
  12. Ontoria, Y.; Gonzalez-Guedes, E.; Sanmartí, N.; Bernardeau-Esteller, J.; Ruiz, J.M.; Romero, J.; Pérez, M. Interactive effects of global warming and eutrophication on a fast-growing Mediterranean seagrass. Mar. Environ. Res. 2019, 145, 27–38. [Google Scholar] [CrossRef] [PubMed]
  13. Koch, M.; Bowes, G.; Ross, C.; Zhang, X.H. Climate change and ocean acidification effects on seagrasses and marine macroalgae. Glob. Change Biol. 2013, 19, 103–132. [Google Scholar] [CrossRef] [PubMed]
  14. Guerrero-Meseguer, L.; Marín, A.; Sanz-Lázaro, C. Future heat waves due to climate change threaten the survival of Posidonia oceanica seedlings. Environ. Pollut. 2017, 230, 40–45. [Google Scholar] [CrossRef] [PubMed]
  15. Hernán, G.; Ortega, M.J.; Gándara, A.M.; Castejón, I.; Terrados, J.; Tomas, F. Future warmer seas: Increased stress and susceptibility to grazing in seedlings of a marine habitat-forming species. Glob. Chang. Biol. 2017, 23, 4530–4543. [Google Scholar] [CrossRef]
  16. Yue, S.; Zhou, Y.; Zhang, Y.; Xu, S.; Gu, R.; Xu, S.; Zhang, X.; Zhao, P. Effects of salinity and temperature on seed germination and seedling establishment in the endangered seagrass Zostera japonica Asch. & Graebn. in Northern China. Mar. Pollut. Bull. 2019, 146, 848–856. [Google Scholar] [CrossRef]
  17. Pereda-Briones, L.; Terrados, J.; Tomas, F. Negative effects of warming on seagrass seedlings are not exacerbated by invasive algae. Mar. Pollut. Bull. 2019, 141, 36–45. [Google Scholar] [CrossRef]
  18. Artika, S.R.; Ambo-Rappe, R.; Teichberg, M.; Moreira-Saporiti, A.; Viana, I.G. Morphological and physiological responses of Enhalus acoroides seedlings under varying temperature and nutrient treatment. Front. Mar. Sci. 2020, 7, 325. [Google Scholar] [CrossRef]
  19. Niu, S.; Zhang, P.; Liu, J.; Guo, D.; Zhang, X. The effect of temperature on the survival, growth, photosynthesis, and respiration of young seedlings of eelgrass Zostera marina L. Aquaculture 2012, 350–353, 98–108. [Google Scholar] [CrossRef]
  20. Hernán, G.; Ramajo, L.; Basso, L.; Delgado, A.; Terrados, J.; Duarte, C.M.; Tomas, F. Seagrass (Posidonia oceanica) seedlings in a high-CO2 world: From physiology to herbivory. Sci. Rep. 2016, 6, 38017. [Google Scholar] [CrossRef] [Green Version]
  21. Hoegh-Guldberg, O.; Mumby, P.J.; Hooten, A.J.; Steneck, R.S.; Greenfield, P.; Gomez, E.; Harvell, C.D.; Sale, P.F.; Edwards, A.J.; Caldeira, K.; et al. Coral reefs under rapid climate change and ocean acidification. Science 2007, 318, 1737–1742. [Google Scholar] [CrossRef] [Green Version]
  22. Collier, C.J.; Langlois, L.; Ow, Y.; Johansson, C.; Giammusso, M.; Adams, M.P.; O’Brien, K.R.; Uthicke, S. Losing a winner: Thermal stress and local pressures outweigh the positive effects of ocean acidification for tropical seagrasses. New Phytol. 2018, 219, 1005–1017. [Google Scholar] [CrossRef] [Green Version]
  23. Jiménez-Ramos, R.; Egea, L.G.; Ortega, M.J.; Hernández, I.; Vergara, J.J.; Brun, F.G. Global and local disturbances interact to modify seagrass palatability. PLoS ONE 2017, 12, e0183256. [Google Scholar] [CrossRef] [Green Version]
  24. Zimmerman, R.C.; Hill, V.J.; Jinuntuya, M.; Celebi, B.; Ruble, D.; Smith, M.; Cedeno, T.; Swingle, W.M. Experimental impacts of climate warming and ocean carbonation on eelgrass Zostera marina. Mar. Ecol. Prog. Ser. 2017, 566, 1–15. [Google Scholar] [CrossRef] [Green Version]
  25. Perry, D.; Staveley, T.; Deyanova, D.; Baden, S.; Dupont, S.; Hernroth, B.; Wood, H.; Björk, M.; Gullström, M. Global environmental changes negatively impact temperate seagrass ecosystems. Ecosphere 2019, 10, e02986. [Google Scholar] [CrossRef]
  26. Duarte, C.M. Allometric scaling of seagrass form and productivity. Mar. Ecol. Prog. Ser. 1991, 77, 289–300. [Google Scholar] [CrossRef]
  27. Rattanachot, E.; Prathep, A. Temporal variation in growth and reproduction of Enhalus acoroides (L.f.) Royle in a monospecific meadow in Haad Chao Mai National Park, Trang Province, Thailand. Bot. Mar. 2011, 54, 201–207. [Google Scholar] [CrossRef]
  28. Duarte, C.M.; Terrados, J.; Agawin, N.S.R.; Fortes, M.D.; Bach, S.; Kenworthy, W.J. Response of a mixed Philippine seagrass meadow to experimental burial. Mar. Ecol. Prog. Ser. 1997, 147, 285–294. [Google Scholar] [CrossRef] [Green Version]
  29. Rollon, R.N. Spatial variation and seasonality in growth and reproduction of Enhalus acoroides (L.f.) Royle populations in the coastal waters off Cape Bolinao, NW Philippines. Ph.D. Thesis, Wageningen Agricultural University, Wageningen, The Netherlands, 1998. [Google Scholar]
  30. Pedersen, O.; Colmer, T.D.; Borum, J.; Zavala-Perez, A.; Kendrick, G.A. Heat stress of two tropical seagrass species during low tides—Impact on underwater net photosynthesis, dark respiration and diel in situ internal aeration. New Phytol. 2016, 210, 1207–1218. [Google Scholar] [CrossRef] [Green Version]
  31. Björk, M.; Weil, A.; Beer, S.; Semesi, S. Photosynthetic utilisation of inorganic carbon by seagrasses from Zanzibar, East Africa. Mar. Biol. 1997, 129, 363–366. [Google Scholar] [CrossRef]
  32. Duarte, C.M. Seagrass depth limits. Aquat. Bot. 1991, 40, 363–377. [Google Scholar] [CrossRef]
  33. Schupp, E.W. Seed-seedling conflicts, habitat choice, and patterns of plant recruitment. Am. J. Bot. 1995, 82, 399–409. [Google Scholar] [CrossRef]
  34. Agawin, N.S.R.; Duarte, C.M.; Fortes, M.D. Nutrient limitation of Philippine seagrasses (Cape Bolinao, NW Philippines): In situ experimental evidence. Mar. Ecol. Prog. Ser. 1996, 138, 233–243. [Google Scholar] [CrossRef] [Green Version]
  35. Agawin, N.S.R.; Duarte, C.M.; Fortes, M.D.; Uri, J.S.; Vermaat, J.E. Temporal changes in the abundance, leaf growth and photosynthesis of three co-occurring Philippine seagrasses. J. Exp. Mar. Biol. Ecol. 2001, 260, 217–239. [Google Scholar] [CrossRef]
  36. Kongrueang, P.; Buapet, P.; Roongsattham, P. Physiological responses of Enhalus acoroides to osmotic stress. Bot. Mar. 2018, 61, 257–267. [Google Scholar] [CrossRef]
  37. McMillan, C. The distribution of tropical seagrasses with relation to their tolerance of high temperatures. Aquat. Bot. 1984, 19, 369–379. [Google Scholar] [CrossRef]
  38. Nakase, K.; Murakami, T.; Kohno, H.; Ukai, A.; Mizutani, A.; Shimokawa, S. Distribution of Enhalus acoroides according to waves and currents. In Geophysical Approach to Marine Coastal Ecology; Shimokawa, S., Murakami, T., Kohno, H., Eds.; Springer Oceanography, Springer: Singapore, 2020; pp. 197–215. [Google Scholar] [CrossRef]
  39. Terrados, J.; Agawin, N.S.R.; Duarte, C.M.; Fortes, M.D.; Kamp-Nielsen, L.; Borum, J. Nutrient limitation of the tropical seagrass Enhalus acoroides (L.) Royle in Cape Bolinao, NW Philippines. Aquat. Bot. 1999, 65, 123–139. [Google Scholar] [CrossRef]
  40. Teichberg, M.; Wild, C.; Bednarz, V.N.; Kegler, H.F.; Lukman, M.; Gärdes, A.A.; Heiden, J.P.; Weiand, L.; Abu, N.; Nasir, A.; et al. Spatio-temporal patterns in coral reef communities of the Spermonde archipelago, 2012–2014, I: Comprehensive reef monitoring of water and benthic indicators reflect changes in reef health. Front. Mar. Sci. 2018, 5, 33. [Google Scholar] [CrossRef] [Green Version]
  41. Erftemeijer, P.L.A.; Stapel, J. Primary production of deep-water Halophila ovalis meadows. Aquat. Bot. 1999, 65, 71–82. [Google Scholar] [CrossRef]
  42. Grasshoff, K.; Kremling, K.; Ehrhardt, M. Methods of Seawater Analysis; Verlag Chemie: Weinheim, Germany, 1999. [Google Scholar] [CrossRef]
  43. Dickson, A.G.; Sabine, C.L.; Christian, J.R. Guide to Best Practices for Ocean. CO2 Measurements; PICES Special Publication: Sidney, BC, Canada, 2007. [Google Scholar] [CrossRef]
  44. Pelletier, G.; Lewis, E.; Wallace, D. Xls: A Calculator for the CO2 System in Seawater for Microsoft Excel/VBA; Washington State Department of Ecology: Olympia, WA, USA; Brookhaven National Laboratory: Upton, NY, USA, 2005. [Google Scholar]
  45. Huber, S.C.; Israel, D.W. Biochemical basis for partitioning of photosynthetically fixed carbon between starch and sucrose in soybean (Glycine max Merr.) leaves. Plant. Physiol. 1982, 69, 691–696. [Google Scholar] [CrossRef] [Green Version]
  46. Yemm, E.W.; Willis, A.J. The estimation of carbohydrates in plant extracts by anthrone. Biochem. J. 1954, 57, 508–514. [Google Scholar] [CrossRef] [PubMed] [Green Version]
  47. Short, F.T.; Duarte, C.M. Methods for the measurement of seagrass growth and production. In Global Seagrass Research Methods; Short, F.T., Coles, R.G., Eds.; Elsevier, B.V.: Amsterdam, The Netherlands, 2001; pp. 141–153. [Google Scholar] [CrossRef]
  48. Winters, G.; Nelle, P.; Fricke, B.; Rauch, G.; Reusch, T.B.H. Effects of a simulated heat wave on photophysiology and gene expression of high- and low-latitude populations of Zostera marina. Mar. Ecol. Prog. Ser. 2011, 435, 83–95. [Google Scholar] [CrossRef] [Green Version]
  49. Silsbe, G.M.; Malkin, S.Y. Phytotools: Phytoplankton Production Tools. R Package Version 1.0. 2015. Available online: https://cran.r-project.org/package=phytotools (accessed on 30 March 2020).
  50. R Core Team. R: A Language and Environment for Statistical Computing; R Foundation for Statistical Computing: Vienna, Austria, 2019. [Google Scholar]
  51. Jassby, A.D.; Platt, T. Mathematical formulation of the relationship between photosynthesis and light for phytoplankton. Limnol. Oceanogr. 1976, 21, 540–547. [Google Scholar] [CrossRef] [Green Version]
  52. Genty, B.; Briantais, J.M.; Baker, N.R. The relationship between the quantum yield of photosynthetic electron transport and quenching of chlorophyll fluorescence. Biochim. Biophys. Acta Gen. Subj. 1989, 990, 87–92. [Google Scholar] [CrossRef]
  53. Sakshaug, E.; Bricaud, A.; Dandonneau, Y.; Falkowski, P.G.; Kiefer, D.A.; Legendre, L.; Morel, A.; Parslow, J.; Takahashi, M. Parameters of photosynthesis: Definitions, theory and interpretation of results. J. Plankton Res. 1997, 19, 1637–1670. [Google Scholar] [CrossRef] [Green Version]
  54. Invers, O.; Tomàs, F.; Pérez, M.; Romero, J. Potential effect of increased global CO2 availability on the depth distribution of the seagrass Posidonia oceanica (L.) Delile: A tentative assessment using a carbon balance model. Bull. Mar. Sci. 2002, 71, 1191–1198. [Google Scholar]
  55. Stapel, J.; Hemminga, M.A. Nutrient resorption from seagrass leaves. Mar. Biol. 1997, 128, 197–206. [Google Scholar] [CrossRef]
  56. Celdrán, D.; Marín, A. Seed photosynthesis enhances Posidonia oceanica seedling growth seed collection. Ecosphere 2013, 4, 149. [Google Scholar] [CrossRef]
  57. Kaldy, J.E.; Dunton, K.H. Ontogenetic photosynthetic changes, dispersal and survival of Thalassia testudinum (Turtle Grass) seedlings in a sub-tropical lagoon. J. Exp. Mar. Biol. Ecol. 1999, 240, 193–212. [Google Scholar] [CrossRef]
  58. Nielsen, S.L.; Pedersen, M.F. Growth, photosynthesis and nutrient content of seedlings and mature plants of Cymodocea nodosa—The importance of clonal integration. Aquat. Bot. 2000, 68, 265–271. [Google Scholar] [CrossRef]
  59. Statton, J.; Kendrick, G.A.; Dixon, K.W.; Cambridge, M.L. Inorganic nutrient supplements constrain restoration potential of seedlings of the seagrass, Posidonia australis. Restor. Ecol. 2014, 22, 196–203. [Google Scholar] [CrossRef]
  60. Alexandre, A.; Silva, J.; Buapet, P.; Björk, M.; Santos, R. Effects of CO2 enrichment on photosynthesis, growth, and nitrogen metabolism of the seagrass Zostera noltii. Ecol. Evol. 2012, 2, 2625–2635. [Google Scholar] [CrossRef] [PubMed]
  61. Ow, Y.X.; Collier, C.J.; Uthicke, S. Responses of three tropical seagrass species to CO2 enrichment. Mar. Biol. 2015, 162, 1005–1017. [Google Scholar] [CrossRef]
  62. Ow, Y.X.; Uthicke, S.; Collier, C.J. Light levels affect carbon utilisation in tropical seagrass under ocean acidification. PLoS ONE 2016, 11, e0150352. [Google Scholar] [CrossRef] [PubMed]
  63. Borum, J.; Pedersen, O.; Kotula, L.; Fraser, M.W.; Statton, J.; Colmer, T.D.; Kendrick, G.A. Photosynthetic response to globally increasing CO2 of co-occurring temperate seagrass species. Plant. Cell Environ. 2016, 39, 1240–1250. [Google Scholar] [CrossRef] [Green Version]
  64. Jiang, Z.J.; Huang, X.P.; Zhang, J.P. Effects of CO2 enrichment on photosynthesis, growth, and biochemical composition of seagrass Thalassia hemprichii (Ehrenb.) Aschers. J. Integr. Plant. Biol. 2010, 52, 904–913. [Google Scholar] [CrossRef]
  65. Thom, R.M. CO2-enrichment effects on eelgrass (Zostera marina L.) and bull kelp (Nereocystis luetkeana (Mert.) P. & R.). Water. Air. Soil Pollut. 1996, 88, 383–391. [Google Scholar] [CrossRef]
  66. Ralph, P.J.; Durako, M.J.; Enríquez, S.; Collier, C.J.; Doblin, M.A. Impact of light limitation on seagrasses. J. Exp. Mar. Biol. Ecol. 2007, 350, 176–193. [Google Scholar] [CrossRef]
  67. Zimmerman, R.C.; Kohrs, D.G.; Steller, D.L.; Alberte, R.S. Impacts of CO2 enrichment on productivity and light requirements of eelgrass. Plant. Physiol. 1997, 115, 599–607. [Google Scholar] [CrossRef] [Green Version]
  68. Ooi, J.L.S.; Kendrick, G.A.; Van Niel, K.P.; Affendi, Y.A. Knowledge gaps in tropical southeast Asian seagrass systems. Estuar. Coast. Shelf Sci. 2011, 92, 118–131. [Google Scholar] [CrossRef]
  69. Fortes, M.D.; Ooi, J.L.S.; Tan, Y.M.; Prathep, A.; Bujang, J.S.; Yaakub, S.M. Seagrass in Southeast Asia: A review of status and knowledge gaps, and a road map for conservation. Bot. Mar. 2018, 61, 269–288. [Google Scholar] [CrossRef]
  70. Stitt, M.; Krapp, A. The interaction between elevated carbon dioxide and nitrogen nutrition: The physiological and molecular background. Plant. Cell Environ. 1999, 22, 583–621. [Google Scholar] [CrossRef]
  71. Zayas-Santiago, C.C.; Rivas-Ubach, A.; Kuo, L.J.; Ward, N.D.; Zimmerman, R.C. Metabolic profiling reveals biochemical pathways responsible for eelgrass response to elevated CO2 and temperature. Sci. Rep. 2020, 10, 4693. [Google Scholar] [CrossRef] [PubMed] [Green Version]
  72. Guerrero-Meseguer, L.; Cox, T.E.; Sanz-Lázaro, C.; Schmid, S.; Enzor, L.A.; Major, K.; Gazeau, F.; Cebrian, J. Does ocean acidification benefit seagrasses in a mesohaline environment? A mesocosm experiment in the northern gulf of Mexico. Estuaries Coasts 2020, 43, 1377–1393. [Google Scholar] [CrossRef]
  73. Repolho, T.; Duarte, B.; Dionísio, G.; Paula, J.R.; Lopes, A.R.; Rosa, I.C.; Grilo, T.F.; Caçador, I.; Calado, R.; Rosa, R. Seagrass ecophysiological performance under ocean warming and acidification. Sci. Rep. 2017, 7, 41443. [Google Scholar] [CrossRef]
  74. Harvey, B.P.; Gwynn-Jones, D.; Moore, P.J. Meta-analysis reveals complex marine biological responses to the interactive effects of ocean acidification and warming. Ecol. Evol. 2013, 3, 1016–1030. [Google Scholar] [CrossRef]
  75. Leoni, V.; Vela, A.; Pasqualini, V.; Pergent-Martini, C.; Pergent, G. Effects of experimental reduction of light and nutrient enrichments (N and P) on seagrasses: A review. Aquat. Conserv. Mar. Freshw. Ecosyst. 2008, 18, 202–220. [Google Scholar] [CrossRef]
Figure 1. Experimental setup in this study. Experimental tanks (ETs) were used as a water bath (white box) set at either regimes of 27 or 31 °C. Twenty-four small clear glass aquariums (striped box) were placed inside the water baths under the selected temperatures and were independently supplied with seawater either enriched with CO2 or at ambient CO2 using a flow-through system attached to a peristaltic pump (black oval). Water was pre-conditioned with CO2 from water reservoirs (striped or dotted circles) of the desired CO2 concentrations. In addition, CO2 bubbling was also added directly in the small aquariums to help maintain CO2 treatments within the ETs.
Applsci 11 02730 g001
Figure 2. The effect of increasing temperature and CO2 enrichment on (a) leaf number, (b) maximum leaf length, (c) leaf surface area, (d) leaf weight, and (e) leaf width of Enhalus acoroides seedlings at the end of the experimental period. Values are mean ± SE (n = 6).
Applsci 11 02730 g002
Figure 3. The effect of increasing temperature and CO2 enrichment on the leaf surface area’s growth rate of Enhalus acoroides seedlings at the end of the experimental period. Values are mean ± SE (n = 6).
Applsci 11 02730 g003
Figure 4. Rapid light curves. Relative electron transport rates (rETR) of 13 measurements at increasing photosynthetic active radiation (PAR) measured on leaves of seedlings under the four experimental treatments at the end of the experimental period. Values are mean ± SE (n = 6).
Applsci 11 02730 g004
Figure 5. The effect of increasing temperature and CO2 enrichment on carbon (% DW) (left column) and nitrogen (% DW) (right column) content on leaves (a,b), seeds (c,d), and roots (e,f) in seedlings of Enhalus acoroides at the end of the experimental period. Values are mean ± SE (n = 6).
Applsci 11 02730 g005
Figure 6. The effect of increasing temperature and CO2 enrichment on sucrose (left column) and starch (right column) content (sucrose equivalents g−1 DW) on leaves (a,b) and seeds (c,d) in seedlings of Enhalus acoroides at the end of the experimental period. Values are mean ± SE (n = 3 for leaves and n = 6 for seeds).
Applsci 11 02730 g006
Table 1. Measured and calculated (*) experimental water quality parameters in the aquaria. Values are given as mean ± SE (n: number of water samples taken).
Treatments
n27 °C-Ambient CO227 °C-Enriched CO231 °C-Ambient CO231 °C-Enriched CO2
Temperature (°C)6627.74 (±0.08)27.29 (±0.21)30.66 (±0.12)30.65 (±0.13)
Salinity6634.43 (±0.25)34.42 (±0.46)35.07 (±0.31)34.25 (±0.5)
Conductivity (µS cm−1)6061.35 (±0.25)61.83 (±0.34)62.01 (±0.73)60.91 (±0.6)
pH668.23 (±0.02)8.18 (±0.01)8.2 (±0.01)8.09 (±0.02)
Dissolved oxygen (mg L−1)486.92 (±0.06)7.08 (±0.06)6.52 (±0.03)6.54 (±0.03)
Alkalinity (µmol kg−1 SW)302369.67 (±8.2)2394.24 (±7.54)2374.08 (±14.71)2414.35 (±21.44)
pCO2 (µatm) *21379.42 (±39.63)464.04 (±28.49)379.75 (±25.31)624.47 (±42.41)
PO4 (µmol kg−1 SW)210.07 (±0.01)0.07 (±0.01)0.06 (±0.01)0.07 (±0)
Si (µmol kg−1 SW)210.58 (±0.01)0.58 (±0.01)0.58 (±0.01)0.57 (±0.01)
Table 2. Results of analysis of variance (two-way ANOVA test) of the effects of temperature and CO2 and their interaction on the morphological leaf traits (Figure 2) and growth rate (Figure 3). p-Values in bold are statistically significant (<0.05) (TSS: Total sum of squares, SA: Surface area).
Dependent VariablesFactorTSSF-Valuep-Value
Leaf numberTemperature0.3751.8000.195
CO20.3751.8000.195
Interaction1.0425.0000.037
Maximum leaf lengthTemperature46.48215.3810.001
CO211.4823.7990.065
Interaction0.1350.0450.835
Leaf SATemperature2.05914.4290.001
CO20.0750.5280.476
Interaction0.0090.0650.802
Leaf weightTemperature0.0585.5420.029
CO20.0000.0070.934
Interaction0.0161.4860.237
Leaf widthTemperature0.0011.4940.236
CO20.0000.4770.498
Interaction0.0000.0170.898
Leaf SA growth rateTemperature0.00210.4130.004
CO20.0000.0020.961
Interaction0.0000.2920.595
Table 3. Parameters (mean ± SE, n = 6) derived from rapid light curves (Figure 4) (Temp: Temperature, °C).
Treatments
TempAmbient CO2Enriched CO2
Fv/Fm270.75 (±0.01)0.76 (±0.01)
310.74 (±0.01)0.75 (±0.005)
rETRmax2724.30 (±4.99)32.85 (±3.08)
3119.04 (±3.07)15.05 (±3.24)
Alpha (α)270.69 (±0.02)0.69 (±0.02)
310.70 (±0.01)0.69 (±0.03)
Ek2712.77 (±2.41)14.28 (±2.63)
318.56 (±1.70)5.88 (±1.20)
Table 4. Results of analysis of variance (two-way ANOVA test) of the effects of temperature and CO2 and their interaction on the rapid light curve fit parameters (Table 3). p-Values in bold are statistically significant (<0.05) (TSS: Total sum of squares).
Dependent VariableFactorTSSF-Valuep-Value
Fv/FmTemperature0.0000.8310.373
CO20.0001.0620.315
Interaction0.0000.0390.845
rETRmaxTemperature797.63411.7310.003
CO231.1430.4580.506
Interaction235.4953.4630.078
Alpha (α)Temperature0.0010.2180.646
CO20.0000.0740.788
Interaction0.0000.1230.730
EkTemperature238.28511.1740.003
CO22.0420.0960.760
Interaction26.2861.2330.280
Table 5. Results of analysis of variance (two-way ANOVA test) on the effects of temperature and CO2 on the carbon and nitrogen content of the leaf, seed, and root tissue (Figure 5). p-Values in bold are statistically significant (<0.05) (TSS: Total sum of squares).
Dependent VariableFactorTSSF-Valuep-Value
Leaves
Carbon contentTemperature21.04514.6380.001
CO21.1680.8120.379
Interaction0.3900.2710.609
Nitrogen contentTemperature0.50724.300<0.001
CO20.0281.3330.263
Interaction0.0060.2760.605
Seeds
Carbon contentTemperature8.3390.2480.624
CO22.9160.0870.771
Interaction82.4702.4540.133
Nitrogen contentTemperature0.0100.2150.648
CO20.0260.5770.456
Interaction0.0190.4160.526
Roots
Carbon contentTemperature3.1920.3790.545
CO20.0090.0010.974
Interaction37.2334.4250.049
Nitrogen contentTemperature0.0161.0270.324
CO20.0231.4360.245
Interaction0.0161.0310.323
Table 6. Results of analysis of variance (two-way ANOVA test) of the effects of temperature and CO2 on the sucrose and starch content of the leaves and seeds (Figure 6). p-Values in bold are statistically significant (<0.05) (TSS: Total sum of squares).
Dependent VariableFactorTSSF-Valuep-Value
Leaves
SucroseTemperature0.0000.0510.87
CO20.0002.0300.197
Interaction0.0000.1700.692
StarchTemperature0.0362.3630.168
CO20.0271.7850.224
Interaction0.0694.5580.069
Seeds
SucroseTemperature0.0127.4640.013
CO20.0021.4700.239
Interaction0.0000.0170.897
StarchTemperature0.0881.7810.197
CO20.0310.6330.436
Interaction0.0130.2700.609
Publisher’s Note: MDPI stays neutral with regard to jurisdictional claims in published maps and institutional affiliations.

