Article

Torrefaction Characteristics of Blended Ratio of Sewage Sludge and Sugarcane Bagasse for Energy Production

1
Department of Physics, University of Fort Hare, P/Bag X1314, Alice 5700, South Africa
2
SAMRC Microbial Water Quality Monitoring Center, University of Fort Hare, P/Bag X1314, Alice 5700, South Africa
3
Department of Chemistry, University of Fort Hare, P/Bag X1314, Alice 5700, South Africa
4
Applied and Environmental Microbiology Research Group (AEMREG), Department of Biochemistry and Microbiology, University of Fort Hare, Alice 5700, South Africa
*
Author to whom correspondence should be addressed.
Appl. Sci. 2021, 11(6), 2654; https://doi.org/10.3390/app11062654
Submission received: 14 November 2020 / Revised: 8 December 2020 / Accepted: 14 December 2020 / Published: 16 March 2021
(This article belongs to the Section Energy Science and Technology)

Abstract

:
Torrefaction is a thermal pretreatment technique usually adopted for improving biomass properties to be on par with that of coal for energy production. In this study, the torrefaction characteristics of blended fuel of sewage sludge (SS) and sugarcane bagasse (BG) biomass were investigated for the purpose of gasification. The thermal degradation behavior of the blended biomass sample was tested in an inert atmosphere from ambient temperature to 900 °C using thermogravimetric analysis (TGA). The obtained TGA data aided in the determination of thermochemical parameters that are of necessity in gasification. Morphological changes in the blended torrefied samples were examined through scanning electron microscopy. Further changes in the chemical structure of the samples were investigated through Fourier-transform infrared analysis. The blend ratio of 75% SS + 25% BG torrefied at 350 °C gave the highest energy value (HHV) of 23.62 MJ/kg, fixed carbon of 51.37 wt % and fuel ratio of 1.70. The obtained fuel ratio is comparable to that required for optimum combustion performance of coal. The morphological structure of the samples showed that there was an aggregation of the biomass particles into small lumps at higher torrefaction temperature for 50% SS + 50% BG and 75% SS + 25% BG blend indicating a better grind ability of the biomass material. Thus, it can be concluded that the blend and torrefaction enhanced the properties of the biomass materials.

1. Introduction

Biomass is a renewable energy resource that can either serve as an alternative or supplement to non-renewable energy sources such as coal for energy generation. It is classified as any organic matter derived from either plants or animals. A typical example includes wood, agricultural residue, energy crops, industrial waste and municipal waste. Municipal waste such as sewage sludge (SS) is classified as important biomass due to its composition of organic compounds of high calorific value. Sewage sludge is a byproduct of municipal wastewater treatment plants that are produced in large quantities worldwide. Its disposal through landfilling and landscaping poses a severe environmental challenge. Incineration on its own is very expensive, hence making these disposal techniques unsustainable. However, the use of SS as a solid fuel after the application of some pretreatment measures can be a sustainable management technique. Plant biomass such as sugarcane consists of three major polymer components, which include hemicellulose, cellulose and lignin. These components, usually termed lignocellulose is the fibrous part of the plant that is not consumed by humans. Hence, making such plant biomass a good feedstock for energy production, as its use does not impact the food chain [1,2,3].
Biomass in its natural state has low energy density, high moisture content, low heating value, low combustion efficiency, and high volatiles compared to coal [1]. Nevertheless, these variations in biomass properties can be enhanced through torrefaction prior to its utilization for the production of heat and power. Torrefaction is a biomass pretreatment technique referred to in the literature as slow or mild pyrolysis carried out in an inert atmosphere and within a temperature span of 200–300 °C [4,5]. Upon torrefaction, biomass fibrous structure is destroyed, and its moisture and oxygen content are removed through dehydration and carboxylation reaction. Thus, doubling the energy density, calorific value and increasing carbon percentage [6]. Previous studies have reported significant improvement in biomass fuel characteristics through torrefaction. For example, Phanphanich and Mani [7] reported a reduction in the moisture content of pine chip and yellow pine from 6.69% and 7.94% to 3.30% and 3.11% after 30 min torrefaction at 225 °C. Equally, in Yue et al. [6] study, the energy sorghum moisture content of 7.83% and sweet sorghum moisture content of 9.29% were both reduced to 2.05% and 5.51%, respectively, after torrefaction at a temperature of 250 °C and residence time of 30 min. In Granados et al. [8] study, the analysis of torrefied sugarcane bagasse showed an increase in the higher heating value of about 30% and enrichment in carbon content, which was followed by a decline in the functionalities of oxygen and hydrogen in the produced char. Similarly, Anukam et al. [9] study showed an increase in calorific value of sugarcane bagasse from 17.90 MJ/kg to 20.29 MJ/kg after torrefaction of which translated in an increase in gasification conversion efficiency of about 10% when compared to raw sugarcane bagasse.
Atienza-Martínez et al. [10] studied the influence of temperature on torrefied sewage sludge and observed a rise in carbon/hydrogen ratio as torrefaction temperature increased. The study further suggested that decarboxylation reactions are bound to occur more at a longer residence time. Poudel et al. [11] study was focused on the enhancement of sewage sludge fuel properties through torrefaction. Their findings revealed that the mass and energy yield of the solid products were influenced by torrefaction temperature as well as residence time. In a recent study, torrefaction was employed as a valorization technique in improving the fuel properties of sewage sludge prior to gasification. The study found that torrefaction had a positive influence on syngas quality and caused a decrease in heavy tars with a melting point between 40 °C and 95 °C. However, the study recorded a decrease in higher heating value with an increase in temperature differing from what is obtainable in literature [12].
Although a number of studies focusing on torrefaction of biomass such as sugarcane bagasse, wood, rice husk, wheat straw, rice straw, coffee residue, eucalyptus, sawdust, chestnut coppice, reed canary grass, bamboo, water hyacinth, sewage sludge, microalgae and palm kernel shell have been carried out in recent years [7,8,13,14,15,16,17,18,19,20,21]. However, a literature survey revealed that no previous studies have focused on torrefaction of blended ratio of lignocellulose biomass (sugarcane bagasse) and non-lignocellulose biomass (sewage sludge) to enhance its fuel properties and thermal degradation characteristics as well as making it a suitable solid fuel for energy production. Therefore, this study will fill the knowledge gap by investigating the physicochemical properties of co-torrefied sewage sludge and sugarcane bagasse at various torrefaction temperatures to ascertain the improvement in its fuel properties.

2. Materials and Methods

2.1. Solid Fuel Preparation

Raw sewage sludge samples used in the present study were obtained from the Alice Wastewater Treatment Plant in Eastern Cape Province of South Africa. The moisture content of the sewage sludge as received was approximately 80 wt %. To eliminate this moisture, the raw sewage sludge was air-dried at ambient temperature for several weeks before being subjected to oven drying at a temperature of 105 °C as obtained from Poudel et al. [11] study. Sugarcane bagasse was received in a dried state and was ground to a particle size of 3 mm in preparation for torrefaction analysis. The samples were blended by mixing sewage sludge and sugarcane bagasse in the ratios of 50:50 and 75:25. The two-blended ratio was chosen based on the ratio that was utilized in a study that evaluated the co-torrefaction of sewage sludge and Leucaena by using microwave heating [22].

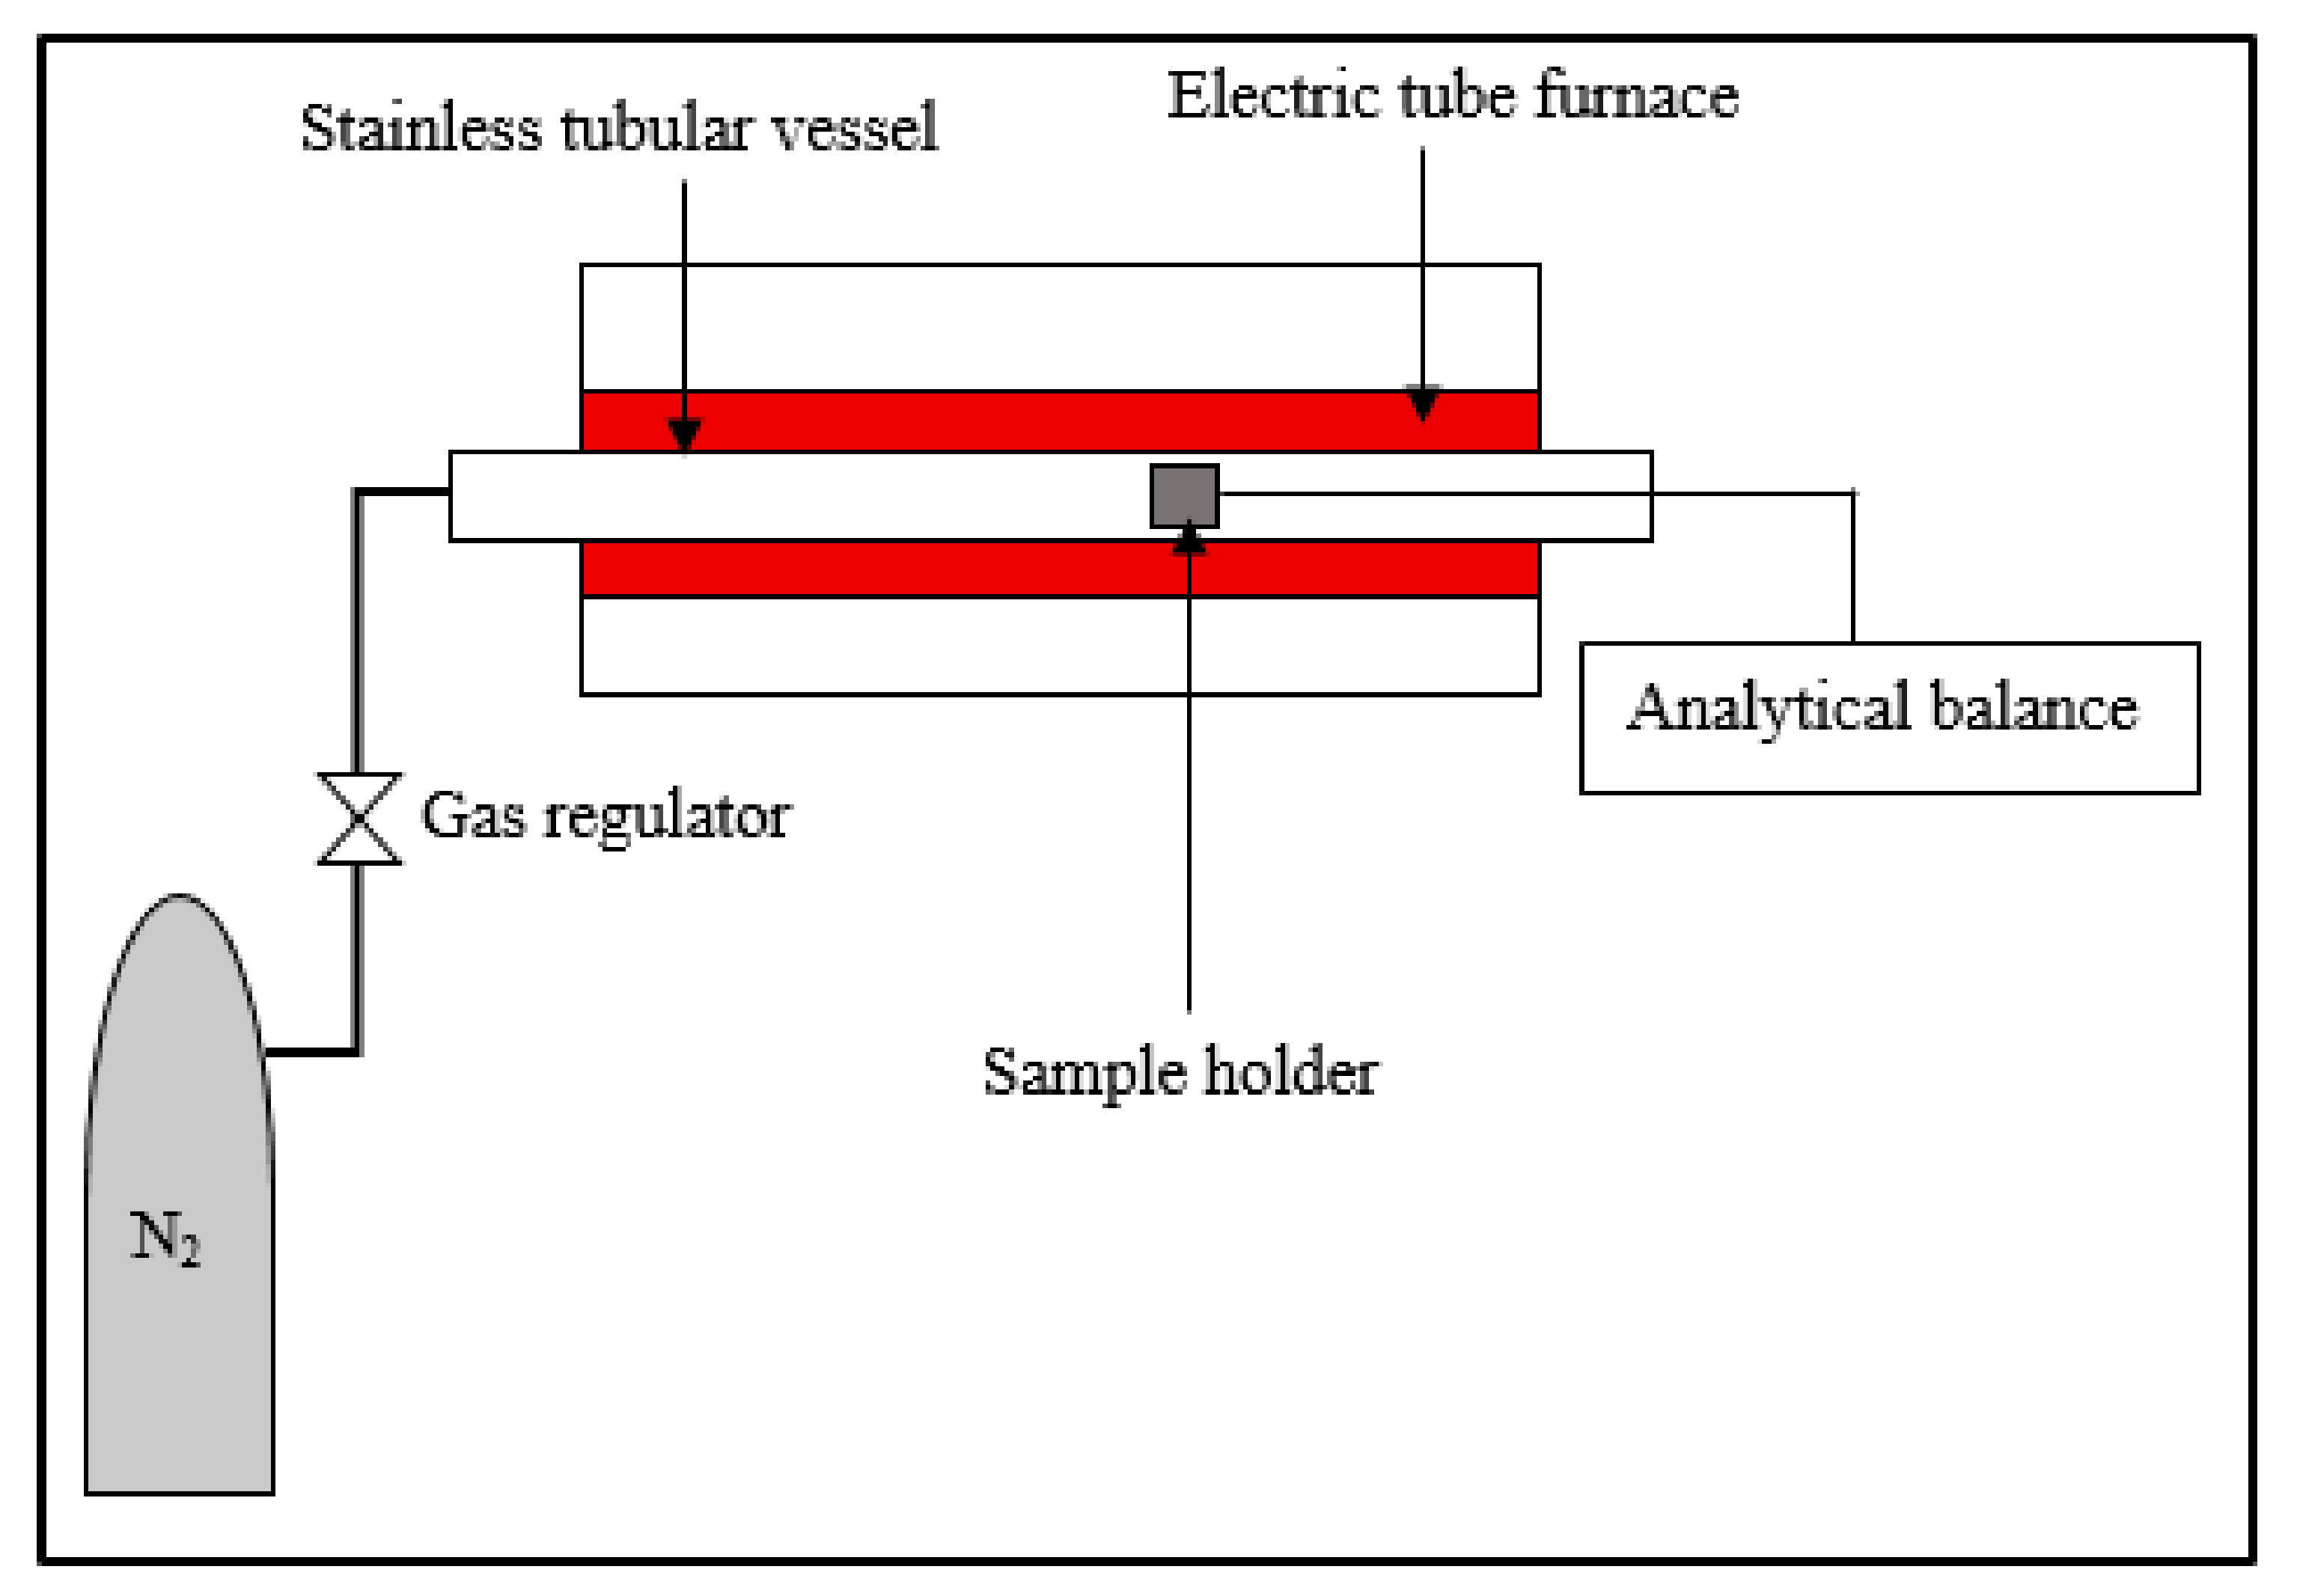
2.2. Torrefaction Process

In general, torrefaction converts biomass material into a coal-like solid product with improved fuel characteristics compared to the original form. Torrefaction experiments in the present study were conducted in an electric muffle furnace with 0.42 m diameter, 0.49 m length and 0.66 m height. The furnace consisted of a stainless steel tubular vessel that could fit the sample holder, a combustion chamber and a gas condensing section, as shown schematically in Figure 1.
The dried, blended samples of sewage sludge and sugarcane bagasse were ground to maintain a homogeneous experimental condition. A prescribed quantity of the samples weighing 20 g each were placed in the sample holder and mounted in the tubular vessel. An inert environment was created by flushing with nitrogen (N2) purge gas at a 2 L/min flow rate. The furnace was preheated (at a constant heating rate of 20 °C/min) to a set temperature prior to placing the tubular vessel containing the sample inside the furnace for the torrefaction process. At the attainment of the desired torrefaction temperature (200 °C, 250 °C, 300 °C and 350 °C) and residence time (50 min), the experiment was halted, and samples were withdrawn for further analysis. The residence time of 50 min used is within the range applicable to the torrefaction process [2,11,23].

2.3. Thermogravimetric Analysis (TGA)

TGA of sewage sludge and sugarcane bagasse samples were carried out in a PerkinElmer TGA 7 Instrument (Norwalk, CT, USA). This analysis helped in evaluating the thermal degradation behavior of the biomass samples as well as the proximate analysis parameters such as volatile matter, ash content, moisture content and fixed carbon of the analyzed biomass samples. The proximate analysis parameters were obtained from the TGA plots by adopting a modified version of the ASTM D 5142-04 standard test method [9,24]. Torrefied samples weighing approximately 2.5 mg were heated at a constant heating rate of 25 °C/min over a temperature range of 30 °C to 900 °C. The samples’ weight loss as a function of temperature and time were measured and recorded.

2.4. Scanning Electron Microscope (SEM)

The structural transformation of the sewage sludge and sugar cane bagasse samples were investigated through morphological characterization by the use of JSM-6390LV SEM and EDS. The samples were coated with gold to enhance visibility as the beam of electrons from JSM-6390LV SEM passes through the surface of the sample. The samples then emit secondary electrons that are collected in the microscope detector and reconfigured at various magnifications.

2.5. Fourier-Transform Infrared Spectroscopy (FTIR) Analysis

FTIR analysis was employed in the detection and identification of the molecular structure of the blended biomass samples. Infrared (IR) spectra of the blended sewage sludge and sugarcane bagasse biomass were obtained with an ATR PerkinElmer 2000 FTIR system. During the analysis, the spectra were captured in the mid-IR range of 4000 to 500 cm−1 and scanning resolution of 4 cm−1. Prior to the acquisition of each spectrum, some background scanning and corrections were undertaken.

3. Results

Torrefaction involving the thermal pretreatment of biomass materials in an inert condition and at atmospheric pressure was studied as well as its characterization. In general, biomass torrefaction yields three basic products, namely: solid product, condensable liquid product and permanent gases.

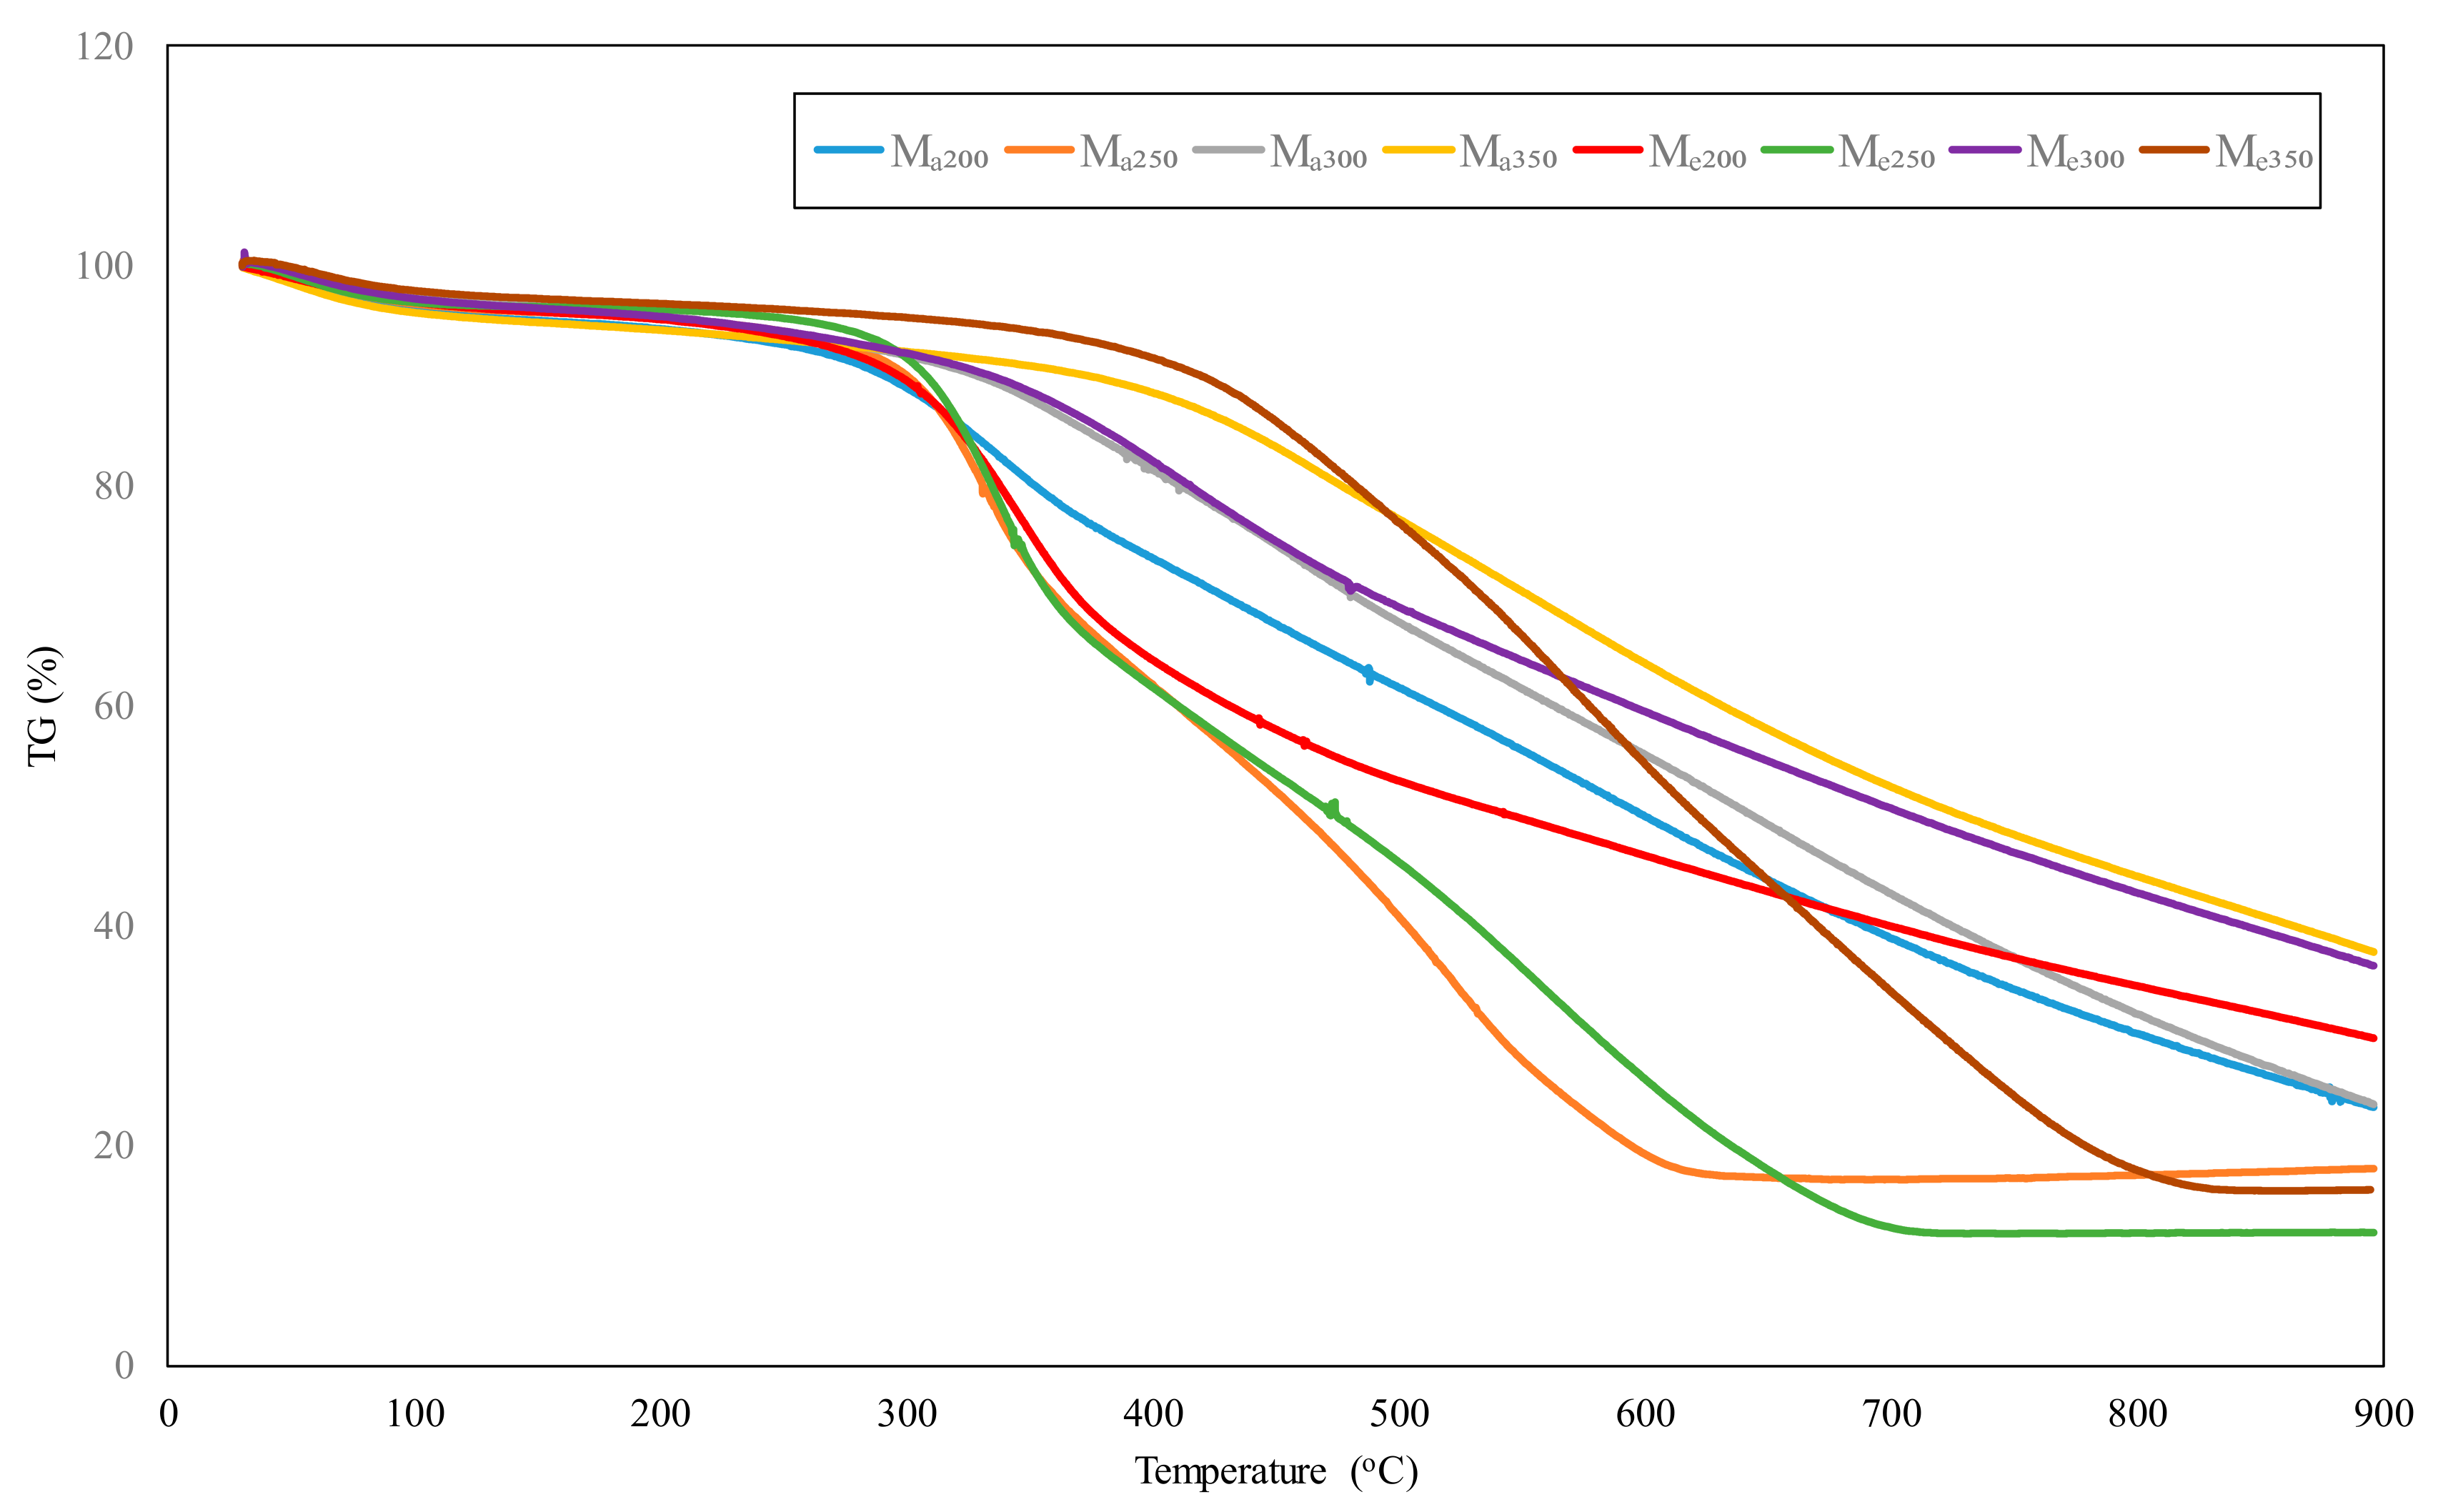
3.1. Thermogravimetric Analysis

Thermogravimetric analysis (TGA) was employed as a useful tool in studying the thermal degradation behavior of torrefied sewage sludge and sugarcane bagasse samples. Figure 2 presents the TGA plots of torrefied SS and BG blended at two different ratios of 50% SST to 50% BGT (Ma200, Ma250, Ma300 and Ma350) and 75% SST to 25% BGT (Me200, Me250, Me300, Me350). Note that the subscript 200–350 represents the torrefaction temperature for the samples.
Figure 2 demonstrates the percentage weight loss of the samples as a function of temperature ranging from ambient to 900 °C at 20 °C/min heating rate. The thermal degradation profile of Ma250, Me250 and Me350 samples, as observed from Figure 2, can be divided into three stages differing from Ma200, Ma300, Ma350, Me200 and Me300 samples that showed a two-stage degradation. The first stage corresponds to the removal of moisture and some light volatiles, and this spanned from 30–150 °C for all the samples with a percentage weight loss of 5.01%. The low percentage of moisture recorded in all samples is due to the torrefaction process; the samples underwent during which some moisture was evaporated from the samples. This was consistent with an initial mass loss of 7% recorded at a temperature below 250 °C during the gasification, pyrolysis and combustion of SS in air + nitrogen, nitrogen and air, respectively [25]. Furthermore, the negligible mass loss of 0.6%, 0.8% and 1.2% corresponding to release of moisture reported for sewage sludge torrefied at 230 °C, 260 °C and 290 °C, respectively, differed from the present study [26]. This could be attributed to the difference in composition of the samples as well as torrefaction conditions.
Notably, the second stage was characterized by devolatilization of cellulose, hemicellulose and lignin content of the sugarcane bagasse, as well as carbohydrate and lipids content of sewage sludge. Consequently, this resulted in the release of gases such as carbon monoxide (CO), hydrogen (H2), carbon dioxide (CO2) and methane (CH4) [27,28]. Most notably, the percentage weight loss was very significant at the second stage (200–600 °C), with Ma250 and Me250 recording the highest value of 76.31% and 69.98% respectively and Ma350 giving the least weight loss value of 30.26%. The principal decomposition (second) stage was initiated at a higher temperature (400 °C) for Ma300, Ma350 and Me300, Me350 samples compared to Ma200, Ma250, Me200 and Me250 samples that commenced at a lower temperature of about 300 °C. Similarly, in Świechowski et al. [29] study, the thermal decomposition of digestate from biogas and sewage sludge principally started at 300 °C and 350 °C with an average weight loss of 63% and 50%, respectively. Chen et al. [30] similarly recorded a temperature range of 360–500 °C for the second phase degradation of bio-oil from food waste and attributed it to the heterogeneous combustion of heavy compounds and oxygen. In addition, another study reported a lower temperature of 235 °C for the initiation of the main devolatilization phase for the sugarcane sample [31]. The higher devolatilization temperature observed for the blended samples torrefied at 300 °C and 350 °C was because the samples had undergone some level of devolatilization during the torrefaction process. This devolatilization phase is mostly associated with the hemicellulose component that decomposes between 190 and 320 °C. Due to hemicellulose low-temperature degradation, it usually results in less char and tar compared to the other polymer components [26].
Char oxidation representing the third stage, started at varying temperatures for all samples, indicated a variation in their thermal stability as well as their complex chemical composition. For instance, Ma250, Me250 and Me350 samples converted to char at 620 °C, 700 °C and 810 °C, respectively. Hence, in the event of gasification, this would serve as the set temperature to avoid the occurrence of slagging and agglomeration at higher temperatures. The concentrated mineral matter in the form of a solid residue (ash content) that emerges after the thermal treatment of the samples at 900 °C was highest in Ma350 and Me300 samples with values of approximately 37% compared to other samples because of the directly proportional relationship existing between torrefaction temperature and yield of solid residue. The thermogravimetric analysis aided in the determination of important parameters such as ash and volatile matter that may influence the thermal degradation of the samples. Table 1 presents the composition of the blended samples of torrefied SS and BG in terms of moisture content (MC), fuel ratio (FR), volatile matter (VM), ash content (AC) and fixed carbon (FC).
The condensable and non-condensable vapor released during the thermal degradation of the samples is represented by the volatile matter. As observed from Table 1, the VM of the 50% SS to 50% BG blend (Ma) decreased by 3.96% and 13.79% at the higher temperatures of 300 °C and 350 °C. Similarly, for 75% SS and 25% BG blend, VM decreased by 12.71% and 19.72% at 300 °C and 350 °C, respectively. In contrast, an increase in the volatile matter was observed for Ma250 and Me250 samples, which can be attributed to more decomposition of hemicellulose as 250 °C serves as the peak temperature for hemicellulose degradation. The decrease in VM exhibited in the other samples is desirable because it enhances the heating value of biomass originating from the reduced oxygen content of biomass impacted by an increase in torrefaction temperature [32]. In addition, low VM will reduce the formation of tars, which is a major problem to counter during biomass gasification. Tar condensation at reduced temperature causes fouling and blocking of process equipment such as internal combustion engines. Thus its minimization in fuel gas is desirable [33,34]. In light of this, VM is an important parameter of consideration in the design and layout of a gasifier system, gas cooling unit and cleaning unit for tar elimination.
Moisture content, as observed, showed a decreasing trend with the increase in torrefaction temperature with the exception of Ma350. The increase in the moisture content of Ma350 may be because of the hydrophilic nature of sugarcane bagasse due to its high hemicellulose composition. Hence, at a severe torrefaction condition of 350 °C, it tends to absorb moisture more as the hemicellulose component degrades [23]. On the same note, Yue et al. [6] study showed a decrease in the moisture content of energy sorghum from 7.83% to 2.05% and sweet sorghum bagasse from 9.29% to 5.51% after torrefaction at 250 °C. Another study equally showed a decrease in moisture content from 4.80% to 0.87% as torrefaction temperature increased from 200 °C to 300 °C [31]. The decrease in moisture content can be associated with the hydroxyl group’s breakdown during the torrefaction process. Generally, biomass material such as sugarcane bagasse absorbed the moisture, usually bond to this hydroxyl group, thus subjecting the biomass to thermal treatment, lowers the moisture content [4,35]. It is of great importance to highlight that the obtained MC for all the samples is within the acceptable limit for downdraft gasification. The decrease in moisture MC and VM with torrefaction relatively increased the FC of the samples. At torrefaction temperature of 300 °C, the FC of Me200 increased from 16.76% to 23.18%, while at 350 °C, it increased further to 51.37%. Ma200 increased from 26.54% to 31.77% for the torrefaction temperature of 300 °C. However, Ma250 showed the lowest FC content of 1.15% due to its high volatile matter content as compared to other torrefaction temperature. Recalling that FC content is determined by difference using volatile matter as one of the parameter hence an increase in volatile matter will corresponding decrease FC. Indeed, the increase in FC content with temperature increase is in agreement with the findings in literature [6,36,37]. Moreover, a combination of increased temperature and residence time are required to obtain a biomass with high FC content. This is advantageous during gasification or combustion as high content of FC translates to better heat of combustion [20]. It is a necessary constituent of solid fuel needed to achieve a stable combustion process.
After the complete combustion of the samples, the leftover inorganic solid residue known as ash is typically composed of calcium, silica, iron and phosphorus. The presence of these components in the ash could lead to agglomeration, corrosion and fouling in gasifiers [27]. Hence, low AC, as obtained in Me250, is recommended to curb the mechanical problem associated with high ash content. Finally, the fuel ratio used in determining the combustibility of a solid fuel showed an increasing trend at higher temperatures. The FR of 1.7 obtained for the Me350 sample compares very close with the FR range of 1.4–1.5 reported for optimum combustion performance of coal [38]. Although the increase in fuel ratio usually creates an ignition difficulty, it still results in an improved and stable combustion performance. Another solid fuel property of importance, higher heating value (HHV) shown in Table 2, was calculated following the correlation of Parikh et al. [39] and the second correlation adapted from Demirbas [40] study.
The established correlation used in calculating the HHV of the samples considered the vital solid fuel properties, namely: volatile matter, fixed carbon and ash content. From Table 2, the HHV obtained for all samples varied between 12.25–23.62 MJ/kg. This is consistent with Karki et al. [37] study where an HHV range of 13.55–16.64 MJ/kg was reported for sewage sludge torrefaction at a temperature range of 200–350 °C. Anukam et al. [31] study showed an increase in HHV of torrefied sugarcane bagasse from 17.3–20.2 MJ/kg as torrefaction temperature rose from 200–300 °C. Similarly, Poudel et al. [11] study on torrefaction of sewage sludge recorded an HHV that varied from 15–22 MJ/kg as torrefaction temperature increased from 200–600 °C. In their study, an increasing trend in HHV from around 200 °C was first noticed, before a decline at a temperature above 350 °C. The decline is associated with the occurrence of pyrolysis reaction at higher torrefaction temperature. In a recent study that evaluated the characteristic of wood pellet mixed with torrefied rice straw, a decrease in heating value was first observed before an increase as torrefaction temperature increased from 220–280 °C [41]. This back and forward trend can be associated with the unique fuel property that results from blending two biomass, which is the case of the present study.
The highest HHV of 22.70 MJ/kg and 23.62 MJ/kg determined for the Me350 sample and lowest HHV (12.25 MJ/kg and 14.59 MJ/kg) of the Ma250 sample can be attributed to the percentage concentration of VM, AC and FC (thermochemical parameters) in the samples when compared to other samples. Similarly, Huang et al. [22] study reported the highest HHV of 20.28 MJ/kg for 50:50 blend ratio of sewage sludge and Leucaena torrefied at a microwave power of 150 W and least HHV of 13.39 W for 75:25 blend ratio of sewage sludge and Leucaena torrefied at a microwave power of 350 W. Enhancing the FC content of any solid fuel produces a fuel with higher HHV and lower reactivity while a higher VM gives a lesser HHV and more reactive fuel [26,42]. Notably, increasing the torrefaction temperature enhanced the HHV of some samples as expected, although not in all cases, which could be linked to the complexity of sewage sludge composition as well as the unique fuel property of the blended sample. The recorded increase in HHV as torrefaction temperature increased is due to reduced oxygen content.

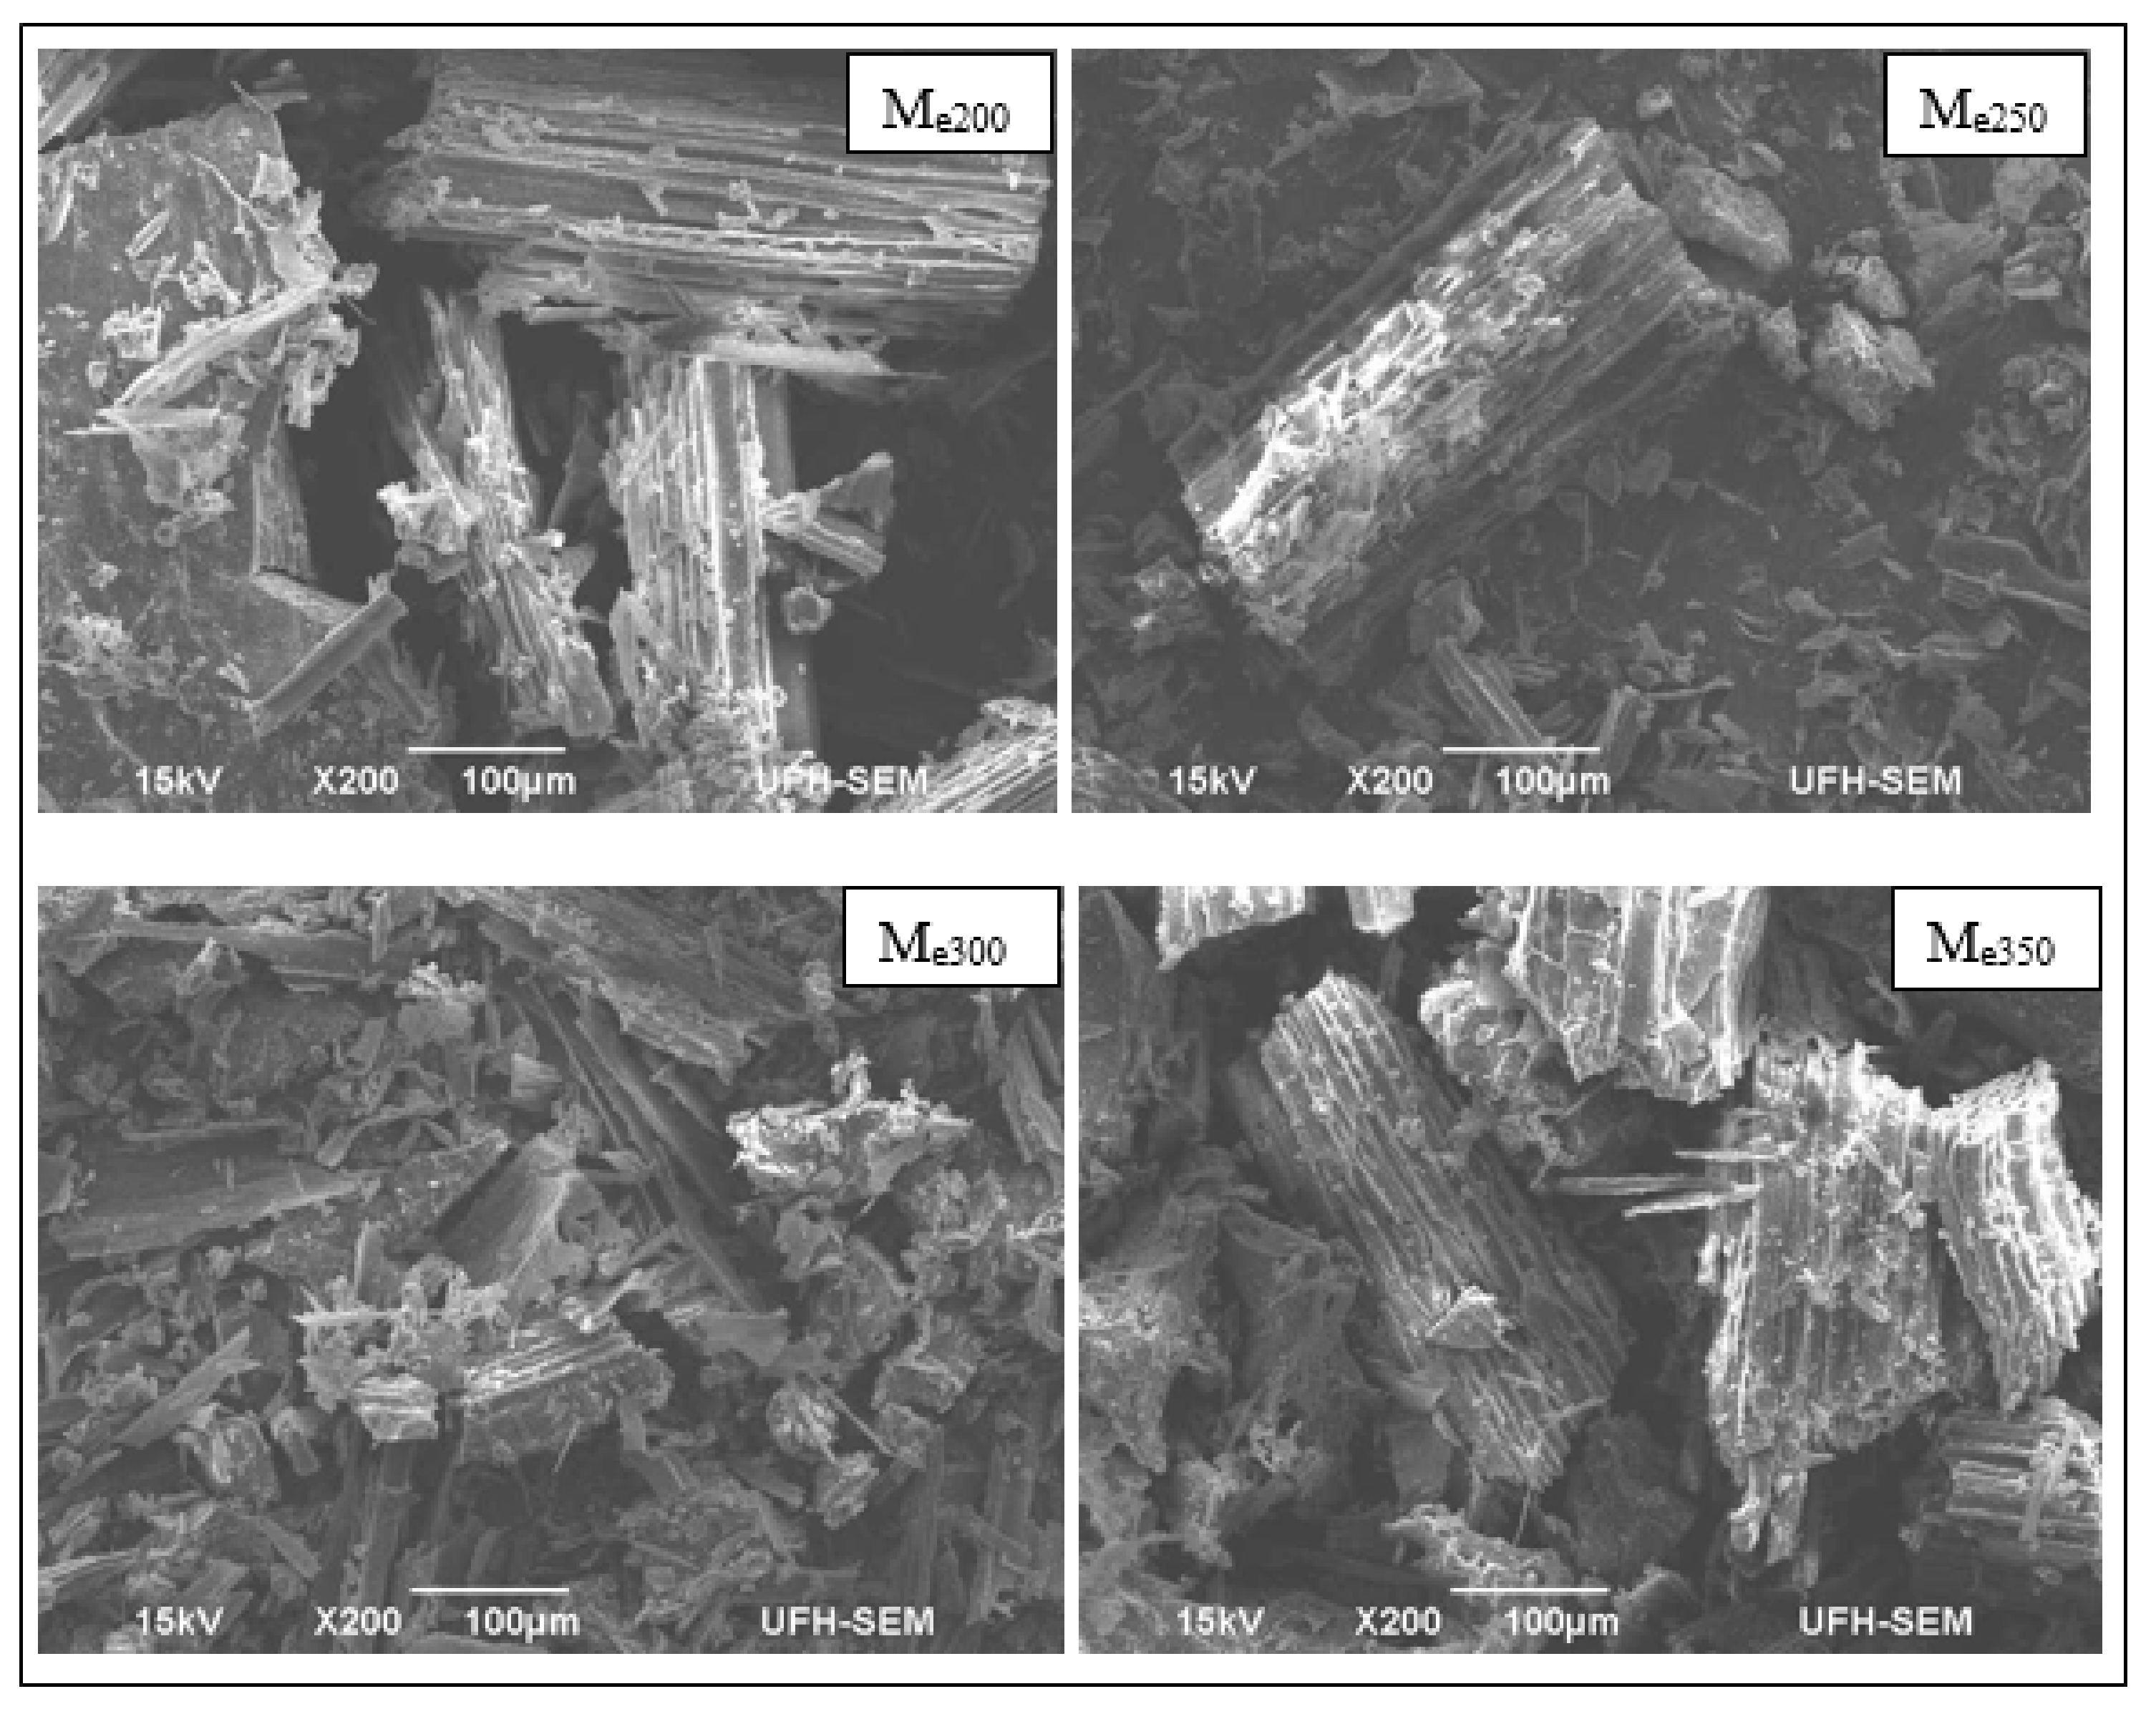
3.2. Scanning Electron Microscopy Analysis
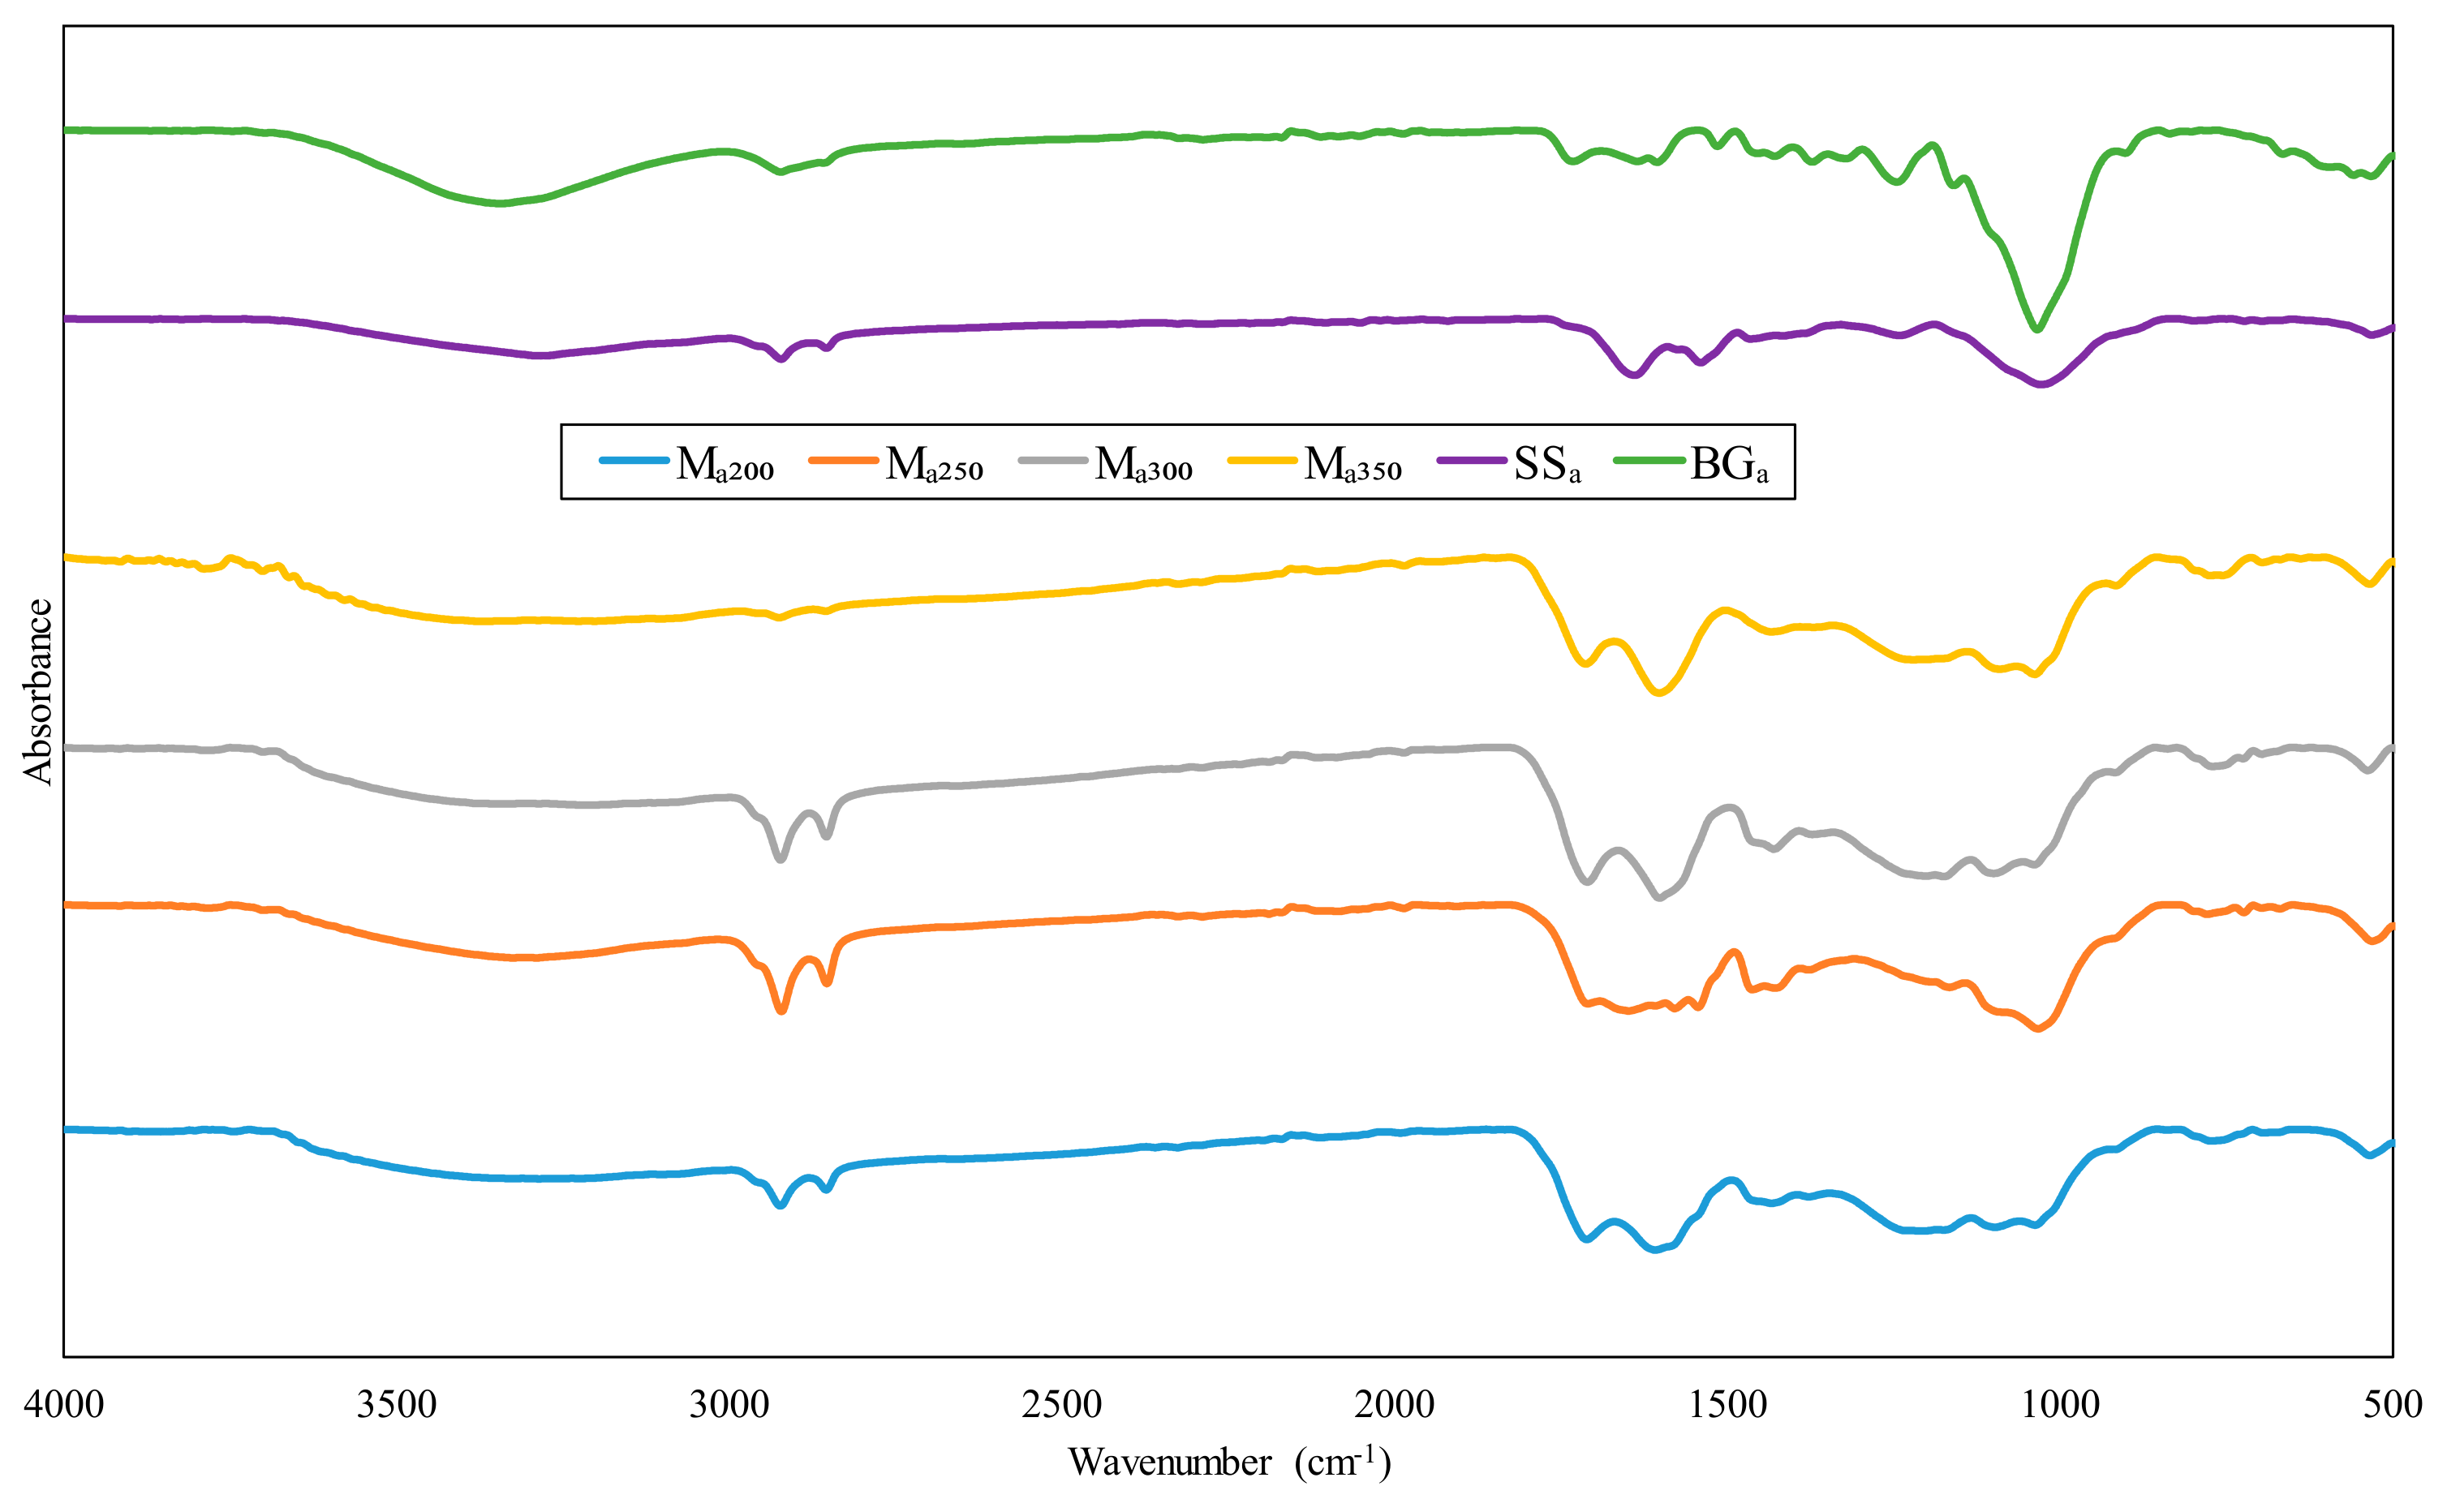
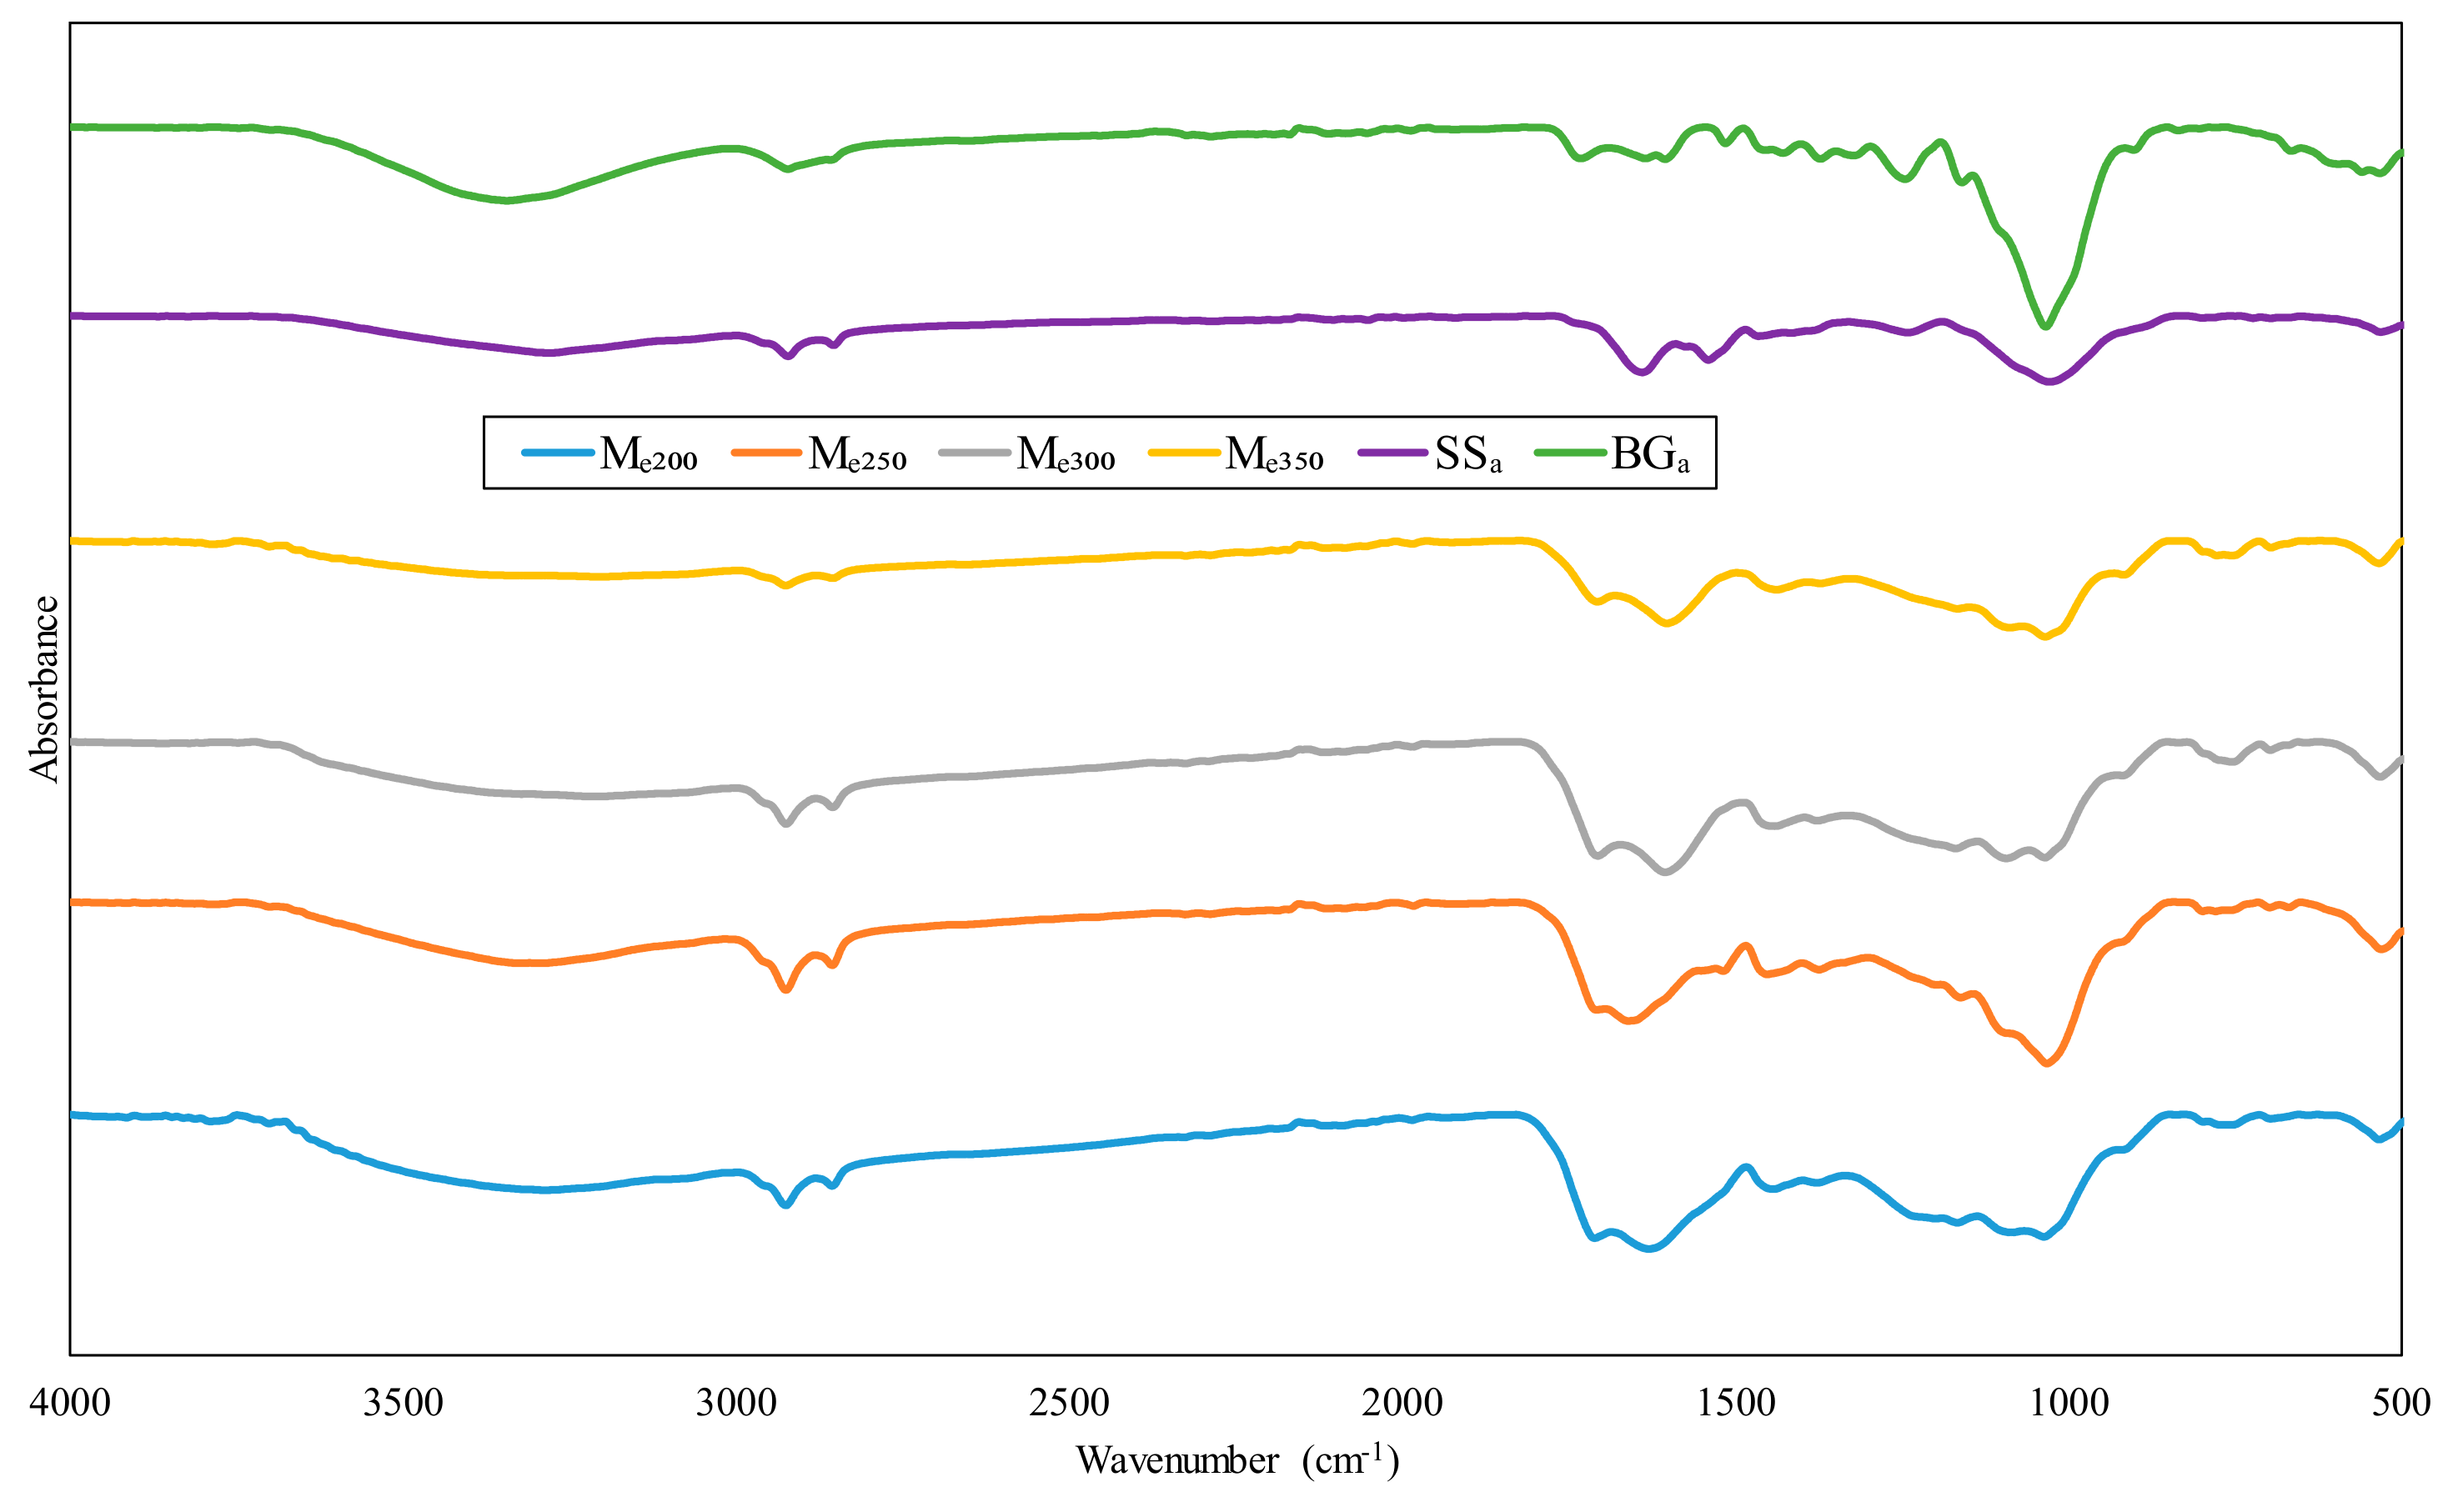
The morphological properties for the blended ratio of sewage sludge and sugarcane bagasse torrefied at 200 °C, 250 °C, 300 °C and 350 °C were studied using SEM. Figure 3 and Figure 4 present the surface morphology images of the torrefied blended samples at the same magnification. The observed physical changes were associated with alteration in cellular tissue and structures of the samples. Degradation phases of the blended biomass samples, as seen from the SEM images, were attributed to depolymerization, carbonization and devolatilization of the polymer components as well as lipids present in sewage sludge fraction.
In the SEM image for Ma200, a fibrous hollow-like particle structure can be noticed, indicating the initiation of the degradation process caused by torrefaction. The interspaces were very high at 200 °C. As the temperature increased to 250 °C represented by Me250, the sample fractured and broke up, resulting in a shrinkage of the hollow spaces within the fibers. It also caused a reduction in the particle size of the sample and gave medium interspaces between the particles. This can be attributed to the devolatilization of hemicellulose, which is less thermostable compared to the other polymers. At 300 °C (Me350), the samples further disintegrated into a mixture of granular and fragmented particles that were rectangular. The interspaces decreased at this point. As the temperature rose to 350 °C, denoted by Me350, some of the particles aggregated into small lumps, but the sheet-like form and the particle size were further reduced with little interspaces between the particles.
The morphological image in Figure 4 differed from Figure 3 as the sewage sludge content in the blend changed from 50% to 75%. For the torrefaction temperature of 200 °C (Me200), the sample was observed to have a fiber-like dispersed structure with wide interspaces. Further increase in temperature as observed in Me250 resulted in a flake-like structure with irregular particle size. At 300 °C, the biomass gradually formed granules of bigger sizes and aggregated together with fewer interspaces. With more increase in temperature as observed from the Me350 SEM image, aggregation of the particles on the surface was higher because of lignin degradation. Lignin is reported to have the capacity to bind plant cells together. Hence, this was envisioned to improve the grinding ability of the solid fuel due to the binding nature of lignin. It is noteworthy to highlight that the deformation and shrinking of the cell structure observed in all samples will enhance gasification reactivity [13,31].

3.3. FTIR Analysis

The chemical structure of blended ratios of torrefied sewage sludge and sugarcane bagasse were analyzed using FTIR. Figure 5 and Figure 6 present the infrared (IR) spectra of the 50:50 and 75:25 blended ratio. This was obtained within the mid-IR range of 4000–500 cm−1, which is a typical vibration band for organic components. Various peaks corresponding to the characteristic functional groups of the analyzed samples were observed in the spectra.
As observed, the IR spectra for 50:50 and 75:25 blended ratio of sewage sludge and sugarcane bagasse only differed slightly; hence Figure 5 and Figure 6 are discussed concurrently. FTIR absorption peaks associated with–OH bond formation in alcohol, phenols and carboxylic acid were observed at 3342.36 cm−1 in the raw bagasse (BGa) and 3278.21 cm−1 in the raw sewage sludge (SSa). However, a decrease in intensity of these peaks was noticed in both 50:50 and 75:25 mixed ratio of sewage sludge and sugarcane bagasse samples torrefied at 200 °C (Ma200, Me200), 250 °C (Ma250, Me250), 300 °C (Ma300, Me300) and 350 °C (Ma350, Me350). The observed decrease in intensity is associated with the occurrence of the methylation reaction initiated by the torrefaction process, which consequently improves the hydrophobicity of the biomass. The unique double absorption peak characteristics of hemicellulose obtainable within 2930–2850 cm−1 wavenumber were observed in the SSa and all torrefied blended samples, with the exception of Ma350. In contrast, the BGa exhibited more of a cellulose characteristic peak within the same IR region. These peaks were ascribed to symmetric and asymmetric vibrations of C-Hn stretching CH4 and C2H6 particularly. To further explain, the cracking of methylene (-CH2-) and aromatic rings along with methoxy (-OCH3) and the methyl (-CH3) decomposition gave rise to CH4 [43].
The peak at the IR region of 1720–1700 cm−1 was attributed to the acetyl groups present in hemicellulose. A previous study indicated that the abundance of acetyl groups reduces the uptake of moisture by a biomass material, which is advantageous when subjected to gasification [44]. Peaks between 1650 and 1600 cm−1 in SSa and BGa were associated with skeletal aromatic vibrations typically seen in lignin structure. These peaks increased in intensity with the blended torrefied samples at higher torrefaction temperature due to insignificant modification of lignin component as well as degradation of hemicellulose and cellulose. Consequently, these degradations yielded chars that were more thermally stable and rich in aromatic groups. Furthermore, the deformation of C-H bonds linked to polysaccharides of lignin was noticed between the wavenumber of 1460–1430 cm−1 [8].
Most notably, a pronounced peak corresponding to C-O, C=C and C–C-O vibration from hemicellulose, cellulose as well as lignin occurred within the 1035 and 1030 cm−1 region in all the samples. However, the intensity was higher in the BGa, but lesser in blended torrefied samples due to the aromatic nature of lignin that leads to its slower degradation rate compared to cellulose and hemicellulose. The peak within wavenumber 695–660 cm−1 is ascribed to vibrations of the O-H group stretching outside of the plane and represents a typical cellulose characteristic [28]. Upon torrefaction, this bond was removed through the reaction H + OH → H2O. Thus, changing the hydrophilic nature of the samples to hydrophobic, which indicated the impact of torrefaction as well as the blend. A summarized detailed description of the FTIR peaks and their corresponding functional groups are presented in Table 3 and for reference [8,45,46].

4. Conclusions

Torrefaction of a blended ratio of sewage sludge and sugarcane bagasse to enhance its fuel properties as well as thermal degradation characteristics were successfully investigated. The result obtained revealed that torrefaction temperature had a significant influence on the physicochemical properties of the torrefied biomass samples. Thermogravimetric analysis conducted revealed that Ma250 and Me250 samples gave the highest volatile matter content of 76.89% and 70.89%, respectively. The high volatile matter in the fuel will result in better flame stability, easy ignition and combustion process, as well as improved carbon burnout. Nevertheless high content of volatile matter in a solid fuel is undesirable because it leads to the production of more tars during the gasification process, thus, making it a parameter of interest in the design of a gasifier system. A fuel ratio of 1.7 obtained for Me350 (blend ratio of 75% SS + 25% BG torrefied at 350 °C) equated to the value for optimum coal combustion performance. From the FTIR analysis, it was observed that the peak corresponding to the OH functional group decreased in intensity with an increase in torrefaction temperature. The observed decrease was ascribed to the occurrence of a methylation reaction initiated by the torrefaction process, which consequently improved the hydrophobicity of the blended biomass samples. The morphological structure showed disintegration of the biomass particles at a temperature of 300 °C in all blended samples. These particles further aggregated into small lumps at 350 °C, indicating an improvement in the grind ability of the solid fuels.

Author Contributions

O.A. and A.O. did conception and design of the work, A.O. and O.M. did some data acquisition, while experimentation and other data acquisition were made by T.V. Analysis, interpretation of result and writing of the manuscript were done by N.N.; the review was done by M.P. and O.A., who also acquired funding for the study. All authors have read and agreed to the published version of the manuscript.

Funding

The authors are grateful to the following funding bodies, namely: South Africa Medical Research Council, ESKOM/TESP and the University of Fort Hare for financial support.

Acknowledgments

We are grateful to the South Africa Medical Research Council, ESKOM/TESP and the University of Fort Hare for financial support.

Conflicts of Interest

The authors declare no conflict of interest. The funding sponsors had no role in the design, execution, interpretation or writing of the study.

References

  1. Mamvura, T.; Danha, G. Biomass torrefaction as an emerging technology to aid in energy production. Heliyon 2020, 6, e03531. [Google Scholar] [CrossRef] [PubMed]
  2. Pulka, J.; Manczarski, P.; Koziel, J.A.; Białowiec, A. Torrefaction of sewage sludge: Kinetics and fuel properties of biochars. Energies 2019, 12, 565. [Google Scholar] [CrossRef] [Green Version]
  3. Li, H.; Jiang, L.-B.; Li, C.-Z.; Liang, J.; Yuan, X.-Z.; Xiao, Z.-H.; Xiao, Z.-H.; Wang, H. Co-Pelletization of sewage sludge and biomass: The energy input and properties of pellets. Fuel Process. Technol. 2015, 132, 55–61. [Google Scholar] [CrossRef]
  4. Cahyanti, M.N.; Doddapaneni, T.R.K.C.; Kikas, T. Biomass torrefaction: An overview on process parameters, economic and environmental aspects and recent advancements. Bioresour. Technol. 2020, 301, 122737. [Google Scholar] [CrossRef] [PubMed]
  5. Acharya, B.; Dutta, A. Fuel property enhancement of lignocellulosic and nonlignocellulosic biomass through torrefaction. Biomass Convers. Biorefin. 2016, 6, 139–149. [Google Scholar] [CrossRef]
  6. Yue, Y.; Singh, H.; Singh, B.; Mani, S. Torrefaction of sorghum biomass to improve fuel properties. Bioresour. Technol. 2017, 232, 372–379. [Google Scholar] [CrossRef] [PubMed] [Green Version]
  7. Phanphanich, M.; Mani, S. Impact of torrefaction on the grindability and fuel characteristics of forest biomass. Bioresour. Technol. 2011, 102, 1246–1253. [Google Scholar] [CrossRef]
  8. Granados, D.; Ruiz, R.; Vega, L.; Chejne, F. Study of reactivity reduction in sugarcane bagasse as consequence of a torrefaction process. Energy 2017, 139, 818–827. [Google Scholar] [CrossRef]
  9. Anukam, A.; Mamphweli, S.; Okoh, O.; Reddy, P. Influence of torrefaction on the conversion efficiency of the gasification process of sugarcane bagasse. Bioengineering 2017, 4, 22. [Google Scholar] [CrossRef] [Green Version]
  10. Atienza-Martínez, M.; Mastral, J.F.; Ábrego, J.; Ceamanos, J.S.; Gea, G. Sewage sludge torrefaction in an auger reactor. Energy Fuels 2015, 29, 160–170. [Google Scholar] [CrossRef]
  11. Poudel, J.; Ohm, T.-I.; Lee, S.-H.; Oh, S.C. A study on torrefaction of sewage sludge to enhance solid fuel qualities. Waste Manag. 2015, 40, 112–118. [Google Scholar] [CrossRef] [PubMed]
  12. Pawlak-Kruczek, H.; Wnukowski, M.; Niedzwiecki, L.; Czerep, M.; Kowal, M.; Krochmalny, K.; Zgóra, J.; Ostrycharczyk, M.; Baranowski, M.; Tic, W.J. Torrefaction as a valorization method used prior to the gasification of sewage sludge. Energies 2019, 12, 175. [Google Scholar] [CrossRef] [Green Version]
  13. Arias, B.; Pevida, C.; Fermoso, J.; Plaza, M.; Rubiera, F.; Pis, J. Influence of torrefaction on the grindability and reactivity of woody biomass. Fuel Process. Technol. 2008, 89, 169–175. [Google Scholar] [CrossRef] [Green Version]
  14. Chen, Q.; Zhou, J.; Liu, B.; Mei, Q.; Luo, Z. Influence of torrefaction pretreatment on biomass gasification technology. Chin. Sci. Bull. 2011, 56, 1449–1456. [Google Scholar] [CrossRef] [Green Version]
  15. Chen, W.-H.; Du, S.-W.; Tsai, C.-H.; Wang, Z.-Y. Torrefied biomasses in a drop tube furnace to evaluate their utility in blast furnaces. Bioresour. Technol. 2012, 111, 433–438. [Google Scholar] [CrossRef]
  16. Chen, W.-H.; Lu, K.-M.; Tsai, C.-M. An experimental analysis on property and structure variations of agricultural wastes undergoing torrefaction. Appl. Energy 2012, 100, 318–325. [Google Scholar] [CrossRef]
  17. Wu, K.-T.; Tsai, C.-J.; Chen, C.-S.; Chen, H.-W. The characteristics of torrefied microalgae. Appl. Energy 2012, 100, 52–57. [Google Scholar] [CrossRef]
  18. Wen, J.-L.; Sun, S.-L.; Yuan, T.-Q.; Xu, F.; Sun, R.-C. Understanding the chemical and structural transformations of lignin macromolecule during torrefaction. Appl. Energy 2014, 121, 1–9. [Google Scholar] [CrossRef]
  19. Asadullah, M.; Adi, A.M.; Suhada, N.; Malek, N.H.; Saringat, M.I.; Azdarpour, A. Optimization of palm kernel shell torrefaction to produce energy densified bio-coal. Energy Convers. Manag. 2014, 88, 1086–1093. [Google Scholar] [CrossRef]
  20. Bridgeman, T.; Jones, J.; Shield, I.; Williams, P. Torrefaction of reed canary grass, wheat straw and willow to enhance solid fuel qualities and combustion properties. Fuel 2008, 87, 844–856. [Google Scholar] [CrossRef]
  21. Álvarez-Álvarez, P.; Pizarro, C.; Barrio-Anta, M.; Cámara-Obregón, A.; Bueno, J.L.M.; Álvarez, A.; Gutiérrez, I.; Burslem, D.F. Evaluation of tree species for biomass energy production in Northwest Spain. Forests 2018, 9, 160. [Google Scholar] [CrossRef] [Green Version]
  22. Huang, Y.-F.; Sung, H.-T.; Chiueh, P.-T.; Lo, S.-L. Co-Torrefaction of sewage sludge and leucaena by using microwave heating. Energy 2016, 116, 1–7. [Google Scholar] [CrossRef]
  23. Kanwal, S.; Chaudhry, N.; Munir, S.; Sana, H. Effect of torrefaction conditions on the physicochemical characterization of agricultural waste (sugarcane bagasse). Waste Manag. 2019, 88, 280–290. [Google Scholar] [CrossRef] [PubMed]
  24. Standard, A. ASTM standards-D5142-04 standard test methods for proximate analysis of the analysis sample of coal and coke by instrumental procedures. In Annual Book of ASTM Standards, Section; ASTM International: West Conshohocken, PA, USA, 2002; Volume 5. [Google Scholar]
  25. Hernandez, A.-B.; Ferrasse, J.-H.; Akkache, S.; Roche, N. Thermochemical conversion of sewage sludge by TGA-FTIR analysis: Influence of mineral matter added. Dry. Technol. 2015, 33, 1318–1326. [Google Scholar] [CrossRef]
  26. Wilk, M.; Magdziarz, A.; Kalemba, I. Characterisation of renewable fuels’ torrefaction process with different instrumental techniques. Energy 2015, 87, 259–269. [Google Scholar] [CrossRef]
  27. Basu, P. Biomass Gasification, Pyrolysis and Torrefaction: Practical Design and Theory; Academic Press: Cambridge, MA, USA, 2018. [Google Scholar]
  28. Manatura, K. Inert torrefaction of sugarcane bagasse to improve its fuel properties. Case Stud. Therm. Eng. 2020, 100623. [Google Scholar] [CrossRef]
  29. Świechowski, K.; Hnat, M.; Stępień, P.; Stegenta-Dąbrowska, S.; Kugler, S.; Koziel, J.A.; Białowiec, A. Waste to energy: Solid fuel production from biogas plant digestate and sewage sludge by torrefaction-process kinetics, fuel properties, and energy balance. Energies 2020, 13, 3161. [Google Scholar] [CrossRef]
  30. Chen, W.-H.; Lin, Y.-Y.; Liu, H.-C.; Chen, T.-C.; Hung, H.-C.; Chen, C.-H. Analysis of physicochemical properties of liquefaction bio-oil from food waste. Energy Procedia 2019, 158, 61–66. [Google Scholar] [CrossRef]
  31. Anukam, A.; Mamphweli, S.; Reddy, P.; Okoh, O.; Meyer, E. An investigation into the impact of reaction temperature on various parameters during torrefaction of sugarcane bagasse relevant to gasification. J. Chem. 2015, 2015. [Google Scholar] [CrossRef] [Green Version]
  32. Caillat, S.; Vakkilainen, E. Large-Scale biomass combustion plants: An overview. In Biomass Combustion Science, Technology and Engineering; Elsevier: Amsterdam, The Netherlands, 2013; pp. 189–224. [Google Scholar]
  33. Kumar, R.M.D.; Anand, R. Production of biofuel from biomass downdraft gasification and its applications. In Advanced Biofuels; Elsevier: Amsterdam, The Netherlands, 2019; pp. 129–151. [Google Scholar]
  34. Devi, L.; Ptasinski, K.J.; Janssen, F.J. A review of the primary measures for tar elimination in biomass gasification processes. Biomass Bioenergy 2003, 24, 125–140. [Google Scholar] [CrossRef]
  35. Chen, W.-H.; Lin, B.-J.; Colin, B.; Chang, J.-S.; Pétrissans, A.; Bi, X.; Pétrissans, M. Hygroscopic transformation of woody biomass torrefaction for carbon storage. Appl. Energy 2018, 231, 768–776. [Google Scholar] [CrossRef]
  36. Aytenew, G.; Nigus, G.; Bedewi, B. Improvement of the energy density of rice husk using dry and chemical treated torrefaction. J. Adv. Chem. Eng. 2018, 8, 1000185. [Google Scholar]
  37. Karki, S.; Poudel, J.; Oh, S.C. Thermal pre-treatment of sewage sludge in a lab-scale fluidized bed for enhancing its solid fuel properties. Appl. Sci. 2018, 8, 183. [Google Scholar] [CrossRef] [Green Version]
  38. Aich, S.; Behera, D.; Nandi, B.K.; Bhattacharya, S. Relationship between proximate analysis parameters and combustion behaviour of high ash Indian coal. Int. J. Coal Sci. Technol. 2020, 1–12. [Google Scholar] [CrossRef] [Green Version]
  39. Parikh, J.; Channiwala, S.; Ghosal, G. A correlation for calculating HHV from proximate analysis of solid fuels. Fuel 2005, 84, 487–494. [Google Scholar] [CrossRef]
  40. Demirbaş, A. Calculation of higher heating values of biomass fuels. Fuel 1997, 76, 431–434. [Google Scholar] [CrossRef]
  41. Kizuka, R.; Ishii, K.; Sato, M.; Fujiyama, A. Characteristics of wood pellets mixed with torrefied rice straw as a biomass fuel. Int. J. Energy Environ. Eng. 2019, 10, 357–365. [Google Scholar] [CrossRef] [Green Version]
  42. Chen, W.-H.; Lu, K.-M.; Lee, W.-J.; Liu, S.-H.; Lin, T.-C. Non-Oxidative and oxidative torrefaction characterization and SEM observations of fibrous and ligneous biomass. Appl. Energy 2014, 114, 104–113. [Google Scholar] [CrossRef]
  43. He, C.; Tang, C.; Liu, W.; Dai, L.; Qiu, R. Co-Pyrolysis of sewage sludge and hydrochar with coals: Pyrolytic behaviors and kinetics analysis using TG-FTIR and a discrete distributed activation energy model. Energy Convers. Manag. 2020, 203, 112226. [Google Scholar] [CrossRef]
  44. Pawar, P.M.-A.; Koutaniemi, S.; Tenkanen, M.; Mellerowicz, E.J. Acetylation of woody lignocellulose: Significance and regulation. Front. Plant Sci. 2013, 4, 118. [Google Scholar] [CrossRef] [Green Version]
  45. Hoi, L.W.S.; Martincigh, B.S. Sugar cane plant fibres: Separation and characterisation. Ind. Crop. Prod. 2013, 47, 1–12. [Google Scholar]
  46. Yang, H.; Yan, R.; Chen, H.; Lee, D.H.; Zheng, C. Characteristics of hemicellulose, cellulose and lignin pyrolysis. Fuel 2007, 86, 1781–1788. [Google Scholar] [CrossRef]
Figure 1. Schematic diagram of the torrefaction unit.
Applsci 11 02654 g001
Figure 2. Thermogravimetric analysis (TGA) curves of torrefied sewage sludge and sugarcane bagasse blend.
Applsci 11 02654 g002
Figure 3. SEM images of 50% SS to 50% BG blended ratio of torrefied SS and BG.
Applsci 11 02654 g003
Figure 4. SEM images of 75% SS to 25% BG blended ratio of torrefied SS and BG.
Applsci 11 02654 g004
Figure 5. Infrared (IR) spectra for 50:50 mixing ratio of torrefied sewage sludge and sugarcane bagasse.
Applsci 11 02654 g005
Figure 6. IR spectra for 50:50 mixing ratio of torrefied sewage sludge and sugarcane bagasse.
Applsci 11 02654 g006
Table 1. Proximate analysis of the blended ratio of torrefied sewage sludge (SS) and raw bagasse (BG).
SampleMC (wt %)VM (wt %)FC (wt %)AC (wt %)FR
Ma2005.0544.9026.5423.510.59
Ma2504.1676.891.1517.800.014
Ma3003.5640.9431.7723.730.77
Ma3505.0031.1126.5037.390.85
Me2004.0549.616.7629.590.33
Me2503.6370.6213.8711.880.19
Me3003.6536.8923.1836.280.62
Me3502.9529.8851.3715.81.71
Table 2. Highest energy value (HHV) of the torrefied blend of SS and BG.
CorrelationSampleHHV1 (MJ/kg)HHV2 (MJ/kg)
HHV1 = 0.3536 FC + 0.1559 VM − 0.0078 AC
HHV2 = 0.1846 VM + 0.3525 FC
Ma20016.2017.64
Ma25012.2514.59
Ma30017.4118.75
Ma35013.9315.08
Me20013.4315.06
Me25015.8217.92
Me30013.6614.98
Me35022.7023.62
Table 3. Fourier-transform infrared spectroscopy (FTIR) peaks and their corresponding functional groups for torrefied sewage sludge and sugarcane bagasse.
Ma200Ma250Ma300Ma350Me200Me250Me300Me350SSaBGaAssignmentHCL
3283.273287.203213.11-3285.203285.983210.383196.893278.213342.36OH stretching vibration (H-bonded) x
2921.212919.622920.792923.132923.852923.442923.152923.592920.002920.46C-H stretching and aliphatic alkanes vibration x
2852.42851.322852.02-2853.962853.952853.202853.522851.98-C-H stretching and aliphatic alkanes vibration x
1709.661707.851708.691711.341709.49-1704.851705.271730.17-C=O stretching (carbonyl/carboxyl group)x x
1606.571646.051600.191600.581628.441659.521603.431600.901638.081633.33C=C stretching x
1431.501460.501428.101432.221440.971449.801439.181436.061426.751463.25C-H bond deformation and deflectionxxx
1206.631164.95-1218.501165.071160.02--1243.491239.39C-O stretching of aromatic ring x
1035.771031.201037.181036.271035.051030.471033.611033.081032.471026.17C-O, C=C and C–C-O stretchingxxx
692.18667.40768.78772.38531.45528.58695.13694.18663.49529.92Out-of-plane O-H bendingxx
Publisher’s Note: MDPI stays neutral with regard to jurisdictional claims in published maps and institutional affiliations.

