
Evaluation of Cost-Effective Modified Binder Thin Chip and Cape Seal Surfacings on an Anionic Nano-Modified Emulsion (NME)-Stabilised Base Layer Using Accelerated Pavement Testing (APT)


Abstract
Featured Application
Abstract
1. Introduction
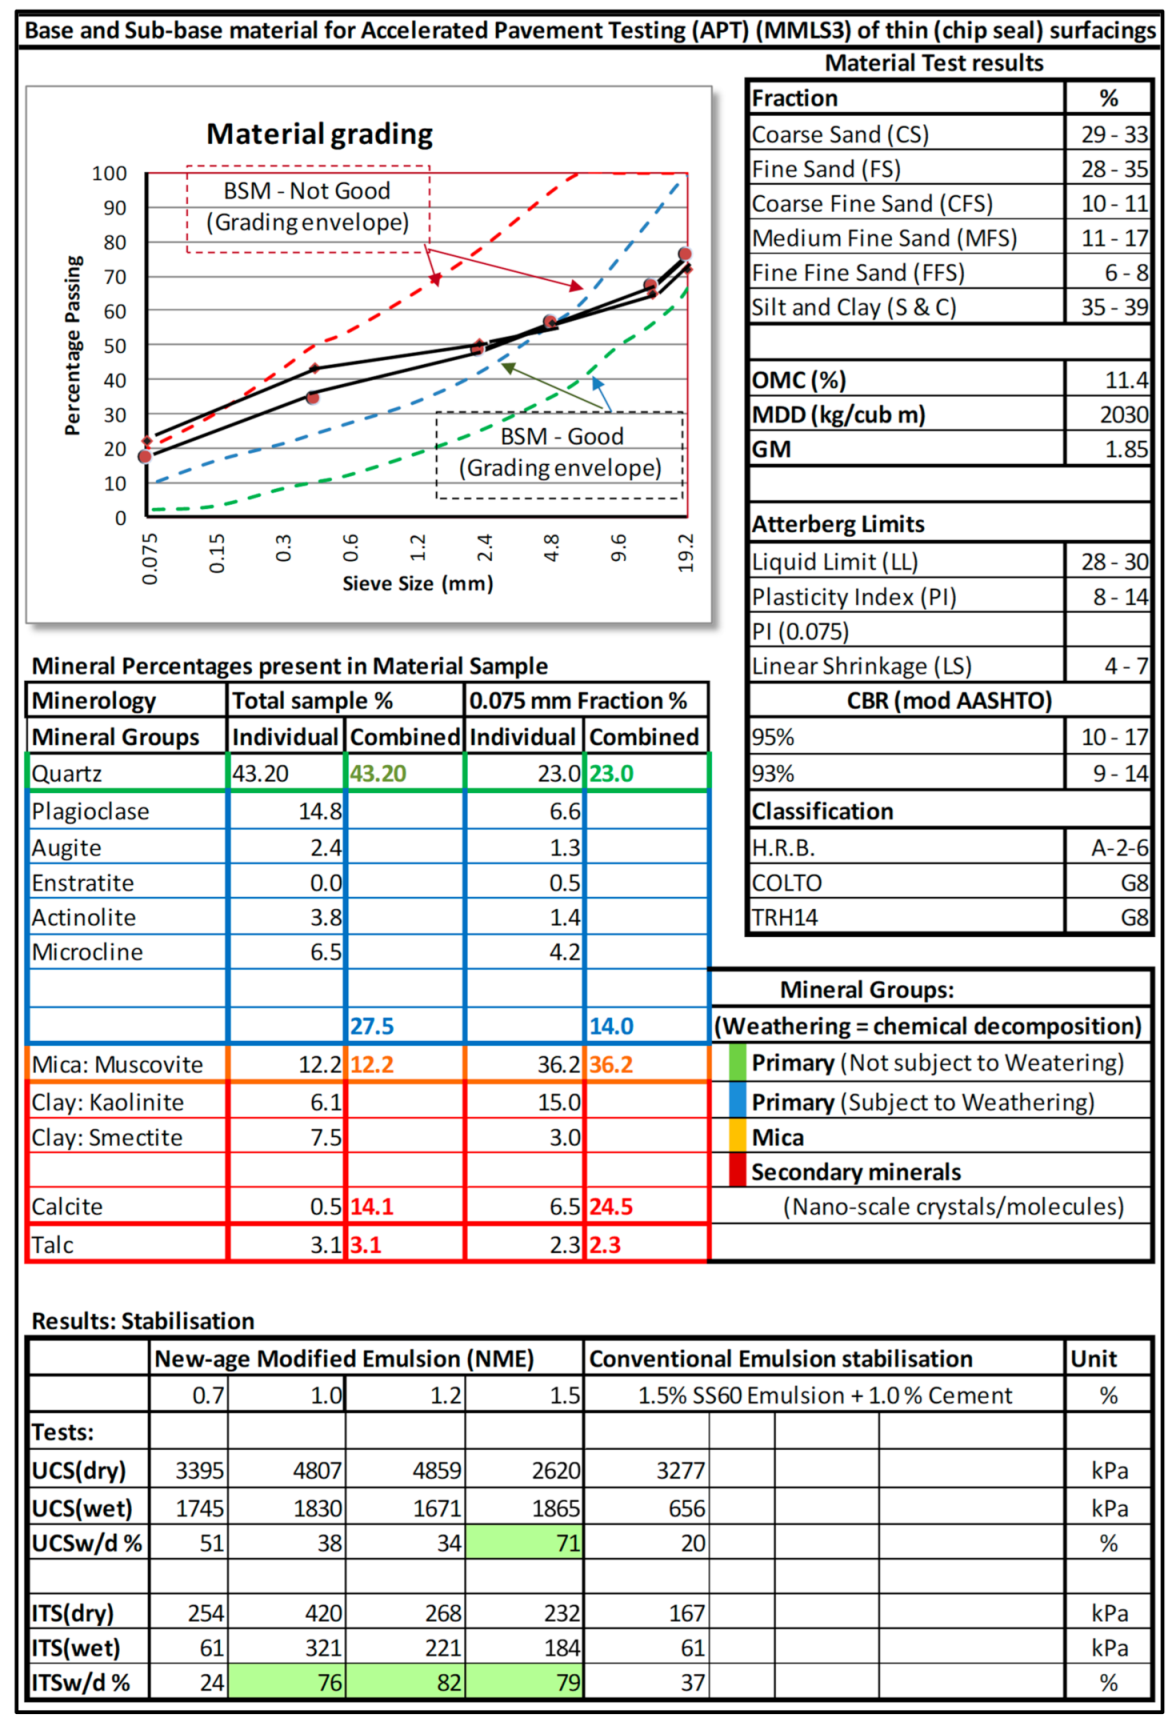
2. Materials Used in the Anionic NME-Stabilised Base Layer
3. Selection and Construction of Thin Chip and Cape Seal Surfacings
3.1. Selection of Surfacings
3.2. Binder Selection
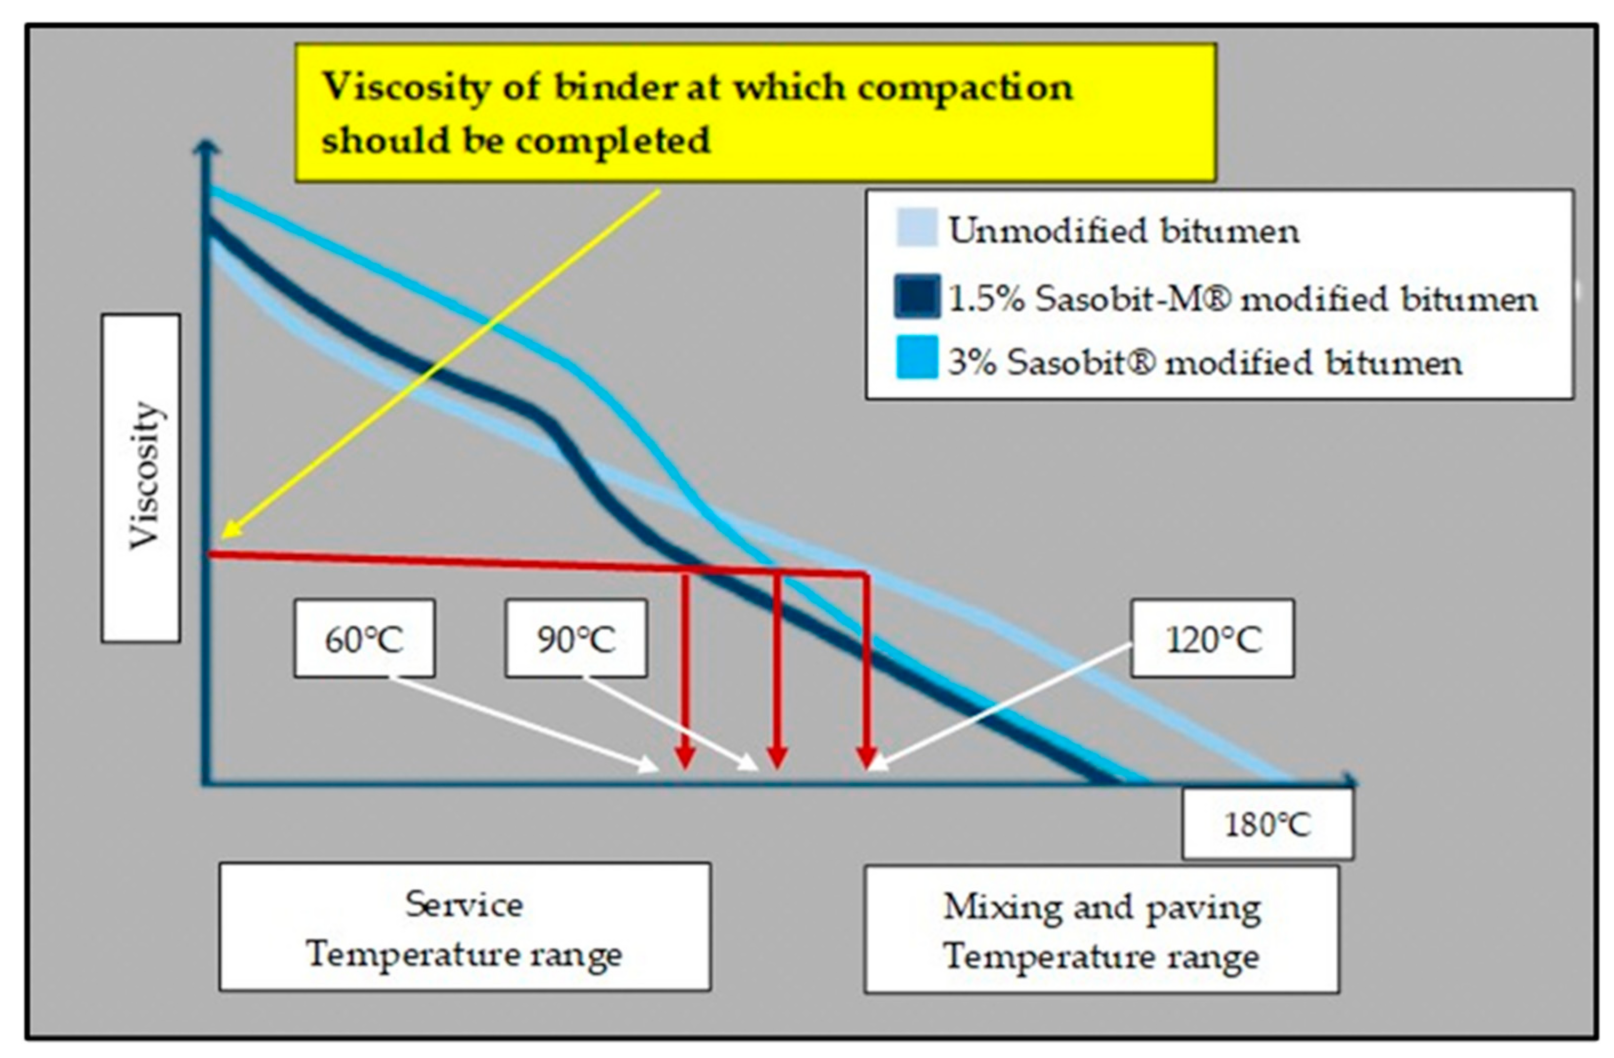
3.2.1. General
- Hot binders with 0% solvents: 25 °C and rising
- Emulsions: 10 °C and rising
3.2.2. Binder Selection: Tack Coat for the First Application of the 20 mm Chips (Stone)
3.2.3. Binder Selection: Second Binder Application for the Double Chip Seal
3.2.4. Binder Selection: Slurry for the Construction of the Cape Seal
- acts effectively as an aggregate adhesive that permanently binds the bitumen to the aggregate;
- chemically alters the surface of the aggregate to become hydrophobic and repels the water from the mix; and
- assists in the stability and better distribution of the bitumen particles, effectively reducing the percentage of binder required to achieve the same engineering properties in terms of tensile and compressive strengths.
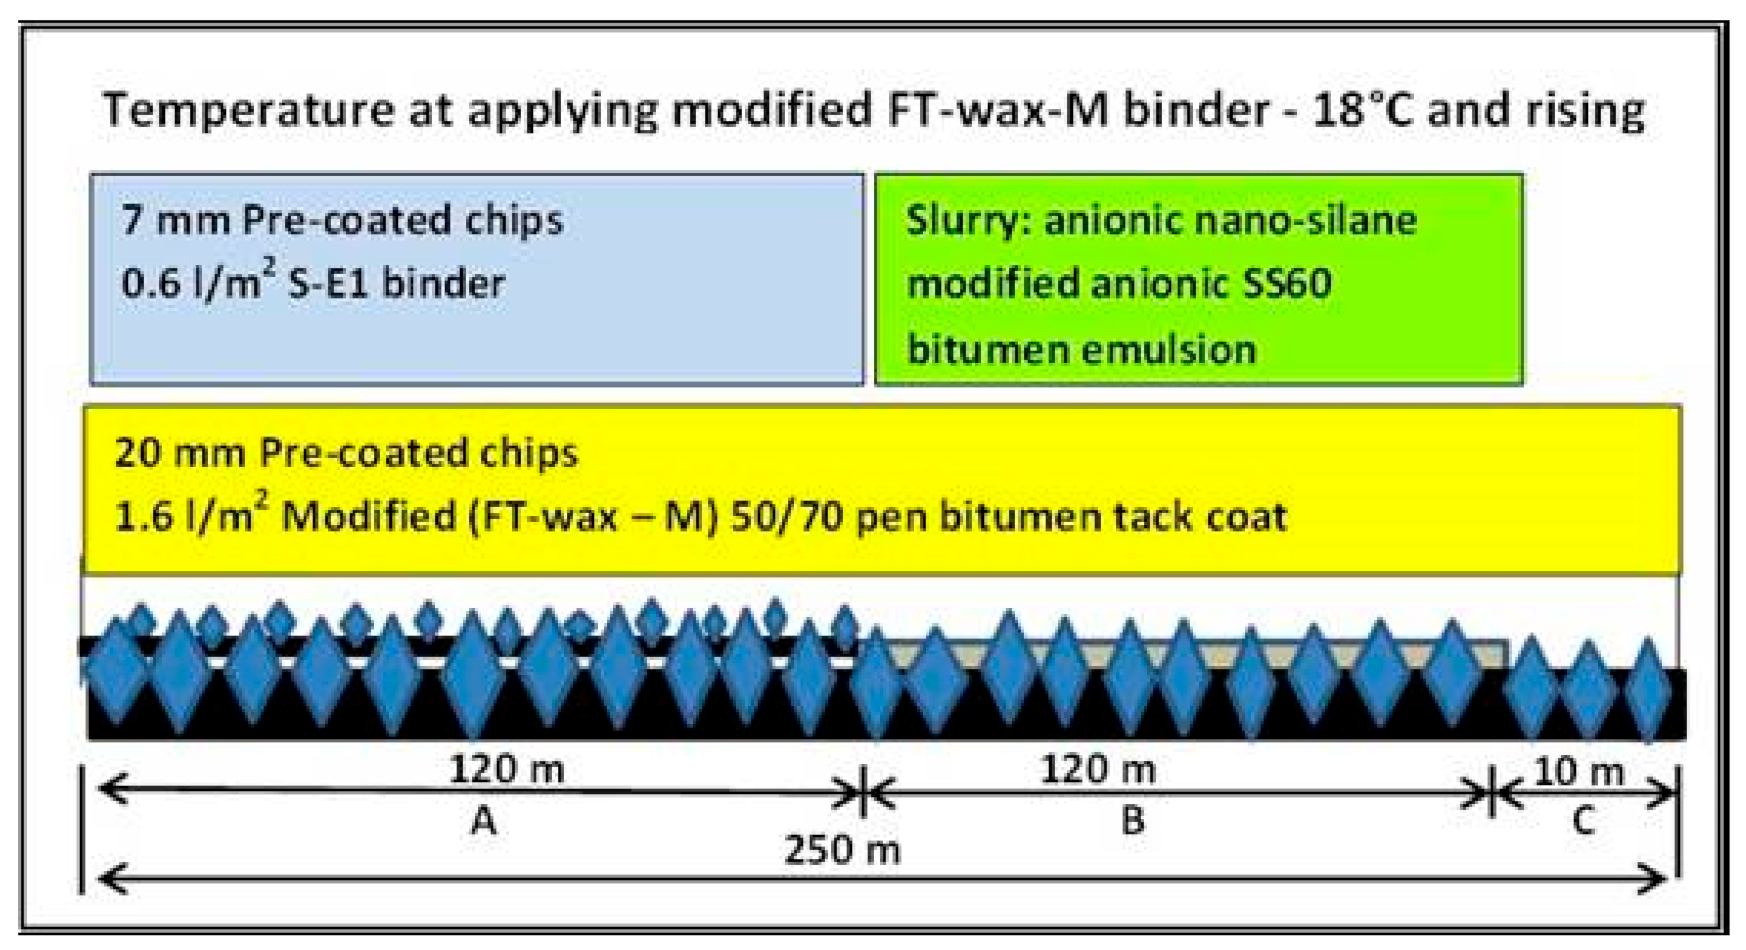
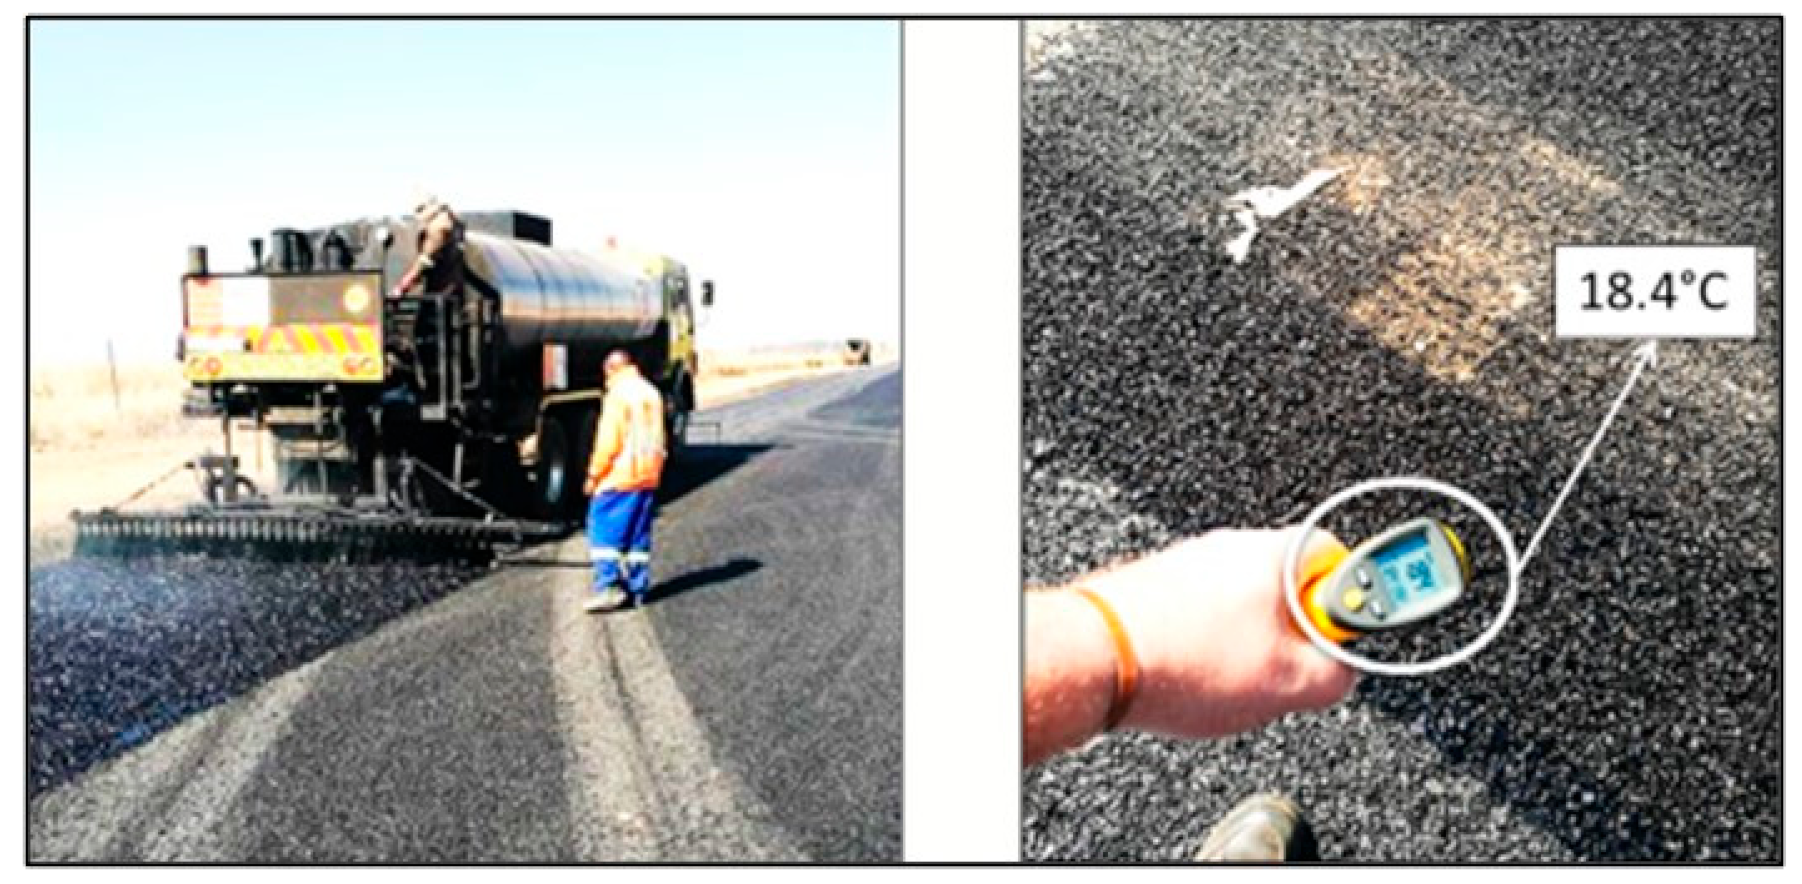
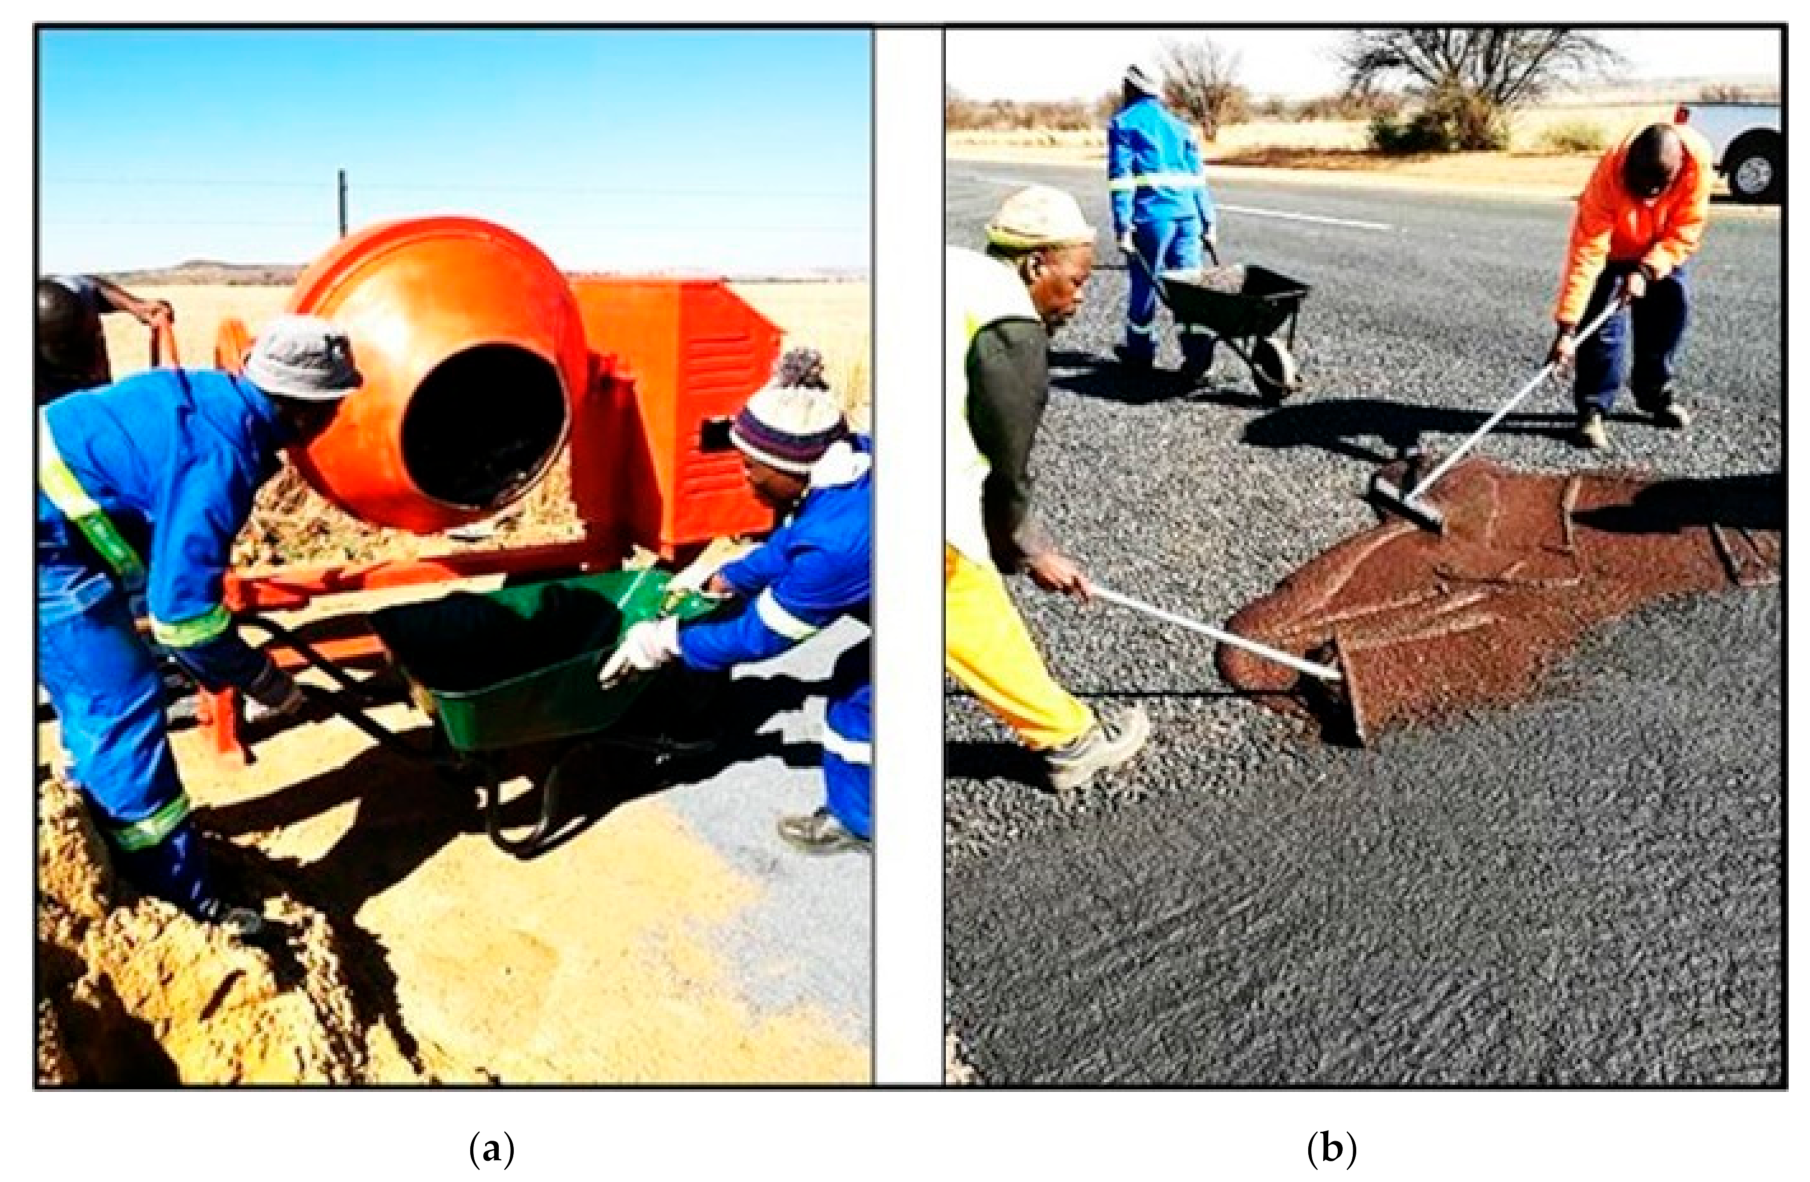
3.3. Seal Construction
4. Test Equipment and Protocols
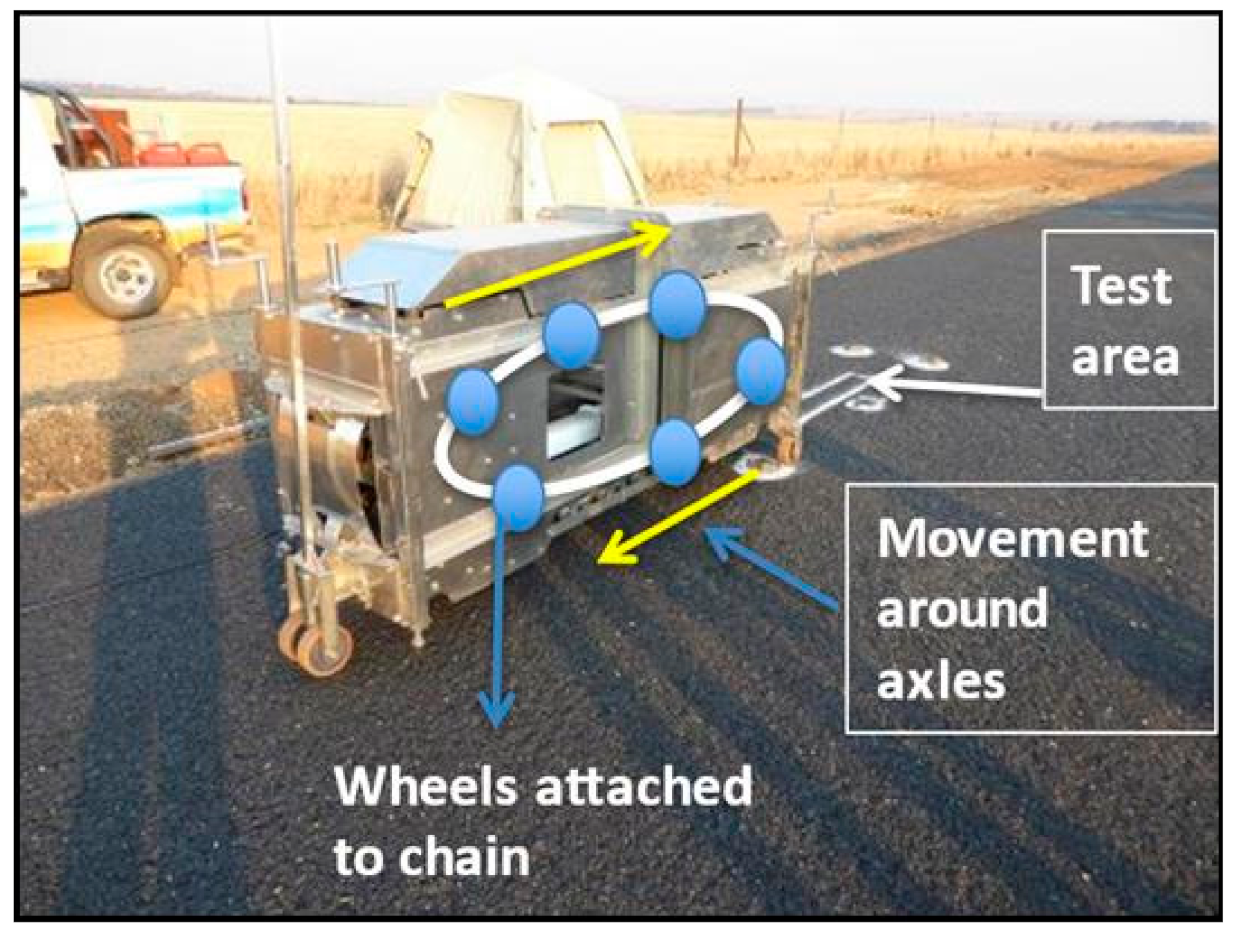
4.1. Novel Use of APT Equipment
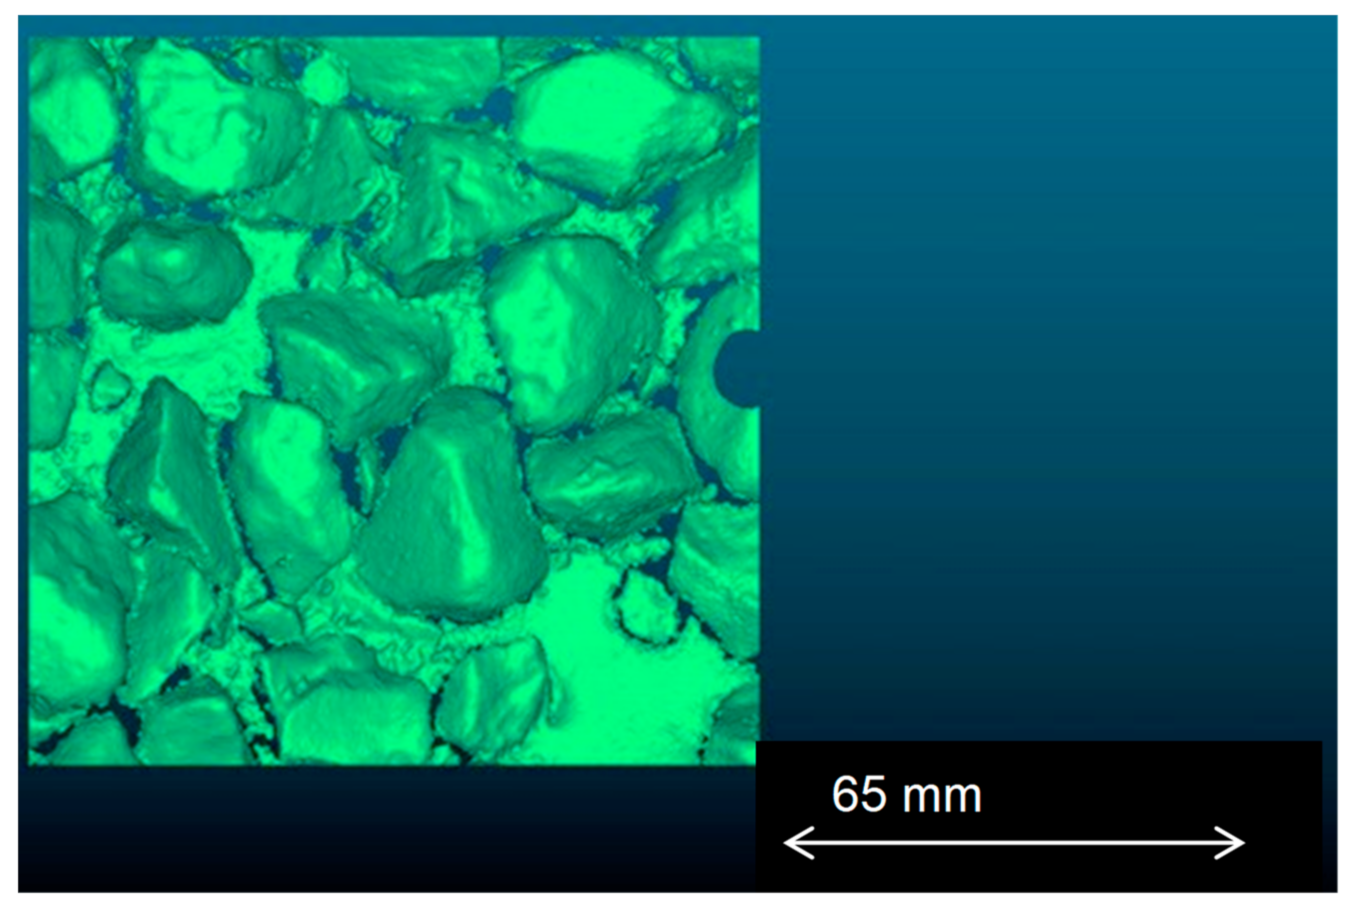
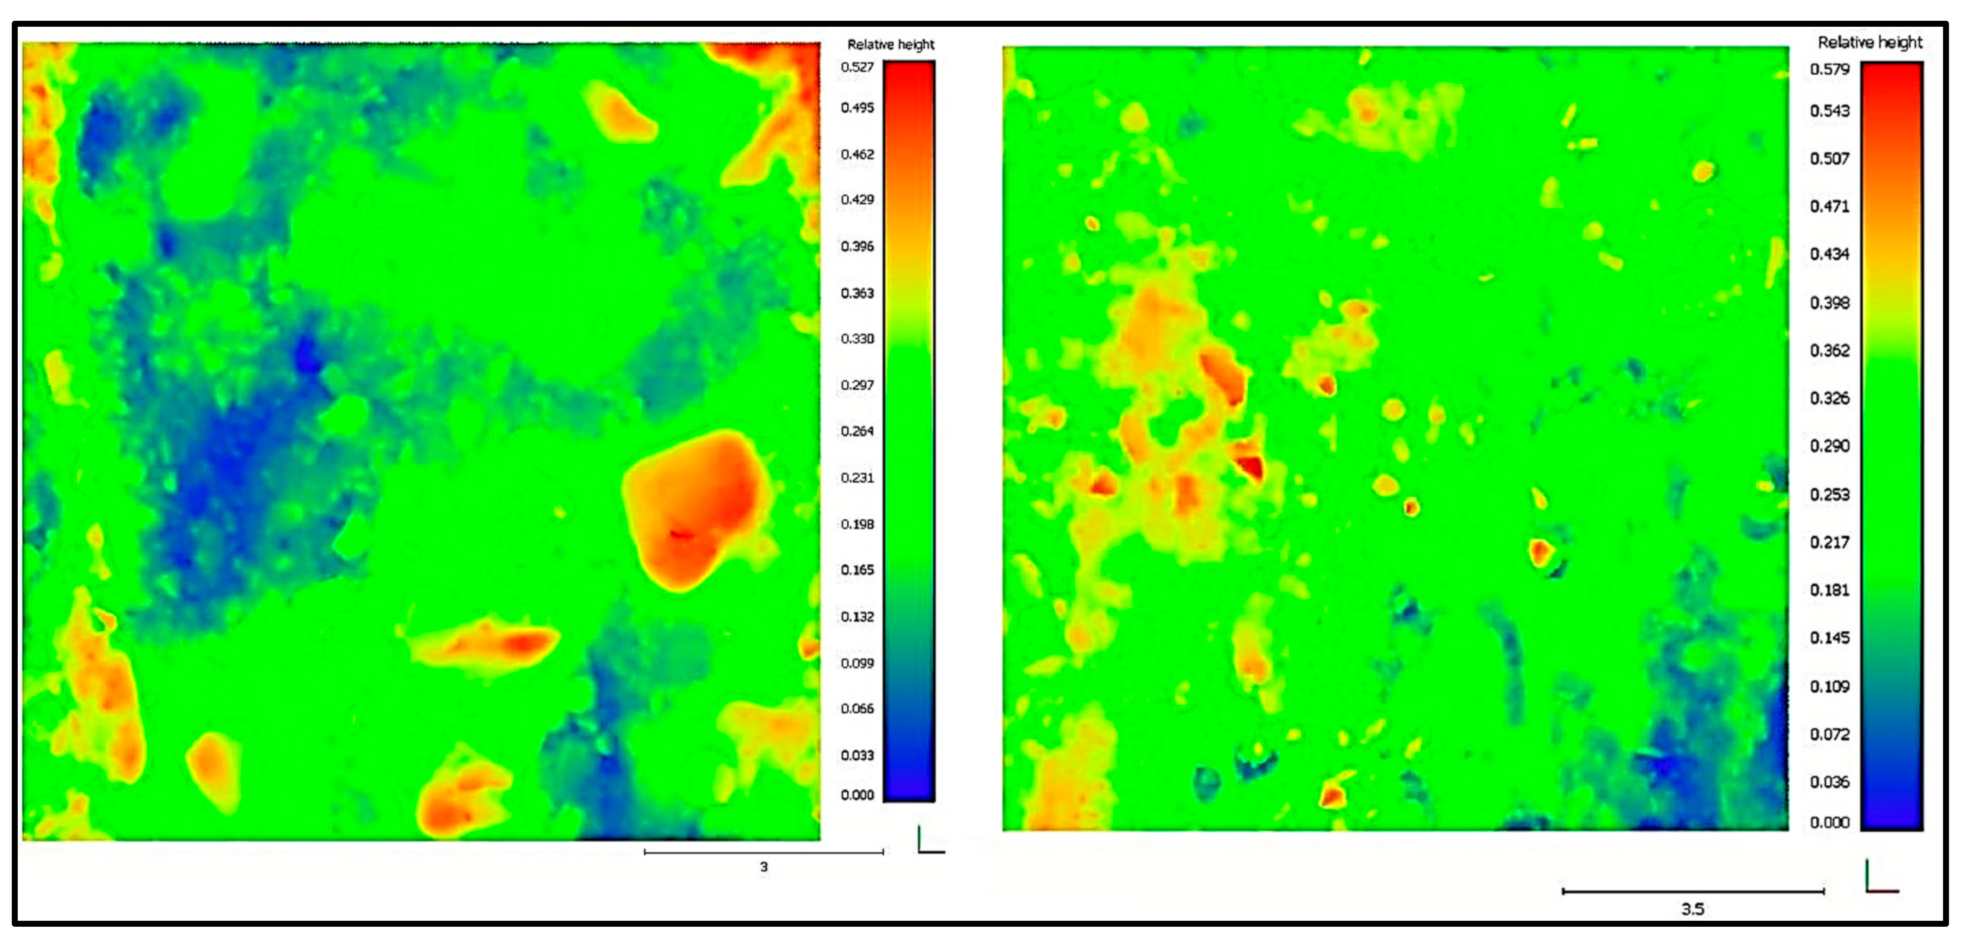
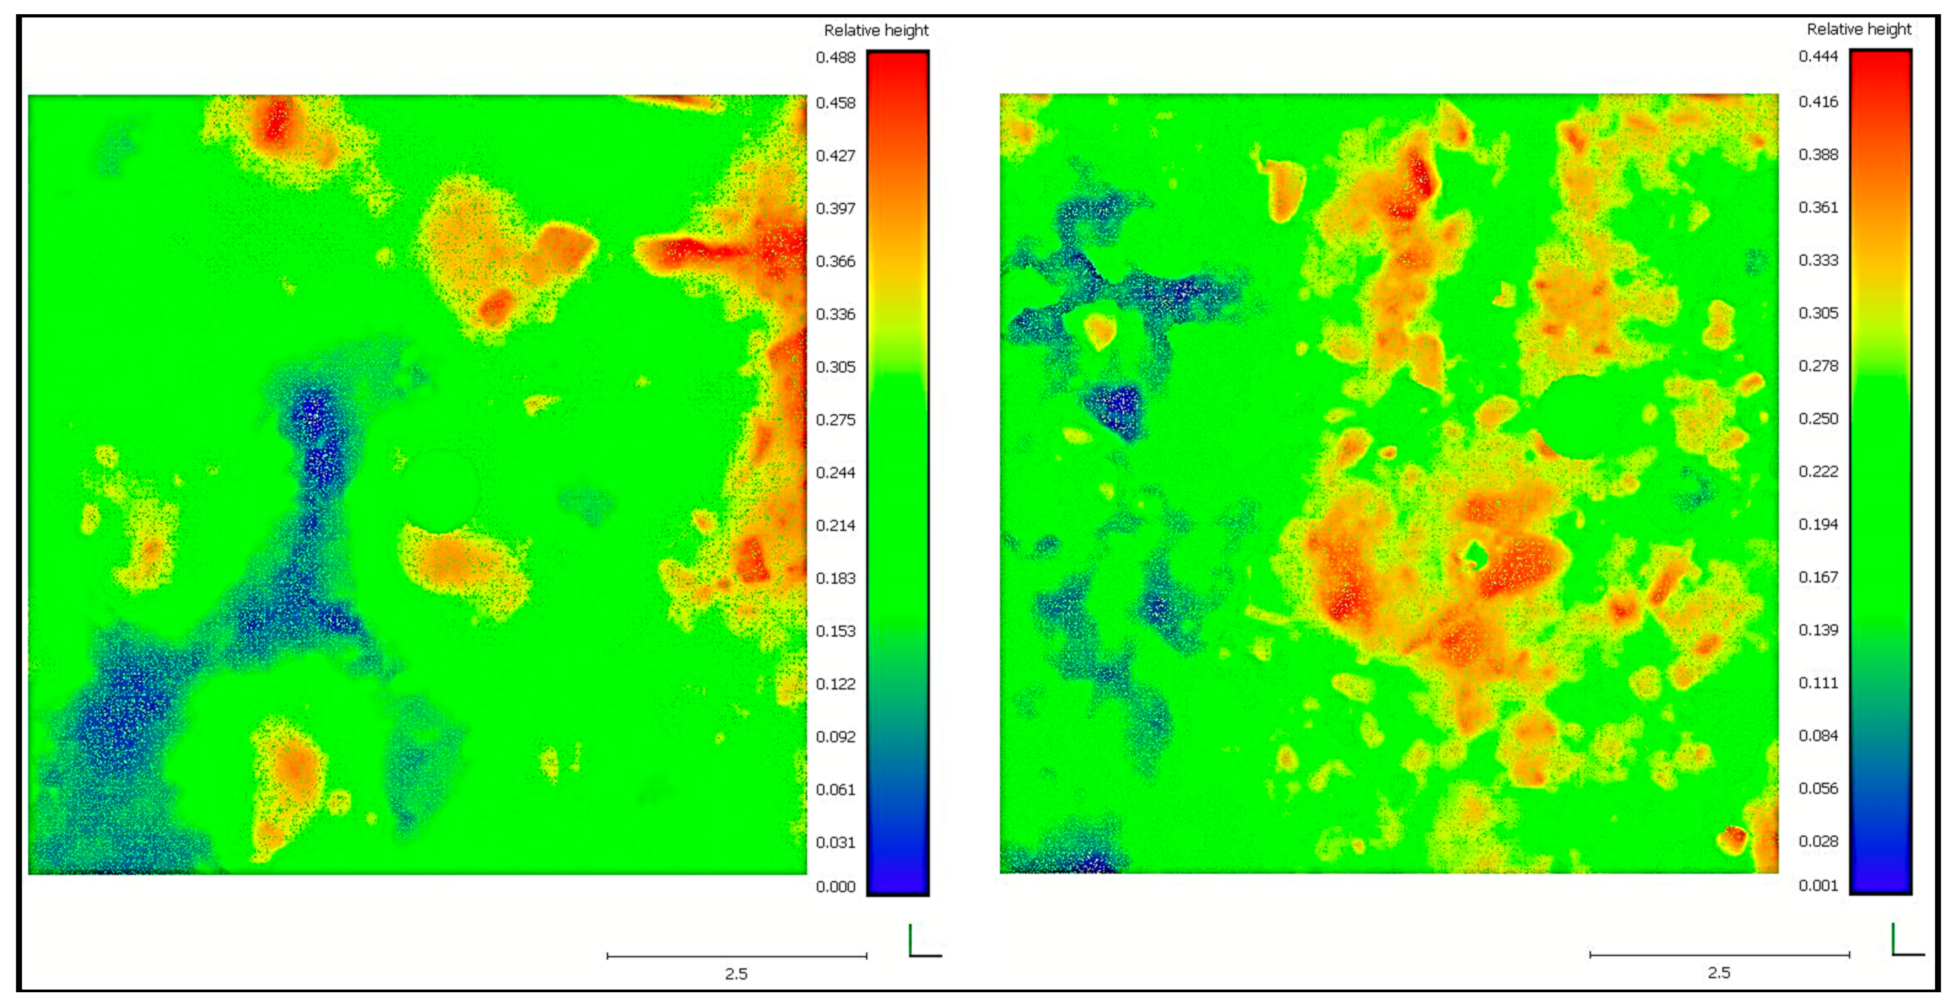
4.2. 3D Scanning to Determine Seal Surface Characteristics
4.3. Characterisation of the Chip Seal Surface Characteristics
5. APT Loading and Evaluation of the 3 Different Seals Using the MMLS3
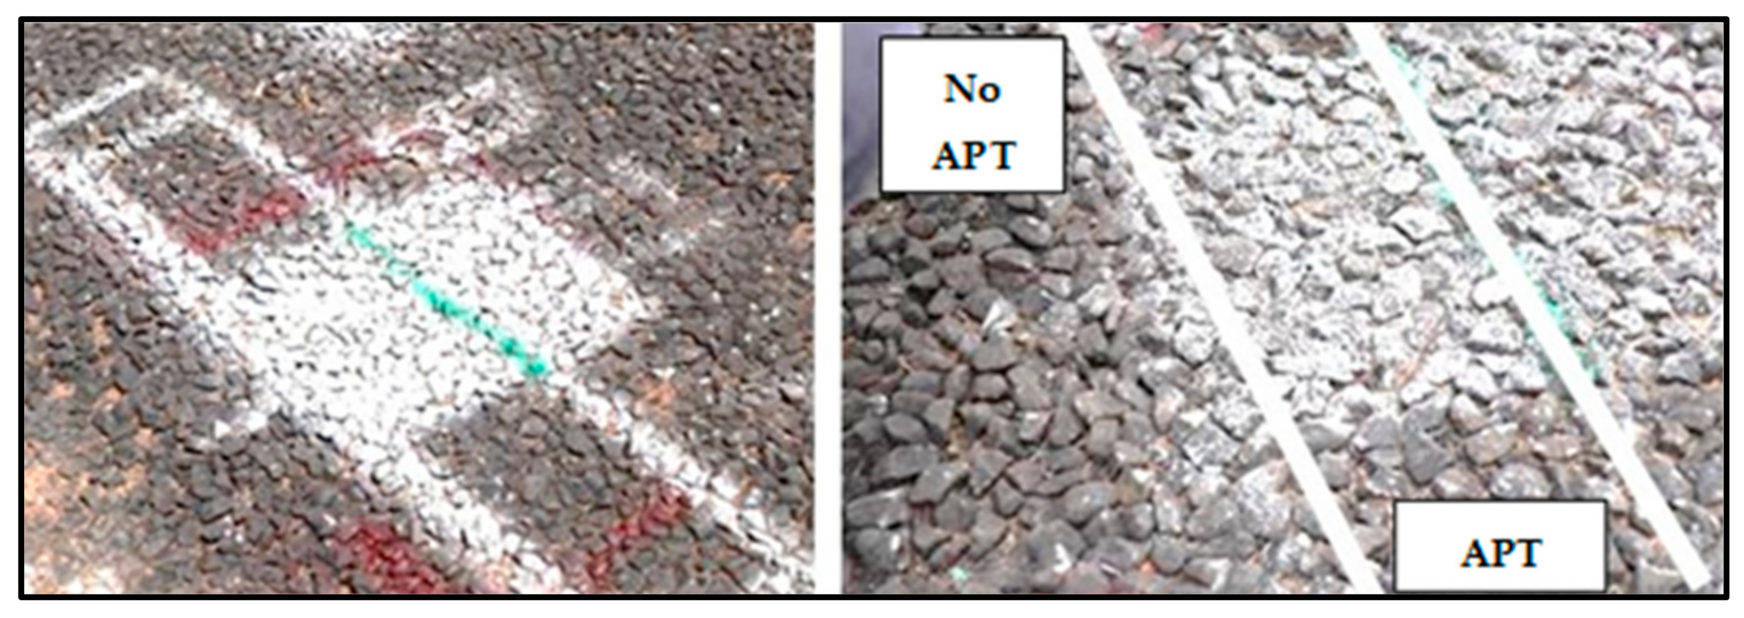
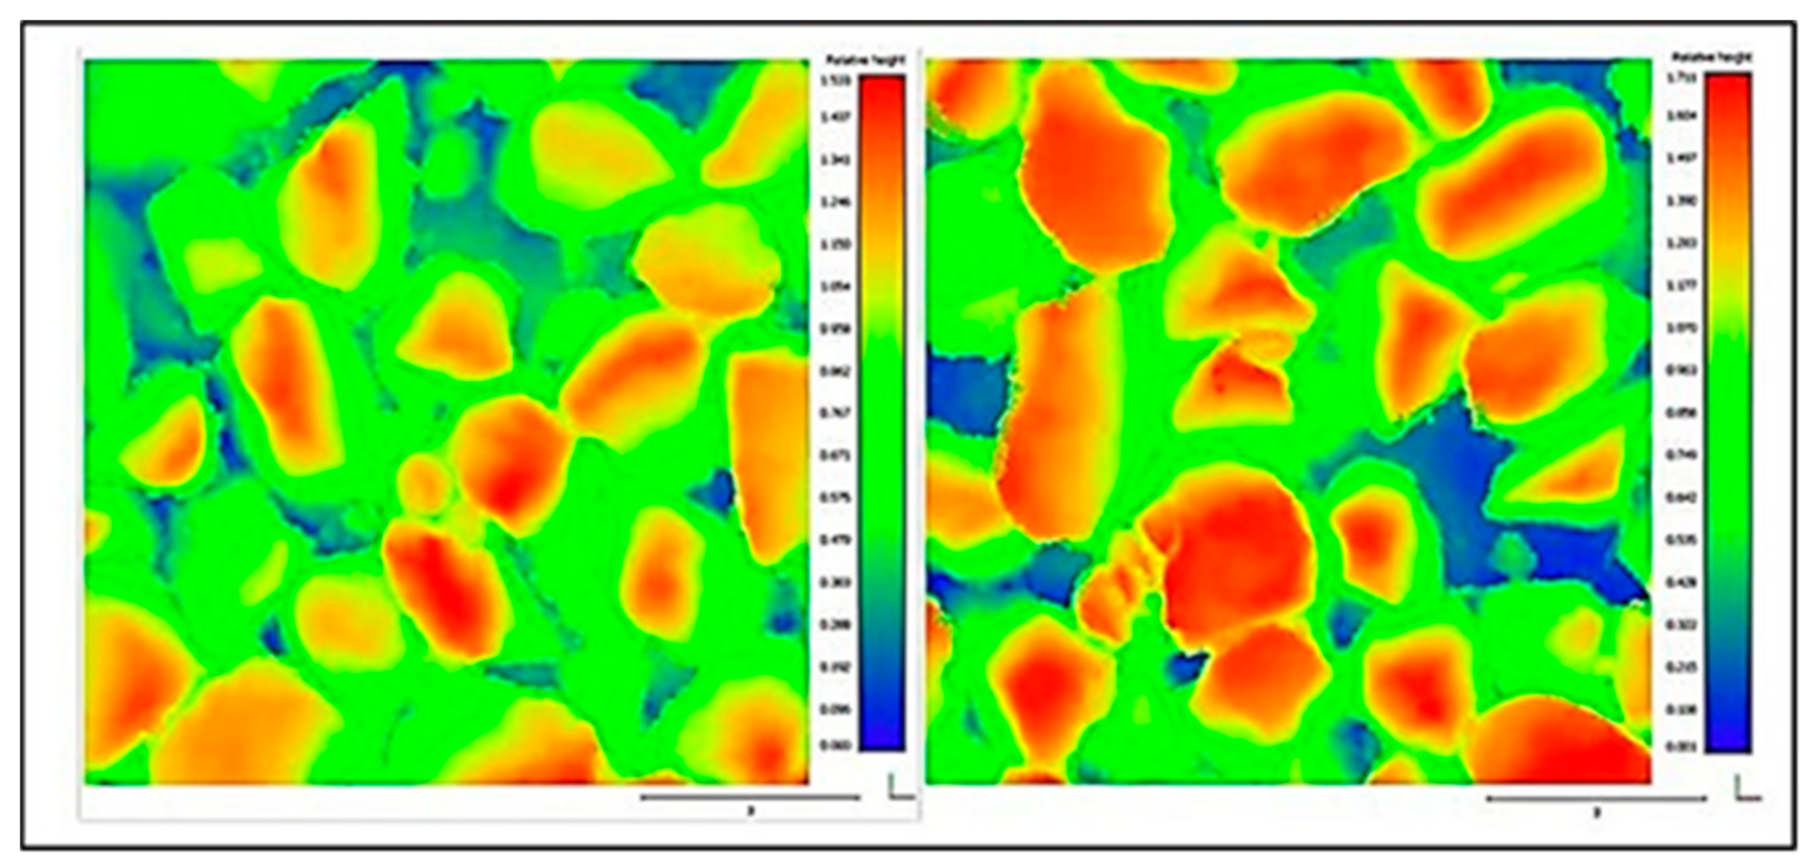
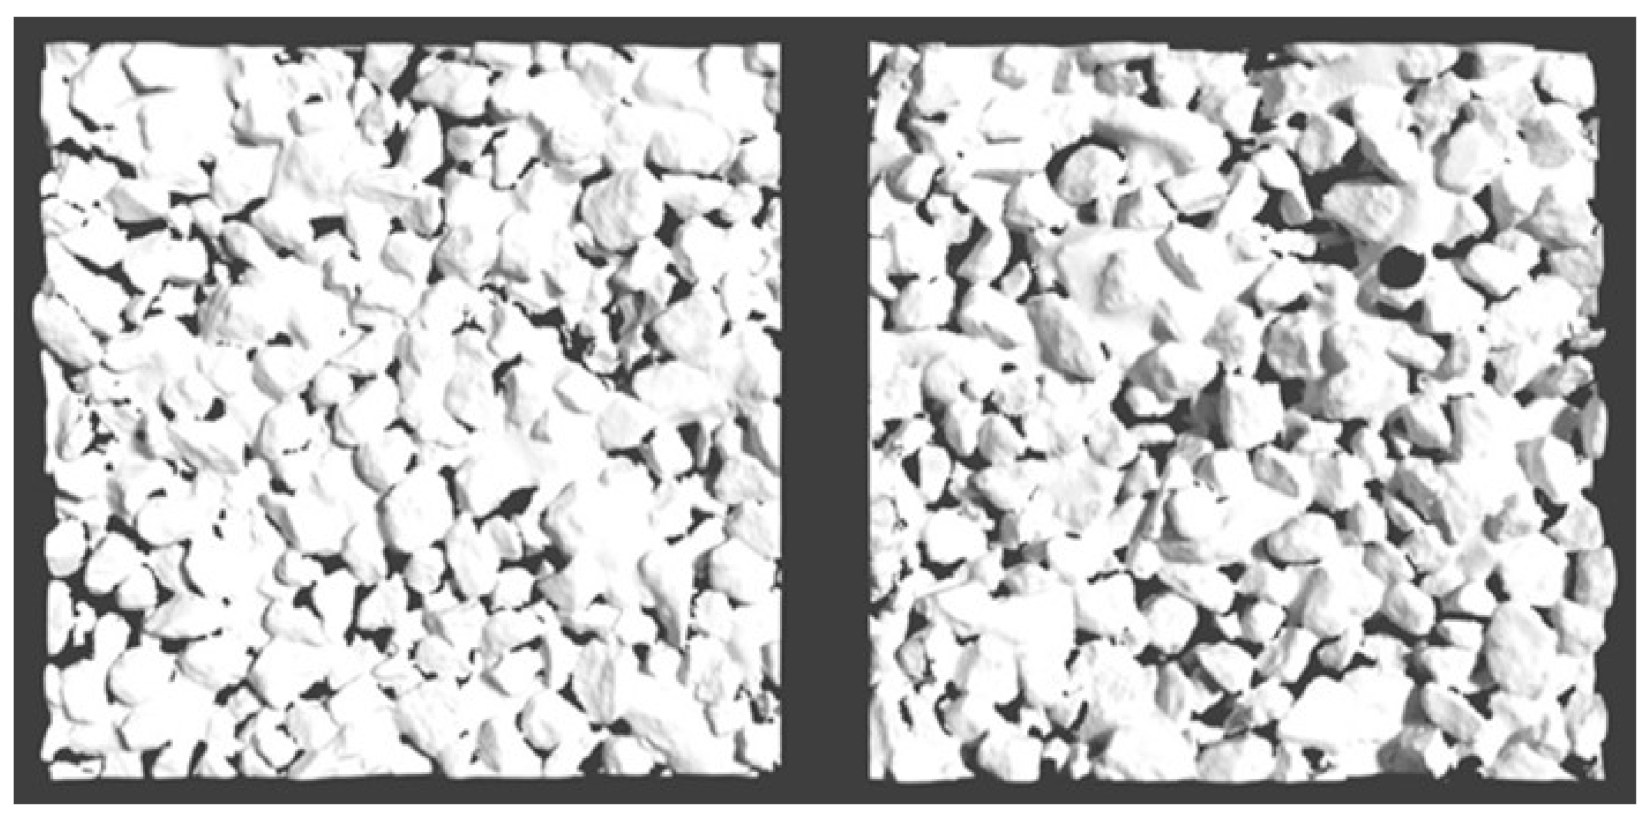
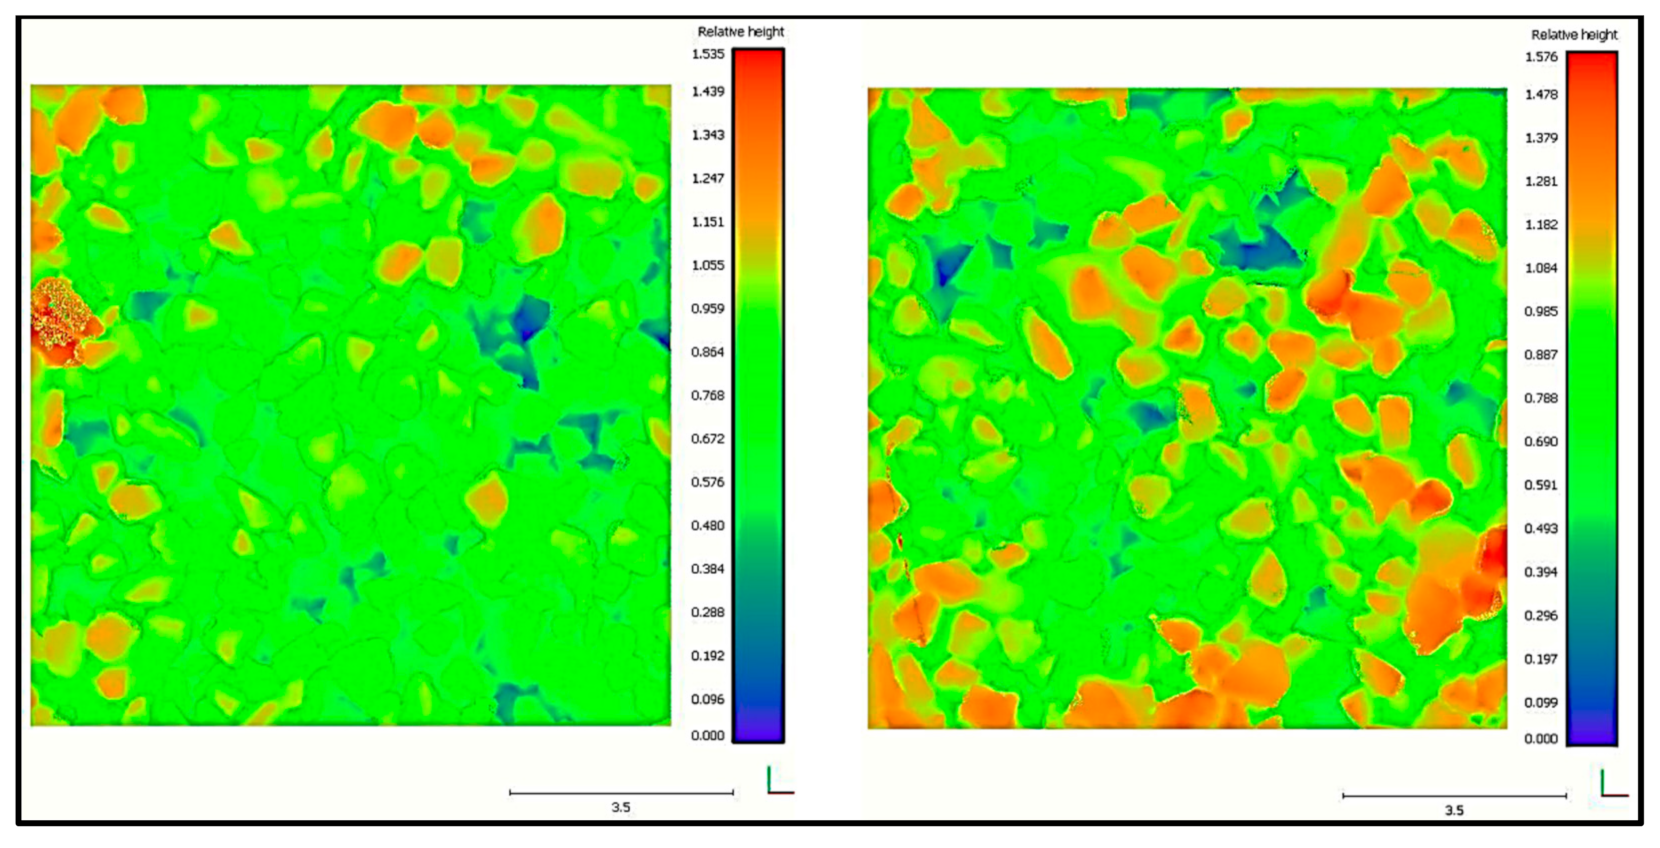
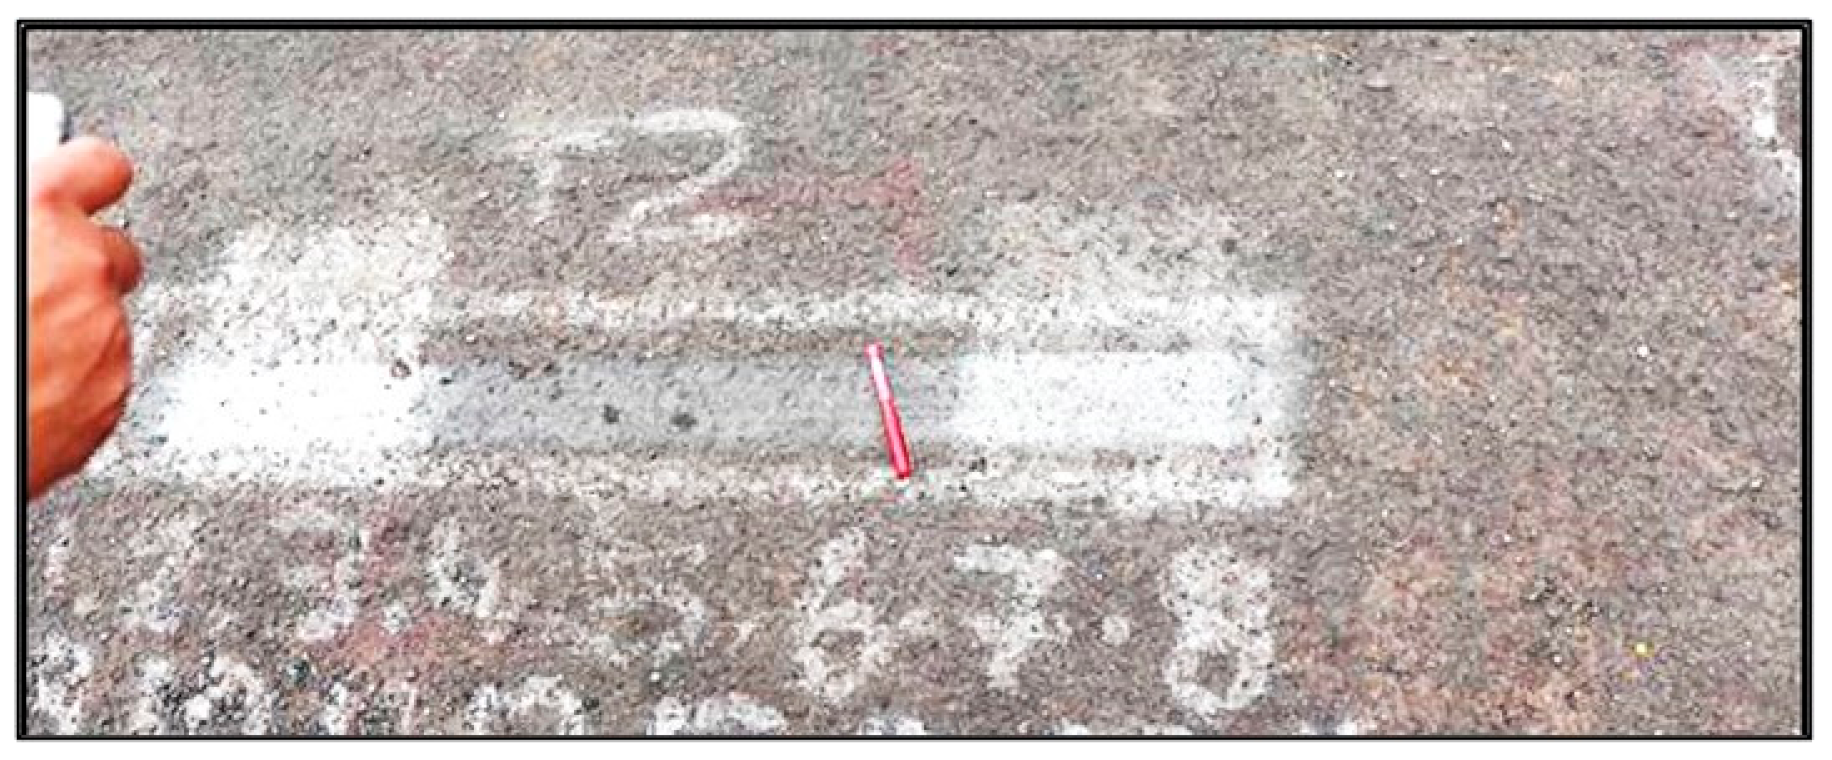
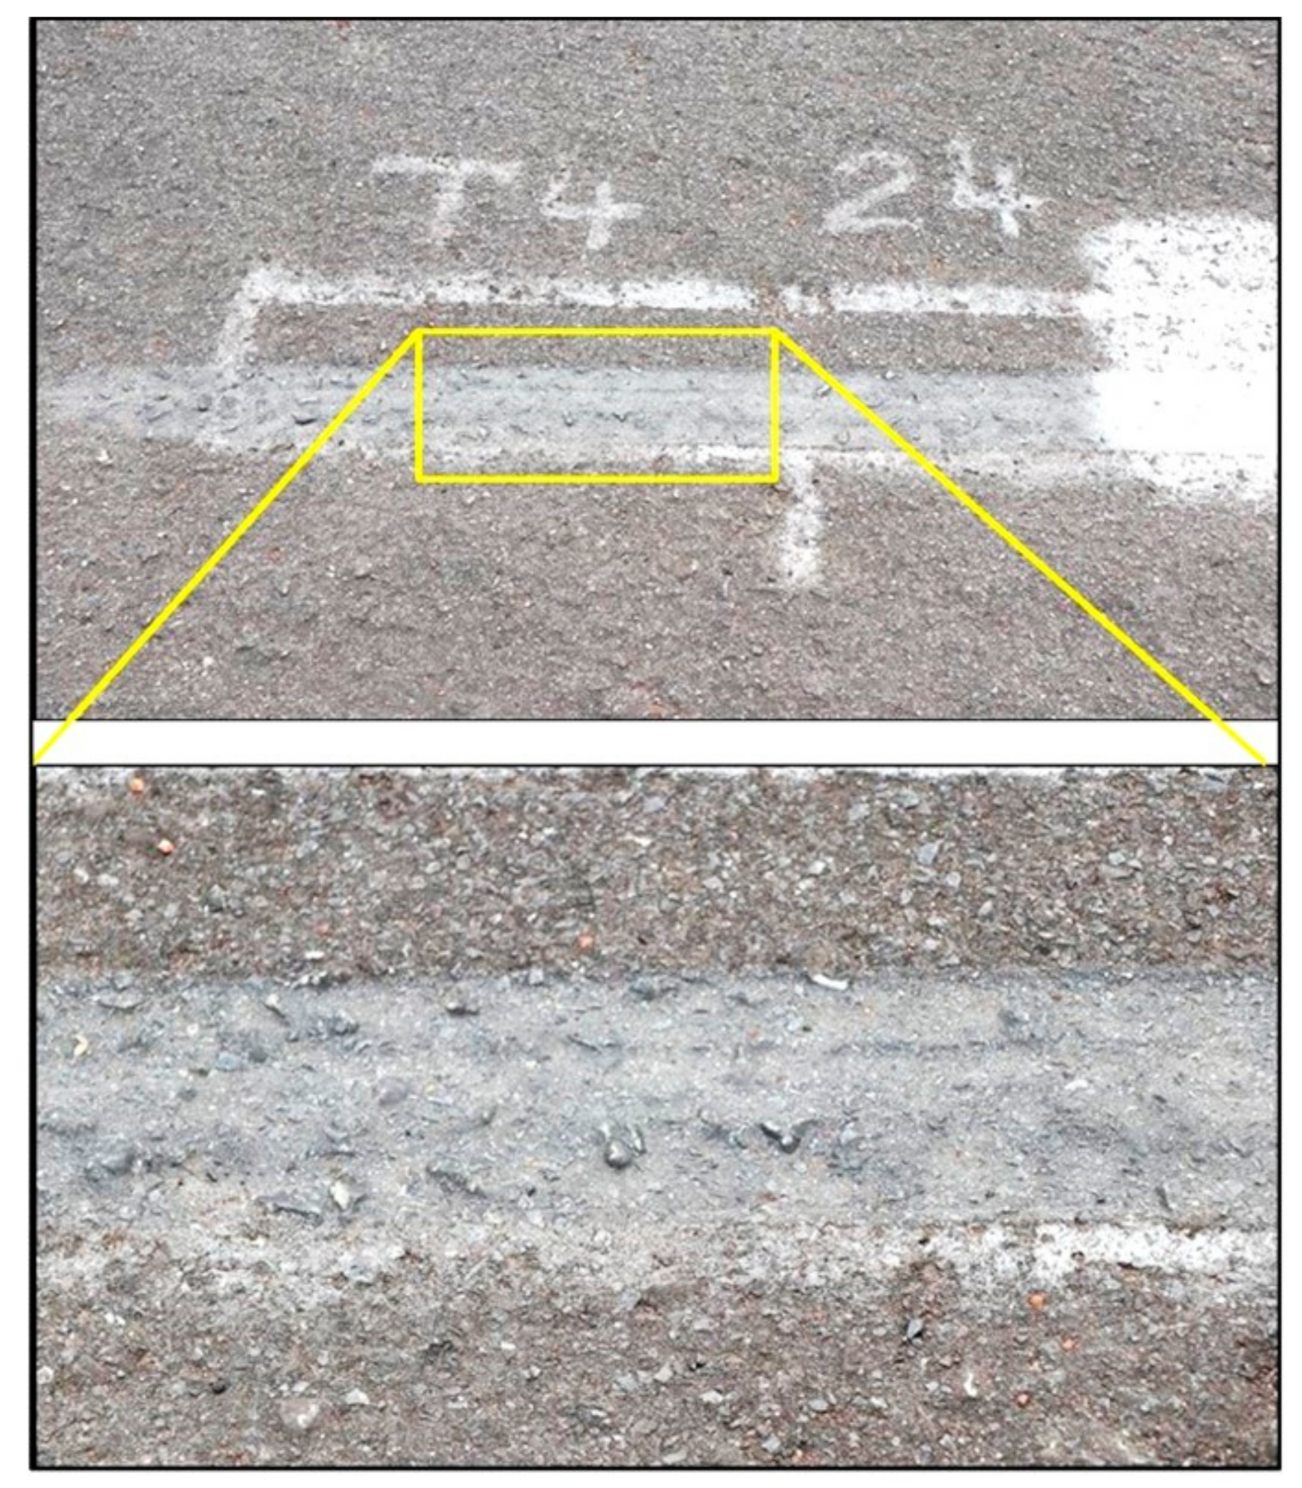
5.1. Comparing the 3D Scans of the Three Different Thin Surfacings Subjected to APT Loading with Adjacent Areas Subjected to No Loading
5.1.1. General
5.1.2. Single 20 mm Chip Seal with 1.5% SASOBIT-M®-Modified 60/70 Pen Bitumen
5.1.3. A 20/7 mm Double Seal with a SASOBIT-M® Tack Coat and an Elastomer-(SBS)-Modified (S-E2) Second Application Followed by a Fog Spray
5.1.4. A 20 mm Cape Seal with 1.5% SASOBIT-M®-Modified Tack Coat and an Anionic Nano-Silane-Modified Bitumen Emulsion Slurry without Any Cement/Lime Filler—First Test: 18,000 Repetitions Applied with the MMLS3 at Temperatures between 12 °C and 19 °C
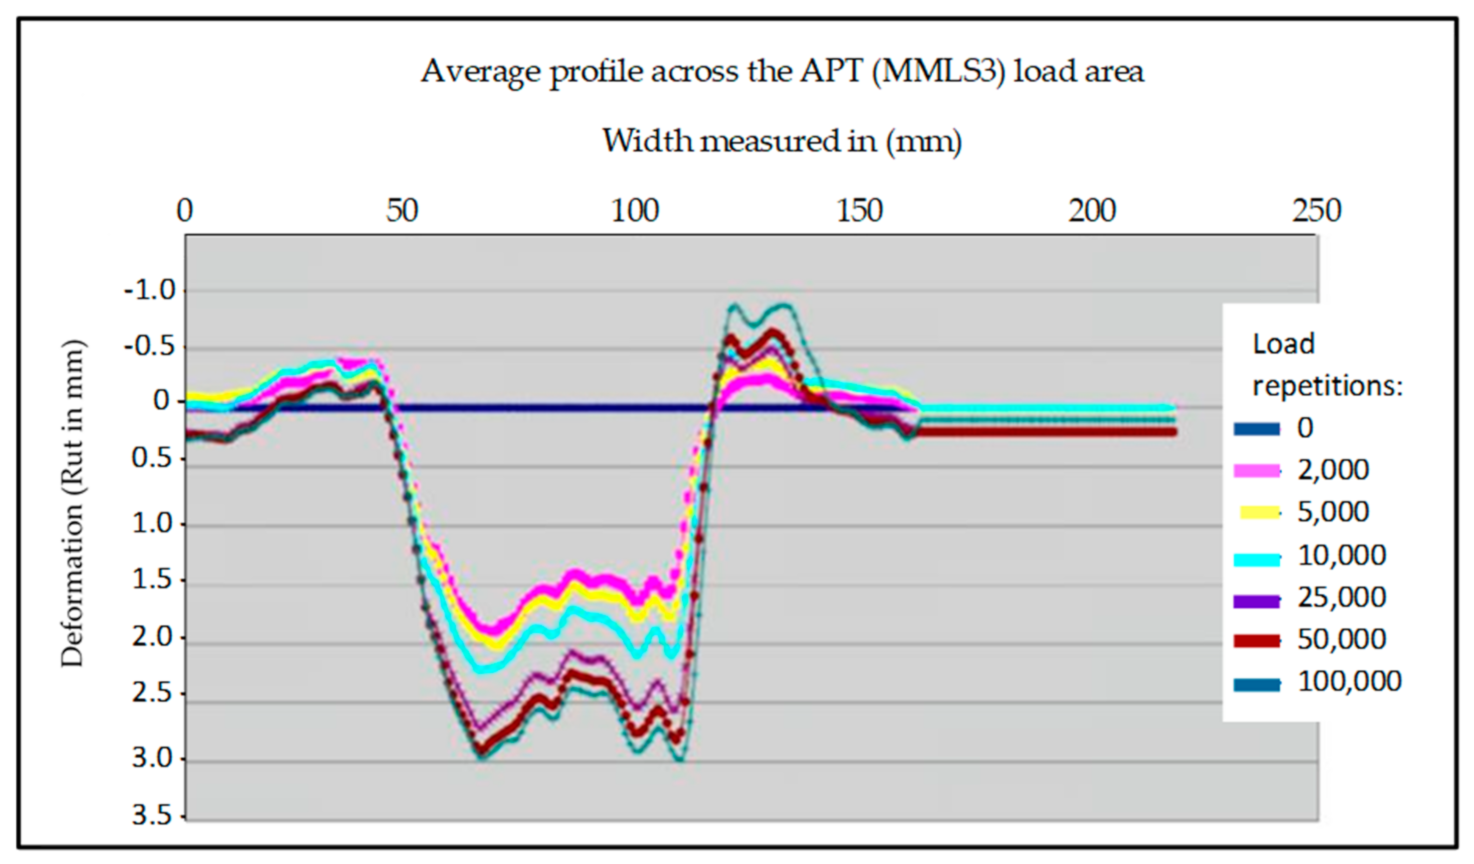
5.1.5. A 20 mm Cape Seal—Second Test: Full APT Loading—Standard 100,000 Repetitions Applied within 24 h with the MMLS3 at a Controlled Temperature of 50 °C
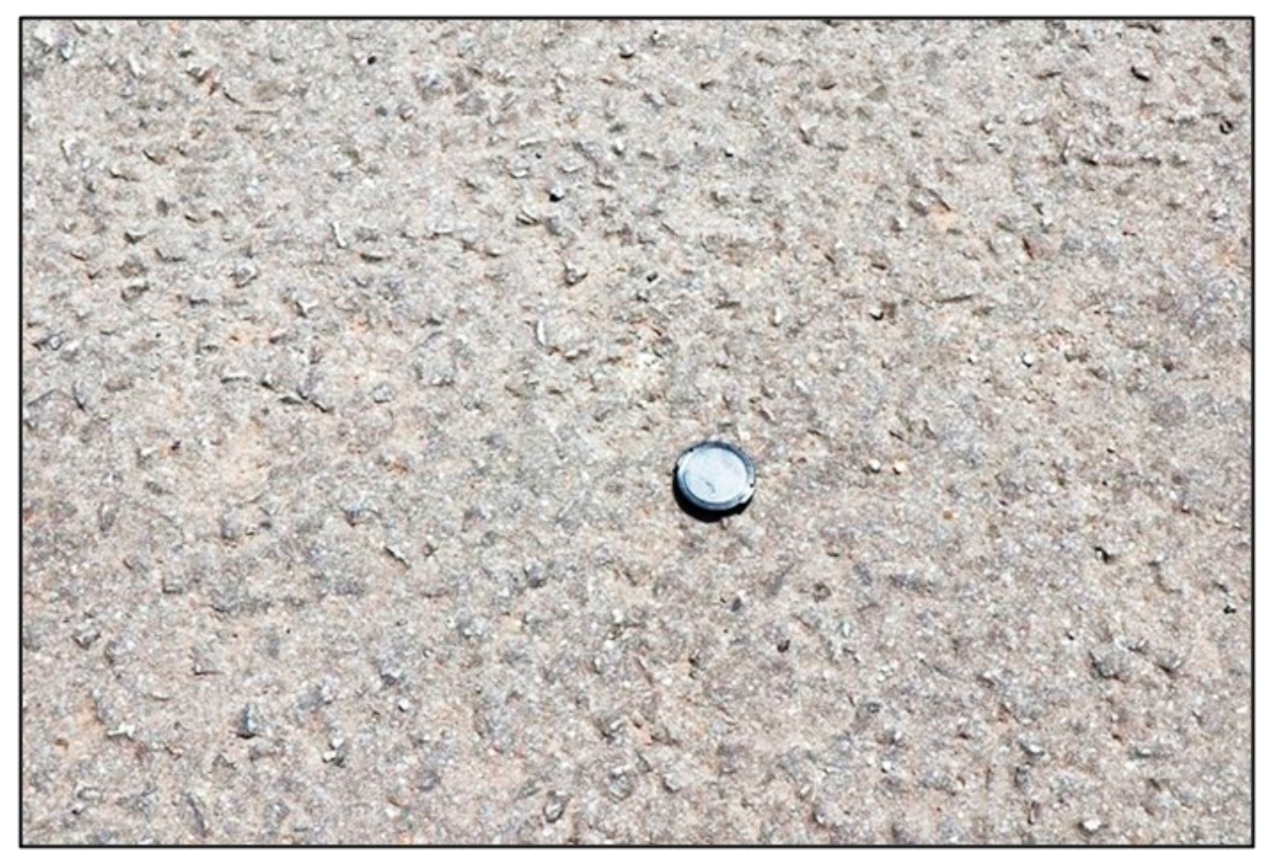
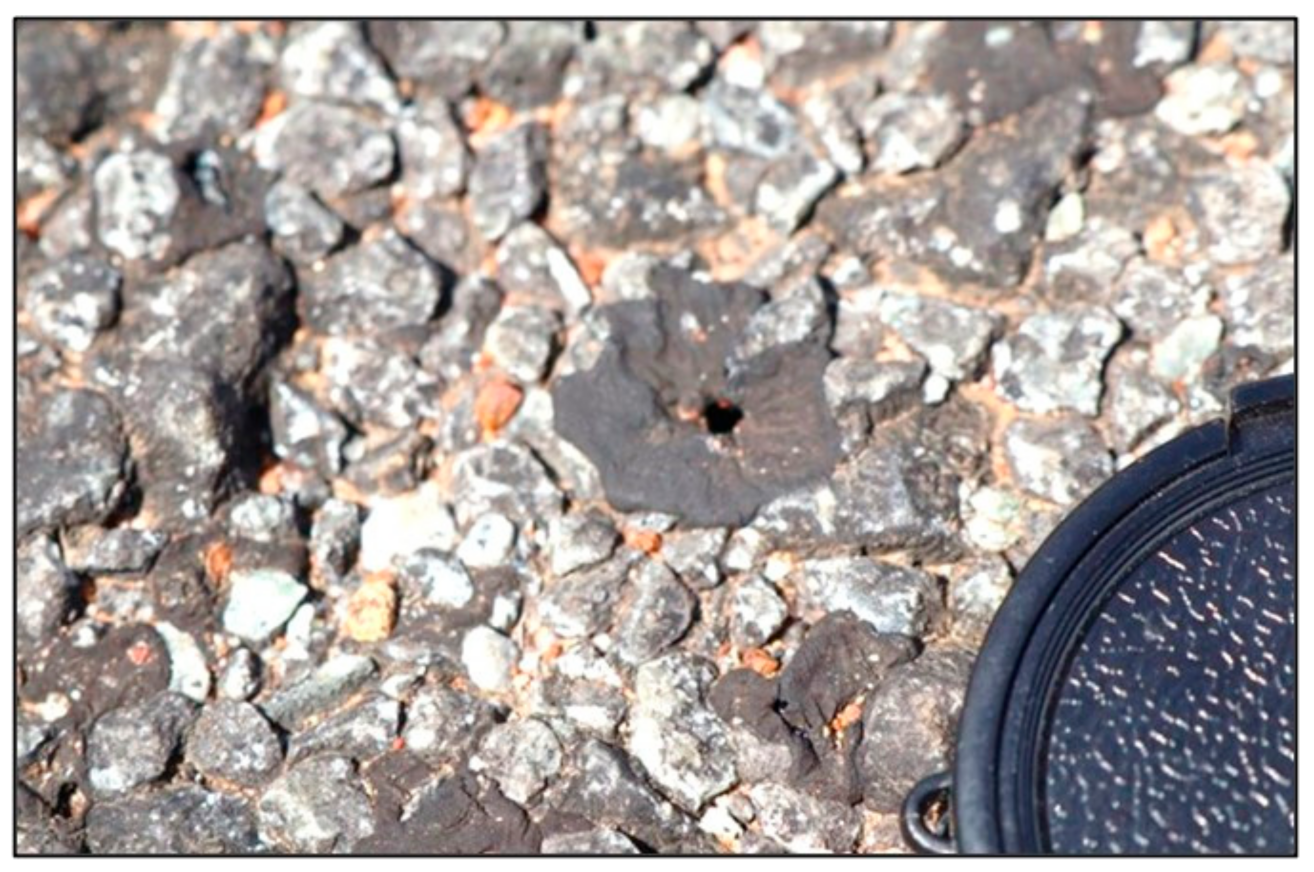
5.2. Visual Inspection: 19 March 2020
6. Summary of the Discussion of Results
7. Conclusions and Recommendations
Author Contributions
Funding
Institutional Review Board Statement
Informed Consent Statement
Data Availability Statement
Acknowledgments
Conflicts of Interest
References
- Southern Africa Transport and Communications Commission (SATCC). Guideline: Low-Volume Sealed Roads; Southern Africa Development Community (SADC), SADC House: Gaborone, Botswana, 2003; ISBN 99912-0-456-5. [Google Scholar]
- Jordaan, G.J.; Kilian, A. The Cost-effective Upgrading, Preservation and Rehabilitation of Roads—Optimising the Use of Available Technologies. In Proceedings of the Southern African Transport Convention (SATC 2016), CSIR, Pretoria, South Africa, 4–7 July 2016. [Google Scholar]
- Jordaan, G.J.; Kilian, A.; Muthivelli, N.; Dlamini, D. Practical Application of Nano-Technology in Roads in southern Africa. In Proceedings of the 8th Transportation Technology Transfer (T2) Conference, Lusaka, Zambia, 8–10 May 2017. [Google Scholar]
- Rust, F.C.; Alkhalwaya, I.; Jordaan, G.J.; Du Plessis, L. Evaluation of a nano-silane-modified emulsion stabilised base and subbase under HVS traffic. In Proceedings of the 12th Conference on Asphalt Pavements for Southern Africa (CAPSA 2019), Sun City, South Africa, 13–16 October 2019. [Google Scholar]
- Rust, F.; Smit, M.; Akhalwaya, I.; Jordaan, G.; Du Plessis, L. Evaluation of two nano-silane-modified emulsion stabilised pavements using accelerated pavement testing. Int. J. Pavement Eng. 2020, 1–14. [Google Scholar] [CrossRef]
- Jordaan, G.J.; Kilian, A.; Du Plessis, L.; Murphy, M. The development of cost-effective pavement design approaches using mineralogy tests with new nano-technology modifications of materials. In Proceedings of the Southern Africa Transportation Conference (SATC 2017), Pretoria, South Africa, 10–13 July 2017. [Google Scholar]
- Jordaan, G.J.; Steyn, W.J. A Comprehensive Guide to the Use of Applicable and Proven Nano-Technologies in the Field of Road Pavement Engineering Design and Construction; Department of Civil Engineering, University of Pretoria: Pretoria, South Africa, 2019; ISBN 978-0-620-83022-5. [Google Scholar]
- Jordaan, G.; Steyn, W. Fundamental Principles Ensuring Successful Implementation of New-Age (Nano) Modified Emulsions (NME) for the Stabilisation of Naturally Available Materials in Pavement Engineering. Appl. Sci. 2021, 11, 1745. [Google Scholar] [CrossRef]
- Li, J.; Luhr, D.R.; Russell, M.; Rydholm, T.; Uhlmeyer, J.S. Cost-Effective Performance Management for Washington State Pavement Assets. Transp. Res. Rec. J. Transp. Res. Board 2017, 2639, 102–109. [Google Scholar] [CrossRef]
- Khattak, M.J.; Baladi, G.Y. Development of Cost-Effective Treatment Performance and Treatment Selection Models; Louisiana Transportation Research Board Centre: Baton Rough, LA, USA, 2015; Available online: http://www.Itrc.Isu.edu/pdf/2015/FR518.pdf (accessed on 13 February 2021).
- SABITA. TG1: The Use of Modified Bituminous Binder in Road Construction, 3rd ed.; Southern African Bitumen Association (SABITA): Cape Town, South Africa, 2015; ISBN 978-1-874968-67-2. [Google Scholar]
- Porto, M.; Caputo, P.; Loise, V.; Eskandarsefat, S.; Teltayev, B.; Rossi, C.O. Bitumen and Bitumen Modification: A Review on Latest Advances. Appl. Sci. 2019, 9, 742. [Google Scholar] [CrossRef]
- Caputo, P.; Porto, M.; Angelico, R.; Loise, V.; Calandra, P.; Rossi, C.O. Bitumen and asphalt concrete modified by nanometer-sized particles: Basic concepts, the state of the art and future perspectives of the nanoscale approach. Adv. Colloid Interface Sci. 2020, 285, 102283. [Google Scholar] [CrossRef] [PubMed]
- Hugo, F.; Steyn, W.J.v.M. A synthesis of applications of the MLS as an innovative system for evaluating performance of asphalt materials in pavement engineering. In Proceedings of the 11th Conference on Asphalt Pavements for Southern Africa (CAPSA 2015), Sun City, South Africa, 16–19 August 2015. [Google Scholar]
- South African National Standards (SANS). 3001-PD1:2016 ED.1 Civil Engineering Test Methods Part PD1: Determination of Permanent Deformation and Moisture Sensitivity in Asphalt Mixes with the MMLS3; South African Bureau of Standards (SABS) Standards Division: Pretoria, South Africa, 2016. [Google Scholar]
- Steyn, W.J.v.d.M.; Broekmam, A.; Jordaan, G.J. Digital twinning of asphalt pavement surfacings using Visual Simultaneous Localization and Mapping. In Proceedings of the 2nd International Conference on Advances in Materials and Pavement Performance Prediction (AM3P 2020), San Antonio, TX, USA, 27–29 May 2020. [Google Scholar] [CrossRef]
- American Society for Testing Materials ASTM Standard D698. Standard Test Methods for Laboratory Compaction Characteristics of Soil Using Standard Effort; ASTM International: West Conshohocken, PA, USA, 2007. [Google Scholar] [CrossRef]
- American Society for Testing Materials ASTM Standard D1557. Standard Test Methods for Laboratory Compaction Characteristics of Soil Using Modified Effort; ASTM International: West Conshohocken, PA, USA, 2009. [Google Scholar] [CrossRef]
- National Transport Commission. Technical Methods for Highways TMH1: Standard Methods of Testing Road Construction Materials; Committee for State Road Authorities, Department of Transport: Pretoria, South Africa, 1986.
- Committee of Land Transport Officials (COLTO). Guidelines for Road Construction Materials; South African Institution of Civil Engineers (SAICE): Halfway House, South Africa, 1985. [Google Scholar]
- American Association of State and Highway Transportation Officials (AASHTO). M145-91: Standard Specification for Classification of Soils and Soil-Aggregate Mixtures for Highway Construction Purposes; American Association of State Highway and Transportation Officials (AASHTO): Washington, DC, USA, 1995. [Google Scholar]
- American Society for Testing Materials (ASTM). D3282-09: Standard Practice for Classification of Soils and Soil-Aggregate Mixtures for Highway Construction Purposes; ASTM: Pennsylvania, PA, USA, 2009. [Google Scholar]
- Jordaan, G.J.; Steyn, W.J.v.M. Cost-Effective Upgrading of Gravel Roads Using Naturally Available Materials with New-Age Modified Emulsion (Nme) Stabilisation; Department of Civil Engineering, University of Pretoria: Pretoria, South Africa, 2020; ISBN 978-0-620-91415-4. [Google Scholar]
- Asphalt Academy. Technical Guideline (TG2): Bitumen Stabilised Materials—A Guideline for the Design and Construction of Bitumen Emulsion and Foamed Bitumen Stabilised Materials; Asphalt Academy c/o CSIR Built Environment: Pretoria, South Africa, 2009. [Google Scholar]
- Van Zyl, G.D.; Fourie, H.G. Key aspects of good performing Cape seals. In Proceedings of the 11th Conference on Asphalt Pavements for Southern Africa (CAPSA 2015), Sun City, South Africa, 16–19 August 2015. [Google Scholar]
- Jordaan, G.J. Life-cycle cost analysis—An integral part of pavement rehabilitation design. In Proceedings of the 10th Conference on Asphalt Pavements for Southern Africa, Drakensberg, South Africa, 11–14 September 2011. [Google Scholar]
- Committee of Land Transport Officials (COLTO). Standard Specifications for Road and Bridge Works for State Road Authorities; Civil Engineering Advisory Committee (CEAC): Pretoria, South Africa, 1998. [Google Scholar]
- Van Zyl, G.D.; Fourie, H.G.; Bredenhann, S.J. Recommended practice for winter sealing in South Africa. In Proceedings of the 11th Conference on Asphalt Pavements for Southern AFRICA (CAPSA 2015), Sun City, South Africa, 16–19 August 2015. [Google Scholar]
- Jordaan, G.J.; Steyn, W.J.v.d.M.; Broekman, A. Evaluation of novel chip seals applications during periods of low temperatures. In Proceedings of the 12th Conference on Asphalt pavements for southern Africa (CAPSA 2019), Sun City, South Africa, 13–16 October 2019. [Google Scholar]
- SASOL. SASOL Wax; SASOL: Johannesburg, South Africa, 2011. [Google Scholar]
- Hurley, G.C.; Powell, B.D. Evaluation of Sasobit for Use in Warm Mix Asphalt; NCAT Report 05-06 National Centre for Asphalt Technology; National Centre for Asphalt Technology: Auburn, Alabama, 2005.
- Wasiuddin, N.M.; Saha, R.; King, W.; Mohammed, L. Effects of Temperature and Shear rate on Viscosity of Sasobit-Modified Binders. Int. J. Pavement Res. Technol. 2012, 5, 369–378. [Google Scholar]
- Jordaan, G.J.; Oerlemans, R.P.; Biekart, H.; Masuku, F.; Kilian, A. Rehabilitation of the N14/1 highway: Use of a modified binder in the asphalt surfacing for construction at low temperatures. In Proceedings of the 11th Conference on Asphalt Pavements for Southern AFRICA (CAPSA 2015), Sun City, South Africa, 16–19 August 2015. [Google Scholar]
- SASOL. Sasobit REDUX—Product Information and Summary of Results; SASOL: Johannesburg, South Africa, 2016. [Google Scholar]
- Sengoz, B.; Topal, A.; Tanyel, A. Comparison of Pavement Surface Texture Determination by Sand Patch Test and 3D Laser Scanning. Period. Polytech. Civ. Eng. 2012, 56, 73–78. [Google Scholar] [CrossRef]
- American Society for Testing Materials (ASTM). Standard Practice for Calculating Pavement Macro-Texture Mean Profile Depth; ASTM E 1845-01; American Society for Testing Materials (ASTM): Pennsylvania, PA, USA, 2003. [Google Scholar]
- American Society for Testing Materials (ASTM). Standard Test Method for Measuring Pavement Macro-Texture Depth Using A Volumetric Technique; ASTM E 965-96; American Society for Testing Materials (ASTM): Pennsylvania, PA, USA, 2006. [Google Scholar]


| Material 1 | Material Classification | ||||
|---|---|---|---|---|---|
| NME1 | NME2 | NME3 | NME4 | ||
| Minimum material requirements before stabilisation and/or treatment (Natural materials) | |||||
| Material 1 specifications (minimum) Un-stablished material: Soaked CBR 2 (%) (Mod. AASHTO) | CS/GS/NG/SSSC | >45 2 (95%) | >25 2 (95%) | >10 2 (93%) | >7 2 (93%) |
| ACV < 30% | |||||
| Grading Modulus (GM) | NG | >1.8 | >1.5 | - | - |
| Sieve analysis: % < 0.075 mm (P0.075) | ALL | <20% | <25% | <35% | <50% |
XRD scans:
| ALL ALL | √ √ | √ √ | √ √ | √ √ |
| % Material passing 2 µm (P0.002) (e.g., Clay & Mica & Talc) as a % of Material (with Talc < 10%) (XRD-scans of the material passing the 0.075 mm sieve is used to determine the % clay, mica and talc in the material—In this case P0.002 = P0.075 × (Pclay,etc. in P0.075), or % Silt and Clay | NME stabilisation with micro-meter (µm) emulsion particle sizes | ||||
| ALL | <15% | <15% | <15% | <15% | |
| NME stabilisation with emulsion containing micro-scale as well as nano-scale particles (adjusted according to material grading) | |||||
| ALL | NA | <35% | <35% | <35% | |
| NME stabilisation with emulsion containing nano-scale and pico-scale particles (grading adjustments) together with technologies addressing workability of materials on site | |||||
| ALL | NA | NA | >35% | >35% | |
| Material specifications after stabilisation and/or treatment | |||||
| In-situ density to be required after stabilisation and compaction (mod. AASHTO) (%) (minimum) | Base | >100% | >100% | >98% | >97% |
| Sub-base | NA | >98% | >97% | >95% | |
| DCP (DN mm/blow) (Quality control) (stabilised and compacted) | NA | NA | <2.6 | <3.5 | |
| Mod. AASHTO density (%) (for laboratory testing) | >100% | >100% | >100% | >100% | |
| * UCSwet (kPa) (150 mm Φ Sample) | Design 3 | >2500 | >1500 | >1000 | >750 |
| Construction 4 | >2200 | >1200 5 | >700 5 | >450 5 | |
| Retained Compressive Strength (RCS): (UCSwet/UCSdry) (%) | >85 | >75 | >70 | >65 | |
| RCS in relation to minimum UCSwet(criteria) (RCSeffective) (%) | >100 | >100 | >100 | >100 | |
| * ITSwet (kPa) (150 mm Φ Sample) | Design 3 | >240 | >200 | >160 | >120 |
| Construction 4 | >220 | >180 5 | >140 5 | >100 5 | |
| Retained Tensile strength (RTS): ITSwet/ITSdry (%) | >85 | >75 | >70 | >65 | |
| RTS in relation to minimum ITSwet(criteria) (RTSeffective) (%) | >100 | >100 | >100 | >100 | |
| Parameter | APT Loading | No Loading |
|---|---|---|
| Solid volume (VT) (cm3) | 156.22 | 178.88 |
| Sample area (cm2) | 100.2 | 100.2 |
| Largest height difference (mm) | 15.6 | 17.9 |
| Aggregate volume (Vs) (cm3) | 84.83 | 110.40 |
| Void volume (Vv) (cm3) | 71.39 | 68.48 |
| Void ratio (Vv/Vs) | 0.84 | 0.62 |
| Void ratio (Vv/VT) | 0.46 | 0.38 |
| Mean texture depth (MTD) (mm) | 7.14 | 6.85 |
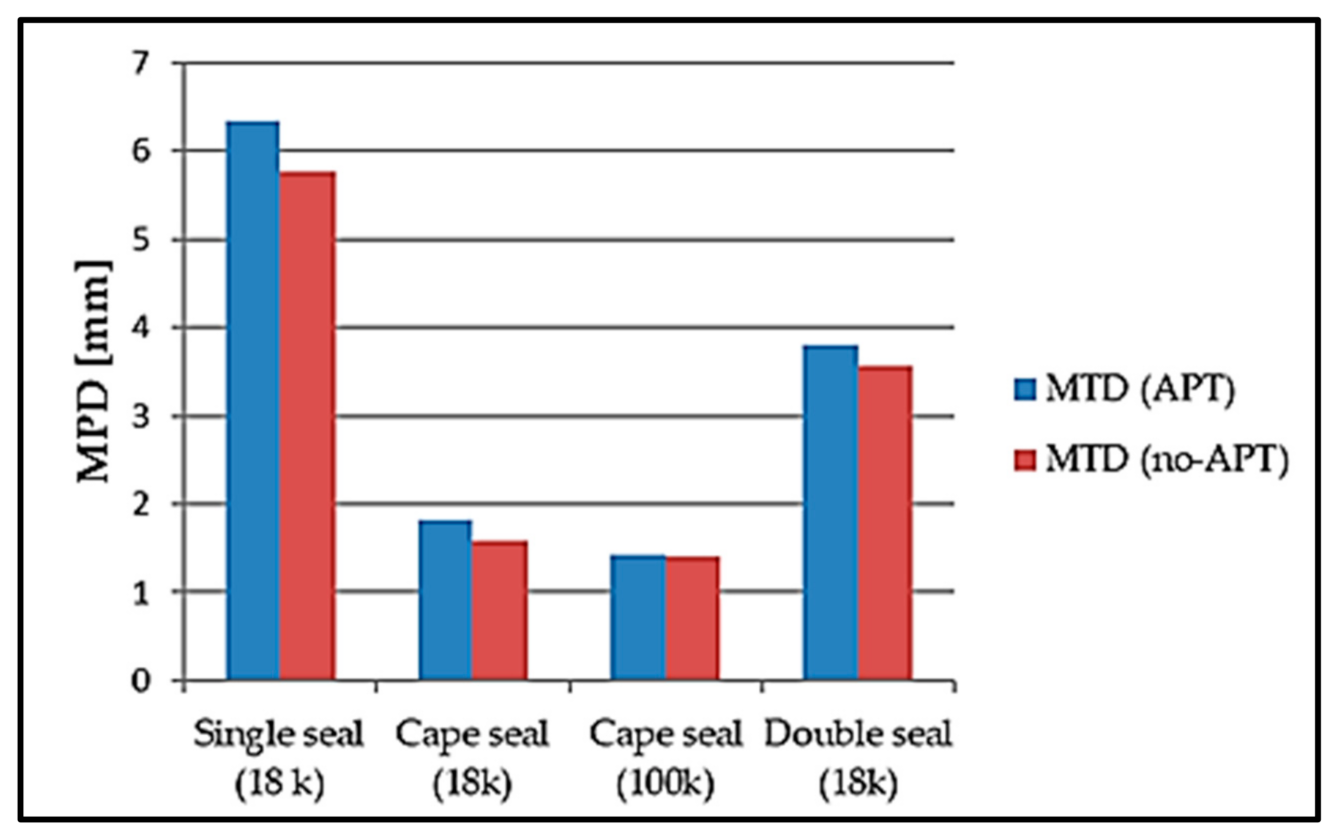
| Mean profile depth (MPD) (mm) | 6.34 | 5.76 |
| Parameter | APT Loading | No Loading |
|---|---|---|
| Solid volume (VT) (cm3) | 81.50 | 93.16 |
| Sample area (cm2) | 100.2 | 100.2 |
| Largest height difference (mm) | 15.4 | 15.8 |
| Aggregate volume (VS) (cm3) | 21.67 | 28.01 |
| Void volume (VV) (cm3) | 59.84 | 65.25 |
| Void ratio (VV/VS) | 2.76 | 2.33 |
| Void ratio (VV/VT) | 0.73 | 0.67 |
| MTD (mm) | 5.97 | 6.50 |
| MPD (mm) | 3.81 | 3.57 |
| Parameter | APT Loading | No Loading |
|---|---|---|
| Solid volume (VT) (cm3) | 52.81 | 58.92 |
| Sample area (cm2) | 100.2 | 100.2 |
| Largest height difference (mm) | 5.3 | 5.9 |
| Aggregate volume (VS) (cm3) | 21.67 | 28.01 |
| Void volume (VV) (cm3) | 31.14 | 30.91 |
| Void ratio (VV/VS) | 1.44 | 1.10 |
| Void ratio (VV/VT) | 0.59 | 0.53 |
| MTD (mm) | 3.11 | 3.08 |
| MPD (mm) | 1.83 | 1.59 |
| Measured Rut (mm) at Different Axle Load Repetitions at Different Positions in the Test Areas | |||||||
|---|---|---|---|---|---|---|---|
| Position | 0 | 2500 | 5000 | 10,000 | 25,000 | 50,000 | 100,000 |
| 0100 | 0 | 1.69 | 2.05 | 2.38 | 2.57 | 2.84 | 3.03 |
| 0200 | 0 | 1.86 | 2.04 | 2.34 | 2.56 | 2.83 | 2.98 |
| 0300 | 0 | 3.04 | 3.24 | 3.54 | 3.87 | 4.10 | 4.22 |
| 0400 | 0 | 2.80 | 3.06 | 3.40 | 3.99 | 4.35 | 4.69 |
| 0500 | 0 | 2.63 | 2.91 | 3.29 | 3.60 | 3.90 | 4.13 |
| 0600 | 0 | 2.56 | 2.65 | 2.86 | 3.15 | 3.37 | 3.82 |
| 0700 | 0 | 2.56 | 2.65 | 2.86 | 3.15 | 3.37 | 3.62 |
| 0800 | 0 | 2.94 | 3.03 | 3.42 | 3.71 | 4.05 | 4.25 |
| 0900 | 0 | 2.59 | 2.67 | 2.86 | 3.00 | 3.13 | 3.46 |
| Mean (Average) | 0 | 2.58 | 2.76 | 3.07 | 3.38 | 3.65 | 3.87 |
| Std. dev. | 0.00 | 0.50 | 0.45 | 0.48 | 0.57 | 0.61 | 0.63 |
| COV * % | 0 | 19.4 | 16.3 | 15.6 | 16.9 | 16.7 | 16.3 |
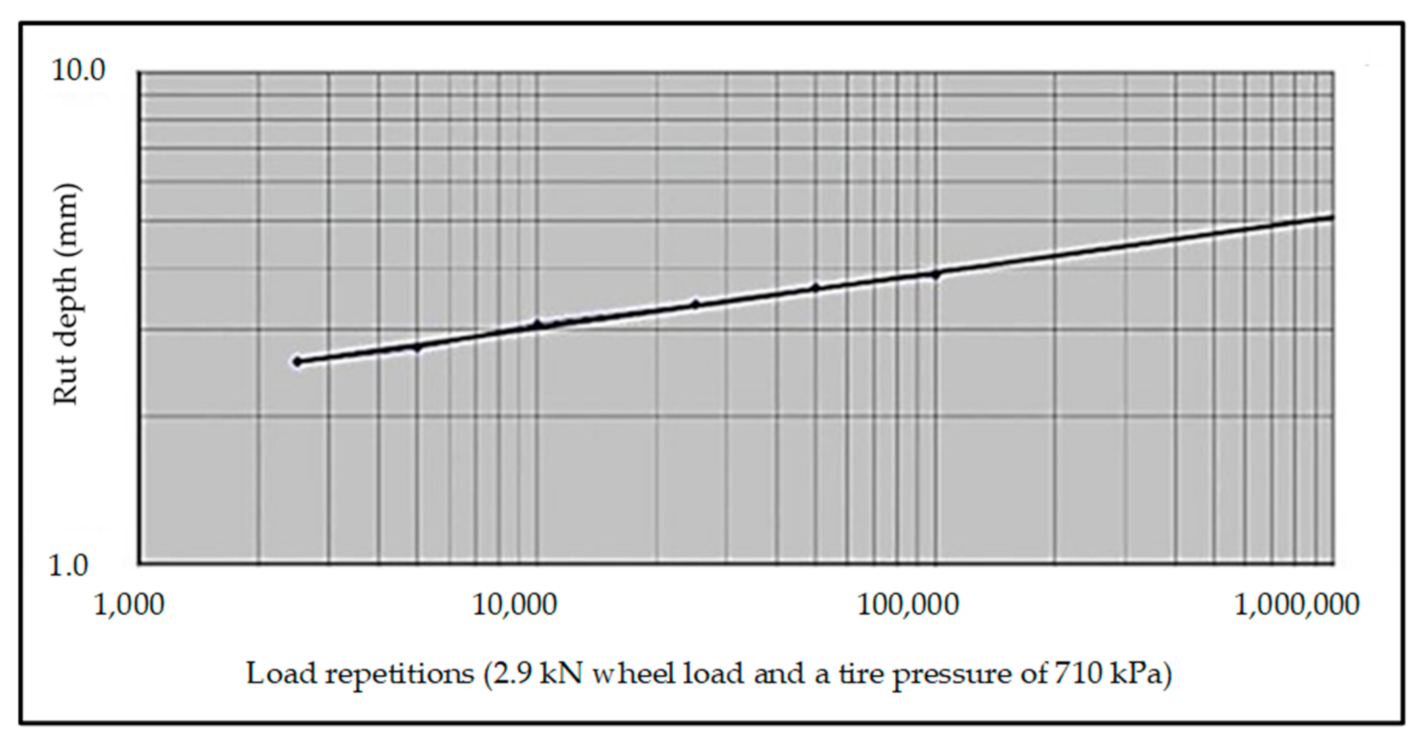
| Average rutting @ 100,000 repetitions = 3.87 mm | |||||||
| * COV % = Coefficient of Variation % = (Standard Deviation/Mean) × 100 | |||||||
| Parameter | APT Loading | No Loading |
|---|---|---|
| Solid volume (VT) (cm3) | 27.523 | 24.985 |
| Sample area (cm2) | 56.4 | 56.4 |
| Largest height difference (mm) | 4.88 | 4.48 |
| Aggregate volume (VS) (cm3) | 13.305 | 13.619 |
| Void volume (VV) (cm3) | 14.218 | 11.366 |
| Void ratio (VV/VS) | 1.069 | 0.835 |
| Void ratio (VV/VT) | 0.517 | 0.455 |
| MTD (mm) | 2.52 | 2.02 |
| MPD (mm) | 1.43 | 1.40 |
Publisher’s Note: MDPI stays neutral with regard to jurisdictional claims in published maps and institutional affiliations. |
© 2021 by the authors. Licensee MDPI, Basel, Switzerland. This article is an open access article distributed under the terms and conditions of the Creative Commons Attribution (CC BY) license (http://creativecommons.org/licenses/by/4.0/).
Share and Cite
Jordaan, G.J.; Steyn, W.J.v.M.; Broekman, A. Evaluation of Cost-Effective Modified Binder Thin Chip and Cape Seal Surfacings on an Anionic Nano-Modified Emulsion (NME)-Stabilised Base Layer Using Accelerated Pavement Testing (APT). Appl. Sci. 2021, 11, 2514. https://doi.org/10.3390/app11062514
Jordaan GJ, Steyn WJvM, Broekman A. Evaluation of Cost-Effective Modified Binder Thin Chip and Cape Seal Surfacings on an Anionic Nano-Modified Emulsion (NME)-Stabilised Base Layer Using Accelerated Pavement Testing (APT). Applied Sciences. 2021; 11(6):2514. https://doi.org/10.3390/app11062514
Chicago/Turabian StyleJordaan, Gerrit J., Wynand J. vd M. Steyn, and Andre Broekman. 2021. "Evaluation of Cost-Effective Modified Binder Thin Chip and Cape Seal Surfacings on an Anionic Nano-Modified Emulsion (NME)-Stabilised Base Layer Using Accelerated Pavement Testing (APT)" Applied Sciences 11, no. 6: 2514. https://doi.org/10.3390/app11062514
APA StyleJordaan, G. J., Steyn, W. J. v. M., & Broekman, A. (2021). Evaluation of Cost-Effective Modified Binder Thin Chip and Cape Seal Surfacings on an Anionic Nano-Modified Emulsion (NME)-Stabilised Base Layer Using Accelerated Pavement Testing (APT). Applied Sciences, 11(6), 2514. https://doi.org/10.3390/app11062514