Article

Effect of Different Precipitation Routes of Fe2Hf Laves Phase on the Creep Rate of 9Cr-Based Ferritic Alloys

1
Department of Materials Science & Engineering, Tokyo Institute of Technology, 2-12-1 Ookayama, Meguro-ku, Tokyo 152-8552, Japan
2
Research Center for Structural Materials, National Institute for Materials Science (NIMS), 1-2-1 Sengen, Tsukuba, Ibaraki 305-0047, Japan
*
Author to whom correspondence should be addressed.
Appl. Sci. 2021, 11(5), 2327; https://doi.org/10.3390/app11052327
Submission received: 11 January 2021 / Revised: 23 February 2021 / Accepted: 2 March 2021 / Published: 5 March 2021
(This article belongs to the Special Issue Thermomechanical Properties of Steel)

Abstract

:
We performed creep tests for three types of Fe-9Cr-Hf alloys with a ferritic matrix w/o Fe2Hf Laves phase particles formed by two precipitation routes: (1) with fine Fe2Hf particles formed by the conventional precipitation route (hereafter the particles are called CP particles), namely formed in the α-ferrite matrix after γ-austenite → α-ferrite phase transformation; (2) with fine Fe2Hf particles formed by interphase precipitation (hereafter called IP particles) during δ-ferrite → γ-austenite phase transformation before γ → α phase transformation and (3) without Laves phase particles. CP particles were found to be effective in reducing the creep rates from the transient creep regime to the early stage of a slowly accelerating creep regime but were coarsened after the creep tests. IP particles were less effective in reducing the creep rate in the early creep stages but showed a higher stability against particle coarsening than CP particles in the creep tests, suggesting their effectiveness in delaying the recovery and recrystallization processes in the matrix and thereby retarding the onset of a rapid creep acceleration and creep rupture. The effects of the different precipitation routes are discussed based on the results obtained.

1. Introduction

Fossil fuel-fired steam and gas power generation is currently supporting ~80% of the energy supply in the world [1]. Because of the carbon dioxide emissions from the fuel combustion, however, a recent worldwide trend is to claim the need to replace fossil fuel power generation with renewable energy such as solar power and wind power as the main power source in the near future [2]. Steam and gas turbine power generation systems, however, have advantages in providing energy security, including an ability to supply energy in case of an emergency, and will also be needed in the future as an important power source while using clean fuels such as H2 and NH3 and/or carbon capture technologies. It is, therefore, important to continue making efforts to further increase the efficiency and the durability of turbine power generation systems, thereby improving the high temperature durability of heat-resistant steels and alloys for the systems.
High-Cr heat-resistant ferritic steels are an important class of materials for high-temperature components such as steam pipes and turbines in high-efficiency coal-fired power plants. These steels are designed such that the ferritic matrix, inherited from the martensitic transformation, are strengthened with M23C6 (M: Cr, Mo, Fe)-type carbide and (V, Nb)(C, N)-type carbonitride particles against dislocation motion, recovery and recrystallization. The carbide and carbonitride particles are, however, susceptible to particle coarsening and decomposition in the long-term creep deformation and thereby lose their strengthening effects, which is considered to be a main cause of the degradation of the long-term creep strength of the steels [3,4].
Laves phase is an A2B type intermetallic phase which is formed in many Fe-based alloy systems [5]. Fe2Mo and Fe2W Laves phase particles are precipitated during creep deformation within the ferritic matrix in conventional high-Cr ferritic steels [6,7]. Laves phase particles are observed as fine particles along the lath/block boundaries and/or as coarse globular ones, depending on the type of the Laves phase and the content of the Laves phase-forming elements. Efforts to improve the creep life of ferritic steels have been made by modification of Laves phase distribution, and positive effects on the creep resistance are reported [6,7].
Recently, one of the present authors [8,9] found that fine, Hf-rich particles are precipitated in a form of periodically arrayed rows in Fe-9Cr-based alloys containing a low amount of Hf and explained that the particles are formed through interphase precipitation during phase transformation from δ-ferrite to γ-austenite, followed by a phase transformation from γ-austenite to α-ferrite. Hf-rich particles were also identified as C14 Fe2Hf-type Laves phase by diffraction pattern analysis [8]. This finding is expected to open a new precipitation route to strengthen heat-resistant ferritic steels. The objective of the present paper is to compare the effects of precipitation routes of Fe2Hf Laves phase particles on the creep rate of 9Cr-based heat-resistant ferritic alloys.

2. Materials and Methods

The chemical compositions of the alloys studied are listed in Table 1. The alloys contained ~9 wt.% Cr, three levels of Hf contents and low levels of the interstitial elements. The concentrations of the transition metals and carbon were analyzed using the infrared absorption method after combustion in an induction furnace (JIS G1211), and those of nitrogen and oxygen using the inert gas fusion infrared absorption method. These alloys are designated with their Hf contents in this paper.
Each sample was prepared by vacuum induction melting as a 1-kg ingot. Each ingot was hot rolled to a bar shape with a rectangular cross-section of 12 × 8 mm in size. The hot-rolled bars were machined to test pieces with a gauge portion of 30 mm in length and 8 mm in diameter. The following sequential heat treatment was performed for the test pieces of all the alloys using an infrared furnace: heating to 1300 °C, holding for 5 min, cooling at a rate of 10 °C/s to 1000 °C, holding for 20 s, cooling at a rate of 10 °C/s to 750 °C, cooling at a rate of 0.1 °C/s to 600 °C and air cooling. This heat treatment scheme was designed to achieve interphase precipitation to occur through the 8-mm-sized sample in the 0.33 Hf alloy based on our preliminary experiments [10]. As shown in the next section, fine particles were formed by interphase precipitation (hereafter called IP particles) in the 0.33 Hf alloy, while precipitation did not occur in the heat treatment in the other two alloys. In the 0.09 Hf alloy, fine Fe2Hf particles were precipitated in the transformed ferrite matrix during the creep tests.
The heat-treated test pieces were machined to cylindrical brimmed creep test specimens with a gauge portion of 30 mm in length and 6 mm in diameter. Creep tests were performed using a lever-type single creep testing machine (TOSHIN KOGYO., LTD, Japan) in air at constant load under temperature/stress conditions of 650 °C/60 MPa, 700 °C/40 MPa and 700 °C/30 MPa. The microstructures of the creep test specimens before creep test and after creep interrupt and creep rupture tests were observed with a field emission scanning electron microscope (FESEM, JSM-7000F, JEOL Ltd., Japan) equipped with a backscattered electron (BSE) detector which allows electron channeling contrast imaging (ECCI) and an electron backscatter diffraction (EBSD) detector. The phases were identified by X-ray diffraction (XRD) with Cu radiation using a thin Ni filter (Mini Flex 600, Rigaku Corp., Japan). The specimens before creep tests were cut 1 mm inside the sample surface and the creep-interrupted and creep-ruptured specimens were cut from their gauge portions. The cut sections were ground, mechanically polished down to 1 μm Al2O3 polishing suspension and, finally, chemically polished with SiO2 polishing suspension. The creep-interrupted specimens were observed with a scanning transmission electron microscope (STEM, JEM-2100F, JEOL Ltd., Japan) with an energy dispersive X-ray spectroscopy (EDS) detector. The samples were obtained from their gauge portions and prepared by twin-jet electro-polishing in perchloric acid solution (10% perchloric acid + 90% ethanol) at −10 °C.

3. Results and Discussions

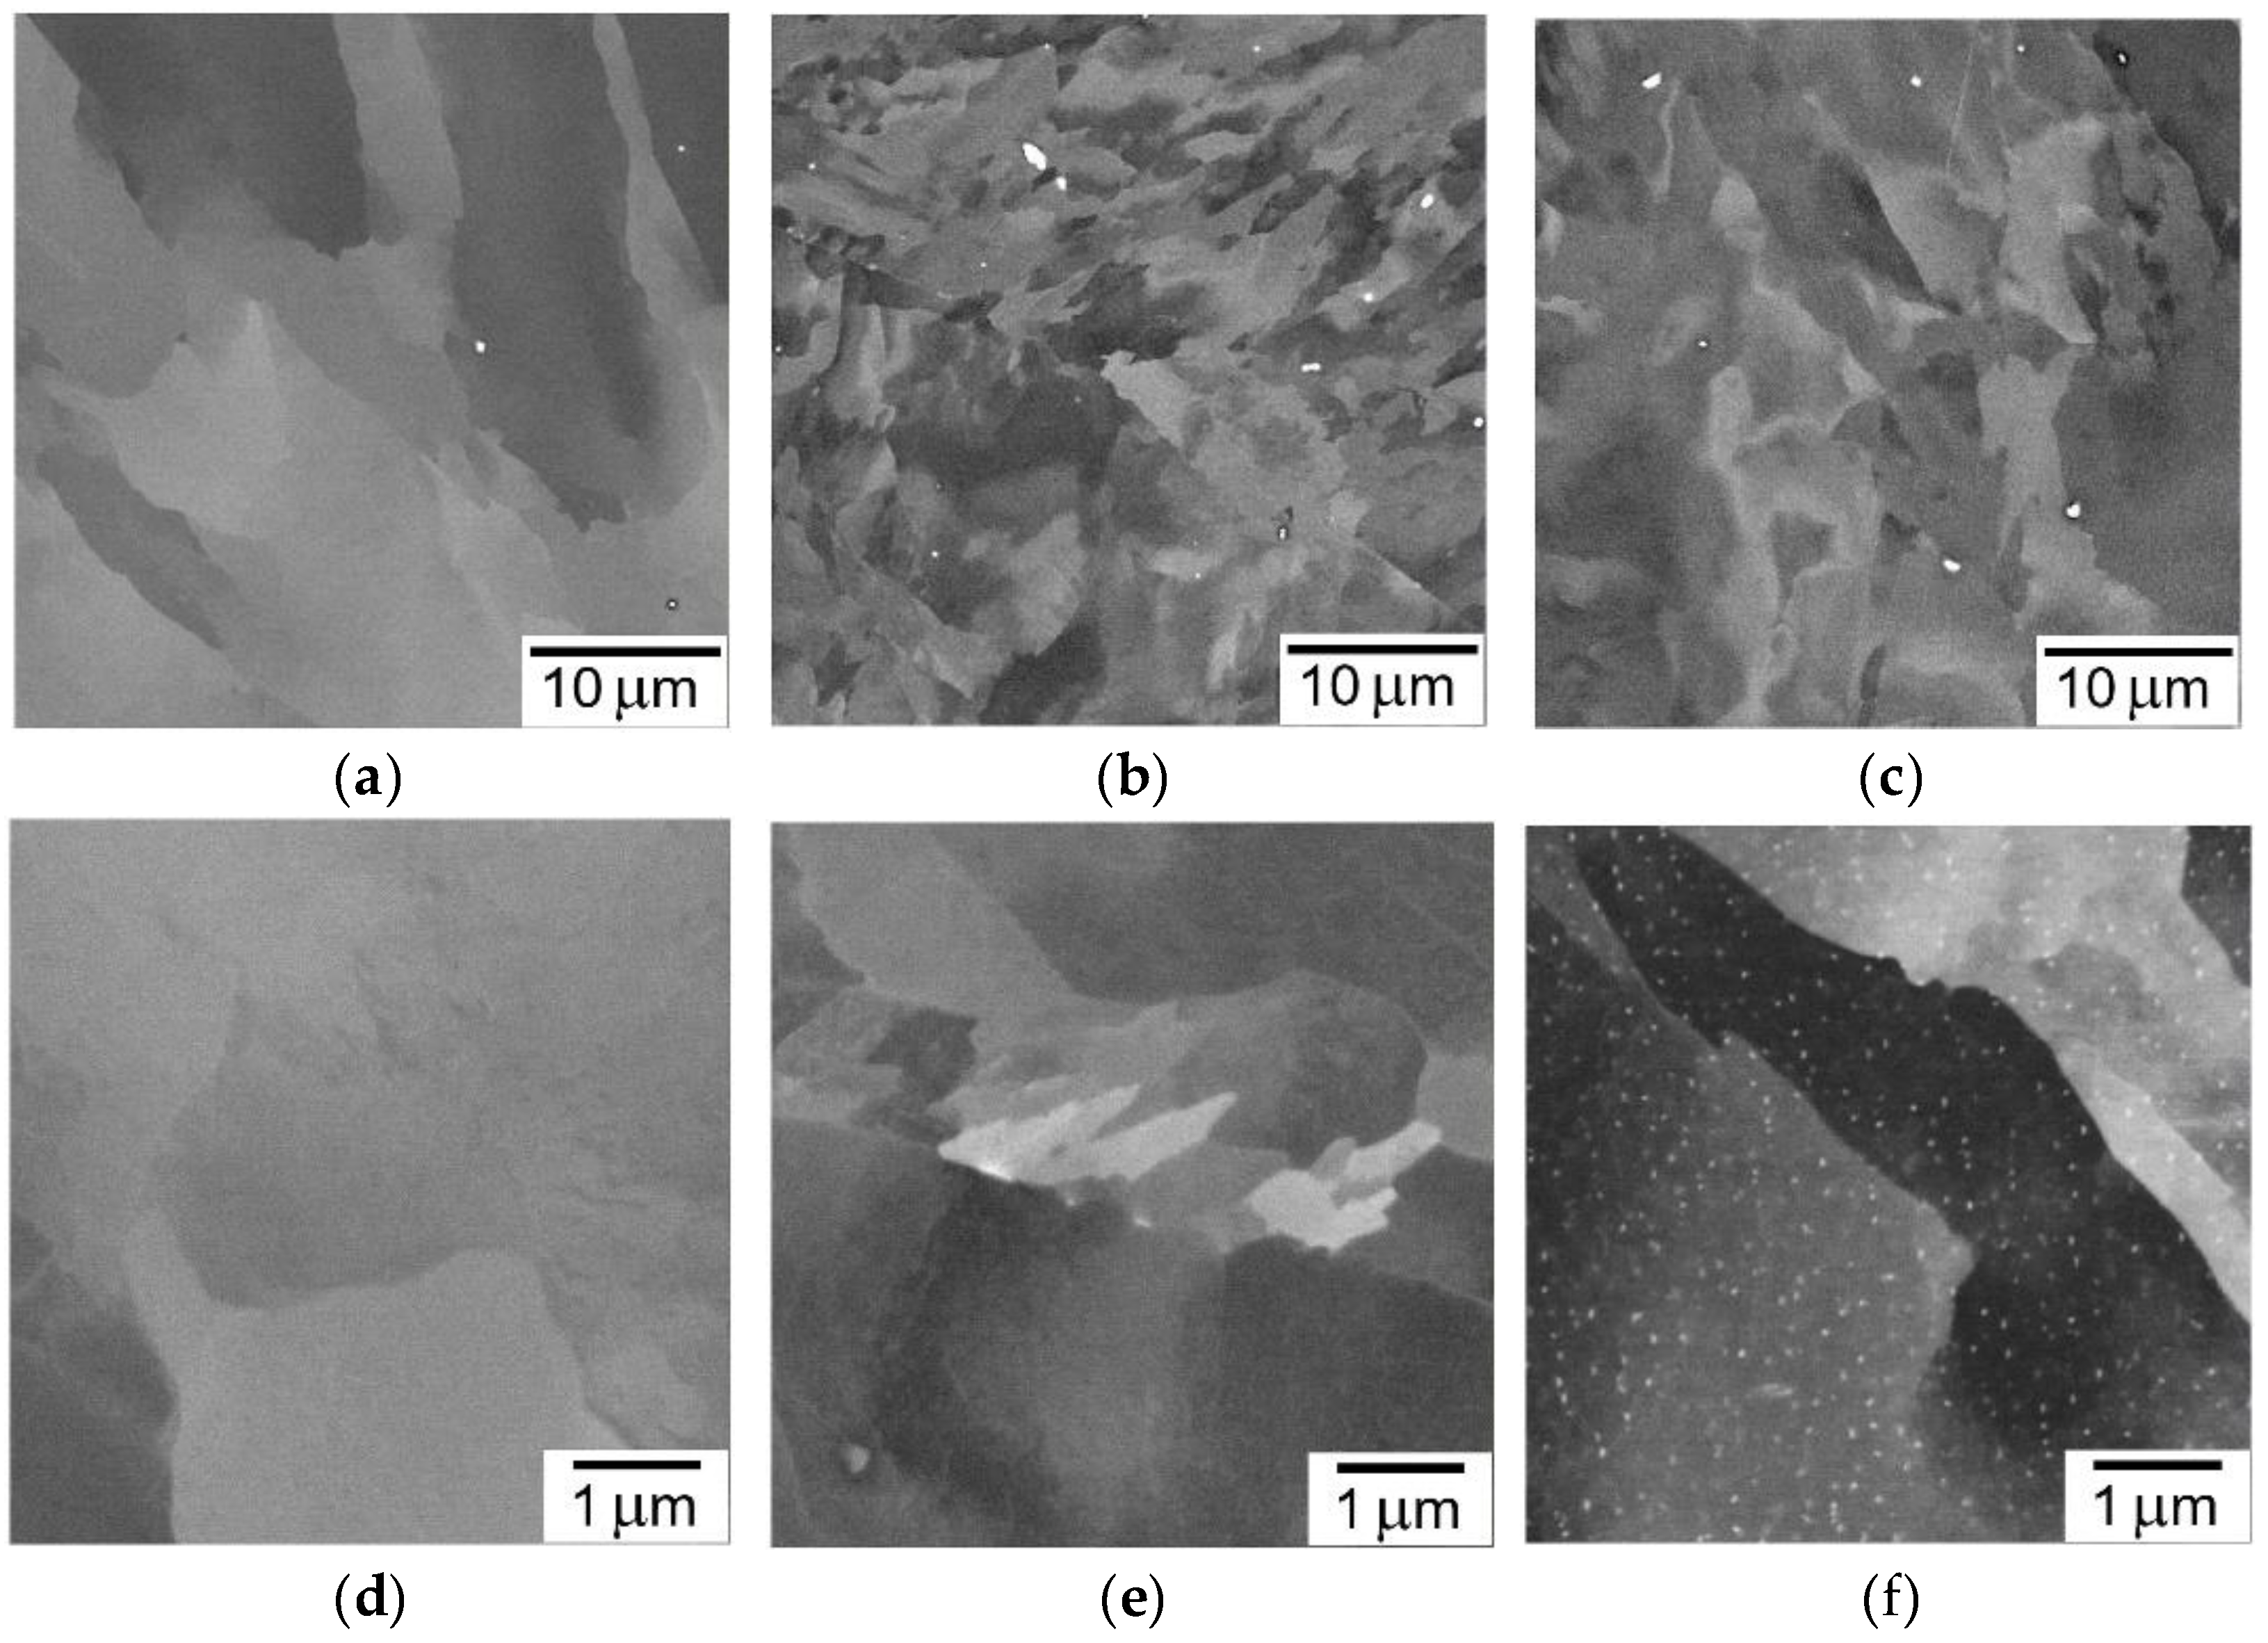
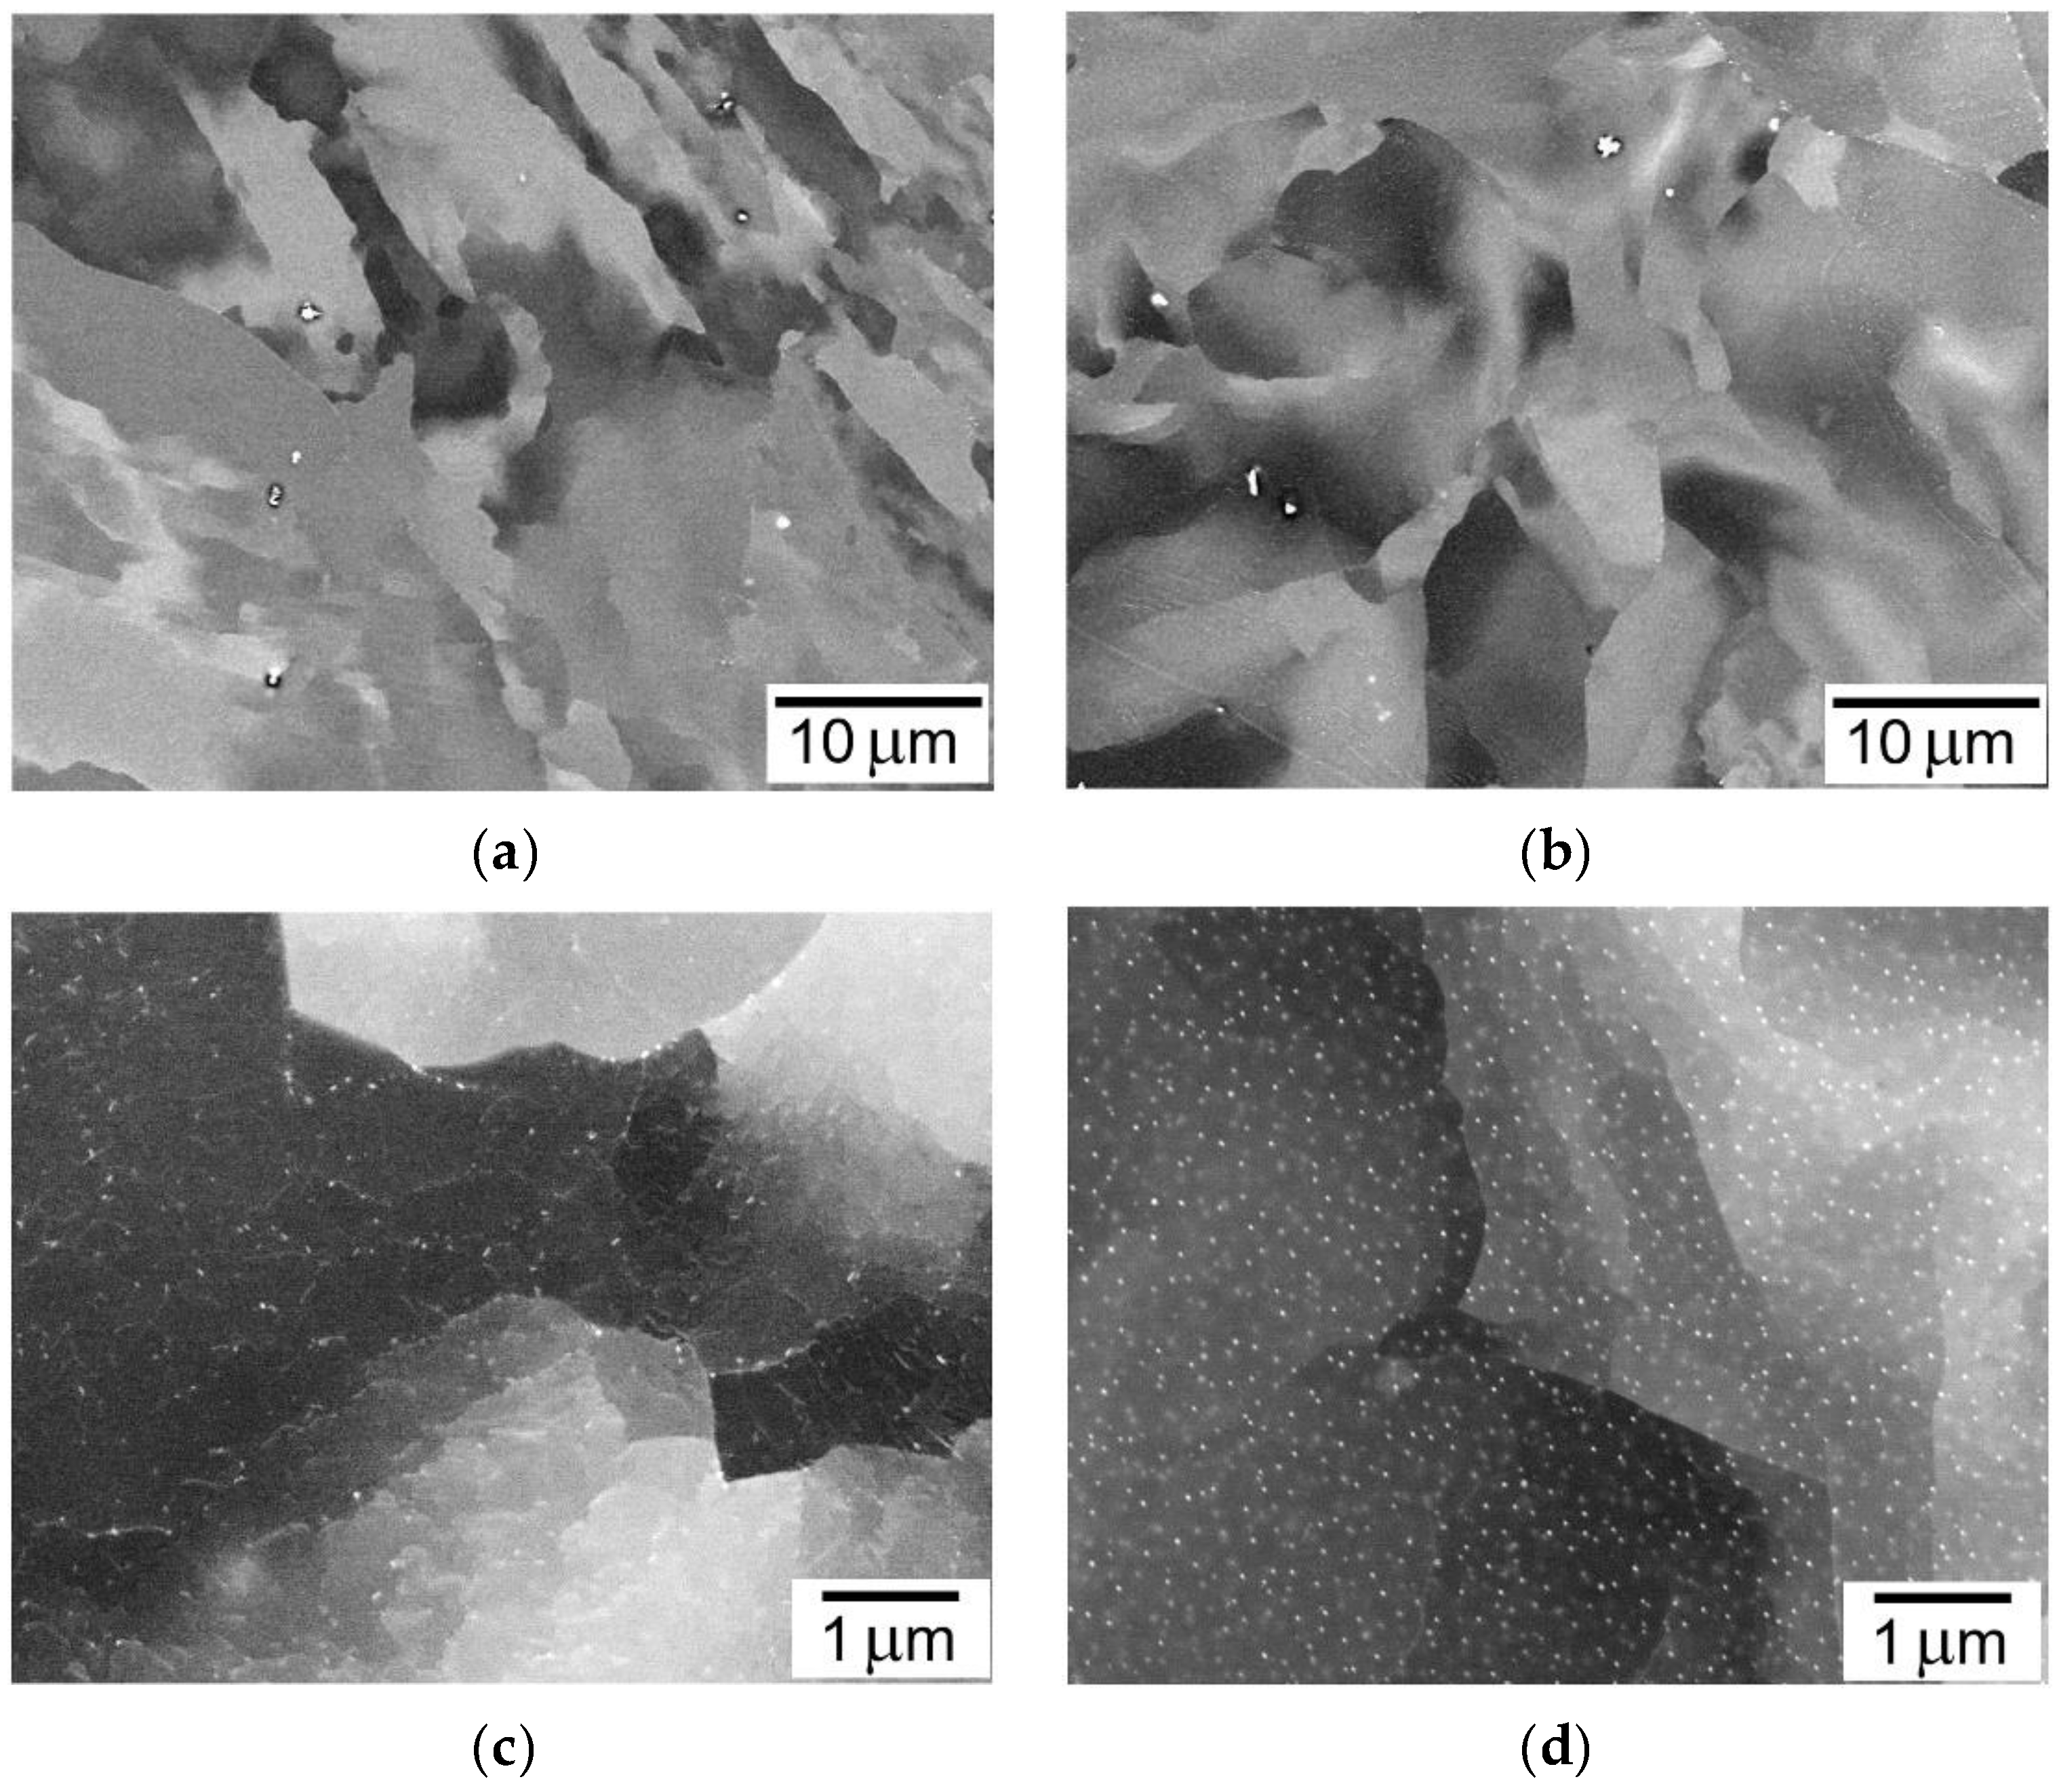
3.1. Microstructures of the Alloys for Creep Tests

Typical microstructures of the three types of creep test samples are shown in Figure 1. No fine Laves phase particles are observed in the 0.09 Hf and the 0.03 Hf alloys, while IP particles are distributed with a size of a few tens of nanometers and an interparticle spacing of ~100 nm in the 0.33 Hf alloy. Coarse, bright particles, found in all the samples, are Hf containing oxide, which are formed from the melt. No significant difference was found in the distribution and amount of the Hf oxide particles among the alloys. As can be seen from the backscattered electron images, the sizes of the matrix grains/subgrains are the largest in the 0.03 Hf alloy, followed, in order, by the 0.33 Hf alloy and the 0.09 Hf alloy.
EBSD inverse pole figure maps of the same samples as shown in Figure 1 are displayed in Figure 2. The grain size is larger in the 0.03 Hf alloy than in the 0.09 Hf alloy and the 0.33 Hf alloy. Sub-boundaries were also found to be less dense in the 0.03 Hf alloy while much denser in the 0.09 Hf alloy and the 0.33 Hf alloy.

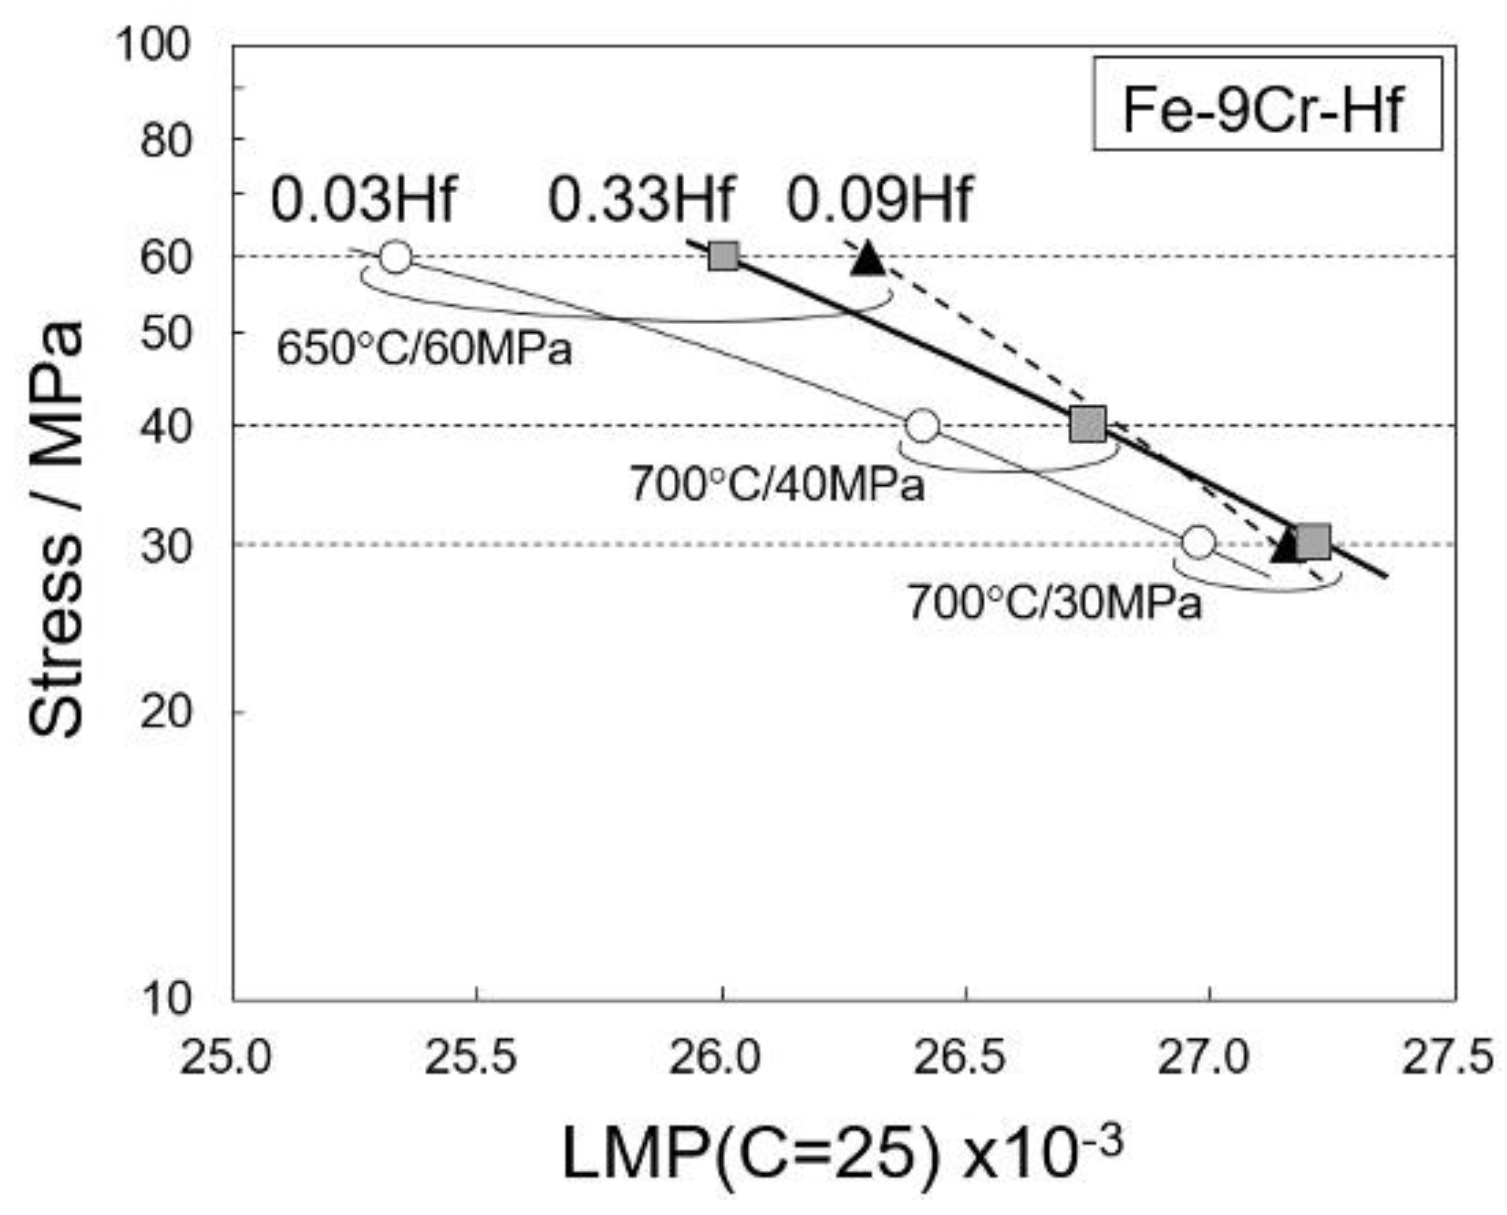
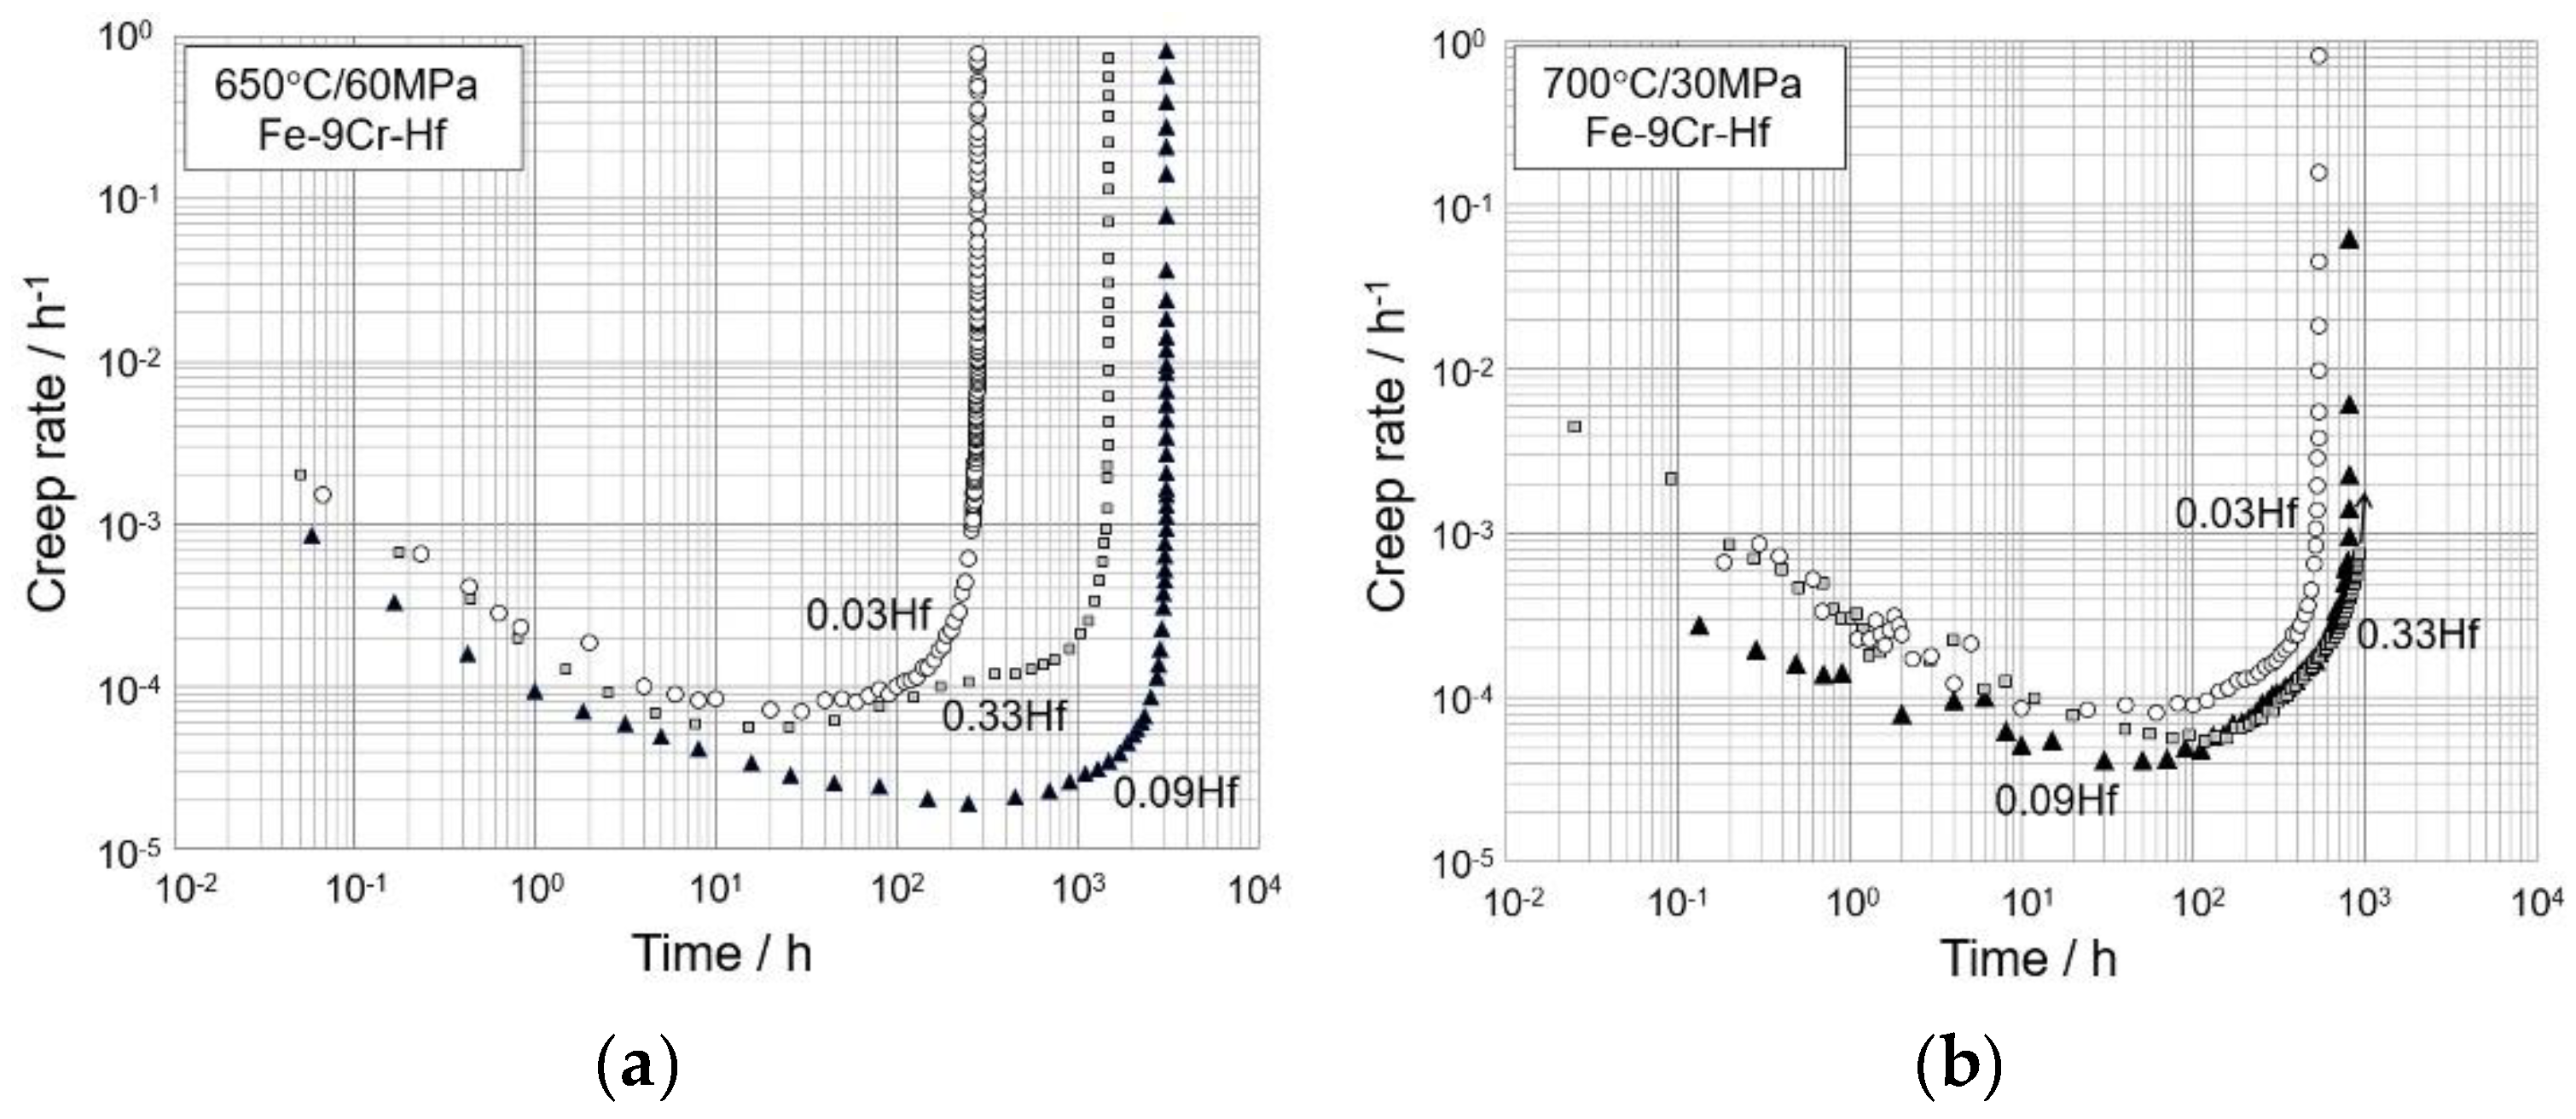
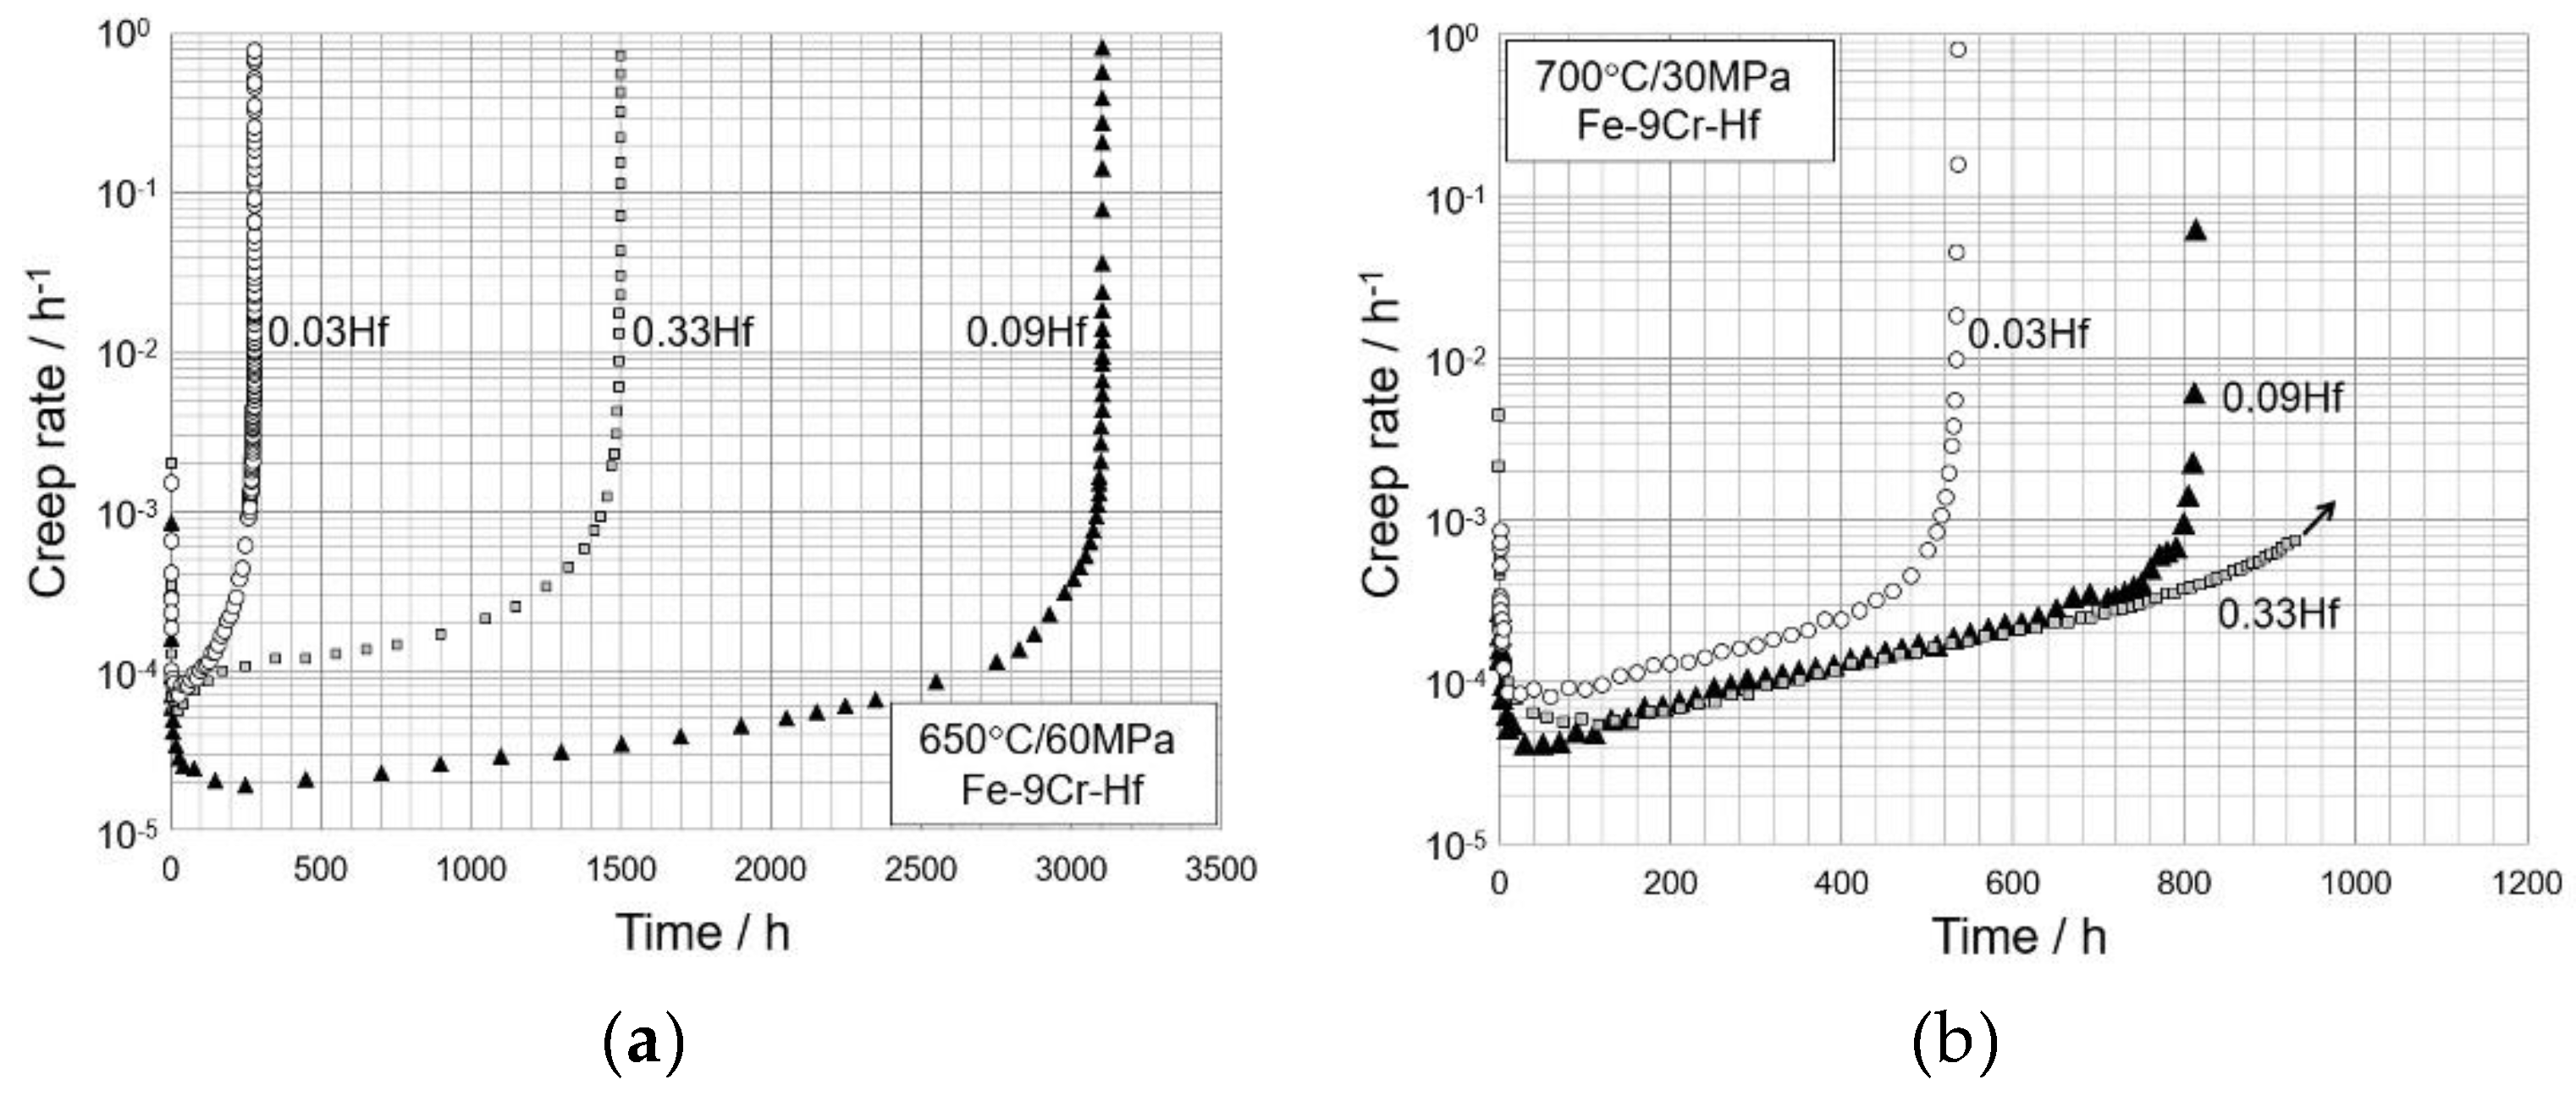
3.2. Creep Behaviors

Figure 3 shows the creep curves of the alloys obtained under the conditions indicated. The 0.09 Hf alloy shows the longest creep life under the condition of 650 °C/60 MPa while the 0.33 Hf alloy showed the longest life under the condition of 700 °C/30 MPa. A clear stress dependence was found, as seen in a Larson–Miller-type plot for the present results in Figure 4; the 0.09 Hf alloy shows the longest creep life at higher stress conditions whereas the 0.33 Hf alloy shows the longest creep life at lower stress conditions. The creep data are summarized in Table 2.
The creep behaviors were analyzed in detail using the creep rate vs. time curve diagrams, which are displayed in logarithmic time scale and linear time scale in Figure 5 and Figure 6, respectively. The transient creep rates of the 0.03 Hf and 0.33 Hf alloys are similar, but the rate of the 0.09 Hf alloy is about a half of the former alloys under the creep conditions (see Figure 5). The minimum creep rate is the lowest in the 0.09 Hf alloy under the two conditions. The alloys show weak acceleration regimes after reaching their minimum creep rates (see Figure 6). The duration of the weak acceleration regime is longer in the 0.33 Hf alloy than in the 0.03 Hf alloy at the higher stress condition, which leads to a longer creep life in the former alloy, in spite of their similar minimum creep rates (see Figure 5a and Figure 6a). The duration of the weak creep acceleration in the 0.33 Hf alloy is even longer than that in the 0.09 Hf alloy under the lower stress condition, which leads to the longest creep life among the alloys (Figure 6b).

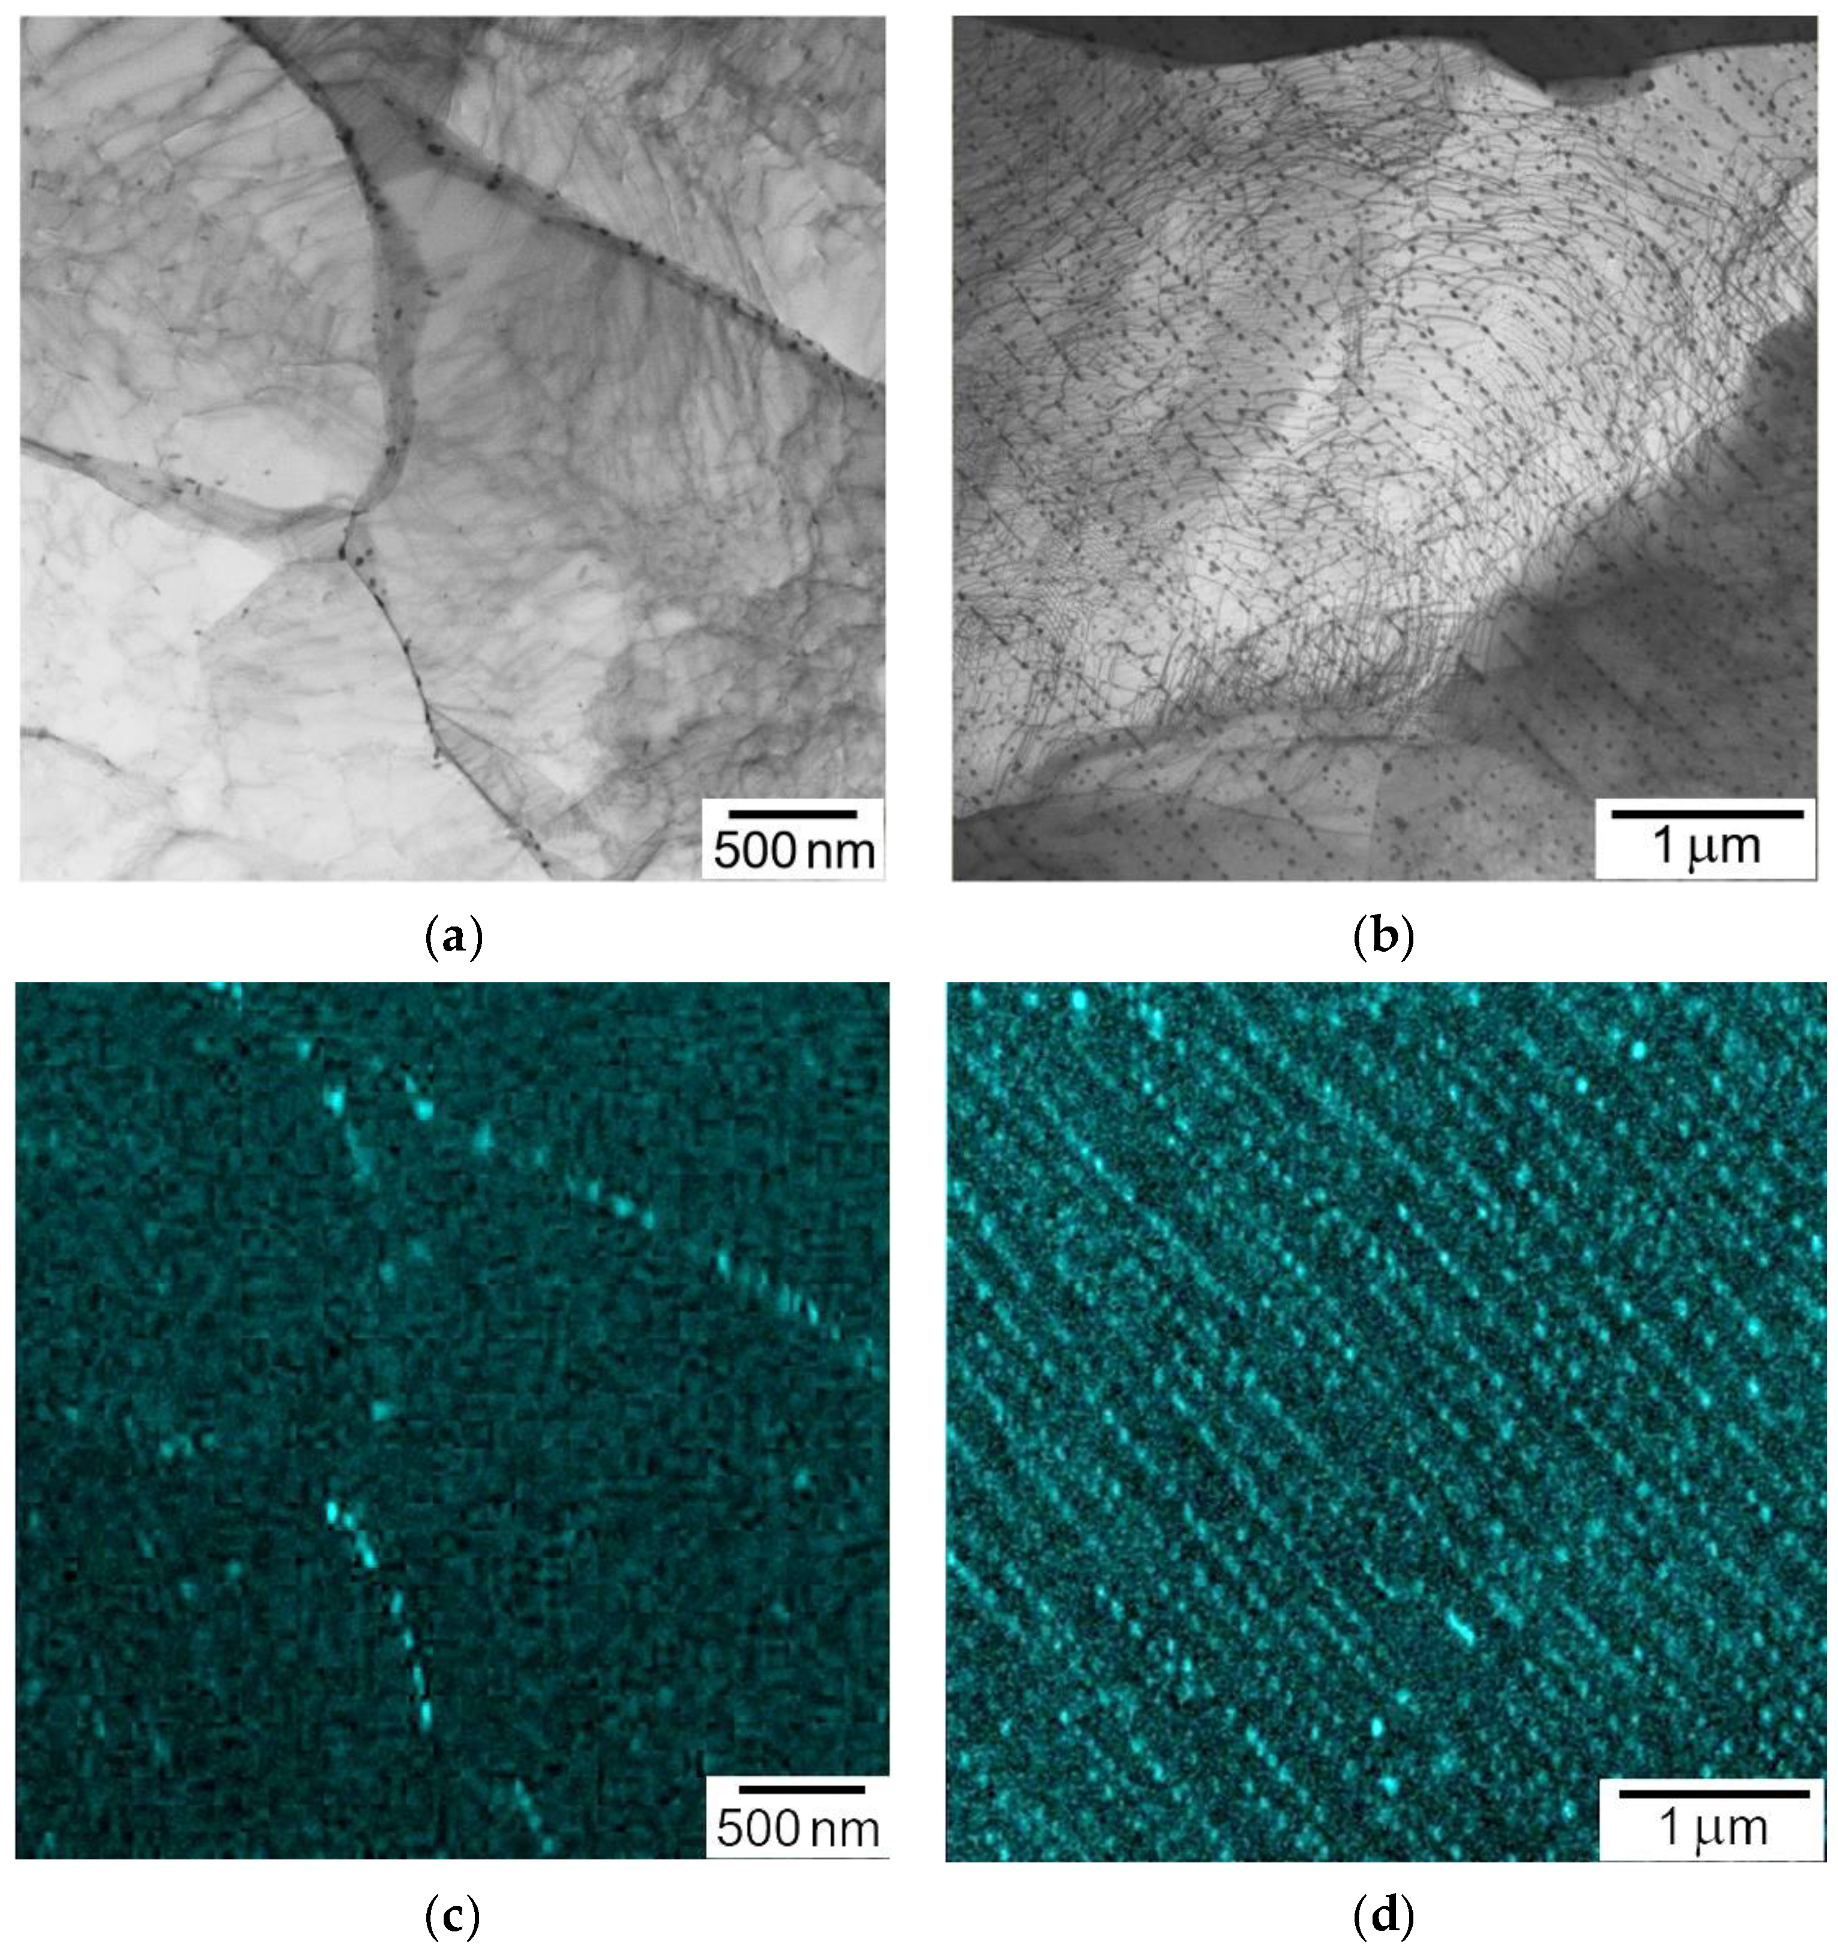
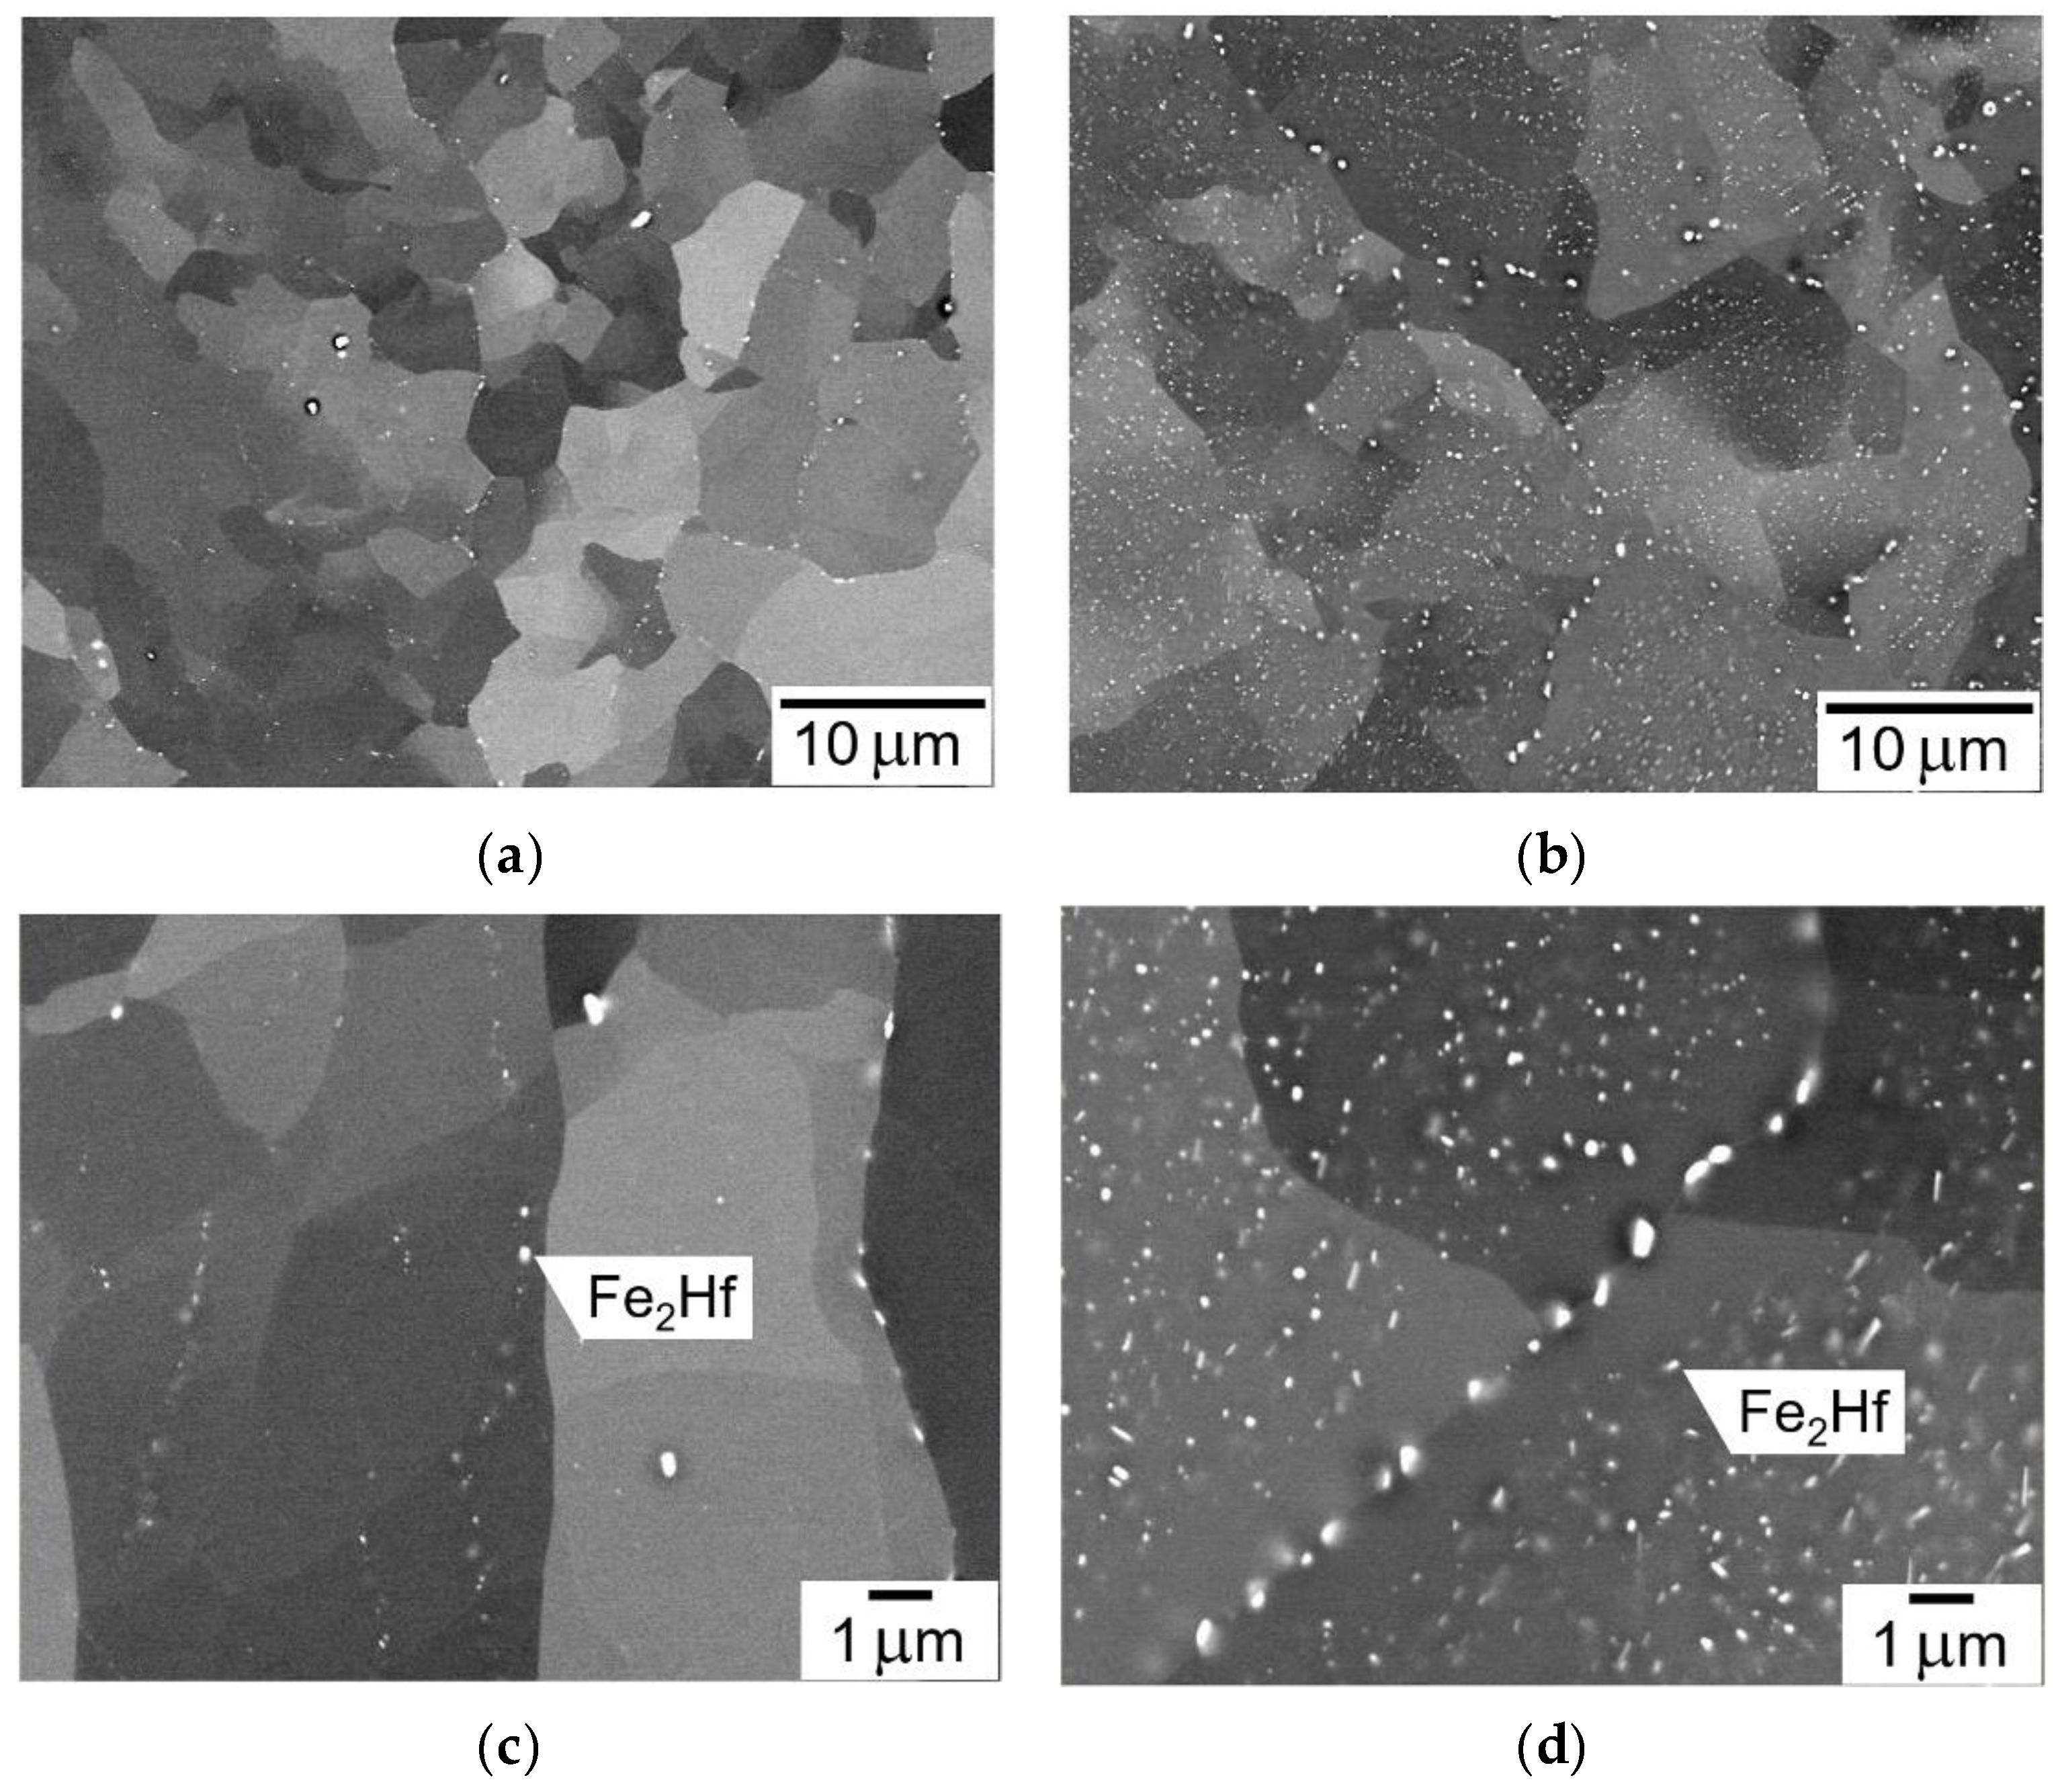
3.3. Microstructures of the Alloys after Creep Tests

The microstructures of the creep-tested samples were observed to understand the effects of the introduced Laves phase particles and their precipitation routes on the creep rates of the 9Cr-based ferritic alloys.
Figure 7 shows BSE images of the 0.09 Hf and the 0.33 Hf alloys after creep tests interrupted in the early stage of their week creep acceleration regimes under the condition of 650 °C/60 MPa. No significant microstructural change from their initial states was observed in the low-magnification micrographs in both the specimens, as seen in Figure 7a,b. High-resolution observations under an ECCI condition in the 0.09 Hf alloy show a high density of fine precipitates and dislocations which are bulged between the precipitates (Figure 7c). This observation with an EDS analysis (see Figure 8) suggests that fine Fe2Hf phase particles were precipitated from the supersaturated ferrite matrix during the creep test, and the fine precipitates (hereafter called CP particles) act to retard the motion of dislocations from the transient creep stage through the early stage of the weak creep acceleration stage. The high-magnification micrograph for the 0.33 Hf alloy demonstrates that the fine distribution and size of IP particles almost remain until the early acceleration creep regime (Figure 7d). A smaller number of dislocations were visible in the observation under an ECCI condition in the 0.33 Hf alloy sample showing the creep curves of the alloys obtained under the conditions indicated. The 0.09 Hf alloy shows the longest creep life under the condition of 650 °C/60 MPa while the 0.33 Hf alloy shows the longest life under the condition of 700 °C/30 MPa. A clear stress dependence was found, as seen in a Larson–Miller-type plot for the present results in Figure 4; the 0.09 Hf alloy shows the longest creep life at higher stress conditions whereas the 0.33 Hf alloy shows the longest creep life at lower stress conditions. The creep data are summarized in Table 2.
Figure 8 shows STEM bright field images and EDS Hf maps of the samples corresponding to Figure 7. It can be seen that CP particles are Hf-rich and are formed not only on dislocations within grains/subgrains but also at grain boundaries (sub-boundaries) in the 0.09 Hf alloy, and the amount and size of the particles are somewhat larger at the boundaries than on the dislocations (Figure 8a,c). In the 0.33Hf alloy, a high density of dislocations is visible in the ferrite grains and the dislocations are bulged between IP particles (Figure 8b). It should be noted that the size and spatial distribution are more uniform for IP particles in the 0.33 Hf alloy than CP particles in the 0.09 Hf alloy.
Figure 9 shows BSE images of the alloys after creep rupture under the condition of 650 °C/60 MPa. Low-magnification micrographs taken from the gauge length of the alloys exhibit equiaxed ferritic grains, which indicates that recovery and recrystallization took place extensively in the late stage of the creep tests in the alloys. High-magnification observation demonstrates that CP particles in the creep-ruptured sample are less dense and larger compared to the creep-interrupted sample, which suggests that particle coarsening occurred in the late stage of the creep tests. Coarsening of IP particles is also observed in the 0.33 Hf alloy, but their density is still high and higher than that of CP particles in the 0.09 Hf alloy, as seen in Figure 9c,d. Similar microstructural features were observed in the creep-ruptured or -interrupted samples under the condition of 700 °C/30 MPa, as shown in Figure 10.
Figure 11 shows XRD peaks obtained from the 0.33 Hf alloy before and after the creep tests. No clear diffraction peaks were detected from second-phase particles in the sample before creep test, although a slight peak is visible at 39.7°, which corresponds to C14/C36-Fe2 Hf diffraction (Figure 11a). After creep tests, C15-Fe2Hf diffraction peaks are visible in addition to C14/C36-Fe2Hf diffraction peaks (Figure 11b,c). These results indicate that the C15-Fe2Hf phase is formed or transformed from the C14/C36-Fe2Hf phase, which was formed by the interphase precipitation, during creep deformation. No clear diffraction peaks were detected for fine precipitates in the 0.09 Hf alloy. The precipitates are, however, believed to be C15-type Fe2Hf according to a phase diagram principle.
The number density (Ns) and the area fraction (f) of CP and IP particles were measured on the creep test samples and plotted as a function of LMP in Figure 12. The particle parameters were measured on STEM images for the samples creep interrupted under the condition of 650 °C/60 MPa and on FESEM images for the other samples using a free image analyzing software. Averaged particle radius ( r ¯ ) was calculated using the following equation and the experimentally obtained Ns and f, assuming that the particle is spherical [12]:
r ¯   =   3 f / 2 N s
It can be seen that CP particles show a higher Ns and a smaller r ¯ than IP particles at the lowest LMP condition but a lower Ns and a larger r ¯ at the higher LMP conditions, while the f of both types of particles remains almost constant in the creep tests. Zener pinning force (Pz) was calculated to discuss the stability of the ferritic matrix structure against recovery and recrystallization using the following equation [12]:
Pz   =   3 f γ / 2 r ¯
where γ is the interfacial energy between the matrix and particle phases. The Pz values were estimated using f, r ¯ and a value of 0.5 J/m2 for γ. The estimated Pz value for CP particles is similar to that for IP particles at the low LMP condition but much lower at the higher LMP conditions.

3.4. Effects of Precipitation Route of Laves Phase on Creep Behaviors

The different effects on the creep rate were observed between CP and IP particles. Introduction of CP particles was found to be effective in reducing the creep rate from the transient creep regime to the early stage of accelerating creep regime; IP particles were found to be less effective in reducing the creep rate in the early creep stages but more resistant to coarsening than CP particles through the creep tests. The effects of the two types of particles and precipitation routes are discussed below.

3.4.1. Particle Effects in the Early Creep Stages

It is generally considered in 9Cr-based heat-resistant ferritic steels that their transient creep deformation is governed by the motion and disappearance of dislocations that are originated from the phase transformation from γ to α. The motion of the dislocations can be retarded by second-phase particles since dislocations must bypass or climb the particles. A main reason for the different particle effects will be the higher Ns of CP particles than IP particles. The high Ns of CP particles is assumed to be caused by heterogeneous precipitation on the dislocations [13]. The smaller effect of IP particles would also be caused by the sequence of precipitation with respect to the γ → α phase transformation. In the case of CP particles, the heterogeneous nucleation causes a situation where most of the particles act to disturb the dislocation motions. On the other hand, IP particles are precipitated independently of the dislocations since the γ → α precipitation occurred before the phase transformation. This allows us to imagine that a fraction of the dislocations may go through IP particles by the glide motion only, and the particles show low effectiveness to disturb the dislocation motions even with their high Ns.
The effect of ferritic microstructure on the creep rate should also be discussed. It is generally reported that smaller grain sizes tend to give faster minimum creep rates in the grain size range below 100 μm [14,15,16]. The estimated size of the ferritic microstructures in the present case is between a few μm and a few tens of μm, and it is, therefore, not unreasonable to consider that the difference in the ferritic microstructure is not a primary reason for the reduced transient creep rate in the 0.09 Hf alloy. Much finer interparticle spacings than ferritic grain sizes also imply that the reduced creep rate is mainly caused by the particles.

3.4.2. Particle Stability in the Late Stages of Creep Tests

It is generally known in the creep of ferritic/martensitic heat-resistant steels that initial lath/block structures gradually recover to form cell structures with creep deformation [3,4]. This recovery process is understood to soften the material and causes creep acceleration. A high density of second-phase particles act to inhibit the motion of boundaries, thereby retarding recovery and recrystallization processes in the matrix phase [12]. The quantitative analysis for the Laves phase particles in the present study shows that IP particles tend to keep their fine size and spatial distribution and Zenner pinning force for a long time, compared to CP particles (see Figure 12). Microstructural observation for the matrix phase in the creep tested samples demonstrates that recovery and recrystallization processes take place in the late stages of creep tests. The results from the observations with the creep rate analysis indicate that the recovery and recrystallization processes trigger the rapid acceleration of creep and creep rupture in the creep tests, and IP particles are more effective in retarding the rapid creep acceleration and rupture, especially under lower stress conditions.
The susceptibility to particle coarsening in CP particles should be discussed. A possible reason for the higher susceptibility originates from their heterogeneous precipitation on the grain/subgrain boundaries and dislocations. This may cause faster growth and particle coarsening kinetics due to the diffusion on the defects, resulting in the formation of a wide distribution of particle sizes, thereby increasing the driving force for particle coarsening. In fact, a larger size distribution is qualitatively observed for CP particles compared to IP particles in the early stage of creep tests (compare Figure 8a,b). This aspect reminds us of the degradation of long-term creep life in conventional ferritic steels where the particles are precipitated in the transformed ferrite grain/subgrain boundaries as well as within the grains. An introduction of both CP and IP particles may be effective to improve the long-term creep rupture strength.

4. Conclusions

We performed creep tests for three types of Fe-9Cr-Hf alloys with a ferritic matrix w/o Fe2Hf Laves phase particles formed by two precipitation routes: (1) with fine Fe2Hf particles formed by the conventional precipitation route (the particles are called CP particles), namely formed in the α matrix after γ → α phase transformation; (2) with fine Fe2Hf particles formed by interphase precipitation (called IP particles) during δ → γ phase transformation before γ → α phase transformation and also (3) without Laves phase particles. The main results obtained are as follows:
  • CP particles were found to be effective in reducing the creep rates from the transient creep regime until the early stage of accelerating creep regime, but they were susceptible to particle coarsening during the creep tests;
  • IP particles were less effective in reducing the creep rate in the early creep stages but showed a higher stability against particle coarsening than CP particles during the creep tests, which suggests their effectiveness in delaying the recovery and recrystallization processes in the matrix and thereby retarding the onset of a rapid creep acceleration and creep rupture.

Author Contributions

Conceptualization, S.K.; investigation, S.K. and T.H.; writing—original draft preparation, S.K.; writing—review and editing, S.K. All authors have read and agreed to the published version of the manuscript.

Funding

This research was funded by Grant-in Aid for Scientific Research (C) in Japan Society for the Promotion of Science, grant number [15K06496].

Institutional Review Board Statement

Not applicable.

Informed Consent Statement

Informed consent was obtained from all subjects involved in the study.

Data Availability Statement

Not applicable.

Acknowledgments

The authors thank T. Hibaru of NIMS for his experimental assistance. The authors also thank K. Kimura of NIMS for performing a part of creep tests.

Conflicts of Interest

The authors declare no conflict of interest.

References

  1. Key World Energy Statistics 2020 IEA. Available online: https://www.iea.org/reports/key-world-energy-statistics-2020 (accessed on 10 January 2021).
  2. Status of Power System Transformation 2018. Advanced Power Plant Flexibility-OECD/IEA. Available online: https://www.iea.org/reports/status-of-power-system-transformation-2018 (accessed on 23 October 2020).
  3. Masuyama, F. History of Power Plants and Progress in Heat Resistant Steels. ISIJ Int. 2001, 41, 612–625. [Google Scholar] [CrossRef]
  4. Sawada, K.; Kushima, H.; Tabuchi, M.; Kimura, K. Microstructural degradation of Gr.91 steel during creep under low stress. Mat. Sci. Eng. 2011, A528, 5511–5518. [Google Scholar] [CrossRef]
  5. Okamoto, H. Phase diagrams of binary iron alloys, Monograph Series on Alloy Phase Diagrams Vol. 9. ASM Int. 1993. [Google Scholar]
  6. Murata, Y.; Koyama, T.; Morinaga, M.; Miyazaki, T. Prediction of the Laves Phase Morphology in Fe–Cr–W–C Quaternary Steels with the Aid of System Free Energy Concept. ISIJ Int. 2002, 42, 1423–1429. [Google Scholar] [CrossRef]
  7. Abe, F. Effect of fine precipitation and subsequent coarsening of Fe2W Laves phase on the creep deformation behavior of tempered martensitic 9Cr-W steels. Metall. Mater. Trans. 2005, 36A, 321–332. [Google Scholar] [CrossRef]
  8. Kobayashi, S.; Kimura, K.; Tsuzaki, K. Interphase precipitation of Fe2Hf Laves phase in a Fe-9Cr/Fe-9Cr-Hf diffusion couple. Intermetallics 2014, 46, 80–84. [Google Scholar] [CrossRef]
  9. Kobayashi, S.; Hibaru, T. Formation of the Fe2Hf Laves phase along the eutectoid-type reaction path of δ-Fe→γ-Fe+Fe2Hf in an Fe-9Cr based alloy. ISIJ Int. 2015, 55, 293–299. [Google Scholar] [CrossRef]
  10. Kobayashi, S.; Hibaru, T.; Kimura, K. Microstructure control using Laves phase precipitation for further improving creep resistance of ferritic steels. In Proceedings of the 1st international conference on advanced high-temperature materials technology for sustainable and reliable power engineering (123HiMAT-2015). 123rd committee on heat resisting materials and alloys JSPS, Sapporo, Japan, 29 June–3 July 2015; pp. 11–14. [Google Scholar]
  11. Kobayashi, S.; Kimura, K.; Takeyama, M. Creep behaviors of high Cr heat resistant ferritic steels with different distribution/morphology of Laves phase particles. In Proceedings of the 4th international ECCC conference- Creep & Fracture Conference, Düsseldorf, Germany, 10–14 September 2017. [Google Scholar]
  12. Humphreys, F.J.; Hatherly, M. Recrystallization and Related Annealing Phenomena, 2nd ed.; Elsevier: Oxford, UK, 2004. [Google Scholar]
  13. Porter, D.A.; Eastering, K.E. Phase Transformations in Metals and Alloys, 2nd ed.; Stanley Thornes Publishers Ltd.: Gloucestershire, UK, 1992. [Google Scholar]
  14. Garofalo, F. Fundamentals of Creep and Creep-Rapture in Metals; Macmillan: New York, NY, USA, 1965. [Google Scholar]
  15. Barrett, C.R.; Lytton, J.L.; Sherby, O.D. Effect of grain size and annealing treatment on steady-state creep of copper. Trans. AIME 1967, 239, 170–180. [Google Scholar]
  16. Terada, Y. Effects of Subgrain Formation on High Temperature Creep Resistance in Single-Phase Polycrystalline Ni Base Alloys. Ph.D. Thesis, Tokyo Institute of Technology, Tokyo, Japan, 1992. (In Japanese). [Google Scholar]
Figure 1. Backscattered electron (BSE) images of the alloys for creep tests at low (ac) and high (df) magnifications: (a,d) 0.03 Hf alloy, (b,e) 0.09 Hf alloy, (c,f) 0.33 Hf alloy. Fine particles observed in (f) are Fe2Hf Laves phase. Relatively coarse particles observed in (ac) are Hf containing carbide/carbonitride.
Applsci 11 02327 g001
Figure 2. Electron backscatter diffraction (EBSD) inverse pole figure maps of the alloys for creep tests: (a) 0.03 Hf alloy, (b) 0.09 Hf alloy, (c) 0.33 Hf alloy. The orientations are indexed by α-ferrite (body-centered cubic structure). Black lines denote boundary level above 15° and yellow lines, boundary level between 2° and 15°.
Applsci 11 02327 g002
Figure 3. Creep curves of the alloys tested under creep conditions of (a) 650 °C/60 MPa [11] and (b) 700 °C/30 MPa.
Applsci 11 02327 g003
Figure 4. Stress vs. Larson-Miller parameter plot (LMP) for creep rupture time in the alloys tested under the creep conditions indicated. LMP is a parameter to describe the equivalence of time, expressed by T (logt + C) where T is the creep test temperature, t is the time to rupture. C is a constant (25 is taken here).
Applsci 11 02327 g004
Figure 5. Creep rate vs. time curves in a logarithmic time scale for the creep tests shown in Figure 3: (a) 650 °C/60 MPa [11] and (b) 700 °C/30 MPa.
Applsci 11 02327 g005
Figure 6. Creep rate vs. time curves in a liner time scale for the creep tests shown in Figure 3: (a) 650 °C/60 MPa [11] and (b) 700 °C/30 MPa.
Applsci 11 02327 g006
Figure 7. BSE images taken from gauge portions of the creep-interrupted alloys at 240 h under the creep condition of 650 °C/60 MPa at low (a, b) and high (c,d) magnifications: (a,c) 0.09 Hf alloy, (b,d) 0.33 Hf alloy. Fine particles observed in (c,d) are Fe2Hf Laves phase. Relatively coarse particles observed in (a,b) are Hf containing carbide/carbonitride.
Applsci 11 02327 g007
Figure 8. Scanning transmission electron microscope (STEM) bright field images (a,b) and EDS Hf maps (c,d) of the alloys taken from gauge portions of the samples corresponding to Figure 7: (a,c) 0.09 Hf alloy, (b,d) 0.33 Hf alloy.
Applsci 11 02327 g008
Figure 9. BSE images taken from gauge portions of the alloys creep ruptured under the condition of 650 °C/60 MPa at low (a,b) and high (c,d) magnifications: (a,c) 0.09 Hf alloy, (b,d) 0.33 Hf alloy.
Applsci 11 02327 g009aApplsci 11 02327 g009b
Figure 10. BSE images taken from gauge portions of the alloys creep ruptured or creep interrupted under the condition of 700 °C/30 MPa at low (a,b) and high (c,d) magnifications: (a,c) 0.09 Hf alloy, (b,d) 0.33 Hf alloy.
Applsci 11 02327 g010
Figure 11. XRD profiles obtained from the 0.33 Hf alloy: (a) Before creep tests; (b) after creep rupture under 650 °C/60 MPa; (c) after creep interruption under 700 °C/30 MPa. The diffraction peaks at ~40 degrees correspond to Cu Kβ α-Fe (110) diffraction.
Applsci 11 02327 g011
Figure 12. Measured number density (a) and area fraction (b) of Laves phase particles and calculated mean radius (c) and Zener pinning force (d) of the particles taken from the creep-interrupted and creep-ruptured samples, as plotted against their Larson-Miller parameter (LMP) values.
Applsci 11 02327 g012aApplsci 11 02327 g012b
Table 1. Chemical compositions of the alloys used in the present study.
Sample DesignationChemical Composition/wt.%
CrHfZrCNOFe
0.03 Hf9.00.03<0.0010.0030.0010.004bal.
0.09 Hf9.20.09<0.0010.0020.0010.002bal.
0.33 Hf9.00.330.0030.0020.0010.002bal.
Table 2. Summary of creep data obtained in the present study.
Sample
Designation
Creep Condition Temp./StressTime to Rupture or Interrupt/hStrain to Rupture/%LMP
(C = 25)
× 10−3
0.03 Hf650 °C/60 MPa280.723.025.3
700 °C/40 MPa140.917.926.4
700 °C/30 MPa534.626.327.0
0.09 Hf650 °C/60 MPa240.0 1-25.3
650 °C/60 MPa3104.129.726.3
700 °C/30 MPa813.724.627.2
0.33 Hf650 °C/60 MPa240.0 1-25.3
650 °C/60 MPa1495.857.426.00
700 °C/40 MPa313.867.026.8
700 °C/30 MPa934.7 1-27.2
1 The test was interrupted at the designated time.
Publisher’s Note: MDPI stays neutral with regard to jurisdictional claims in published maps and institutional affiliations.

