1. Introduction
The commercial production of complex construction parts or safety-related components is often only possible by using new, high strength materials. Generally, multi-phase (MP) materials are used, including MP steels, which show a promising step to light-weight construction [
1]. Their microstructure is characterized by a combination of different hard and soft phase components. Examples for MP steels are dual phase steels, spheroidized steels, retained austenite steels, complex phase steels, and martensitic phase steels [
1]. One group of the recent MP materials are the metal matrix composite (MMC) and here, the especially transformation-induced plasticity (TRIP) matrix composites based on newly developed austenitic cast TRIP steel material (TRIP—transformation-induced plasticity) in combination with MgO-partially stabilized ZrO
2 ceramic (MgO-PSZ) [
2]. This kind of composite is of great interest for various applications due to its high energy absorbing capacity [
3]. The greater energy absorbing capacity of this composite owes to the transformation in present phases during deformation. The metastable austenitic phase in these materials transforms into martensite under applied strain, and the MgO-PSZ particles transform into a monoclinic phase from the tetragonal phase under stress [
4,
5]. This transformation in the material into more compact and harder phases during deformation strengthens the material by increasing hardening while allowing it to deform under applied external load [
6,
7].
The Institute of Metal Forming (IMF) has worked extensively on the experimental investigation and understanding of the transformation phenomena in TRIP steels [
8,
9]. Thus, an example of this is based on a model by Perlade et al., a new metallurgical metallophysical model to calculate the kinetics and strain-induced retained austenite transformation of the associated microstructure. Mathematically, this model consists of a system of differential equations that was numerically solved [
10,
11]. In addition to the martensite fractions after loading up to different deformation degrees, the model also provides the dislocation density, the density of the martensite nuclei, the mean circle-equivalent diameters of the retained austenite grains and the martensitic lath, as well as the respective flow stress of the retained austenite. The findings were completed with the recent investigations within the Collaborative Research Centre CRC799 TRIP-Matrix-Composite [
12]. It was demonstrated that when high alloy steels with the low stacking fault energy (SFE) of 10–12 mJ/m
2 [
13] are deformed at room temperature, the meta-stable face centered cubic (FCC) austenitic phase transforms into the body centered cubic (BCC) ά-martensitic phase through highly deformed hexagonal ε-martensitic phase [
14,
15]. Here, several investigations are known where the stacking faults [
16], martensitic lath thickness [
17], the transformation behavior of the material [
18], nano-hardness measurement of different phases [
19], the evolution of the hardening coefficient of the material, and critical strains for transformation [
15,
20,
21] were determined.
Given that this transformation of a soft phase into harder phases during deformation is of interest for high-end applications, it must be stated that its dependence on many chemical and physical material parameters adds complexity to developing the complete understanding of the phenomena and hence restricts the material scientists from obtaining full control over material property calibration, during the manufacturing of parts [
22,
23,
24,
25]. Many factors affect the formability of these materials. Some of the major ones are the phase composition of the composite, grain size and orientation distribution, manufacturing technique employed, deformation degree and strain rate adopted during deformation, working temperatures, and the chemistry of the constituents [
26,
27,
28]. A complete understanding of the interdependence of these parameters is still not given. Therefore, until now, the only reliable way to investigate the mechanical and microstructural properties of these components is through extensive experimentation, which is an expensive and time-consuming process.
The above facts show that the development of an accurate numerical model incorporated with physics based microstructural properties is currently the only acceptable solution [
29,
30,
31,
32]. The open source crystal plasticity simulation framework DAMASK (The Düsseldorf Advanced Material Simulation Kit) developed by Max-Planck-Institut für Eisenforschung GmbH (MPIE, Düsseldorf, Germany) [
33] was chosen for this purpose. The usage of the fast Fourier transform (FFT) approach for modeling and prediction of micro-mechanical fields in polycrystalline materials was proposed [
34], and the DAMASK framework was extended to solve elastic–viscoplastic dislocation-based boundary value problems using the spectral solver in combination with various constitutive models [
35]. The spectral methods were developed further to predict the micro-mechanical behavior of plastically deforming heterogeneous materials [
36], i.e., multi-phase steels and composites.
The basis to capture the TRIP/TWIP (twinning-induced plasticity) effect in high manganese steels at different temperatures has been chosen as a constitutive, physics-based material model by Su Leen [
37]. This model was incorporated in DAMASK. Madhivala further developed the model specifically for the range of SFE 13–118 mJ/m
2 [
38]. This model makes it possible to simulate complex materials [
33], including TRIP matrix composites.
While applying this model, it should be considered that it comprises more than 40 coefficients, many of which are physics-based, and some are fitting parameters. Their true identification for any given material is a real challenge. Although the coefficient values have been proposed and validated with experimental results, calibrating the material model for other materials of the same class is still needed.
This project aims to process and apply results from different research groups, mainly from the CRC799, to identify the value of physical and fitting parameters of the material model being used and develop a virtual laboratory for the efficient formability analysis of multi-phase materials. The simulation model outcome is verified by comparing the global and local deformation and transformation behavior of the materials under different loading conditions with previously carried out work.
2. Methodology
An equi-grid-point based representative volume element (RVE) containing phase and grain orientation information is used as a geometry file for DAMASK simulations. This geometry can be obtained by 2D or 3D electron backscatter diffraction (EBSD) measurements of a specific area of interest or can also be virtually constructed using single or multi-layer Voronoi tessellation, which generates the desired material microstructure. The Voronoi tessellation microstructure generation code automatically creates RVEs with user-defined grain size distribution (GSD), orientation distribution function (ODF), and the volume composition of each phase. Throughout this article, a neutral ODF was used for the virtual constructions of the RVEs. Of course, this condition does not hold up well for the RVEs with very few grains. This has been elaborated and discussed in the results section.
A uni- or multi-axial load is defined in the form of a nine-point vector matrix. The rate of deformation and direction is controlled in the defined load file. The material file is well elaborated with the phase and orientation of every grain defined in the geometry file. There are many material models available to be selected, and in each model, defined parameters must be stated for a specific phase. Specific details about the loading conditions are provided in each section, respectively.
Several material models available within the DAMASK framework developed earlier by several research groups have been adopted in the current work. The hard phases, like cementite (Fe
3C), MgO-PSZ, and ά-martensite, are only assigned the elastic deformation attributes. Ferrite is assigned a phenomenological based elastic-plastic model. For retained austenite, a dislocation density-based constitutive and transformation model was developed by Su Leen Wong [
37]. The model parameters were calibrated for a high manganese TRIP/TWIP steel case. This model was adopted in the current work for the TRIP steel case.
It is important to mention here that the grain size, texture, and other attributes were not specifically measured experimentally, but their realistic values, similar to what has been reported in the literature before, were adopted for the virtual construction of RVEs. Specific details about the grain size and texture distribution data are provided in each section, respectively. Moreover, in all multi-phase simulation models, the interface between two phases is not defined, which means that a perfect bonding at the interface is assumed.
The spectral solver is used to solve the set of equations by an iterative process. The results for each increment are stored in a binary spectral solver file, which can be read after appropriate post-processing. The post-processing is carried out using predefined sub-routines such that the global deformation behavior of the stated RVE can be obtained from increment to increment in the form of a stress/strain curve or can be recorded for a specific instance in the deformation history to analyze the local stress/strain distribution. This section explains the methodology adopted to step-by-step construct and improve the understanding about adopting DAMASK for complicated simulations for different materials.
2.1. Elastic-Plastic Simulation of Isotropic Multi-Phase Materials
For this case, a spheroidized steel AISI 5140 was selected due to its discrete phase distribution and the availability of material data. An SEM image of the steel (
Figure 1a) was cropped to a small area of 503 × 365 pixels (
Figure 1b). The image was digitized to a state pixel-to-pixel phase information for a DAMASK geometry input file. This digitized file, when visualized using ParaView, is provided in
Figure 1c.
It is observed that the digitized file has two isotropic phases. The cementite particles are embedded in the ferrite matrix. It is important to mention here that the actual material attributes are more complicated than those stated in the current case. The objective of these simulations was to run multi-phase simulations for an isotropic and homogeneous simple material. For further details about the modeling strategy in this work, the readers are encouraged to read the published work of Umar et al. [
39].
The ferrite phase was assigned material properties based on the phenomenological power law, and model properties in this research were adapted from the work of Tasan et al. [
40]. The cementite phase, being very hard as compared to the ferrite phase, was assigned elastic properties obtained from the previous work of Jiang et al. [
41]. Detailed material parameter definitions are provided in
Appendix A.1 and
Appendix A.3. The geometry was loaded in tension along the horizontal axis. The total deformation of 27% in 100 increments was achieved, and the results were processed using available subroutines.
2.2. Generating Artificial Geometry for Metal Matrix Composite (MMC) Simulations from Scanning Electron Microscope (SEM) Image
The problem with the secondary electron (SE) or backscattered electron (BSE) images is that although these contain information about phases, they do not contain information about the grain orientations. When these data are converted into a geometry file for DAM-ASK simulations, they only contain phase information without grain shape or grain orientation data.
In this part of the work, a methodology was developed to use the light microscope image of 10% TRIP steel composite and virtually construct the steel-phase microstructure using Voronoi Tessellation criteria with isotropic orientation distribution and the average grain size data (reported earlier by Sergey et al. [
8]). This method was quickly adopted to transform the light microscope images into relatively realistic geometry files containing the phase and orientation information for DAMASK simulations. The synthetically constricted matrix data are purely dependent on the user-defined input parameters and the capabilities of the adopted code used for RVE construction.
A light microscope image was cropped to a smaller size for a relatively smaller data set and faster computing time, as shown in
Figure 2a. The image was digitized into a 275 p-wide and 275 p-high phase map using an already developed Python code, shown in
Figure 2b. A virtual 2D randomly textured microstructure of the same size was generated using a single layer Voronoi tessellation code provided with the DAMASK distribution package (
Figure 2c). The constructed microstructure was overlapped with the phase data to replace pixels where ceramic particles were present. Using this technique could successfully generate the desired microstructure shown in
Figure 2d. It is important to note that the generated microstructure was not verified by comparing with the experimental results but rather constructed by merging the known experimental data and virtually generated information.
The steel was assigned material properties based on the TRIP/TWIP material model adopted from Wong et al. and Manjunatha et al. [
37,
38]. The MgO-PSZ particles being very hard compared to the steel phase, were assigned elastic properties obtained from the previous work of Willi et al. [
42]. The detailed material attributes are provided in
Appendix A.2 and
Appendix A.3.
During the simulation, a total of 16% tensile strain in the horizontal direction was applied. The deformation was divided into 2050 equal-sized increments. The results were processed using available subroutines in DAMASK documentation for plotting graphs and visualization. For further details, the readers are encouraged to refer to the work of Qayyum et al. [
43,
44].
2.3. Adapting Actual Electron Backscatter Diffraction (EBSD) Data for Simulations
The complication in generating geometry files from a light microscope image, as shown in
Figure 3a using the methodology described in the earlier section, is that the MgO-PSZ particles do not appear at the positions in which they exist. When looked closely, the MgO-PSZ particles appear to exist in the middle of the steel matrix grain as some are represented by white arrows in
Figure 3b, whereas, in reality, they usually exist at the junction of the steel grains.
A challenge associated with this methodology is the incorrect grain distribution of the steel matrix, which happens due to the simple overlapping of the two data sets. As this methodology is quite simple, it yields virtual microstructures where all the grains are equal-sized. This is usually not the case for the actual microstructures where a bell-shaped grain size distribution is observed with some very small and some very large grains.
For appropriately addressing this issue, there are two possible solutions for creating RVEs:
Using actual EBSD data for the RVE construction;
Using more sophisticated tools, i.e., DREAM 3D or multi-layered Voronoi tessellation for virtual RVE construction.
The real EBSD data of the TRIP steel MgO-PSZ MMCs were chosen and were used to create an RVE. The EBSD image was used as a sample and is shown in
Figure 4a, whereas
Figure 4b represented the Φ
1 plot of the same area.
The available subroutine to convert data from table to geometry, provided the DAMASK source code was used, and the resulting RVE is shown in
Figure 5.
The steel was assigned material properties based on the TRIP/TWIP material model. The model properties in this research were adapted from Wong et al. and Manjunatha et al. [
37,
38]. The MgO-PSZ particles being very hard compared to the steel phase, were assigned elastic properties obtained from the previous work of Willi et al. [
42]. The detailed material attributes are provided in
Appendix A.2 and
Appendix A.3.
The total deformation of 25% in 212 increments was applied in the tensile direction horizontal to the shown RVE in
Figure 5. The results were processed using available subroutines for plotting graphs and visualization. For further details about the methodology, readers are encouraged to read the work of Qayyum et al. [
43,
44].
2.4. Tuning the Material Model by Calibrating with Experimental Data
2.4.1. RVE Optimization for Faster Simulations
To reduce the RVE size for faster computations, 3D RVEs were defined such that each pixel represented one grain. Random orientations were generated and assigned to the models. The defined RVEs were 3 × 3 × 3 (27 grains), 5 × 5 × 5 (125 grains), 8 × 8 × 8 (512 grains), and 10 × 10 × 10 (1000 grains). All the geometries were simulated for five load directions, which are clarified in
Figure 6.
2.4.2. Optimal RVE Thickness for 3D Full Phase Simulations
The size of an RVE greatly affects the computation effort. For the test case of dual-phase (DP) steel, the effect of RVE thickness on the changing global and local stress and strain was analyzed. RVE with 18 µm estimated sphere diameter (ESD) was constructed using DREAM3D (BlueQuartz Software, LLC, Springboro, OH, USA). The constructed RVE was sliced into 1, 5, 10, 15, 20, 25, 30, 40, and 50 layers to produce different geometries comprising the same microstructure and increasing thickness. Crystal plasticity model parameters for ferrite and martensite were taken from already published data and assigned to respective phases, and they are provided in
Appendix A.1.
A schematic diagram representing the generated 3D RVEs and their slicing sequence for constructing simulation geometries is shown in
Figure 7. Ferrite (F) and martensite (M) are shown separately in the sliced images to visualize the phase distribution in the RVEs better. These simulations helped in better understanding the effect of thickness on the convergence of results. All the RVEs were loaded in tension. The loading axis was shown with red arrows in
Figure 7. Please follow the work of Qayyum et al. for further details [
45].
2.4.3. Tensile Testing of Cast X8CrMnNi16-6-6 Steel with Acoustic Emission (AE) Data
The experimental data used to calibrate the numerical simulation results were taken from the published work of Vinogradov et al. [
46]. Some of the crucial details from the experimental procedures are given here.
High alloyed Cr–Mn–Ni cast steel with 16 wt.% chromium, 6 wt.% manganese, and 6 wt.% nickel were used for this study. The chemical composition of the material and other characteristics are presented in
Table 1. Here, γ
SF is calculated according to the methodology proposed by other researchers [
47,
48] on the basis that the SFE of pure iron is (36–42 mJ/m
2) and then taking into account the influence of other elements.
After casting, the material was heat-treated at 1323 K for 30 min, followed by nitrogen quenching. The testing was done using a Hegewald & Peschke universal tensile testing machine. The tests were performed under a constant strain rate of 1 × 10⁻² s−1 at room temperature. The ferromagnetic phase fraction during testing was detected using a Fisher ferritoscope according to DIN EN ISO 17655.
2.4.4. Calibration of TRIP Steel Model
The optimal RVE was decided based on the previous studies of the authors [
44]. The values of the physical parameters were taken from the literature [
37,
38]. Different fitting parameters were manually adjusted to match the numerical simulation results of global stress and strain behavior with experimental observations. The parameters mentioned in
Table 2 are the calibrated values for the cast X8CrMnNi16-6-6 steel. The SFE used for this model was 10 mJ/m
2. The value of adjusting the parameter controlling the dislocation mean free path was changed to 55. The lamellar size of martensite was adopted from the literature [
49] for this specific material and was defined to be 50 nm. The value of adjusting the parameter controlling the transformation mean free path was changed to 20. The solid solution strength was used as a fitting parameter and was defined to be 50 MPa in this case.
The simulations were run for tensile and compressive load cases. A total of 40% deformation in equisized 2500 steps was applied in each case. The results of the simulations were processed by using already developed subroutines. The tensile test results are compared with the already published experimental data. The test results from the tensile and compressive simulations are compared in the results section to show how the loading direction affects the simulation outcome.
2.5. Incorporating Damage in the Model
Incorporating damage in crystal plasticity (CP) simulations is challenging for implementing a mathematical model with acceptable accuracy. Several researchers have worked on this problem in the recent past and presented valuable results along with some limitations [
50,
51]. After identifying the optimal RVE size, the damage criteria are incorporated, and simulations are run to collect useful results.
For simpler simulations, a 2D microstructure was developed comprising two phases with an average grain size of 8 µm. The already identified attributes for the TRIP steel were assigned to the steel matrix with ductile damage criteria having a maximum principal strain at the damage to be 0.5. MgO-PSZ particles were assigned elastic deformation attributes. The parameters for the TRIP/TWIP steel phase are provided in
Appendix A.2. The damage model parameters are provided in
Appendix A.4. The elastic model attributes for the zirconia particles are provided in
Appendix A.3.
The constructed RVE shown in
Figure 8 was loaded in tension along the horizontal direction by applying mixed boundary conditions with a quasi-static strain rate. The simulation was run up to 20% overall deformation. The global and local deformation behavior was processed and analyzed later using already developed subroutines. Please refer to the work of Qayyum et al. for detailed information about the methodology [
52].
3. Results
DAMASK uses spectral solver to solve the complex set of equations by fast Fourier transform (FFT) technique. The results are stored in a text file for each converged iteration at each solution point. The model results are then post-processed for plotting or for visualization using the provided subroutines with DAMASK. There are generally two ways of post-processing the results:
Depending on the interest, both post-processing techniques have their advantages. The averaged results can be further processed and plotted using any tool. In contrast, the overlay results are written in a “.vtr” file, a ParaView readable format to visualize the datasets. Here, the results have been processed to provide the most appropriate information based on the intent of the model.
3.1. Elastic-Plastic Spheroidized Steel Simulation
The initial simulation model was developed from an SEM image of spheroidized steel microstructure to start with multi-phase simulations. It is observable that due to proper spheroidization, the cementite particles are close to a round shape. The stresses and strains observed in the microstructure at the global deformation of 27% are shown in
Figure 9.
The simulation results provide insight from the local stress and strain maps. The stress map is shown in
Figure 9a. It is observed that, as cementite particles are hard and only elastic properties were assigned to them, the stress inside these particles ranges from 2 to 3 GPa. On the inside edges of these particles, the stress can rise as high as 4 GPa. In contrast to the very high stresses in the cementite particles, the ferrite matrix stresses range from 8.5 to 850 MPa. Although the ferrite matrix is an isotropic/homogeneous phase, stress hot spots are observed in the local stress maps.
Figure 9 shows the local strain map after 27% global strain. Here, some interesting patterns are observed which can emerge in the microstructure during deformation. The image is a very nice representation of the possibility to understand how the material deforms at the microstructural scale. It is observed that on the edges of the closely packed fairly round cementite particles at 45 degrees to the loading axis, the ferrite matrix undergoes high strains of around 150% during deformation. These high strain contrast sites are more prone to failure. On the other hand, it is observed that the cementite particles, being very hard, do not undergo any significant deformation.
3.2. Elastic-Plastic MMC Simulation
A simulation model was developed by overlaying light microscope images and a virtually constructed matrix using Voronoi tessellation criteria to observe the effect of a polycrystal matrix in multi-phase materials. In contrast with the previous simulation model, the MgO-PSZ particles in this model have random sizes and shapes. The stresses and strains observed in the microstructure at the global deformation of 16% are shown in
Figure 10.
The local stress map at the final frame of the simulation is presented in
Figure 10a. Due to the polycrystalline microstructure of the matrix and the random shape and size distribution of MgO-PSZ particles, the stress in particles is high and is randomly distributed. It is observed that the stress in MgO-PSZ particles normally ranges from 2.5 to 3.5 GPa. Usually, the large grains endure more stress and hence are more likely to break during deformation. Stress distribution in the matrix—since it deforms plastically and absorbs energy during deformation—ranges from 250 to 500 MPa.
Figure 10b shows the local strain distribution in the sample. It is observed that when the MgO-PSZ particles—regardless of the shape and size—are closely packed, the steel matrix between them undergoes very high strains and hence is prone to failure at these points. Shear bands crossing the matrix at 45 degrees to the loading axis are observed. The present MgO-PSZ particles play a role in restricting this local deformation, so these materials depict higher strength during deformation.
When experimentally observed [
53]. Generally, two phenomena are responsible for void nucleation, leading to sample failure. The MgO-PSZ particles undergo brittle cracking due to high stresses as observed in
Figure 10a and the interface decohesion of the ceramic/matrix interface due to high local strain at the interface in
Figure 10b.
3.3. Using Real EBSD Data for MMC Simulation
Since the actual microstructure is different from what was modeled in the previous example, an actual EBSD data set was used to develop a new simulation model at this step. The geometry only comprises one big and one small MgO-PSZ particle. The stresses and strains observed in the microstructure at the global deformation of 25% are shown in
Figure 11.
In this numerical simulation model, the geometry is a relatively high resolution and more zoomed. This helps in observing details in the deformation mechanism.
Figure 11a represents the local distribution of logarithmic strain. As some grains are more likely to be oriented in the direction favorable to dislocation movements, this affects the strain distribution in the material. Apart from the ceramic/matrix interface, a high strain of around 100% at some points in the matrix is also observed.
Figure 11b shows the stress variation in the matrix. The stress around ceramic particles is very high and is more concentrated at the sharp corners.
The TRIP/TWIP model is not able to predict the spatially resolved martensitic laths. Rather, it provided information about the transformation volume percent depending on the grain orientation and endured stress.
Figure 11c shows the map of martensitic volume percent at 25% of true global strain. It is observed that the maximum amount of martensite is produced around the MgO-PSZ particle in the grains with a more favorable orientation for transformation. Such observations were previously made by other researchers [
18,
54], which verifies that the developed model can qualitatively predict the local deformation and transformation results.
3.4. RVE Optimization for Fast Simulations
As explained in
Section 2.4.1, to determine the least computing expensive yet homogenous RVE, a set of simulations was run by loading the constructed RVEs in different directions and check for an anisotropic mechanical response. The results of the study are presented in
Figure 12.
It was observed that with fewer grains, rotating the load frame drastically affects the stress/strain and transformation response of RVE, as in
Figure 12a. It is because each grain is differently aligned to the direction favorable for deformation and transformation. When the number of grains is increased from 27 to 1000, i.e., in
Figure 12a–d, it was observed that the response becomes more independent of the rotation of the load frame since increasingly random orientations are present and hence in whatever direction the RVE is loaded the response is same.
With the increasing size of RVE, the orientation distribution becomes more homogeneous, resulting in the isotropic mechanical response of the RVE. Hence, one can conclude that the bigger the RVE, the better it is. It was concluded in this study that at least 500 grains should be considered in an RVE for running CP simulations [
44]. The simulation time is also an interesting factor to note in this case, which can be an important parameter to estimate the increase in computation time with the increasing size of RVE. The observed time for the stated simulation completion is given in
Table 3.
3.5. Optimal 3D RVE Thickness
The numerical simulations were run for RVEs with increasing thickness, as discussed earlier in
Section 2.4.2. The stress and strain distribution plots are shown in
Figure 13a and b, respectively. It was observed that as the RVE thickness increases from one layer to 50 layers, the sharp stress and strain contrast on the top surfaces diminish due to the attribute distribution in the third dimension. Like the stress distribution, in the middle section of the simulated geometry, it is observed that the local strain distribution converges with a similar solution output in the case of 40-layer and 50-layer geometries, respectively. The magnitude and position of the local strain distribution in these cases are identical.
This detailed study was carried out in the previous work of Qayum et al. [
45]. A function was proposed to estimate the adequate RVE thickness based on the grain number and size data. The readers are encouraged to refer to that work for further details.
3.6. Calibrating the Material Model Parameters for Cast X8CrMnNi16-6-6 Steel
The X8CrMnNi16-6-6 TRIP steel was tested earlier by Vinogradov et al. [
46]. The flow curve and measured transformation data are presented in
Figure 14a. The acoustic emission data results are presented in
Figure 14b, where the evolution of a dislocation glide, martensitic transformation, and the motion of partial dislocations are individually tracked with an evolving strain.
Numerical simulation results of the calibrated material model are compared with the experimental observations in
Figure 15. It can be observed that there is a very close comparison between the results obtained from both sources. In the flow curves, the maximum difference of 23 MPa is present, which is 3.7%. In martensitic volume percent prediction, a maximum difference of 4.81% presents a 40% error. Although there is very little difference in flow curve prediction, there is an adequate difference in the prediction of martensitic volume percent due to possible experimental measurement inaccuracy.
In DAMASK TRIP/TWIP material, the total deformation is calculated as the sum of elastic and plastic deformation. The total plastic deformation is calculated by adding deformation due to dislocation glide, twinning, and transformation. The model is detailed, and each deformation phenomenon is governed by its own set of equations comprising physical and fitting parameters. For further details of the model, the readers are encouraged to refer to the work of Wong et al. [
37] and Manjunatha et al. [
38].
The simulation results can be post-processed to decompose the total deformation of the material into its components. The results can be plotted to see the evolution of different phenomena in the material during deformation. Such a plot for our simulation model is presented in
Figure 16. As there is no twinning in the material accumulated strain due to partial dislocations, it is almost zero. Strain accumulation due to transformation starts around 10% normalized strain and tends to saturate with increasing deformation. As observed, the physical strain due to dislocation glide starts with plastic deformation and increases almost linearly with the total strain in the material to a maximum of 1.15.
Numerical simulations with the same geometry file and material file but with different load directions were run to compare the material behavior. The results are presented in
Figure 17. During tensile loading, the material shows the earlier and greater martensitic transformation than compressive loading since the martensitic transformation results in a volume increase. Thus, there is more room for additional volume during tensile load, whereas in compression, the material deforms but restricts volume increase.
3.7. Damage Simulations for TRIP Steel Mg-PSZ
The TRIP steel and MgO-PSZ composite simulations were run to analyze the interplay of different attributes during deformation. Each behavior is presented and discussed in
Table 4.
These findings from the performed research help understand the evolution of different phenomena and how they are inter-connected. It is important to mention here that these results are not quantitatively verified by comparing with experimental observations but are qualitatively similar to the results published previously [
18,
54].
The work carried out until now has paved the path towards a detailed study in the future comprising in situ tests for validating the numerical simulation results. Such work is currently in progress at our institute and will be published in future studies.
4. Discussion
Creating material and showing its high performance in a controlled environment on specially designed samples with sophisticated equipment is one task. Understanding the underlying interplay of complex deformation principles majorly at the atomic scale and then building up the technology for large-scale manufacturing and application is a completely different endeavor. One of the biggest challenges in scaling up the technology is understanding the material behavior in varying environmental, bulk deformation, and complex loading conditions. The only appropriate way of doing this is through extensive experimentation. Although highly accurate, it is slow, expensive, and difficult due to the high dependence on resources and equipment. It is also impossible to obtain some data—which might be highly valuable for scientists—using experimental methods. This is where accurate numerical models can help advance materials science.
In the recent past, due to the development of detailed CP models and fast growth in computation powers, it has become possible to accurately model and simulate the complex material behaviors that were deemed almost impossible before [
40,
55]. The material models developed on existing CP-based open source code DAMASK allows to numerically model and study the material behaviors with high accuracy [
56]. Finding a methodology to suit the available resources and identifying the different material parameters is an important task. The challenge associated with such models is that they comprise of many physical and fitting parameters that need adjustment for every new material. However, many researchers [
40,
57,
58,
59] have previously developed material libraries by identifying and verifying the model parameters using different experimental and analytical techniques from time to time.
In the current work, methodologies are proposed that use minimal resources for accurately modeling the desired microstructures from known data. The values of fitting parameters are identified and provided as material libraries that scientists can use with confidence for acquiring satisfactory results. In the current work, the data flow between the digital tools and Python scripts for the digitization of microstructural data obtained from optical or electron microscopes to construct RVEs is presented for various causes. The methodology is shown to be working with a few limitations, which are discussed in each section.
The improved technique for creating geometry files with more realistic microstructural representation—Python script—was developed to virtually create a microstructure using Voronoi tessellation criteria and then overlay the light or electron microscope image. This helps in the creation of RVEs using limited available microstructural information without expensive EBSD data. Although this method can create microstructures with exact grain shapes and sizes, the limitation is the non-realistic placement of second phase particles.
To overcome this limitation, two possibilities are present. One is to use actual EBSD data, and the other is to construct virtual microstructures using more sophisticated tools. Diehl et al. [
60] showed that using 3D RVE (measured using the focused ion beam (FIB) milling of the sample to a certain thickness and scanning for EBSD data on every layer) yields more accurate results than 2D RVEs. The limitation of this technique is that the sample is milled to obtain the data, which does not leave material for the testing and validation of simulation results. This is where the use of advanced models to generate virtual RVEs—such as Dream3D [
61] or multi-layered Voronoi tessellation [
62] codes—comes into play. The advantage of using such codes is the custom creation of desired microstructures for microstructurally informed simulations.
A very high resolution and detailed virtual RVE can be created using advanced modeling techniques mentioned earlier, but they will require immense computation power. For CP simulations, RVEs should be as small as possible but truly represent the material microstructural attributes [
44]. One possibility of finding an optimal RVE is to employ an iterative binary search algorithm [
63,
64]. Another possibility is to compare the results of simulations with increasing size and details with experimental observations and stopping at the limit when there is a satisfactory agreement. In this work, several RVEs with different magnifications and resolutions are investigated. A minimal RVE size is proposed that depicts homogenous isotropic behavior and yields results close to experiments when loaded in any direction. Using the proposed RVEs, the optimization of the material model parameters for specific material phases is performed. To model the multi-phase materials, one of the approaches is to independently calibrate individual phases and then combine them for a full model rather than dealing with a large complex model, which drastically adds room for error. Such calibration of individual phase is helpful in producing more accurate results during full phase simulations.
In multi-phase steels, it is known from the literature [
24,
25,
28,
65,
66] that the steel matrix endures most deformation, whereas due to the very high strength of ceramic particles, they undergo elastic deformation. Considering the complexity and detail associated with the steel matrix, the material model of the streel matrix is calibrated, and the ceramic particles are assigned elastic attributes. A simple ductile damage criterion is incorporated in the final simulations to understand the onset of local damage and the marking of damage initiation sites in conjunction with other deformation phenomena. The current standing of research marks a benchmark in developing essential methods, tools, and material libraries currently used to numerically model TRIP steel matrix MgO-PSZ MMCs.
After the correct identification of model parameters, their implementation, and verification for the controlled system, the work underway systematically standardizes the process of obtaining experimental data and running partially supervised numerical simulations for predicting the material behavior in the future. Different techniques to virtually construct a microstructure are also being employed. Coupling these developed techniques with bulk deformation mechanics and understanding the material behavior at a microstructural scale during bulk deformation is the next challenge. Customizing microstructural attributes to develop improved superior composites for targeted applications is another challenge. This will guide future research tasks and help better understand the structure–property relationship for better functional materials in the future.
5. Conclusions
This research project aims to slowly create a semi-automatic virtual laboratory to analyze and create customized functional MP materials, especially MMC, for targeted commercial applications in the future. Physics-based crystal plasticity numerical simulation models were used to develop complicated multi-phase material models.
Due to the complexity of the problem at hand, a progressive step-by-step approach was adopted and presented in the current work. Methodologies and techniques to adopt the tools developed by other researchers to obtain and construct microstructural details were summarized. A successful method of converting light or electron microscope images into functional RVEs for DAMASK simulation models of multi-phase materials using grain size data is presented. Such simulations were shown to provide detailed local microstructure and phase-dependent deformation behavior, which is a challenge to obtain otherwise. The associated limitations of this technique, i.e., non-realistic microstructural artifacts and the impossibility of result validation with experimental data, are also stated.
Considering the high-computation costs, different techniques are presented to reduce the size of RVE without compromising the accuracy of the obtained results. This reduced RVE was then used to manually calibrate the physical-based model parameters for cast X8CrMnNi16-6-6 by global stress–strain and phase transformation curve fitting. The simulation and experimental results matched well with less than 5% error. This calibrated steel matrix model incorporated with a simple ductile damage criterion was then used to carry out full phase simulations on virtually constructed RVEs. Such simulations help understand the evolution and interplay of the local stress, strain, transformation, and damage behavior of the composite materials due to externally applied deformation. The validation of such detailed full phase simulation results with in situ test data is necessary for establishing their certainty. This validation of simulation results has not been carried out yet, but is currently underway, which will be published in the future.
Consequently, it can be stated that combining and standardizing the devised methods with appropriate databases help establish a virtual laboratory for studying and calibrating the microstructural parameters of MP materials. The methods and database are being continuously improved to increase the reliability and performance of the established virtual laboratory.
Author Contributions
Conceptualization, F.Q., and S.G.; methodology, F.Q., and S.G.; software, F.Q.; validation, F.Q., and S.G.; formal analysis, F.Q.; investigation, F.Q.; resources, S.G.; data curation, F.Q.; writing—original draft preparation, F.Q., and S.G.; writing—review and editing, F.Q., S.G.; visualization, F.Q., and S.G.; supervision, R.K. and U.P.; project administration, R.K. and U.P.; funding acquisition, R.K. and U.P. All authors have read and agreed to the published version of the manuscript.
Funding
This research was funded by Deutsche Forschungsgemeinschaft (DFG, German Research Foundation) within the framework of the collaborative research group “TRIP Matrix Composites” project number 54473466–SFB 799.
Data Availability Statement
As it is ongoing research, the data cannot be publicly shared. However, metadata or simulation files can be shared upon request with anyone having no conflict of interest.
Acknowledgments
The authors acknowledge the DAAD Faculty Development for Candidates (Balochistan), 2016 (57245990)-HRDI-UESTP’s/UET’s funding scheme in cooperation with the Higher Education Commission of Pakistan (HEC) for sponsoring the stay of Faisal Qayyum at IMF TU Freiberg. This work is conducted within the DFG funded collaborative research group TRIP Matrix Composites (SFB 799). The authors gratefully acknowledge the German Research Foundation (DFG) for the financial support of the SFB 799. The authors also acknowledge the support of Martin Diehl & Franz Roters (MPIE, Düsseldorf) for their help regarding the functionality of DAMASK.
Conflicts of Interest
The authors declare no conflict of interest.
Nomenclature
| MP steels | Multi-phase steels |
| MMCs | Metal matrix composites |
| RVE | Representative volume element |
| ODF | Orientation distribution function |
| GSD | Grain size distribution |
| TRIP | Transformation-induced plasticity |
| TWIP | Twinning-induced plasticity |
| MgO-PSZ | Magnesium oxide–partially stabilized zirconia |
| DAMASK | Düsseldorf Advanced Material Simulation Kit |
| SEM | Scanning electron microscope |
| SE | Secondary electron (detector image) |
| BSE | Backscattered electron (detector image) |
| EBSD | Electron backscatter diffraction (detector data) |
Appendix A
The following material model parameters were used:
Appendix A.1. (Ferrite and Martensite)
Table A1.
Microstructural phase parameters for ferrite and cementite [
18,
50] with the calibrated fitting parameters for the ferrite phase.
Table A1.
Microstructural phase parameters for ferrite and cementite [
18,
50] with the calibrated fitting parameters for the ferrite phase.
| Parameter Definition | Parameter Symbol | Value (Ferrite) | Value (Martensite) | Unit |
|---|
| Shear strain rate on active slip system | 0 | 1 × 10⁻³ | 1 × 10⁻³ | ms−1 |
| Initial Shear resistance on [111] | S0, [111] | 95 | 406 | MPa |
| Saturation shear resistance on [111] | , [111] | 222 | 873 | MPa |
| Initial Shear resistance on [112] | S0, [112] | 96 | 457 | MPa |
| Saturation shear resistance on [112] | , [112] | 412 | 971 | MPa |
| Hardening parameter slip to slip | ho | 1 | 563 | GPa |
| Hardening parameter slip to twin | hαβ | 1.0 | 1.0 | GPa |
| Stress exponent | n | 20 | 20 | - |
| Curve-fitting parameter | w | 2.25 | 2.0 | - |
Appendix A.2. (TRIP/TWIP Steel)
Table A2.
Optimized constitutive model parameters for X3CrMnNi16-7-6 TRIP steel.
Table A2.
Optimized constitutive model parameters for X3CrMnNi16-7-6 TRIP steel.
| | Symbol | Description | Value | Unit | |
|---|
Martensite
transformation parameters | Cthreshhold-trans. | Adj. parameter controlling trans threshold stress | 0.70 | - | |
| Ltr | Width of martensite lath at the formation | 5.0 × 10⁻⁸ | m | |
| itr | Mean free path in multiples of martensite spacing | 2.0 | - | |
| ttr | Average martensite lamella thickness | 5.0 × 10⁻⁶ | m | [24] |
| ß | ß-exponent in transformation formation probability | 5.0 | - | |
| CMFP-trans. | Adj. parameter controlling trans mean free path | 18 | - | |
Twinning
formation
parameters | | r-exponent in twin formation probability | 0.2 | - | |
| CMFP-TWIN. | Adj. parameter controlling twin mean free path | 1.0 | - | |
| Cthreshhold-TWIN. | Adj. parameter controlling twin threshold stress | 1.5 | - | |
| | Stacking fault energy | 17 | mJ m2 | [19] |
| | Change in Gibbs free energy per molar volume | −3.66 × 10⁷ | J m3 | |
| Dislocation glide parameters | | Solid solution strength | 6.8 × 10⁷ | MPa | |
| | Initial dislocation density | 1.0 × 10¹² | m−2 | [39] |
| | Adj. parameter controlling dislocation mean free path | 50 | - | |
| | p-exponent in glide velocity | 1.0 | - | |
| | Average grain size | 50 × 10−6 | m | [48] |
Appendix A.3. (Elastic Parameters)
Table A3.
Single crystal elastic constants for austenite, martensite, and zirconia incorporated in the model during simulations.
Table A3.
Single crystal elastic constants for austenite, martensite, and zirconia incorporated in the model during simulations.
| Cementite [37] | Austenite [37] | Martensite [67] | Zirconia [42] | Units |
|---|
| C11 = 375.0 | C11 = 175.0 | C11 = 242.3 | C11 = 191.0 | GPa |
| C12 = 161.0 | C12 = 115.0 | C12 = 117.7 | C12 = 80.0 | GPa |
| C44 = 130.0 | C44 = 135.0 | C13 = 45.0 | C44 = 40.0 | GPa |
| | | C33 = 315.0 | | GPa |
| | | C44 = 40.5 | | GPa |
Appendix A.4. (Damage Parameters)
Table A4.
Physical and fitting damage parameter values used for the ferrite phase, adopted from the literature.
Table A4.
Physical and fitting damage parameter values used for the ferrite phase, adopted from the literature.
| Parameter Definition | Symbols | Value | Unit |
|---|
| Interface energy | g0 | 1.0 | J m−2 |
| Characteristic length | l0 | 1.5 | μm |
| Damage mobility | M | 0.01 | s−1 |
| Damage diffusion | D | 1.0 | - |
| Critical plastic strain | ϵcrit | 0.5 | - |
| Damage rate sensitivity | P | 10 | - |
References
- Rana, R.; Singh, S.B. Automotive Steels: Design, Metallurgy, Processing and Applications; Woodhead Publishing: Cambridge, UK, 2016. [Google Scholar]
- Biermann, H.; Martin, U.; Aneziris, C.G.; Kolbe, A.; Mãller, A.; Schãrfl, W.; Herrmann, M. Microstructure and Compression Strength of Novel TRIP-Steel/Mg-PSZ Composites. Adv. Eng. Mater. 2009. [Google Scholar] [CrossRef]
- Aneziris, C.G.; Schärfl, W.; Biermann, H.; Martin, U. Energy-Absorbing TRIP-Steel/Mg-PSZ Composite Honeycomb Structures Based on Ceramic Extrusion at Room Temperature. Int. J. Appl. Ceram. Technol. 2009, 6, 727–735. [Google Scholar] [CrossRef]
- Herrera, C.; Ponge, D.; Raabe, D. Design of a novel Mn-based 1 GPa duplex stainless TRIP steel with 60% ductility by a reduction of austenite stability. Acta Mater. 2011, 59, 4653–4664. [Google Scholar] [CrossRef]
- Grässel, O.; Krüger, L.; Frommeyer, G.; Meyer, L. High strength Fe–Mn–(Al, Si) TRIP/TWIP steels development—properties—application. Int. J. Plast. 2000, 16, 1391–1409. [Google Scholar] [CrossRef]
- Olson, G. Transformation Plasticity and the Stability of Plastic Flow; ASM: Materials Park, OH, USA, 1984. [Google Scholar]
- Olson, G.; Cohen, M. Kinetics of strain-induced martensitic nucleation. Metall. Trans. A 1975, 6, 791. [Google Scholar] [CrossRef]
- Guk, S.; Müller, W.; Pranke, K.; Kawalla, R. Mechanical Behaviour Modelling of an Mg-Stabilized Zirconia Reinforced TRIP-Matrix-Composite under Cold Working Conditions. Mat. Sci. Appl. 2014, 5, 812–822. [Google Scholar] [CrossRef]
- Guk, S.; Milisova, D.; Pranke, K. Influence of deformation conditions on the microstructure and formability of sintered Mg-PSZ reinforced TRIP-matrix-composites. Key Eng. Mater. 2016, 684. [Google Scholar] [CrossRef]
- Siodlak, D.; Lotter, U.; Kawalla, R.; Schwich, V. Modelling of the Mechanical Properties of Low Alloyed Multiphase Steels with Retained Austenite Taking into Account Strain-Induced Transformation. Steel Res. Int. 2008, 79, 776–783. [Google Scholar] [CrossRef]
- Siodlak, D.; Lotter, U.; Kawalla, R.; Paul, G. Determination and modelling of the influence of cooling in the coil on the mechanical properties of hot strip steels with bainite. Steel Res. Int. 2005, 76, 815–821. [Google Scholar] [CrossRef]
- Biermann, H.; Aneziris, C.G. Austenitic TRIP/TWIP Steels and Steel-Zirconia Composites; Springer: Cham, Switzerland, 2020. [Google Scholar]
- Rafaja, D.; Krbetschek, C.; Ullrich, C.; Martin, S. Stacking fault energy in austenitic steels determined by using in situ X-ray diffraction during bending. J. Appl. Crystallogr. 2014, 47, 936–947. [Google Scholar] [CrossRef]
- Martin, S.; Ullrich, C.; Rafaja, D. Deformation of Austenitic CrMnNi TRIP/TWIP Steels: Nature and Role of the ɛ−martensite. Mater. Today Proc. 2015, 2, S643–S646. [Google Scholar] [CrossRef]
- Martin, S.; Decker, S.; Krüger, L.; Martin, U.; Rafaja, D. Microstructure Changes in TRIP Steel/Mg-PSZ Composites Induced by Low Compressive Deformation. Adv. Eng. Mater. 2013, 15, 600–608. [Google Scholar] [CrossRef]
- Weidner, A.; Martin, S.; Klemm, V.; Martin, U.; Biermann, H. Stacking faults in high-alloyed metastable austenitic cast steel observed by electron channelling contrast imaging. Scr. Mater. 2011, 64, 513–516. [Google Scholar] [CrossRef]
- Weidner, A.; Segel, C.; Biermann, H. Magnitude of shear of deformation-induced α′-martensite in high-alloy metastable steel. Mater. Lett. 2015, 143, 155–158. [Google Scholar] [CrossRef]
- Weidner, A.; Biermann, H. Combination of different in situ characterization techniques and scanning electron microscopy investigations for a comprehensive description of the tensile deformation behavior of a CrMnNi TRIP/TWIP steel. JOM 2015, 67, 1729–1747. [Google Scholar] [CrossRef]
- Weidner, A.; Hangen, U.D.; Biermann, H. Nanoindentation measurements on deformation-induced α’-martensite in a metastable austenitic high-alloy CrMnNi steel. Philos. Mag. Lett. 2014, 94, 522–530. [Google Scholar] [CrossRef]
- Decker, S.; Krüger, L.; Richter, S.; Martin, S.; Martin, U. Strain-Rate-Dependent Flow Stress and Failure of an Mg-PSZ Reinforced TRIP Matrix Composite Produced by Spark Plasma Sintering. Steel Res. Int. 2012, 83, 521–528. [Google Scholar] [CrossRef]
- Martin, S.; Wolf, S.; Martin, U.; Krüger, L. Influence of Temperature on Phase Transformation and Deformation Mechanisms of Cast CrMnNi-TRIP/TWIP Steel, Solid State Phenomena; Trans Tech Publications: Kapellweg, Switzerland, 2011; pp. 172–177. [Google Scholar]
- Ullah, M.; Pasha, R.A.; Chohan, G.Y.; Qayyum, F. Numerical Simulation and Experimental Verification of CMOD in CT Specimens of TIG Welded AA2219-T87. Arab. J. Sci. Eng. 2015, 40, 935–944. [Google Scholar] [CrossRef]
- Qayyum, F.; Kamran, A.; Ali, A.; Shah, M. 3D numerical simulation of thermal fatigue damage in wedge specimen of AISI H13 tool steel. Eng. Fract. Mech. 2017, 180, 240–253. [Google Scholar] [CrossRef]
- Ullah, M.; Wu, C.S.; Qayyum, F. Prediction of crack tip plasticity induced due to variation in solidification rate of weld pool and its effect on fatigue crack propagation rate (FCPR). J. Mech. Sci. Technol. 2018, 32, 3625–3635. [Google Scholar] [CrossRef]
- Mukhtar, F.; Qayyum, F.; Anjum, Z.; Shah, M. Effect of chrome plating and varying hardness on the fretting fatigue life of AISI D2 components. Wear 2019, 418–419, 215–225. [Google Scholar] [CrossRef]
- Khan, U.; Hussain, A.; Shah, M.; Shuaib, M.; Qayyum, F. Investigation of Mechanical Properties Based on Grain Growth and Microstructure Evolution of Alumina Ceramics During Two Step Sintering Process; IOP Conference Series: Materials Science and Engineering; IOP Publishing: Bristol, UK, 2016; p. 012046. [Google Scholar]
- Qayyum, F.; Shah, M.; Muqeet, A.; Afzal, J. The Effect of Anisotropy on the Intermediate and Final Form in Deep Drawing of SS304L, with High Draw Ratios: Experimentation and Numerical Simulation; IOP Conference Series: Materials Science and Engineering; IOP Publishing: Bristol, UK, 2016; pp. 12–31. [Google Scholar]
- Qayyum, F.; Guk, S.; Kawalla, R.; Prahl, U. Experimental Investigations and Multiscale Modeling to Study the Effect of Sulfur Content on Formability of 16MnCr5 Alloy Steel. Steel Res. Int. 2019. [Google Scholar] [CrossRef]
- Butt, Z.; Anjum, Z.; Sultan, A.; Qayyum, F.; Ali, H.M.K.; Mehmood, S. Investigation of electrical properties & mechanical quality factor of piezoelectric material (PZT-4A). J. Electr. Eng. Technol. 2017, 12, 846–851. [Google Scholar]
- Asghar, W.; Nasir, M.A.; Qayyum, F.; Shah, M.; Azeem, M.; Nauman, S.; Khushnood, S. Investigation of fatigue crack growth rate in CARALL, ARALL and GLARE. Fatigue Fract. Eng. Mater. Struct. 2017, 40, 1086–1100. [Google Scholar] [CrossRef]
- Elahi, H.; Eugeni, M.; Gaudenzi, P.; Qayyum, F.; Swati, R.F.; Khan, H.M. Response of piezoelectric materials on thermomechanical shocking and electrical shocking for aerospace applications. Microsyst. Technol. 2018, 24, 3791–3798. [Google Scholar] [CrossRef]
- Khan, F.; Qayyum, F.; Asghar, W.; Azeem, M.; Anjum, Z.; Nasir, A.; Shah, M. Effect of various surface preparation techniques on the delamination properties of vacuum infused Carbon fiber reinforced aluminum laminates (CARALL): Experimentation and numerical simulation. J. Mech. Sci. Technol. 2017, 31, 5265–5272. [Google Scholar] [CrossRef]
- Roters, F.; Eisenlohr, P.; Kords, C.; Tjahjanto, D.; Diehl, M.; Raabe, D. Damask: The Düsseldorf Advanced MAterial Simulation Kit for studying crystal plasticity using an FE based or a spectral numerical solver. Procedia IUTAM 2012, 3, 3–10. [Google Scholar] [CrossRef]
- Lebensohn, R.A.; Kanjarla, A.K.; Eisenlohr, P. An elasto-viscoplastic formulation based on fast Fourier transforms for the prediction of micromechanical fields in polycrystalline materials. Int. J. Plast. 2012, 32, 59–69. [Google Scholar] [CrossRef]
- Eisenlohr, P.; Diehl, M.; Lebensohn, R.A.; Roters, F. A spectral method solution to crystal elasto-viscoplasticity at finite strains. Int. J. Plast. 2013, 46, 37–53. [Google Scholar] [CrossRef]
- Shanthraj, P.; Eisenlohr, P.; Diehl, M.; Roters, F. Numerically robust spectral methods for crystal plasticity simulations of heterogeneous materials. Int. J. Plast. 2015, 66, 31–45. [Google Scholar] [CrossRef]
- Wong, S.L.; Madivala, M.; Prahl, U.; Roters, F.; Raabe, D. A crystal plasticity model for twinning-and transformation-induced plasticity. Acta Mater. 2016, 118, 140–151. [Google Scholar] [CrossRef]
- Madivala, M.; Schwedt, A.; Wong, S.L.; Roters, F.; Prahl, U.; Bleck, W. Temperature dependent strain hardening and fracture behavior of TWIP steel. Int. J. Plast. 2018, 104, 80–103. [Google Scholar] [CrossRef]
- Umar, M.; Qayyum, F.; Farooq, M.U.; Khan, L.A.; Guk, S.; Prahl, U. Investigating the Effect of Cementite Particle Size and Distribution on Local Stress and Strain Evolution in Spheroidized Medium Carbon Steels using Crystal Plasticity-Based Numerical Simulations. Steel Res. Int. 2020, 2000407. [Google Scholar] [CrossRef]
- Tasan, C.C.; Hoefnagels, J.P.M.; Diehl, M.; Yan, D.; Roters, F.; Raabe, D. Strain localization and damage in dual phase steels investigated by coupled in-situ deformation experiments and crystal plasticity simulations. Int. J. Plast. 2014, 63, 198–210. [Google Scholar] [CrossRef]
- Jiang, C.; Srinivasan, S.; Caro, A.; Maloy, S. Structural, elastic, and electronic properties of Fe 3 C from first principles. J. Appl. Phys. 2008, 103, 043502. [Google Scholar] [CrossRef]
- Pabst, W.; Ticha, G.; Gregorová, E. Effective elastic properties of alumina-zirconia composite ceramics—Part 3. Calculation of elastic moduli of polycrystalline alumina and zirconia from monocrystal data. Ceram. Silik. 2004, 48, 41–48. [Google Scholar]
- Qayyum, F.; Guk, S.; Schmidtchen, M.; Kawalla, R.; Prahl, U. Modeling the Local Deformation and Transformation Behavior of Cast X8CrMnNi16–6-6 TRIP Steel and 10% Mg-PSZ Composite Using a Continuum Mechanics-Based Crystal Plasticity Model. Crystals 2020, 10, 221. [Google Scholar] [CrossRef]
- Qayyum, F.; Guk, S.; Prüger, S.; Schmidtchen, M.; Saenko, I.; Kiefer, B.; Kawalla, R.; Prahl, U. Investigating the local deformation and transformation behavior of sintered X3CrMnNi16–7-6 TRIP steel using a calibrated crystal plasticity-based numerical simulation model. Int. J. Mater. Res. 2020. [Google Scholar] [CrossRef]
- Qayyum, F.; Chaudhry, A.A.; Guk, S.; Schmidtchen, M.; Kawalla, R.; Prahl, U. Effect of 3D Representative Volume Element (RVE) Thickness on Stress and Strain Partitioning in Crystal Plasticity Simulations of Multi-Phase Materials. Crystals 2020, 10, 944. [Google Scholar] [CrossRef]
- Vinogradov, A.; Lazarev, A.; Linderov, M.; Weidner, A.; Biermann, H. Kinetics of deformation processes in high-alloyed cast transformation-induced plasticity/twinning-induced plasticity steels determined by acoustic emission and scanning electron microscopy: Influence of austenite stability on deformation mechanisms. Acta Mater. 2013, 61, 2434–2449. [Google Scholar] [CrossRef]
- Dai, Q.; Cheng, X.; Luo, X.; Zhao, Y. Structural parameters of the martensite transformation for austenitic steels. Mater. Characteriz. 2002, 49, 367–371. [Google Scholar] [CrossRef]
- Kovalev, A.; Jahn, A.; Weiß, A.; Scheller, P. Characterization of the TRIP/TWIP effect in austenitic stainless steels using Stress-Temperature-Transformation (STT) and Deformation-Temperature-Transformation (DTT) Diagrams. Steel Res. Int. 2011, 82, 45–50. [Google Scholar] [CrossRef]
- Martin, S.; Richter, S.; Decker, S.; Martin, U.; Krüger, L.; Rafaja, D. Reinforcing Mechanism of Mg-PSZ Particles in Highly-Alloyed TRIP Steel. Steel Res. Int. 2011, 82, 1133–1140. [Google Scholar] [CrossRef]
- Shanthraj, P.; Svendsen, B.; Sharma, L.; Roters, F.; Raabe, D. Elasto-viscoplastic phase field modelling of anisotropic cleavage fracture. J. Mech. Phys. Solids 2017, 99, 19–34. [Google Scholar] [CrossRef]
- Shanthraj, P.; Sharma, L.; Svendsen, B.; Roters, F.; Raabe, D. A phase field model for damage in elasto-viscoplastic materials. Comp. Methods Appl. Mech. Eng. 2016, 312, 167–185. [Google Scholar] [CrossRef]
- Qayyum, F.; Umar, M.; Guk, S.; Schmidtchen, M.; Kawalla, R.; Prahl, U. Effect of the 3rd Dimension within the Representative Volume Element (RVE) on Damage Initiation and Propagation during Full-Phase Numerical Simulations of Single and Multi-Phase Steels. Materials 2020, 14, 42. [Google Scholar] [CrossRef]
- Weidner, A.; Yanina, A.; Guk, S.; Kawalla, R.; Biermann, H. Microstructure and Local Strain Fields in a High-Alloyed Austenitic Cast Steel and a Steel-Matrix Composite Material after in situ Tensile and Cyclic Deformation. Steel Res. Int. 2011, 82, 990–997. [Google Scholar] [CrossRef]
- Martin, S.; Wolf, S.; Decker, S.; Krueger, L.; Martin, U. Deformation Bands in High-Alloy Austenitic 16Cr6Mn6Ni TRIP Steel: Phase Transformation and Its Consequences on Strain Hardening at Room Temperature. Steel Res. Int. 2015, 86, 1187–1196. [Google Scholar] [CrossRef]
- Prüger, S.; Mehlhorn, L.; Mühlich, U.; Kuna, M. Study of Reinforcing Mechanisms in TRIP-Matrix Composites under Compressive Loading by Means of Micromechanical Simulations. Adv. Eng. Mater. 2013, 15, 542–549. [Google Scholar] [CrossRef]
- Roters, F.; Diehl, M.; Shanthraj, P.; Eisenlohr, P.; Reuber, C.; Wong, S.L.; Maiti, T.; Ebrahimi, A.; Hochrainer, T.; Fabritius, H.O.; et al. DAMASK—The Düsseldorf Advanced Material Simulation Kit for modeling multi-physics crystal plasticity, thermal, and damage phenomena from the single crystal up to the component scale. Comput. Mater. Sci. 2019, 158, 420–478. [Google Scholar] [CrossRef]
- Tasan, C.; Hoefnagels, J.; Geers, M. Microstructural banding effects clarified through micrographic digital image correlation. Scr. Mater. 2010, 62, 835–838. [Google Scholar] [CrossRef]
- Ramazani, A.; Abbasi, M.; Kazemiabnavi, S.; Schmauder, S.; Larson, R.; Prahl, U. Development and application of a microstructure-based approach to characterize and model failure initiation in DP steels using XFEM. Mater. Sci. Eng. A 2016, 660, 181–194. [Google Scholar] [CrossRef]
- Diehl, M.; Groeber, M.; Haase, C.; Molodov, D.A.; Roters, F.; Raabe, D. Identifying Structure–Property Relationships Through DREAM.3D Representative Volume Elements and DAMASK Crystal Plasticity Simulations: An Integrated Computational Materials Engineering Approach. JOM 2017, 69, 848–855. [Google Scholar] [CrossRef]
- Diehl, M.; An, D.; Shanthraj, P.; Zaefferer, S.; Roters, F.; Raabe, D. Crystal plasticity study on stress and strain partitioning in a measured 3D dual phase steel microstructure. Phys. Mesomech. 2017, 20, 311–323. [Google Scholar] [CrossRef]
- Groeber, M.A.; Jackson, M.A. DREAM. 3D: A digital representation environment for the analysis of microstructure in 3D. Integr. Mater. Manuf. Innovat. 2014, 3, 5. [Google Scholar] [CrossRef]
- Bourne, D.; Kok, P.J.; Roper, S.M.; Spanjer, W.D. Laguerre tessellations and polycrystalline microstructures: A fast algorithm for generating grains of given volumes. Philos. Magaz. 2020, 100, 2677–2707. [Google Scholar] [CrossRef]
- Nowak, R. Generalized Binary Search, Proceedings of the 2008 46th Annual Allerton Conference on Communication, Control, and Computing, Monticello, IL, USA, 26–26 September 2008; IEEE: Piscataway, NJ, USA, 2008; pp. 568–574. [Google Scholar]
- Bentley, J.L. Multidimensional binary search trees used for associative searching. Commun. ACM 1975, 18, 509–517. [Google Scholar] [CrossRef]
- Ullah, M.; Qayyum, F.; Elahi, H.; Mukhtar, F.; Ali, Q.; Abbas, C.A. Influence of microstructural evolution and localized delta ferrite number on high-cycle fatigue crack opening and propagation rate. Proc. Instit. Mech. Eng. Part L J. Mater. Des. Applic. 2020. [Google Scholar] [CrossRef]
- Anjum, Z.; Shah, M.; Elahi, H.; Khan, M.; Mujahid, M.; Khushnood, S.; Qayyum, F. Fretting fatigue crack initiation and propagation in Ti6Al4V sheets under tribocorrosive conditions of artificial seawater and physiological solutions. Proc. Instit. Mech. Eng. Part L J. Mater. Des. Applic. 2020, 234, 1526–1534. [Google Scholar] [CrossRef]
- Music, D.; Schneider, J.M. The correlation between the electronic structure and elastic properties of nanolaminates. JOM 2007, 59, 60–64. [Google Scholar] [CrossRef]
Figure 1.
Spheroidized steel microstructure and its digitization into a geometry file for DAMASK simulation: (a) scanning electron microscope (SEM) image of spheroidized steel sample at 20 KX; (b) cropped 503 p-wide and 365 p-high area of the SEM image; and (c) digitized image showing the two-phase data for the Düsseldorf Advanced Material Simulation Kit (DAMASK) input.
Figure 2.
Metal Matrix Composite (MMC) and its digitization into a geometry file for DAMASK simulation: (a) light microscope image of the MMC microstructure at 200×; (b) digitized light microscope image with identified phases; (c) virtual construction of random microstructure using Voronoi tessellation criteria; and (d) merged images for the construction of final geometry file with phase and orientation information.
Figure 3.
The issue with the generated represented volume element (RVE) microstructure using the overlapping technique: (a) constructed geometry file with phase and orientation information; and (b) white arrows highlighting the MgO-PSZ particle present inside steel grains.
Figure 3.
The issue with the generated represented volume element (RVE) microstructure using the overlapping technique: (a) constructed geometry file with phase and orientation information; and (b) white arrows highlighting the MgO-PSZ particle present inside steel grains.
Figure 4.
Electron backscatter diffraction (EBSD) map images of the TRIP steel MMC: (a) phase map (green—cubic MgO-PSZ greyscale—austenite in band-contrast); and (b) Φ1 plot.
Figure 4.
Electron backscatter diffraction (EBSD) map images of the TRIP steel MMC: (a) phase map (green—cubic MgO-PSZ greyscale—austenite in band-contrast); and (b) Φ1 plot.
Figure 5.
Generated geometry file from the actual EBSD map of TRIP steel MMC: (a) phase map, where blue represented an austenitic steel matrix, and red represents zirconia; (b) Inverse pole figure (IPF) map of the geometry, where a different color represents each grain as per the given IPF legend.
Figure 5.
Generated geometry file from the actual EBSD map of TRIP steel MMC: (a) phase map, where blue represented an austenitic steel matrix, and red represents zirconia; (b) Inverse pole figure (IPF) map of the geometry, where a different color represents each grain as per the given IPF legend.
Figure 6.
Deformed RVEs representing the effect of a rotating load frame in different directions: (
a) x is rotated at 90 degrees; (
b) x and y are rotated at 45 degrees; (
c) x and y are rotated at 90 degrees; (
d) without any rotation or load frame; and (
e) x, y and z are rotated at 45 degrees (reprinted with permission from [
44], Carl Hanser Verlag, 2020). The simulations were run on all the generated RVEs using the material model from Wong et al. and Manjunatha et al. [
37,
38]. Detailed material model attributes for the TRIP/TWIP steels are provided in
Appendix A.2. All the simulations were run for a total of a 33% strain in 4850 increments. Please read the work of Qayyum et al. for further details about this work [
44].
Figure 7.
A schematic diagram representing the generated 3D RVEs and the slicing sequence for constructing simulation geometries. The slicing sequence is shown in the figure with a yellow dotted line, and green dotted lines represent more sliced geometries that are not shown here but were constructed for simulations. Ferrite (F) and martensite (M) are shown separately in the sliced images to better visualize phase distribution in the RVEs (reprinted from [
45], MDPI, 2020).
Figure 8.
Generated RVE for TRIP steel simulations: (a) steel matrix; (b) MgO-PSZ particles.
Figure 8.
Generated RVE for TRIP steel simulations: (a) steel matrix; (b) MgO-PSZ particles.
Figure 9.
Visualization of spheroidized steel local results for the last frame: (a) local von Mises-Cauchy stress in different phases; (b) local von Mises logarithmic strain in different phases.
Figure 9.
Visualization of spheroidized steel local results for the last frame: (a) local von Mises-Cauchy stress in different phases; (b) local von Mises logarithmic strain in different phases.
Figure 10.
Visualization of 10% MMC simulation local results for the last frame: (a) local von Mises-Cauchy stress in different phases; and (b) local von Mises logarithmic strain in different phases.
Figure 10.
Visualization of 10% MMC simulation local results for the last frame: (a) local von Mises-Cauchy stress in different phases; and (b) local von Mises logarithmic strain in different phases.
Figure 11.
Visualization of the local results at 25% of the true global strain in the MMC simulation model developed from actual EBSD data: (a) logarithmic von Mises strain; (b) von Mises-Cauchy stress; (c) martensitic transformation volume.
Figure 11.
Visualization of the local results at 25% of the true global strain in the MMC simulation model developed from actual EBSD data: (a) logarithmic von Mises strain; (b) von Mises-Cauchy stress; (c) martensitic transformation volume.
Figure 12.
Comparison of the stress/strain and transformation curves for the simulation models with: (
a) 27 grains; (
b) 125 grains; (
c) 512 grains; and (
d) 1000 grains (reprinted with permission from [
44], Carl Hanser Verlag, 2020).
Figure 12.
Comparison of the stress/strain and transformation curves for the simulation models with: (
a) 27 grains; (
b) 125 grains; (
c) 512 grains; and (
d) 1000 grains (reprinted with permission from [
44], Carl Hanser Verlag, 2020).
Figure 13.
Local distribution for all geometries of RVE-E at 25% of the true global strain: (
a) von Mises true strain distribution; and (
b) von Mises true stress distribution. It is observed that in 1 layer, there is a high contrast of stresses and strains, but with increasing layer thickness, the distribution is more homogeneous RVEs (reprinted from [
45], MDPI, 2020).
Figure 14.
Experimental results of cast X8CrMnNi16-6-6 steel: (
a) flow curve and martensitic transformation data measured by Fisher ferritoscope; (
b) stress/strain plot with consolidated in situ acoustic emission test data (reprinted with permission from [
46], Elsevier, 2013).
Figure 14.
Experimental results of cast X8CrMnNi16-6-6 steel: (
a) flow curve and martensitic transformation data measured by Fisher ferritoscope; (
b) stress/strain plot with consolidated in situ acoustic emission test data (reprinted with permission from [
46], Elsevier, 2013).
Figure 15.
The comparison of calibrated numerical simulation model results with the experimental results of cast X8CrMnNi16-6-6 steel (reprinted from [
43], MDPI, 2020).
Figure 15.
The comparison of calibrated numerical simulation model results with the experimental results of cast X8CrMnNi16-6-6 steel (reprinted from [
43], MDPI, 2020).
Figure 16.
Numerical simulation results of the calibrated model providing information about the evolution of several microstructural phenomena attributed to increasing strain. The trends compare well with the experimentally observed acoustic emission data shown in
Figure 14b (reprinted from [
43], MDPI, 2020).
Figure 17.
Comparison of numerical simulation results due to change in the load direction. The simulations were run for tension (T) and compression (C) cases (reprinted from [
43], MDPI, 2020).
Figure 17.
Comparison of numerical simulation results due to change in the load direction. The simulations were run for tension (T) and compression (C) cases (reprinted from [
43], MDPI, 2020).
Table 1.
CrMnNi16-6-6 Steel.
Table 1.
CrMnNi16-6-6 Steel.
| Chemical Composition (wt.%) | Characteristics |
|---|
| C | Cr | Mn | Ni | Si | Al | N | γSF (mJ/m2) [47,48] |
| 0.08 | 16.0 | 6.0 | 6.1 | 1.0 | 0.05 | 0.05 | 9.6–15.6 |
Table 2.
Identified parameters for cast X8CrMnNi16-6-6 and their comparison with high manganese steel parameters previously stated by Su Leen [
37] and used by Manjunatha [
38].
Table 2.
Identified parameters for cast X8CrMnNi16-6-6 and their comparison with high manganese steel parameters previously stated by Su Leen [
37] and used by Manjunatha [
38].
| Attributes | Cast X8CrMnNi16-6-6 | X60Mn22 [37,38] | Units |
|---|
| Solid solution strength | 50 | 130 | MPa |
| Dislocation glide | 55 | 45 | - |
| Stacking fault energy | 10 | 25.4 | mJ/m2 |
| Martensitic lamella size | 50 | 100 | nm |
| Transformation probability TP | 3 | 5 | - |
Table 3.
Chemical composition and the SFE of the tested cast X8CrMnNi16-6-6 Steel.
Table 3.
Chemical composition and the SFE of the tested cast X8CrMnNi16-6-6 Steel.
| Geometry | Total Increments | Time (Minutes) |
|---|
| 27 grains (3 × 3 × 3) | 7850 | 3.5 |
| 125 grains (5 × 5 × 5) | 5850 | 20.5 |
| 512 grains (8 × 8 × 8) | 4050 | 38.5 |
| 1000 grains (10 × 10 × 10) | 5850 | 77 |
Table 4.
Analysis of local stress, strain, transformation, and damage behavior at 20% global strain.
| Publisher’s Note: MDPI stays neutral with regard to jurisdictional claims in published maps and institutional affiliations. |
© 2021 by the authors. Licensee MDPI, Basel, Switzerland. This article is an open access article distributed under the terms and conditions of the Creative Commons Attribution (CC BY) license (http://creativecommons.org/licenses/by/4.0/).


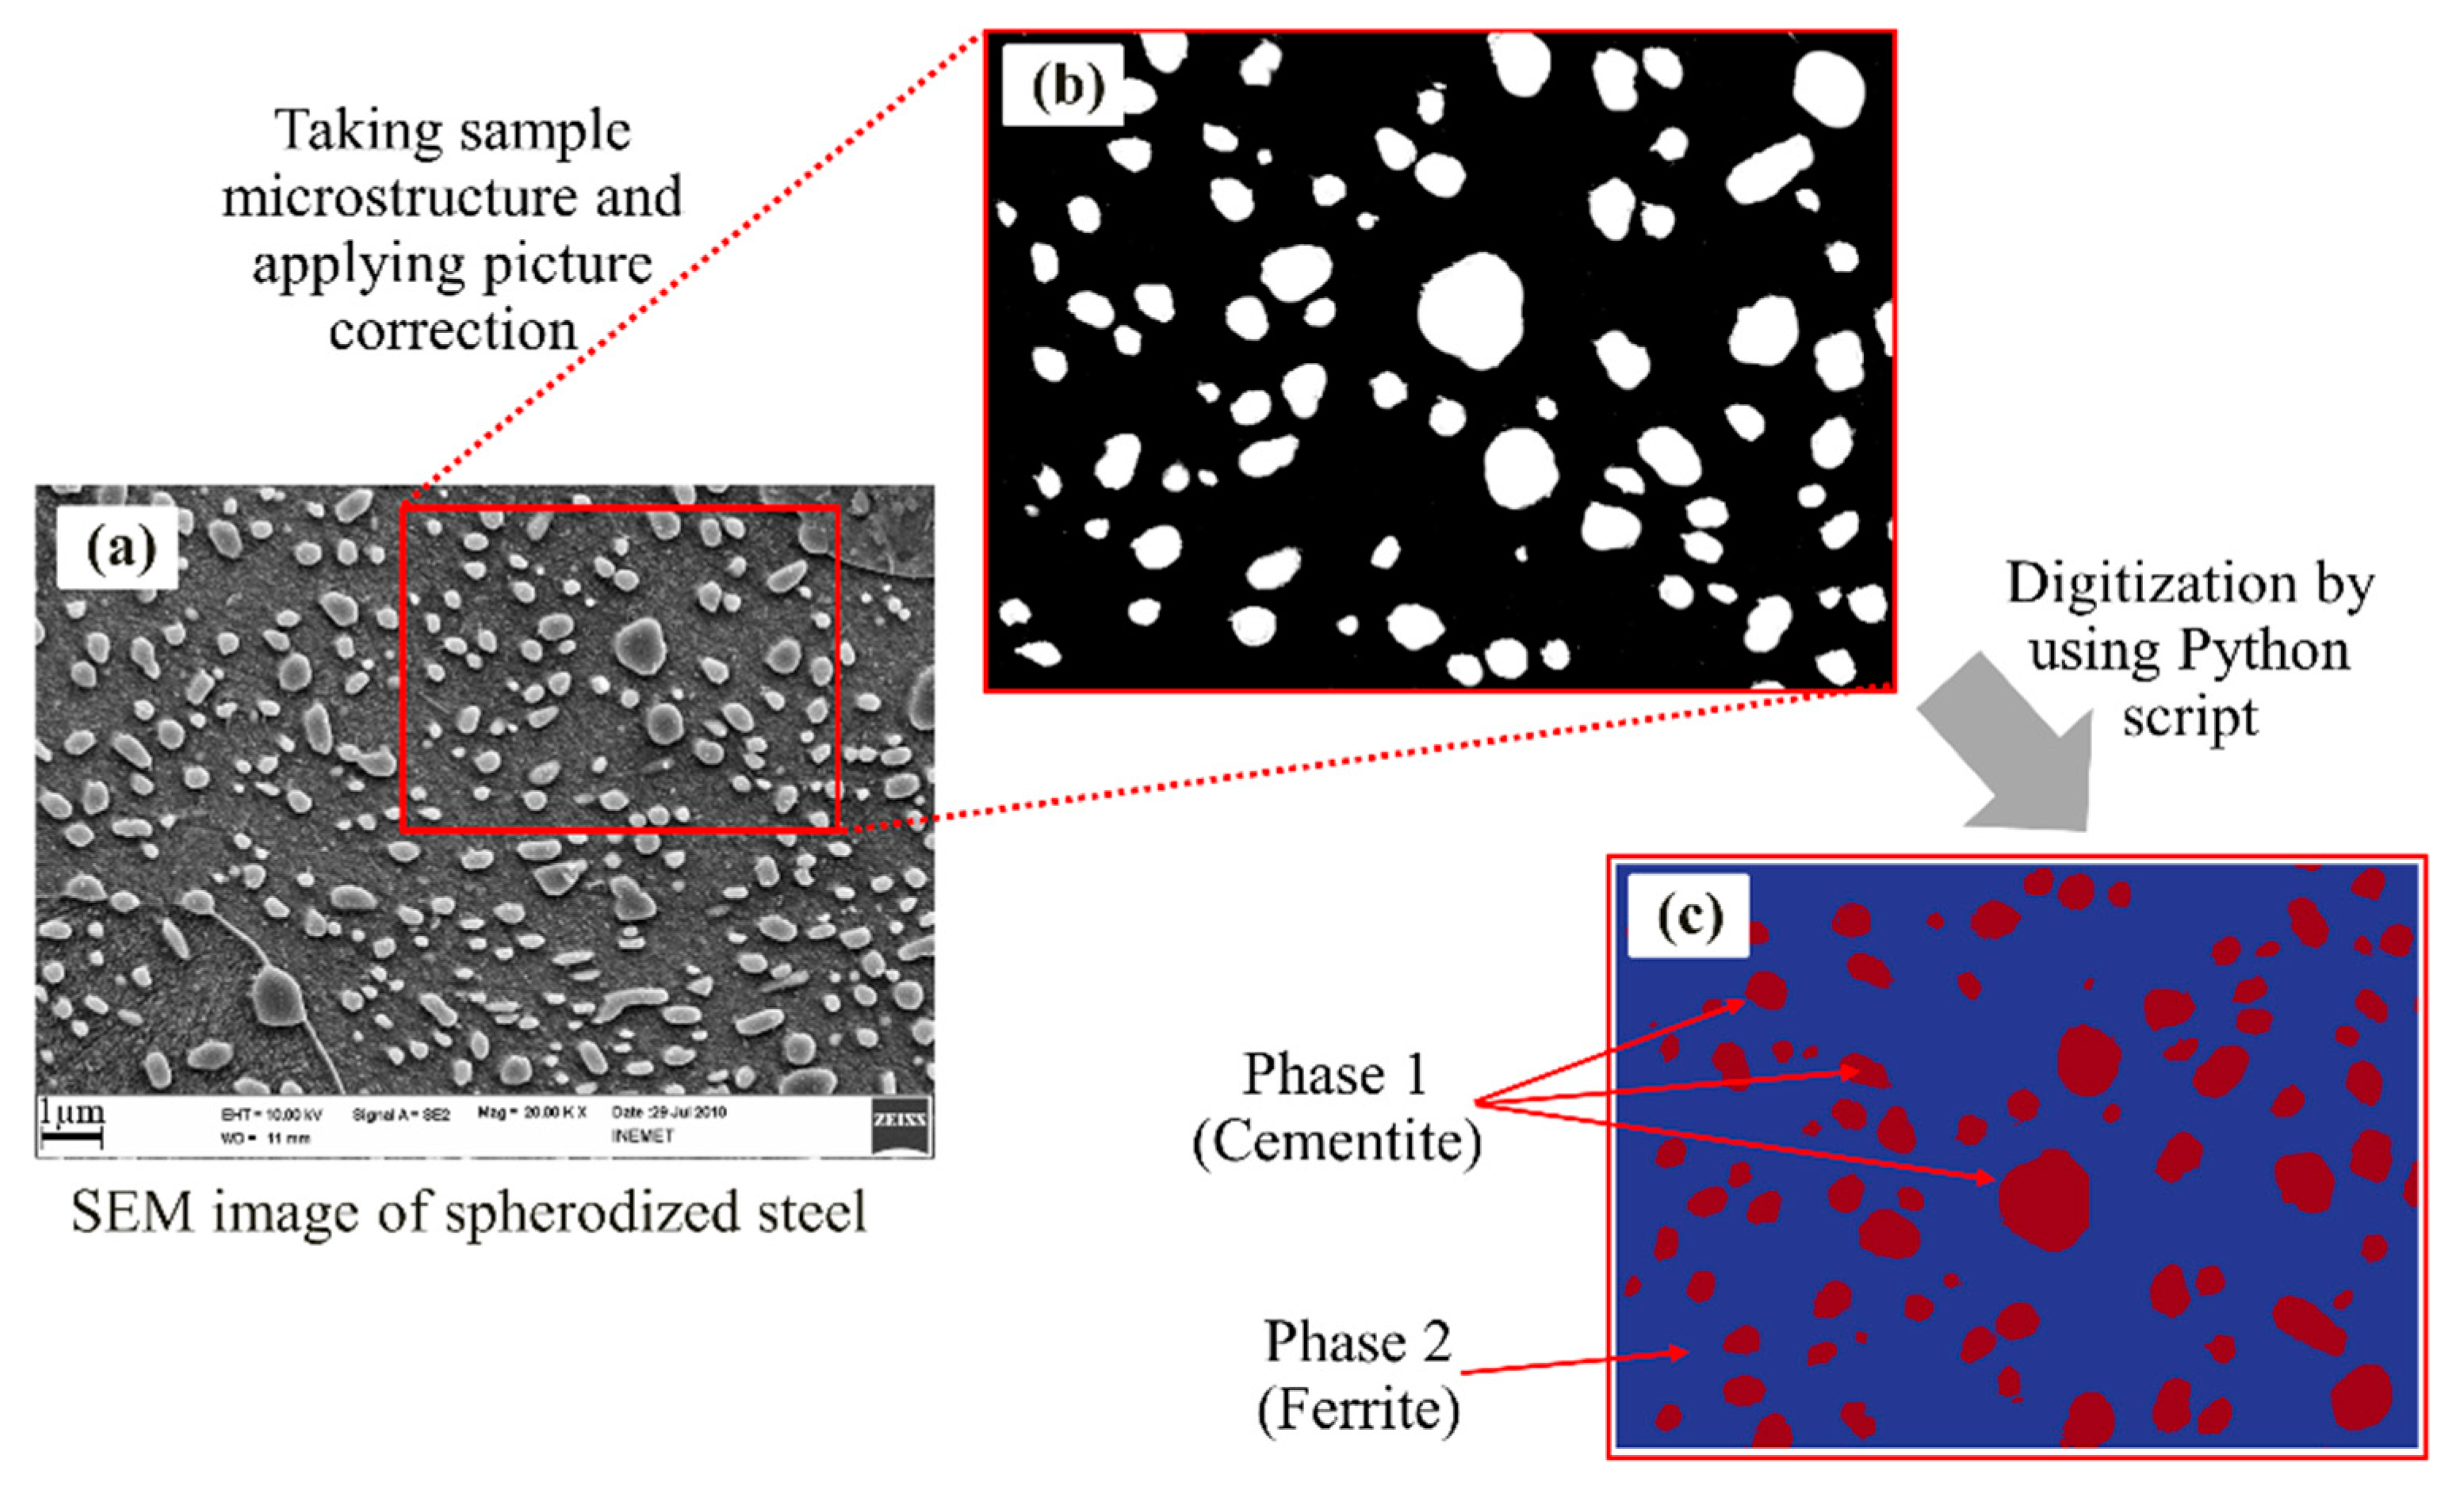
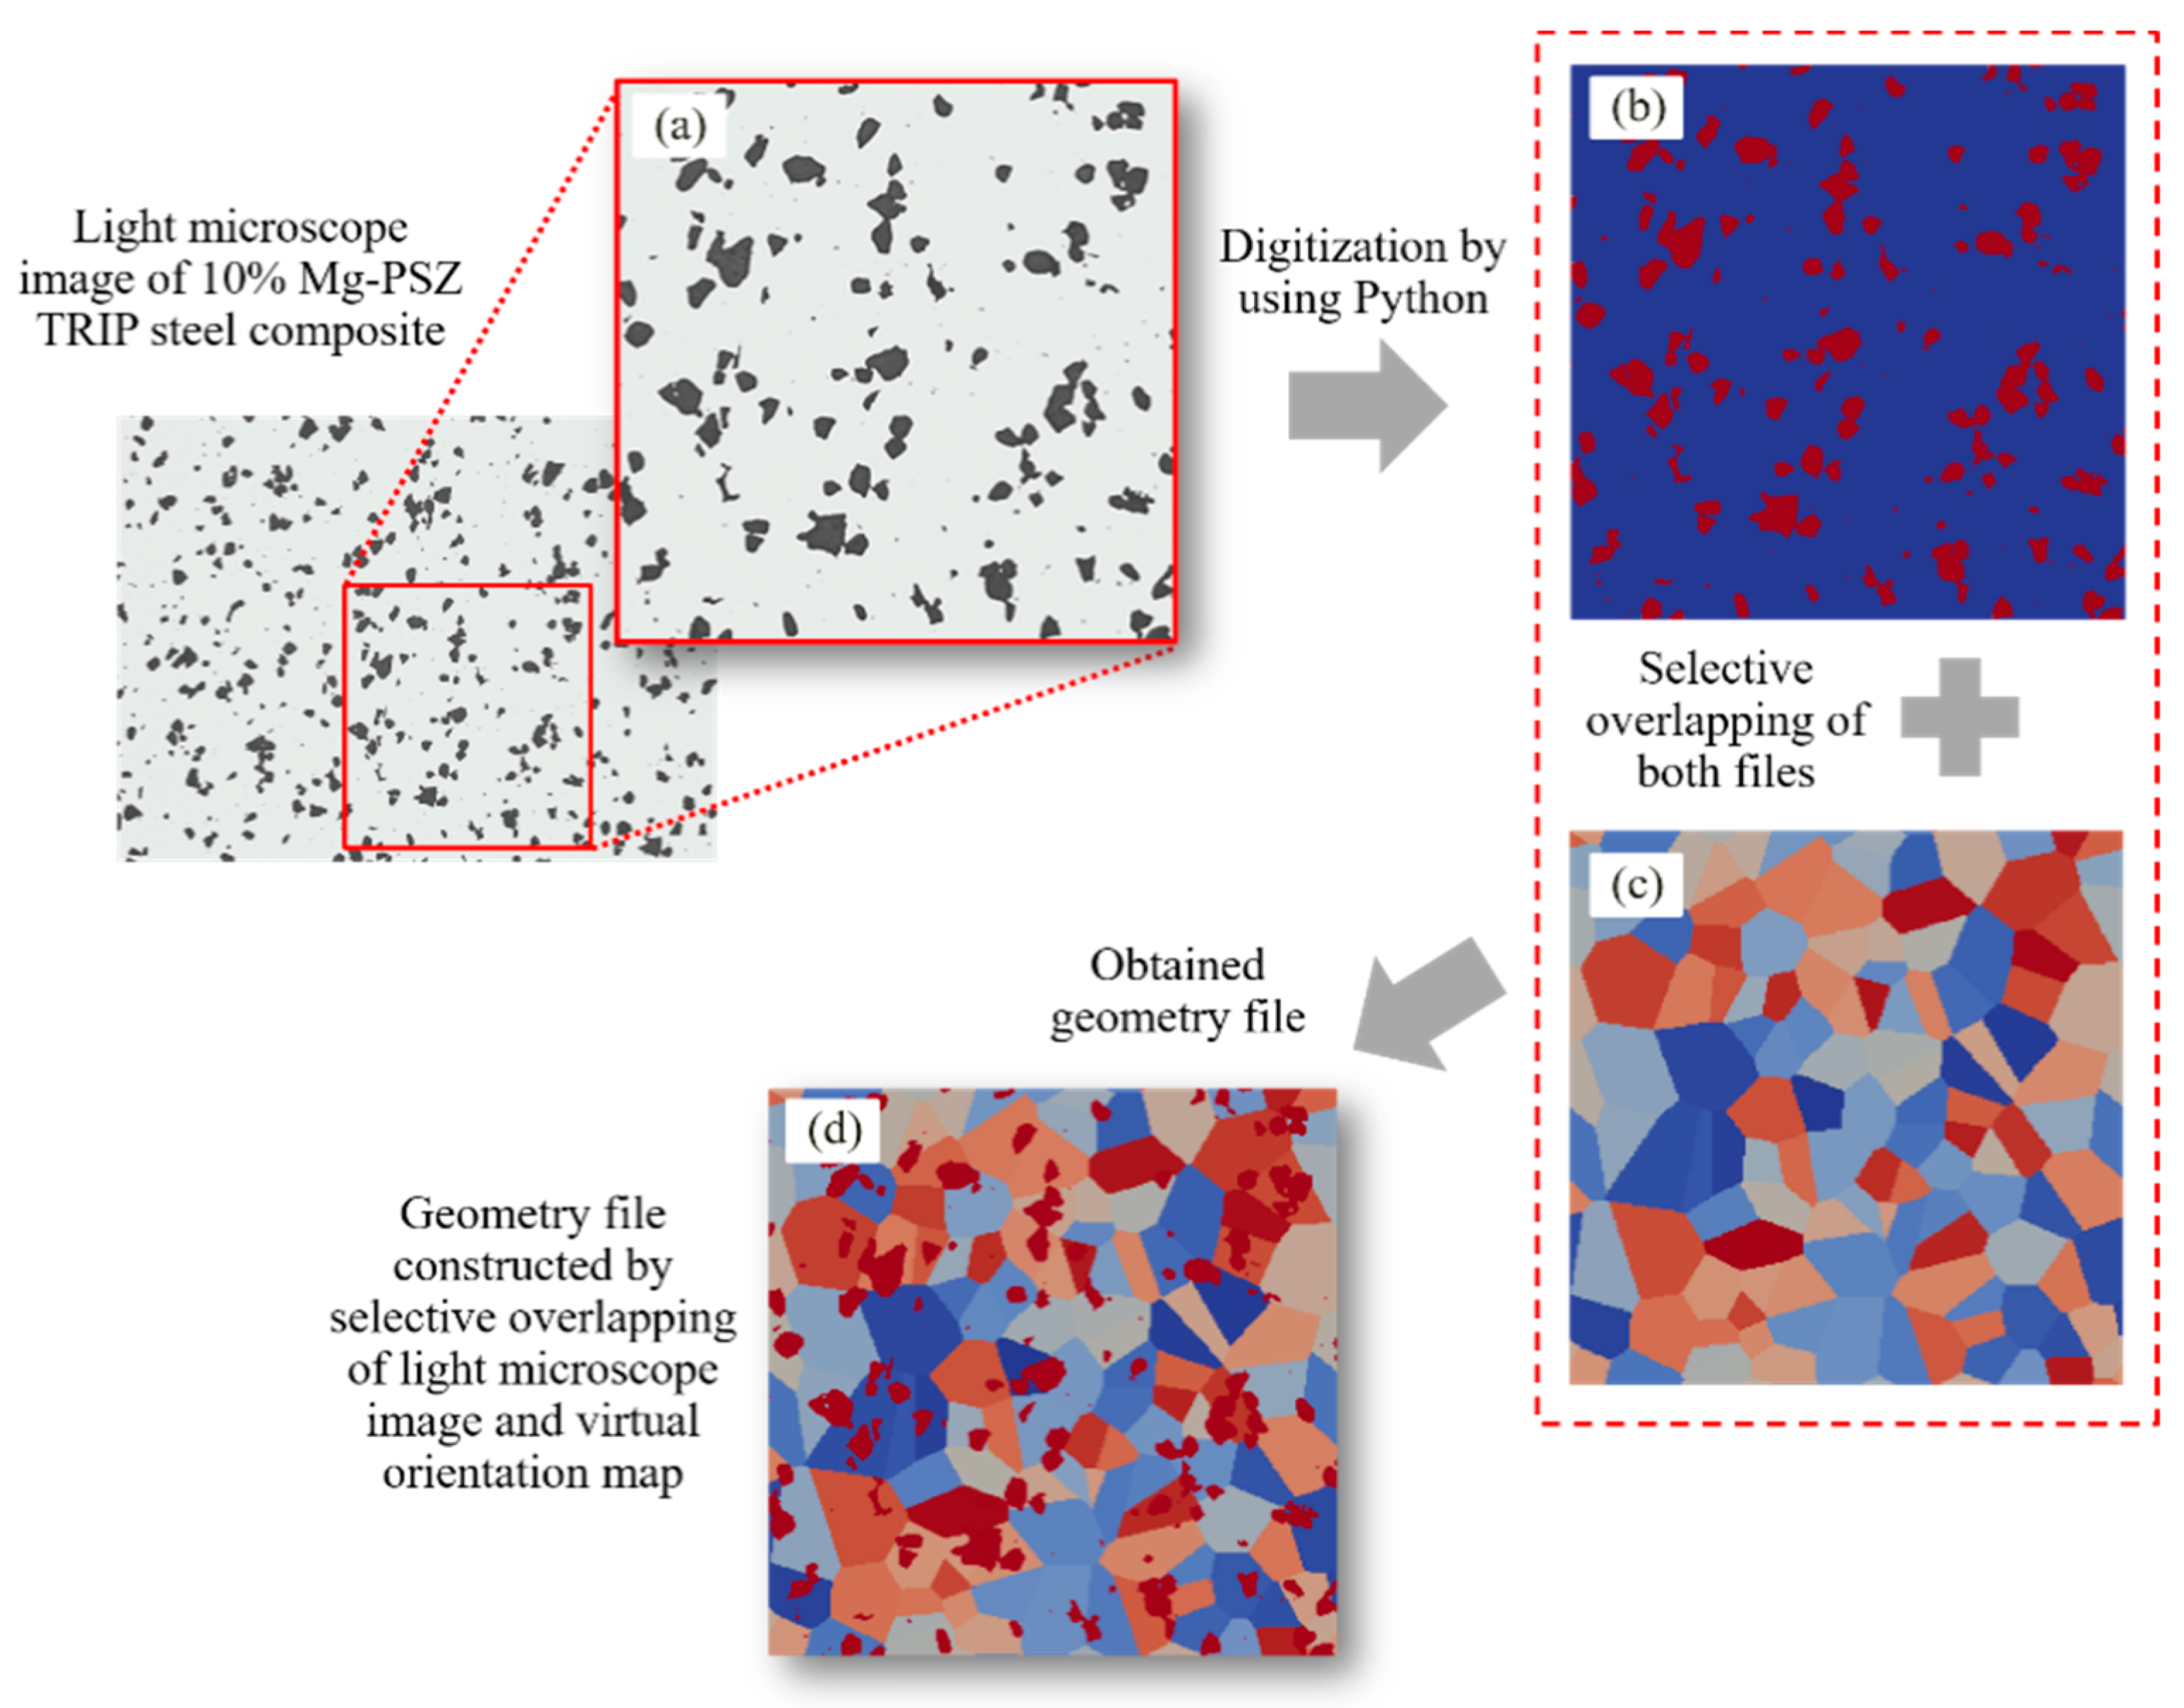
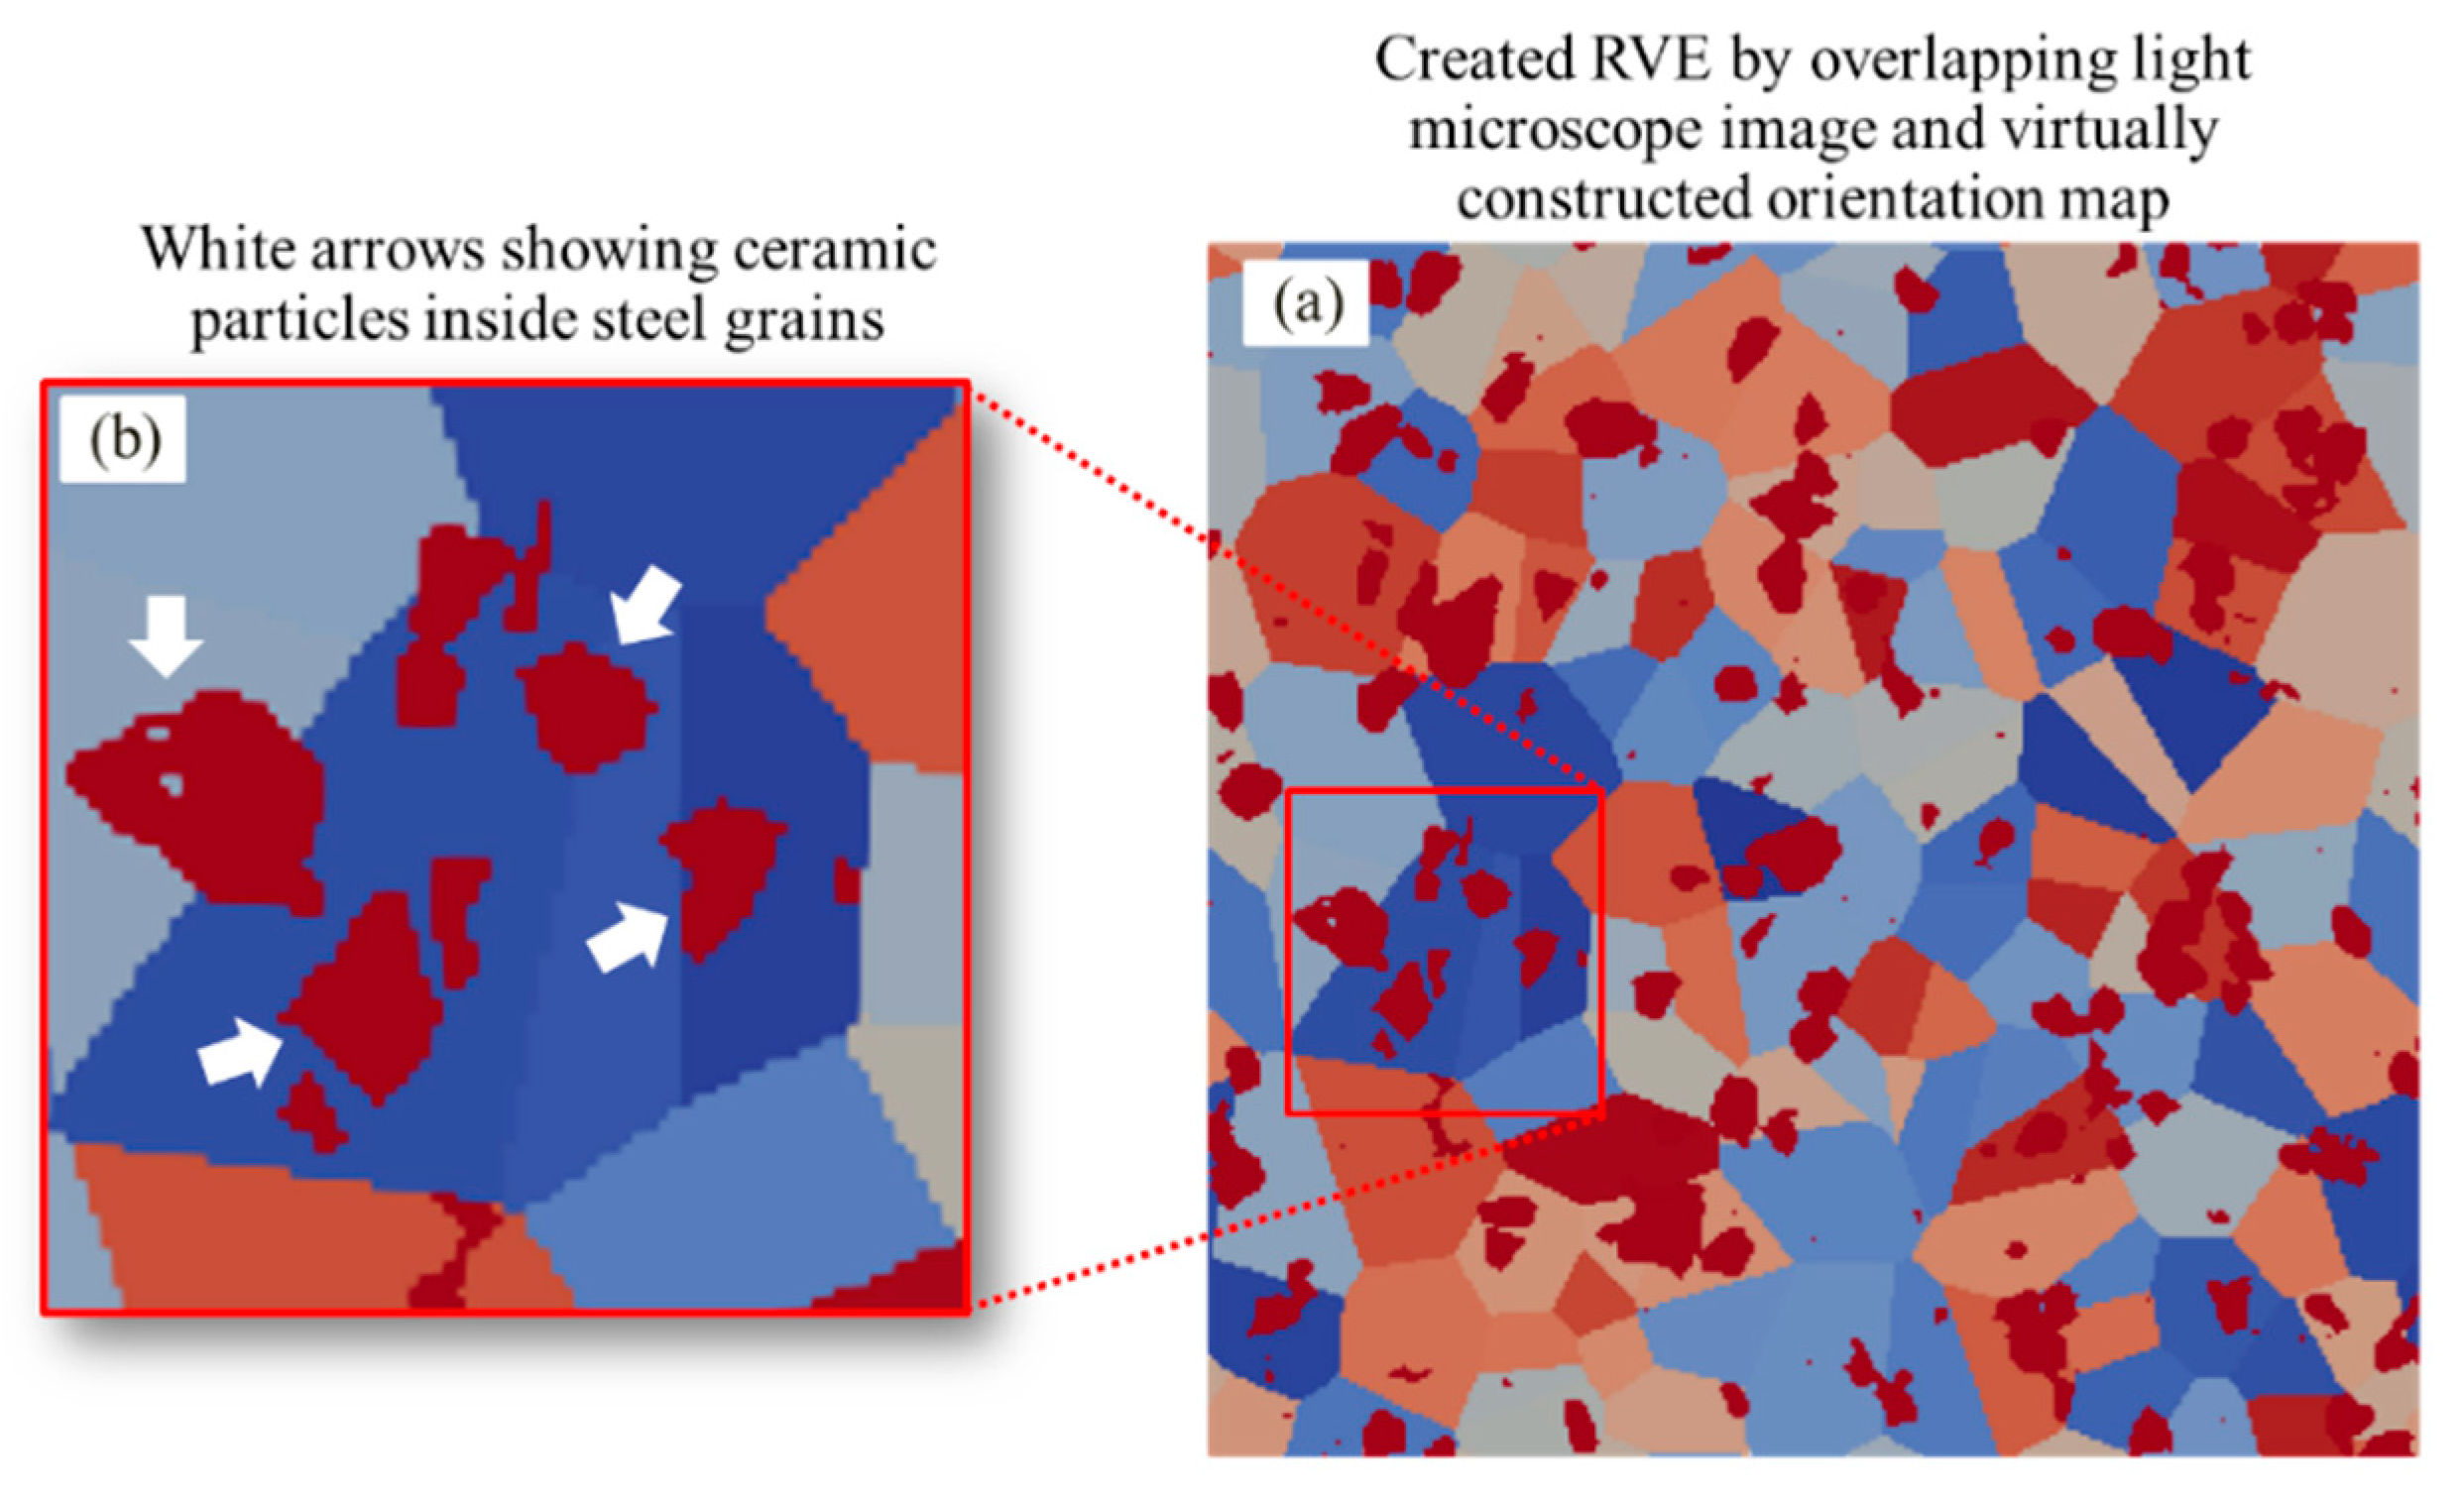
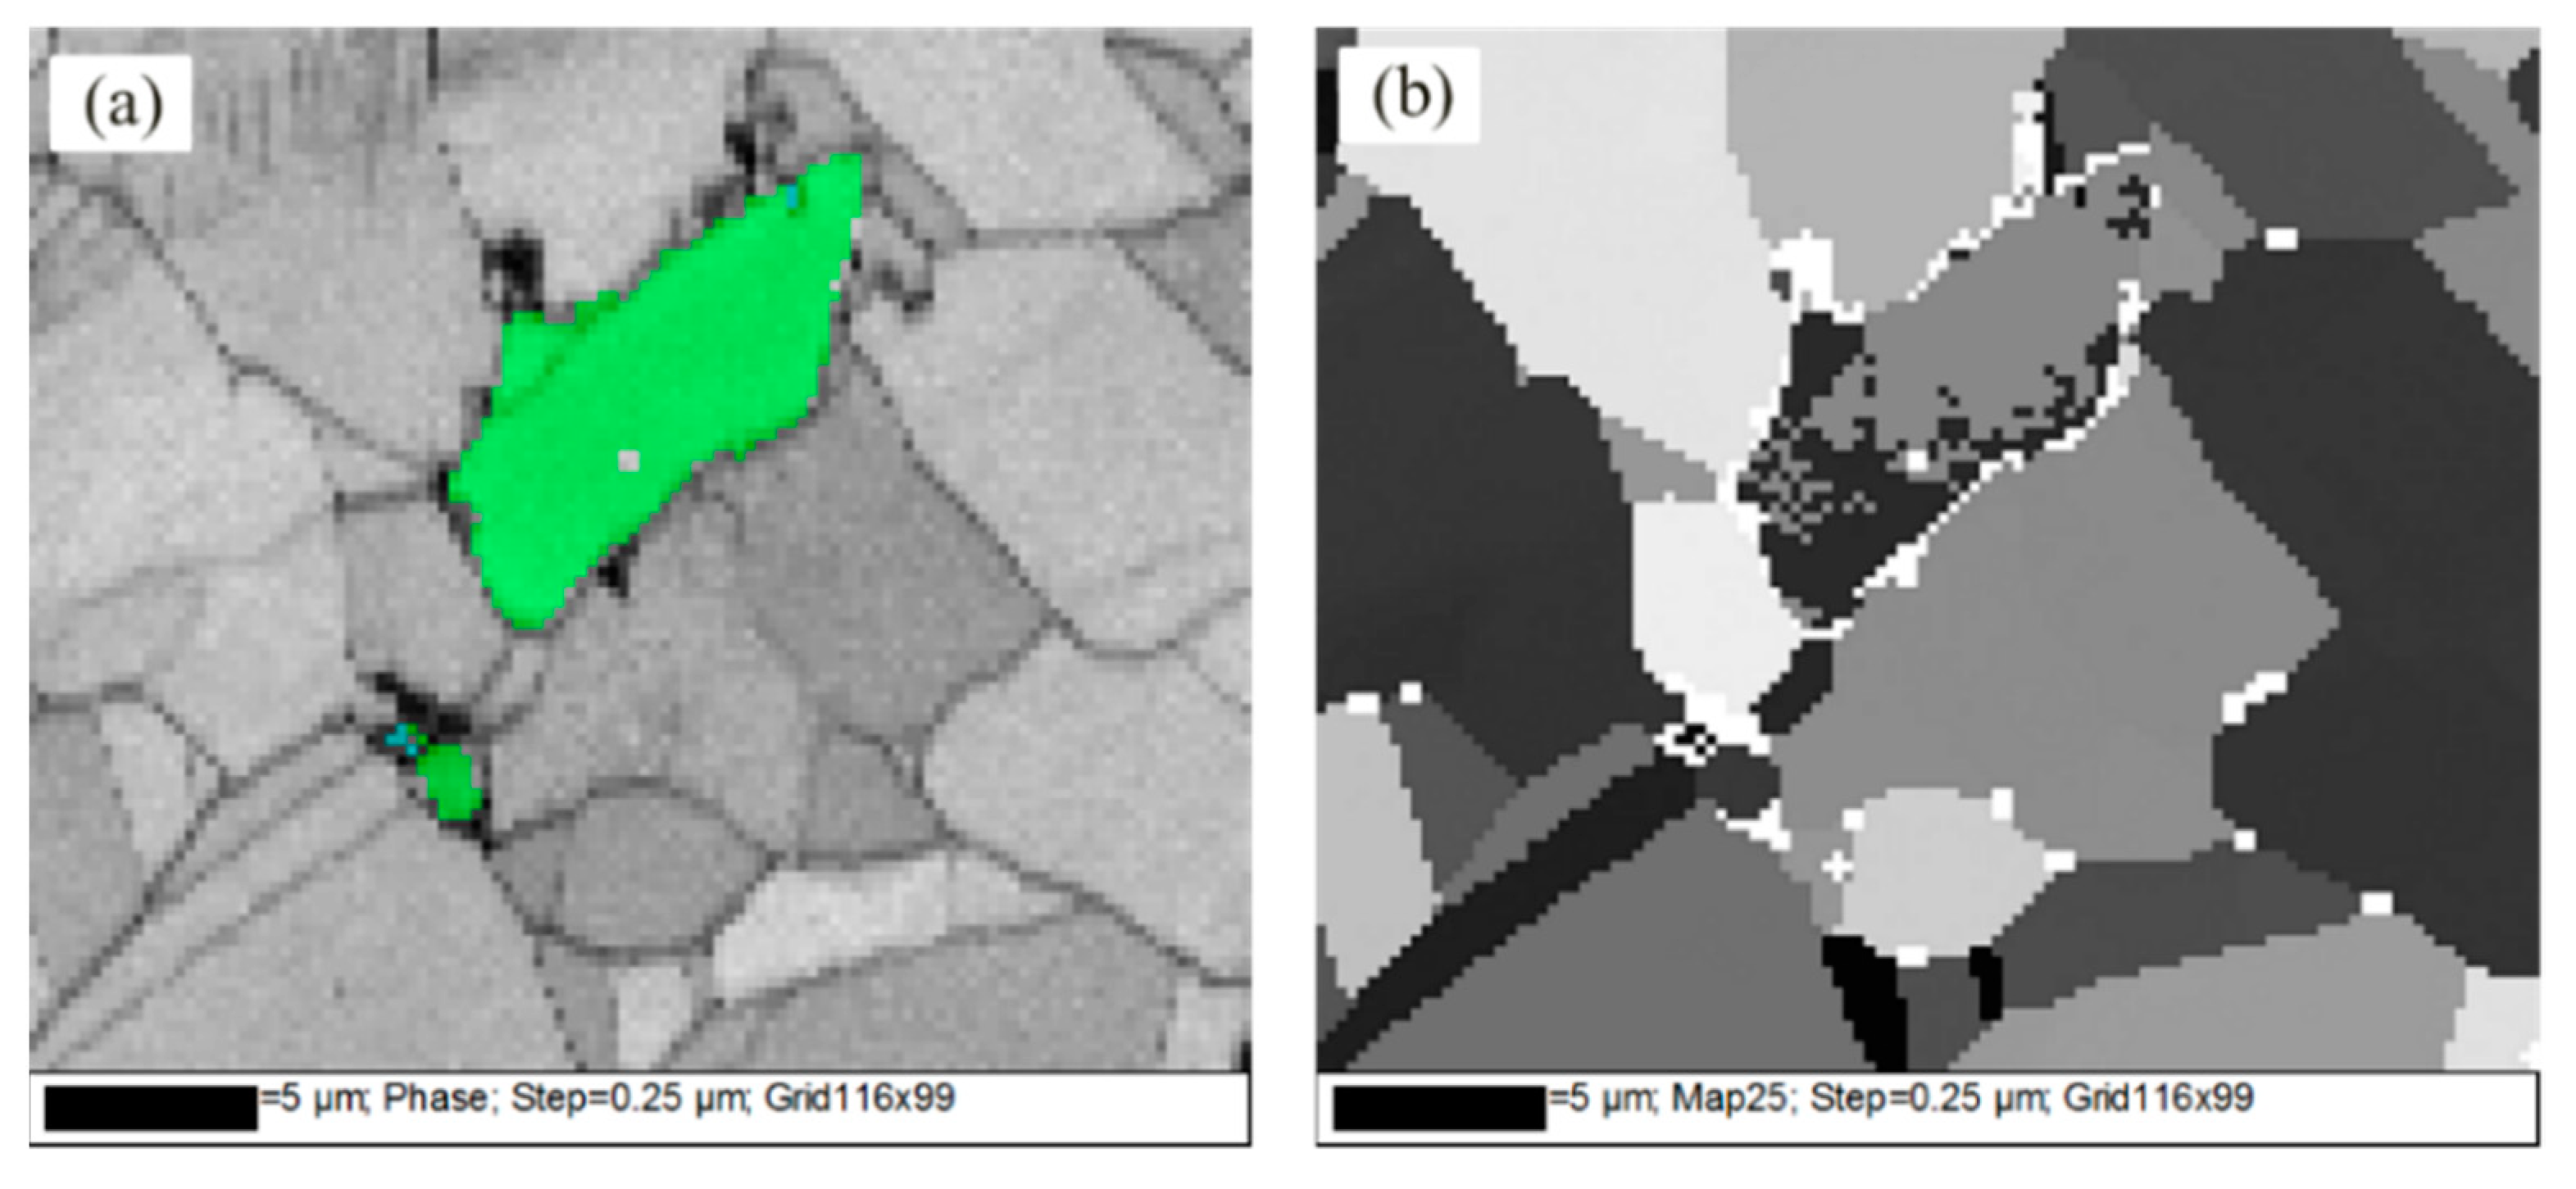
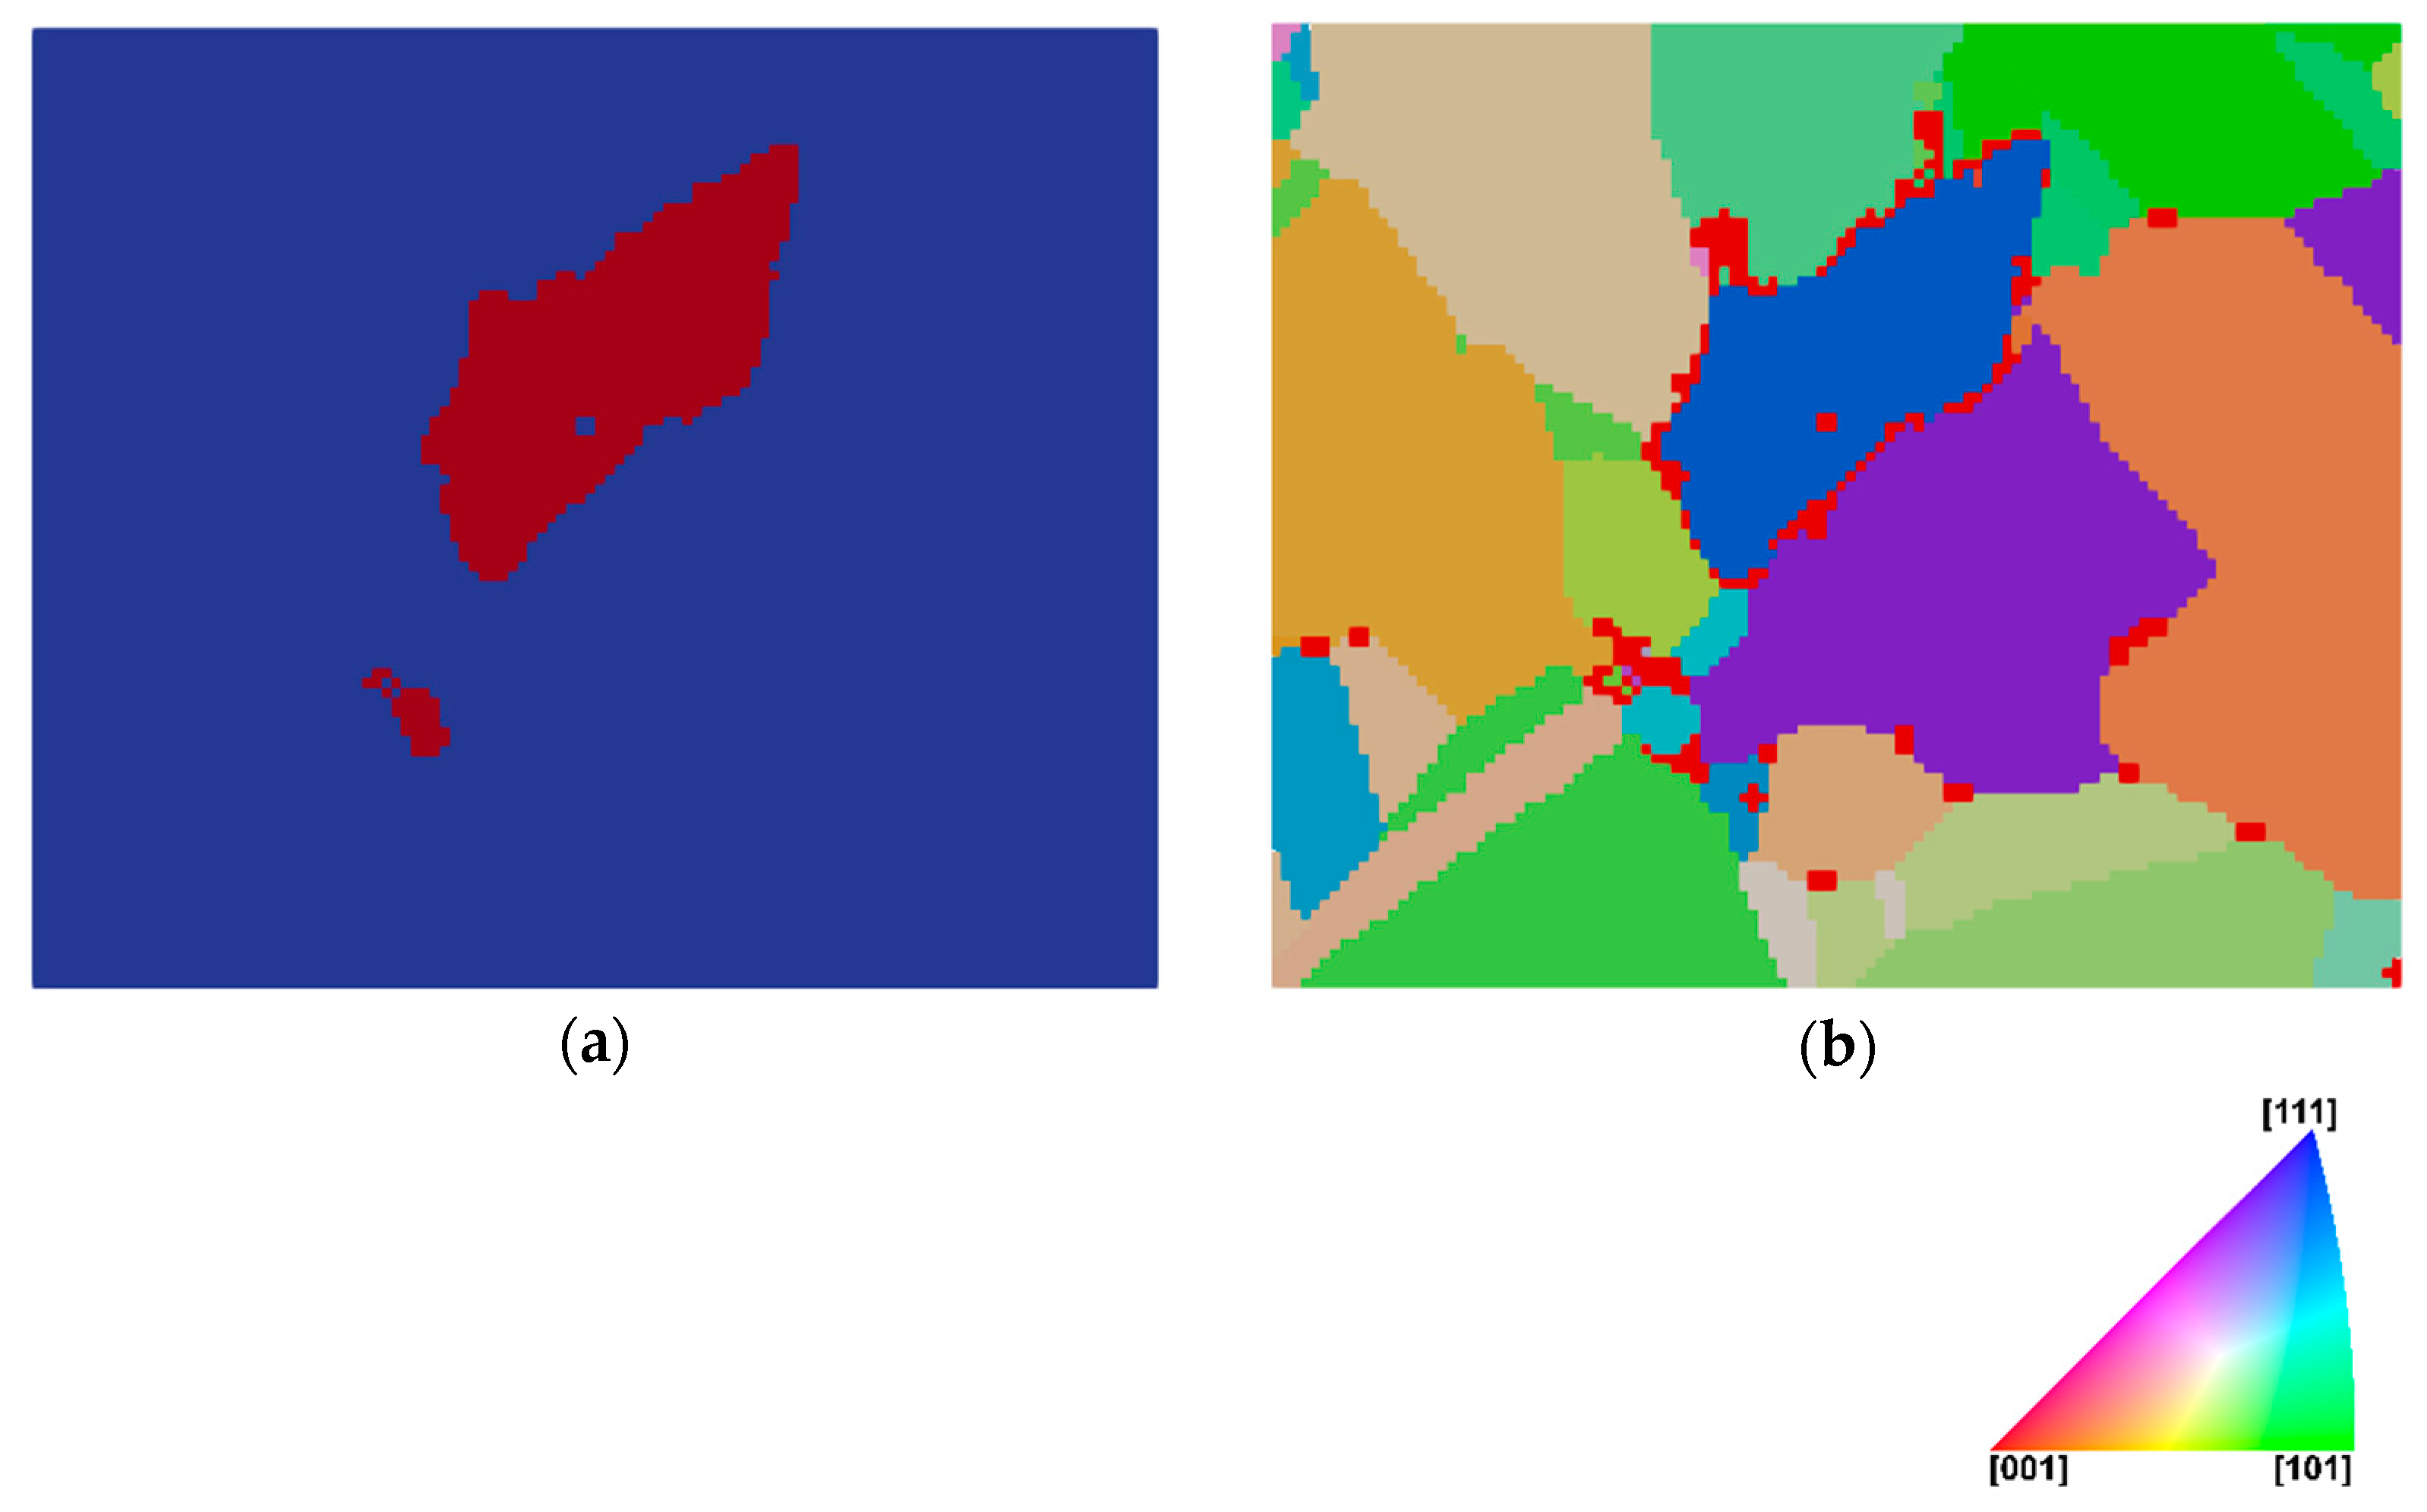
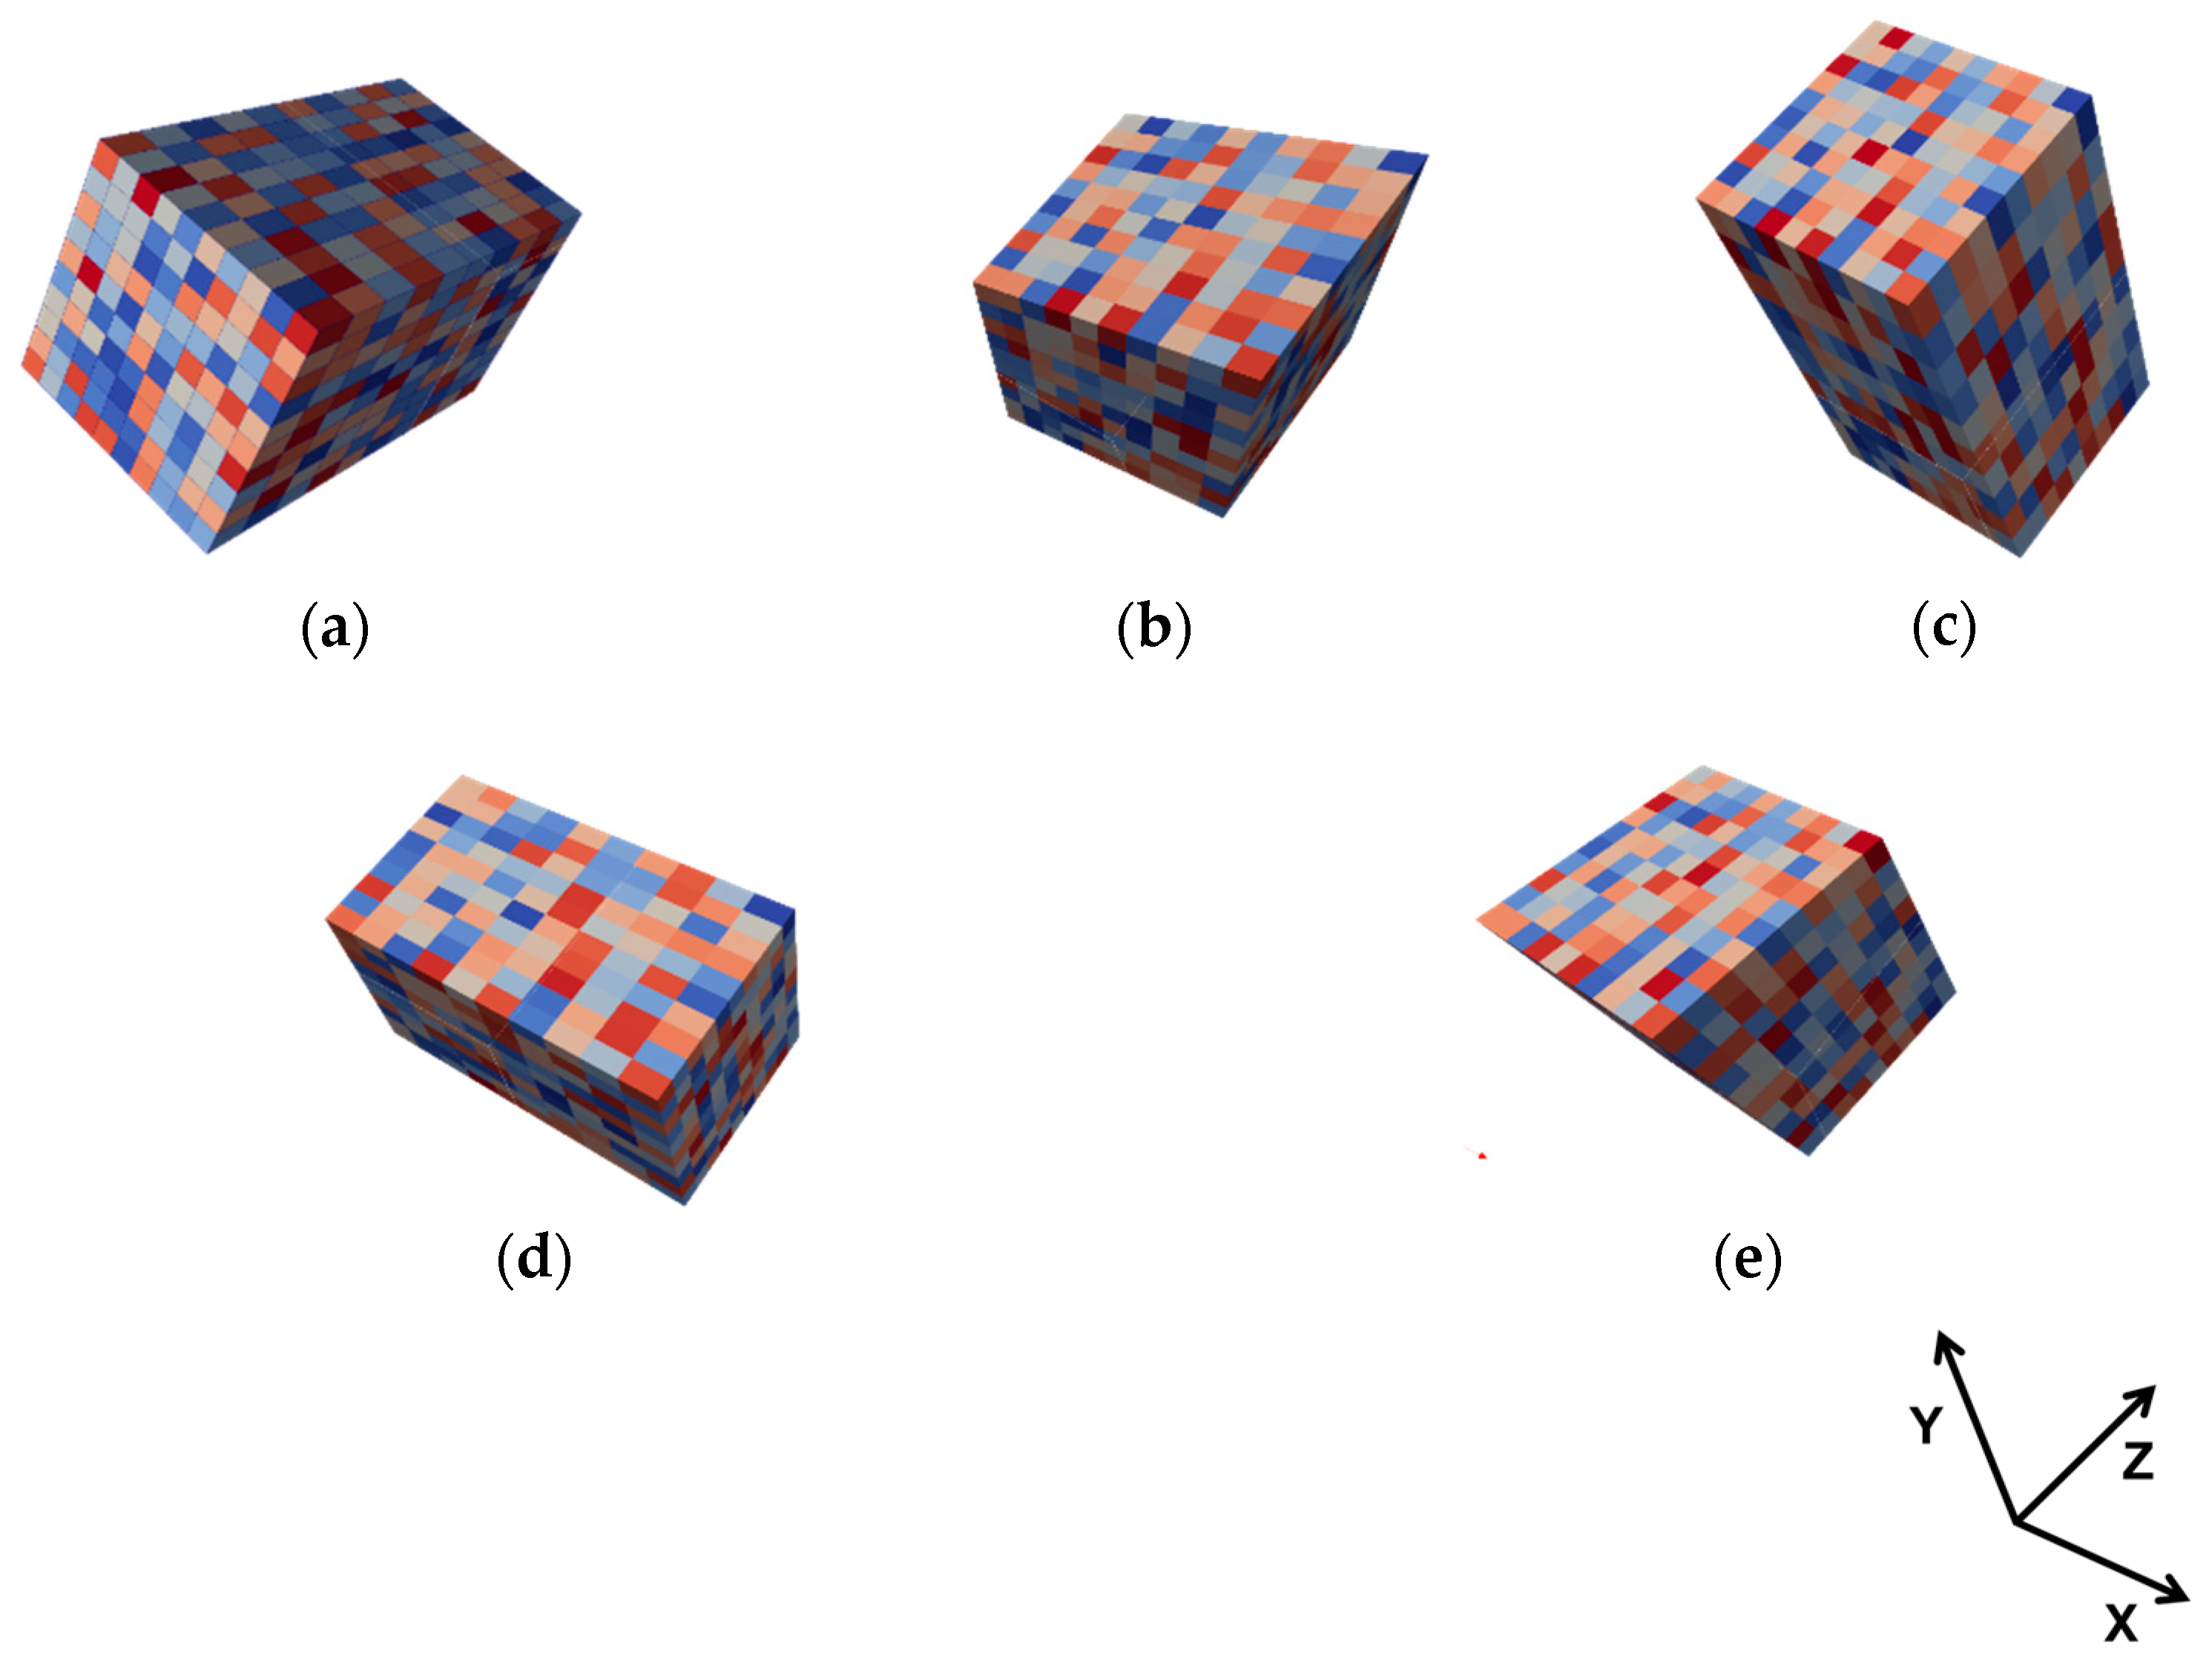
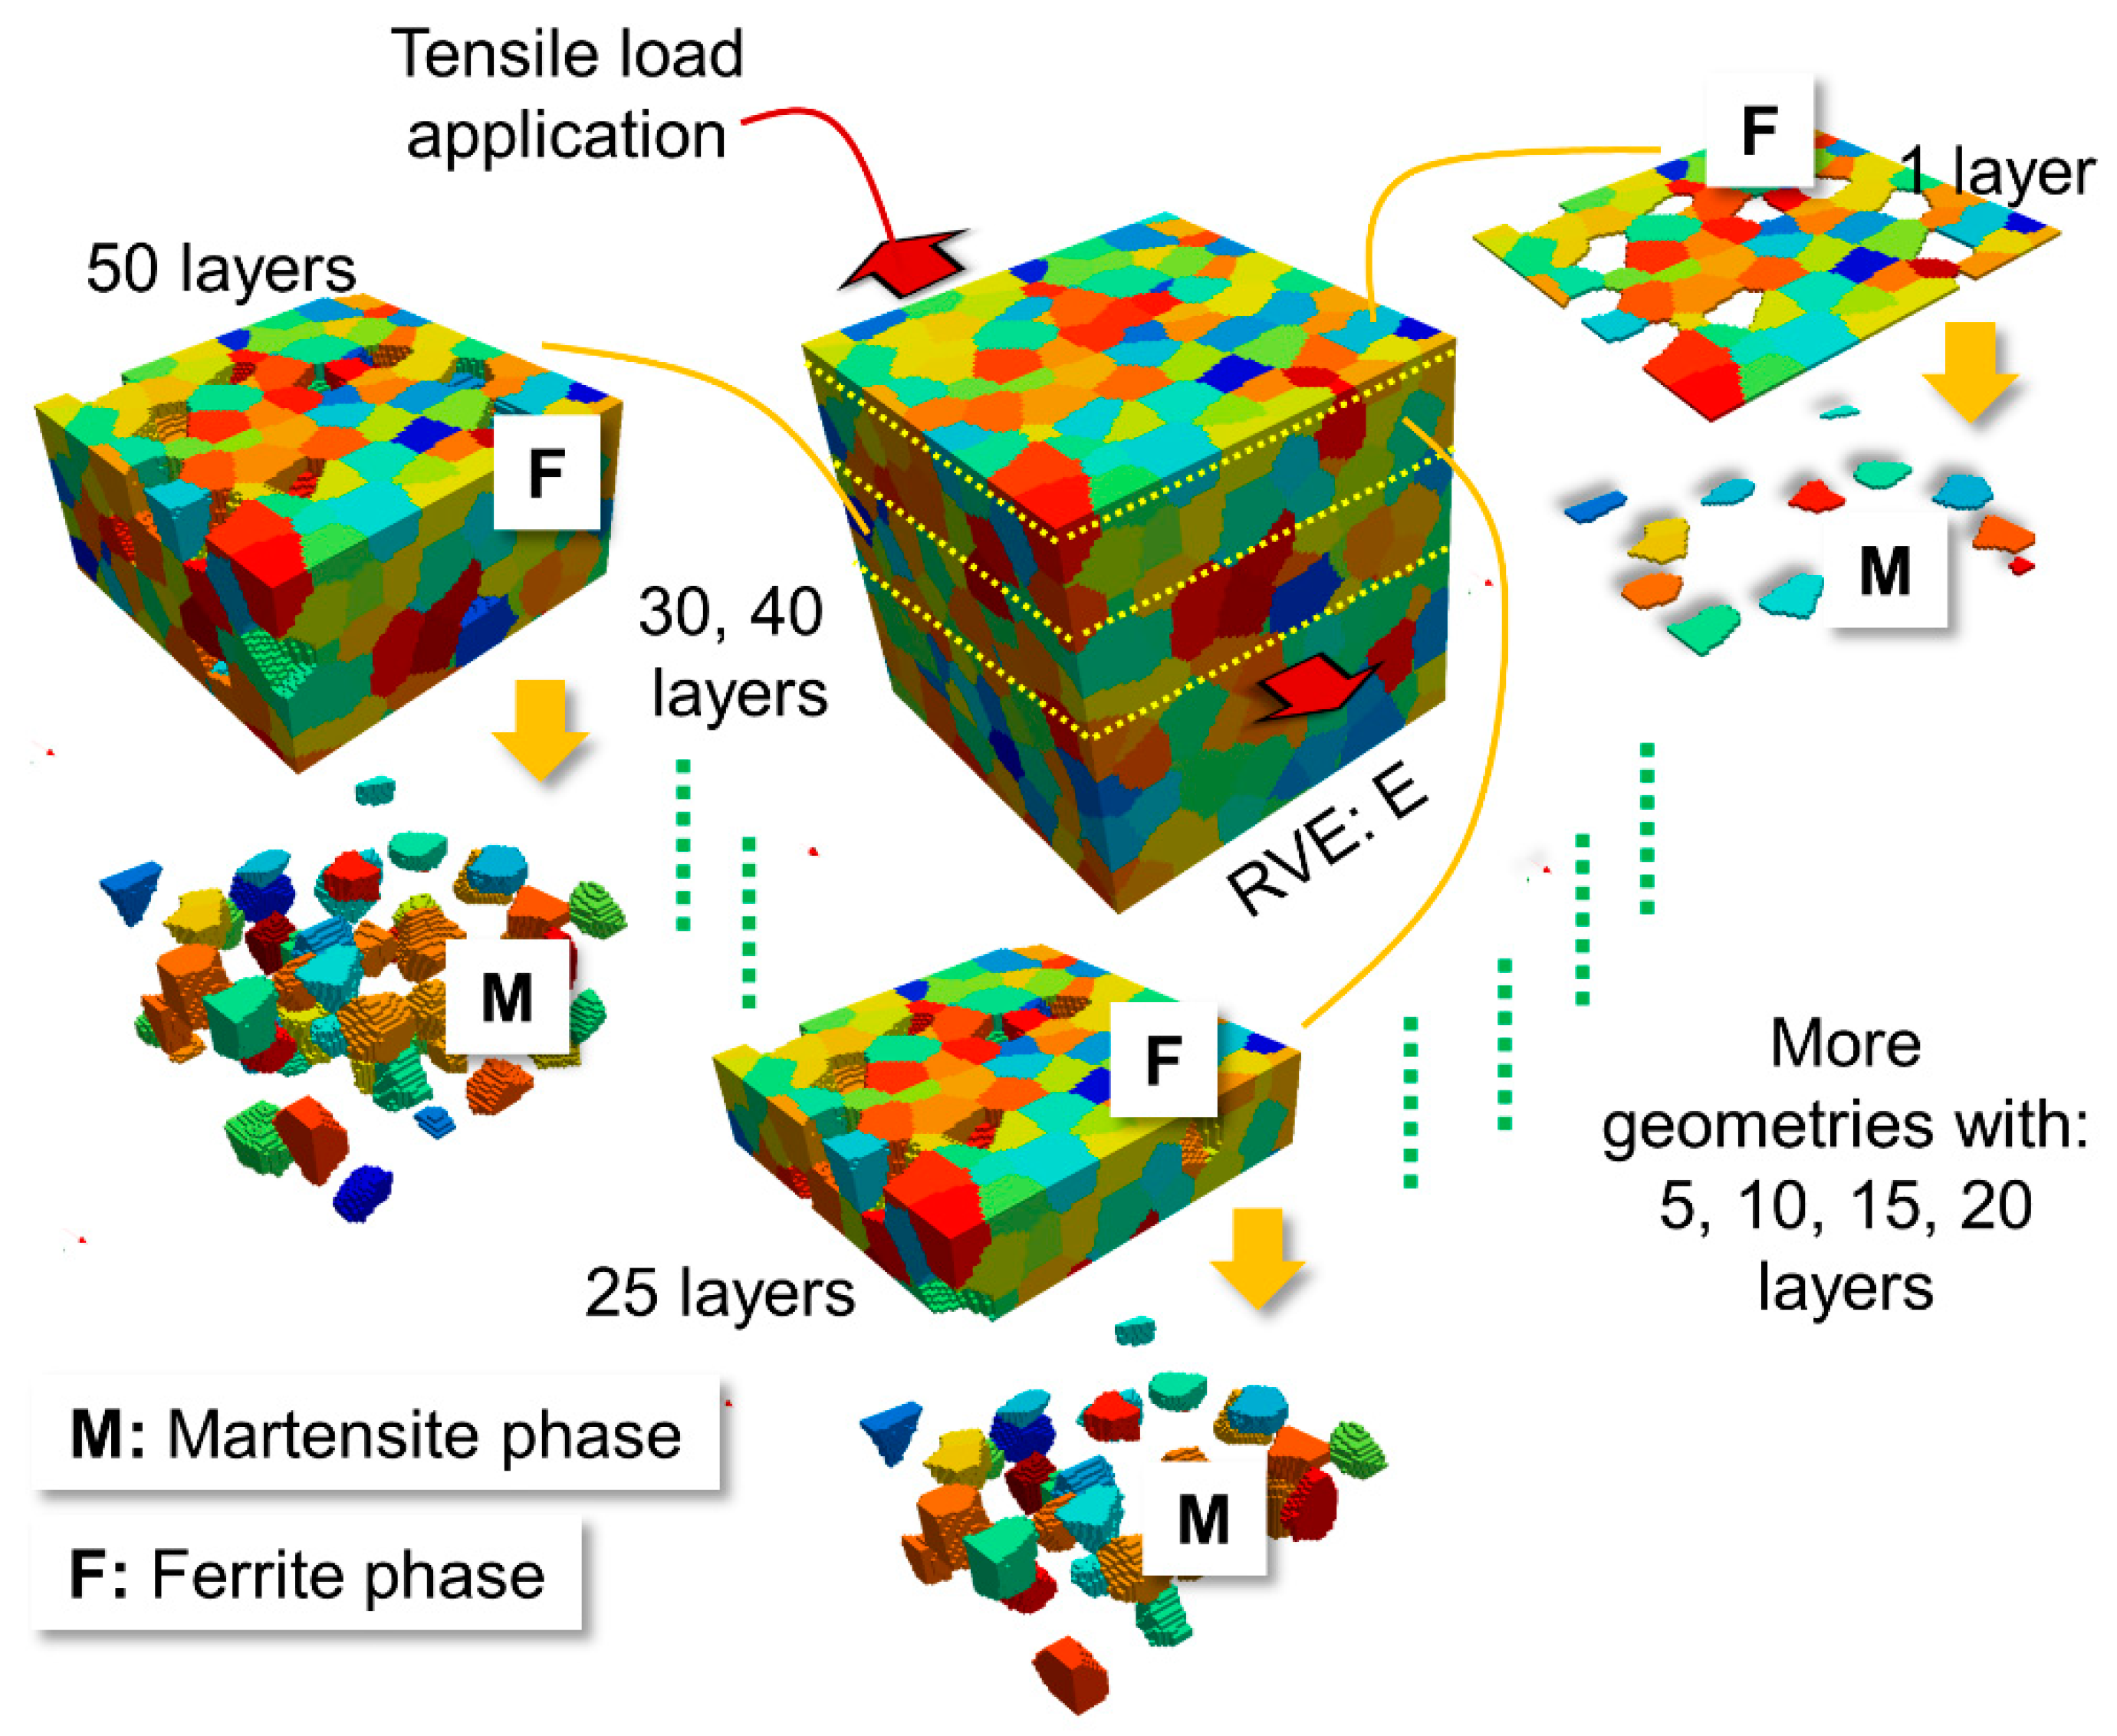
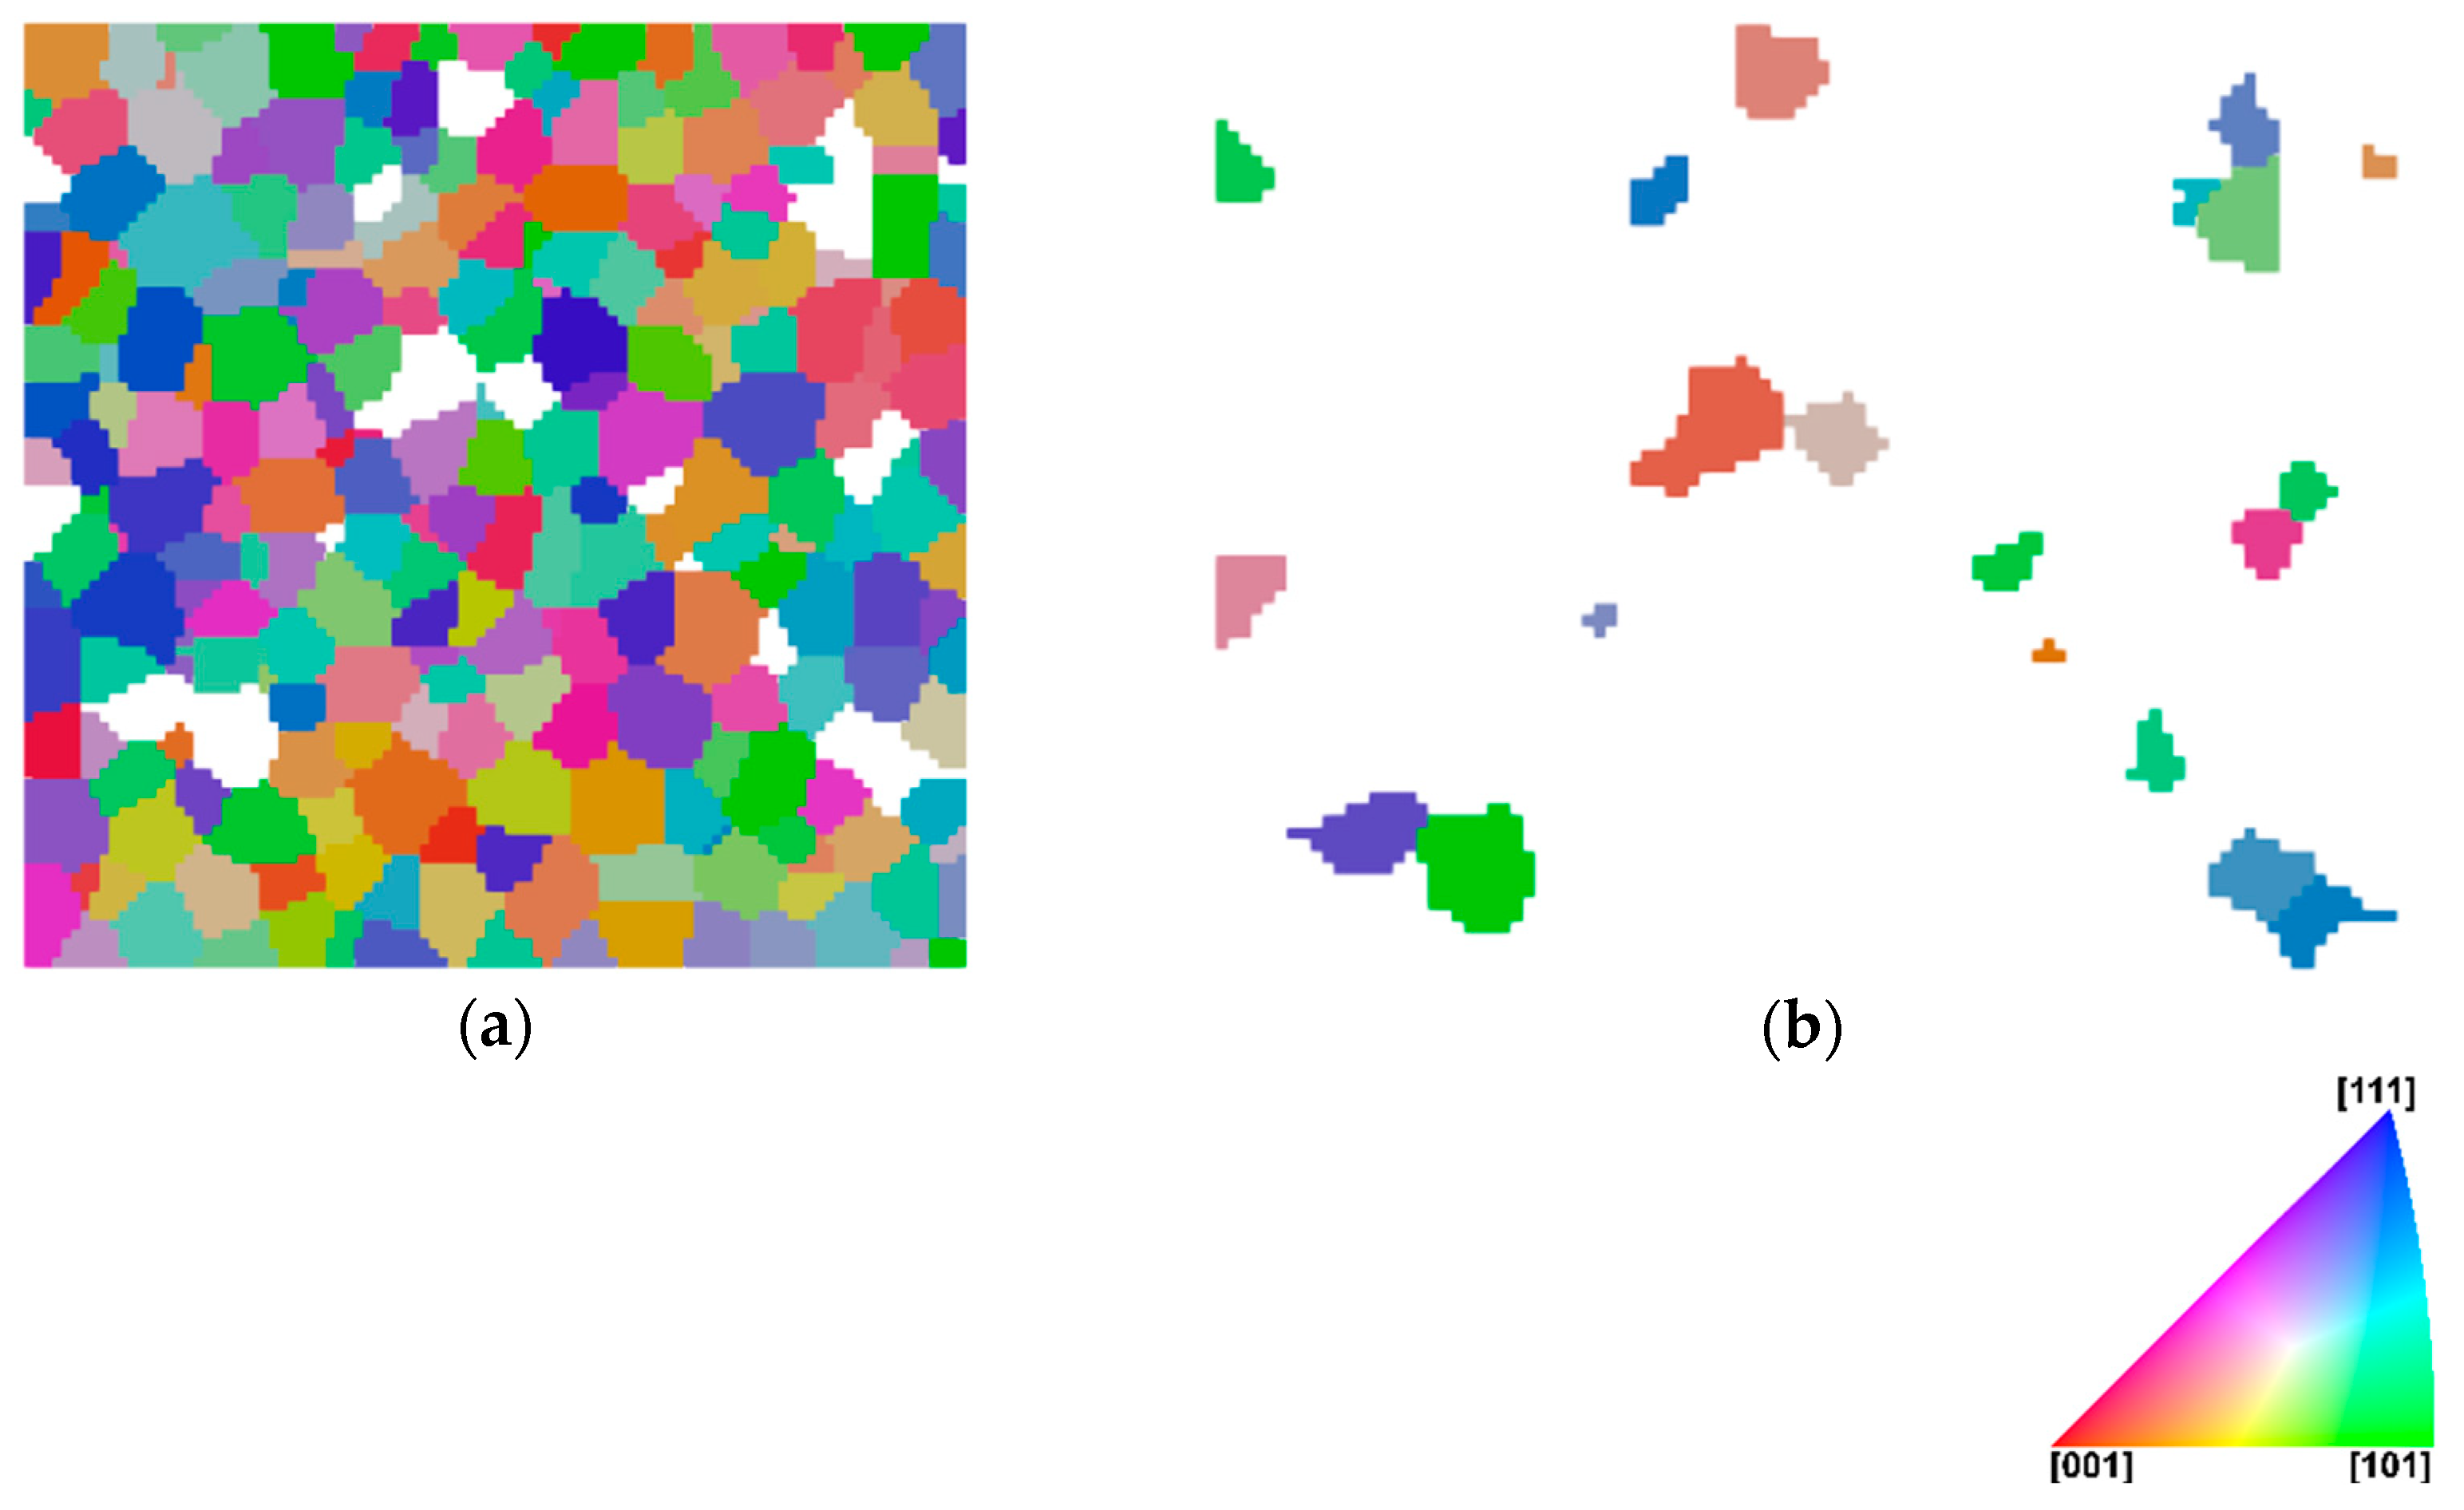
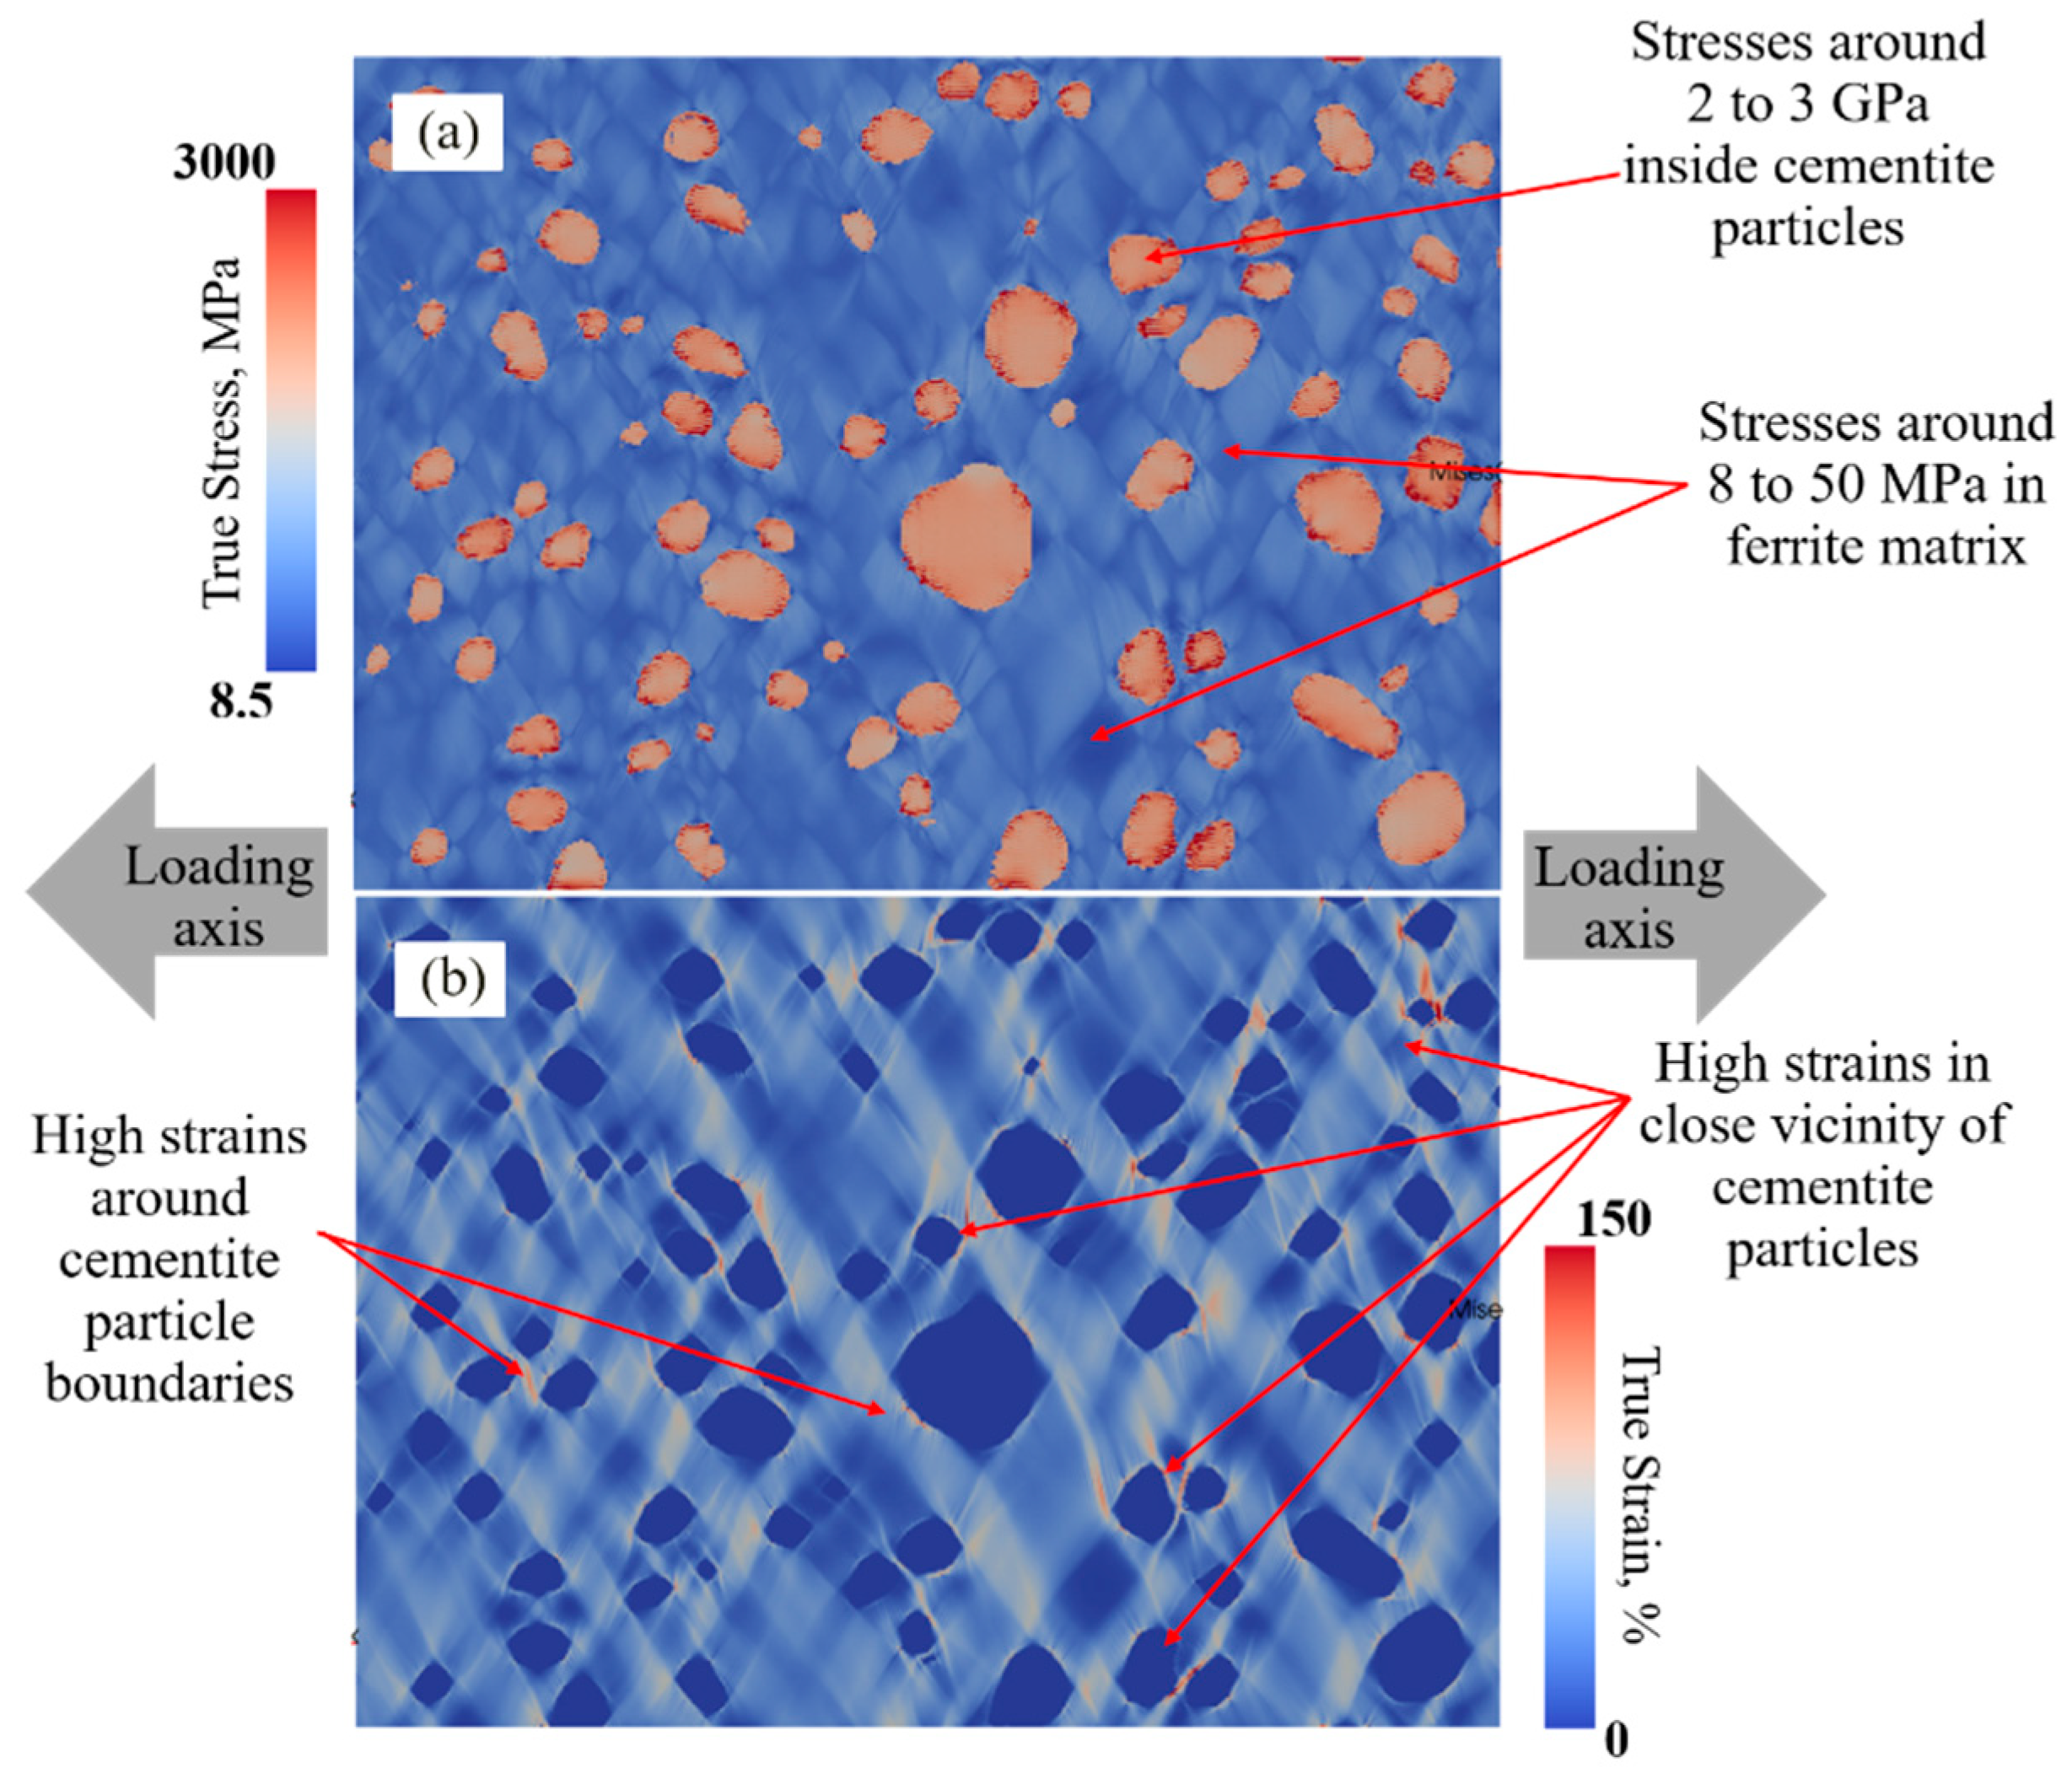
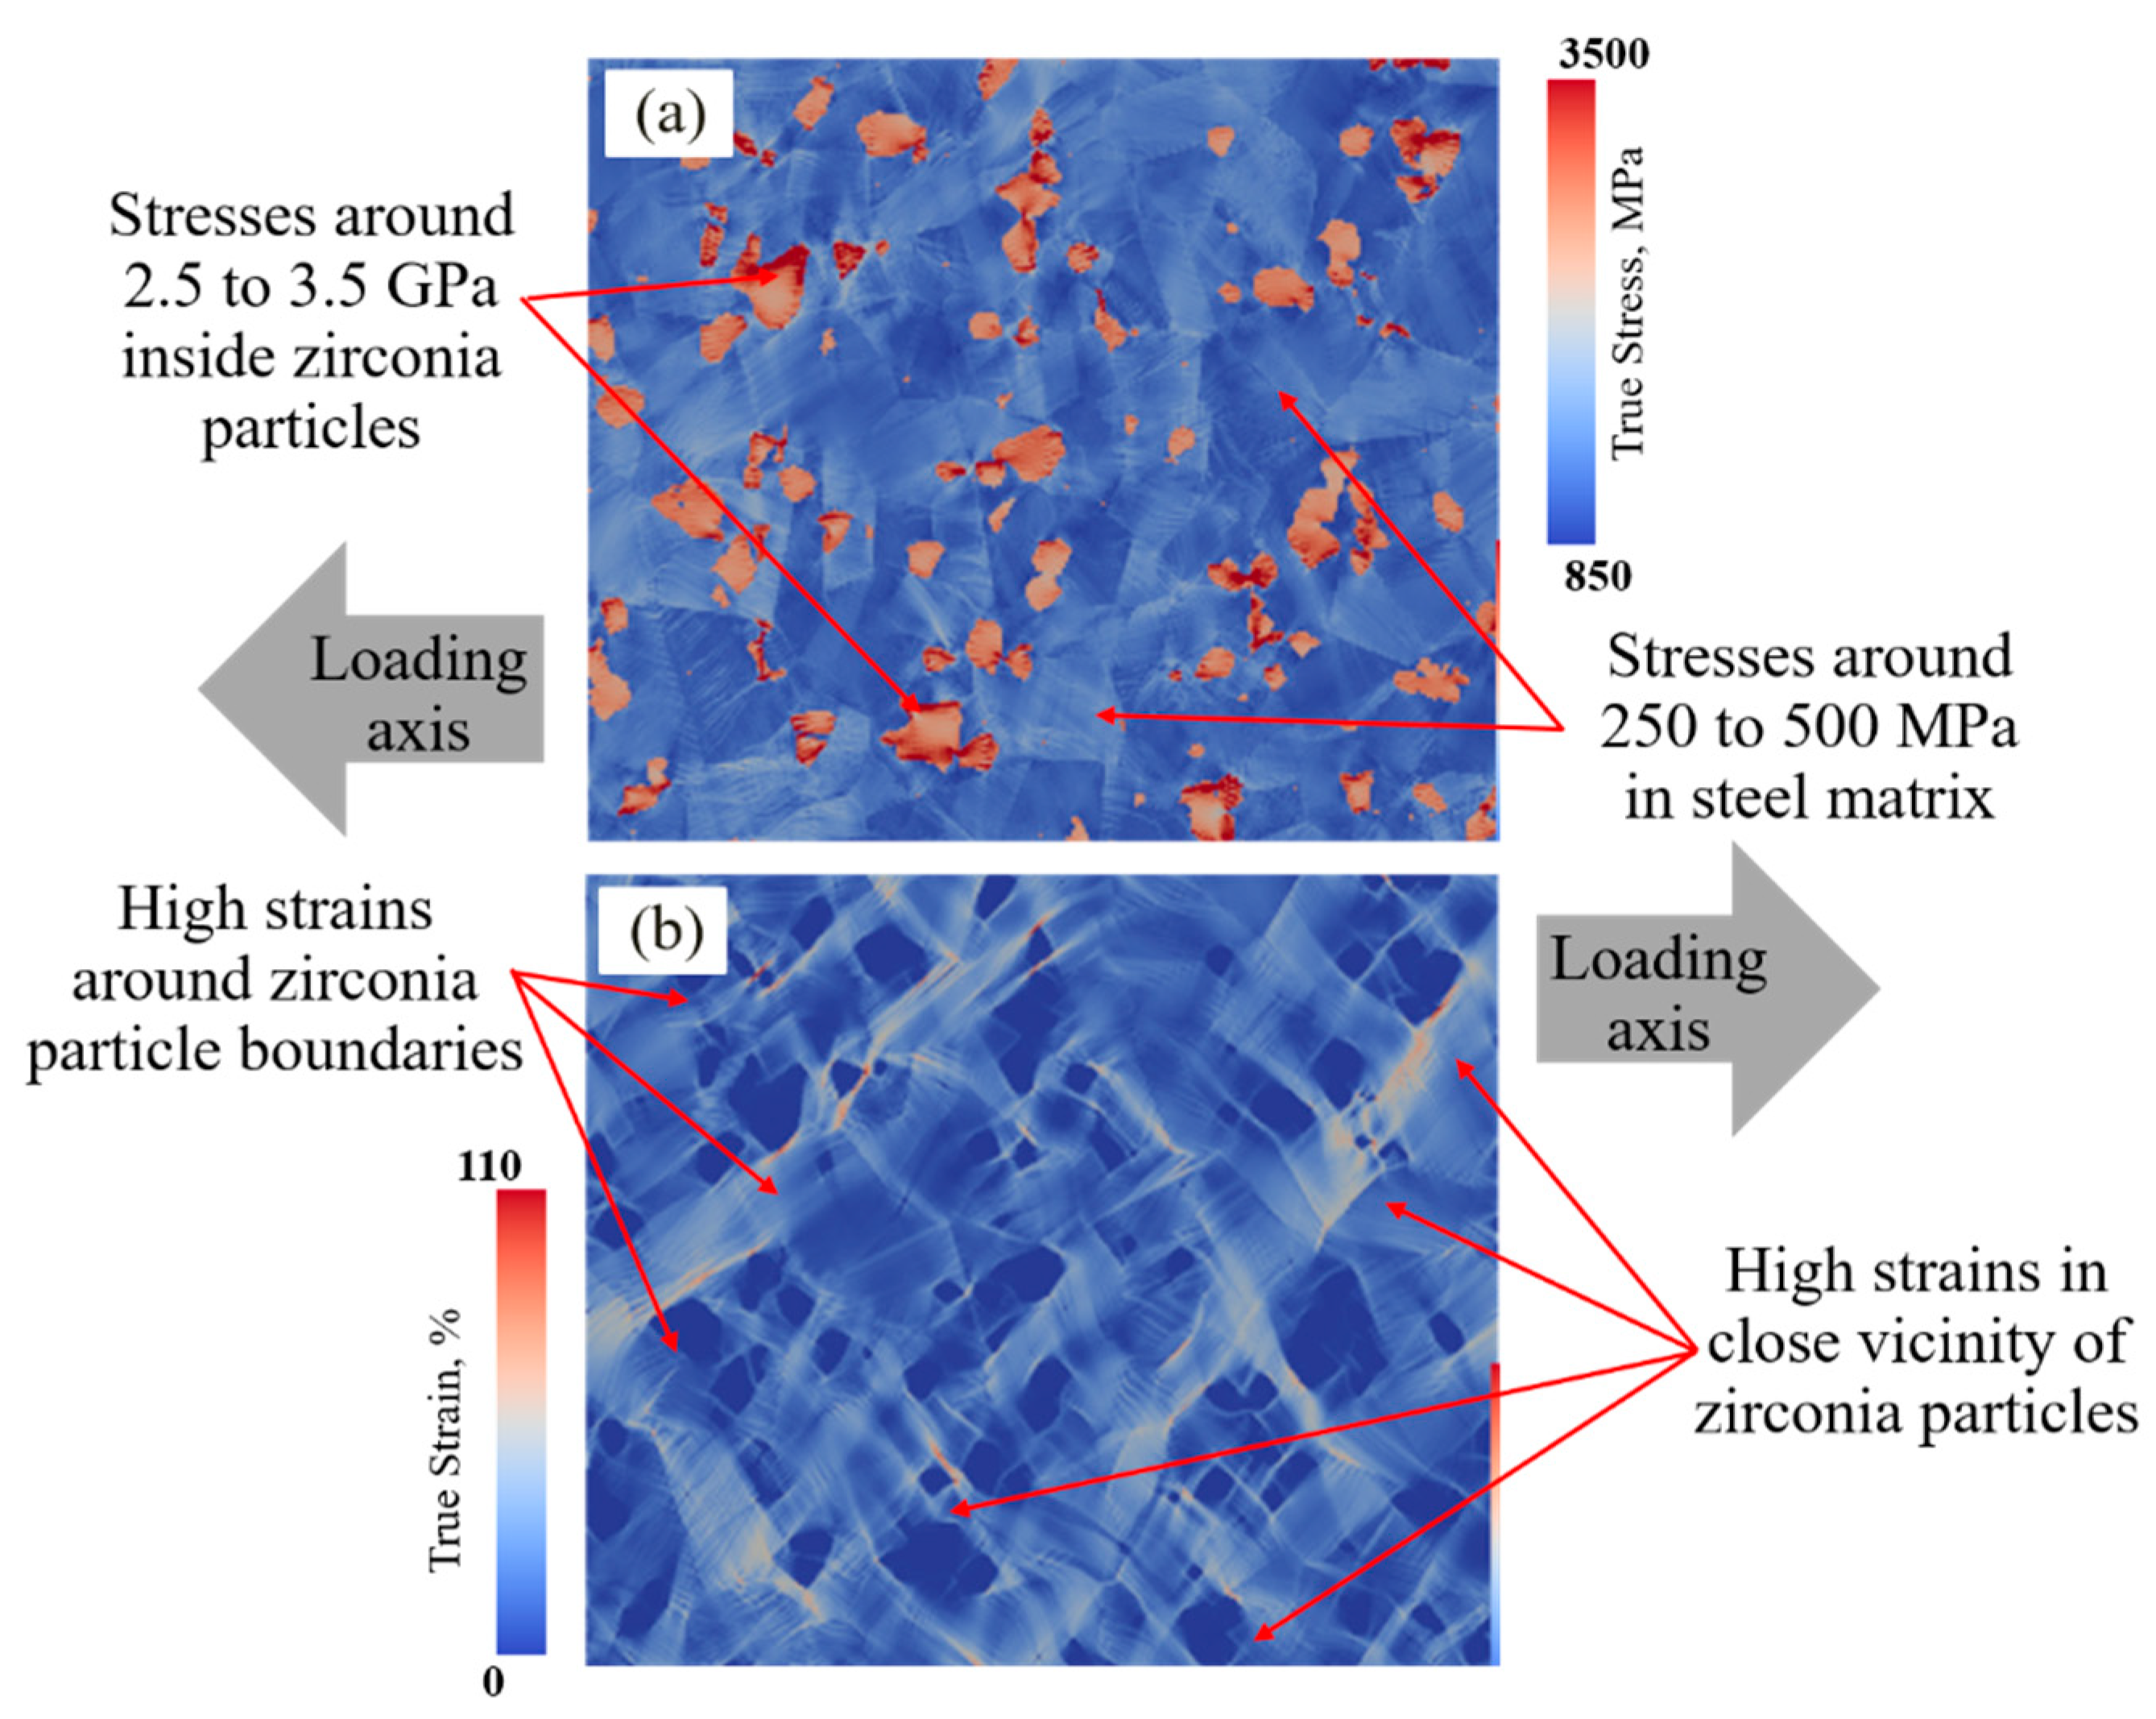
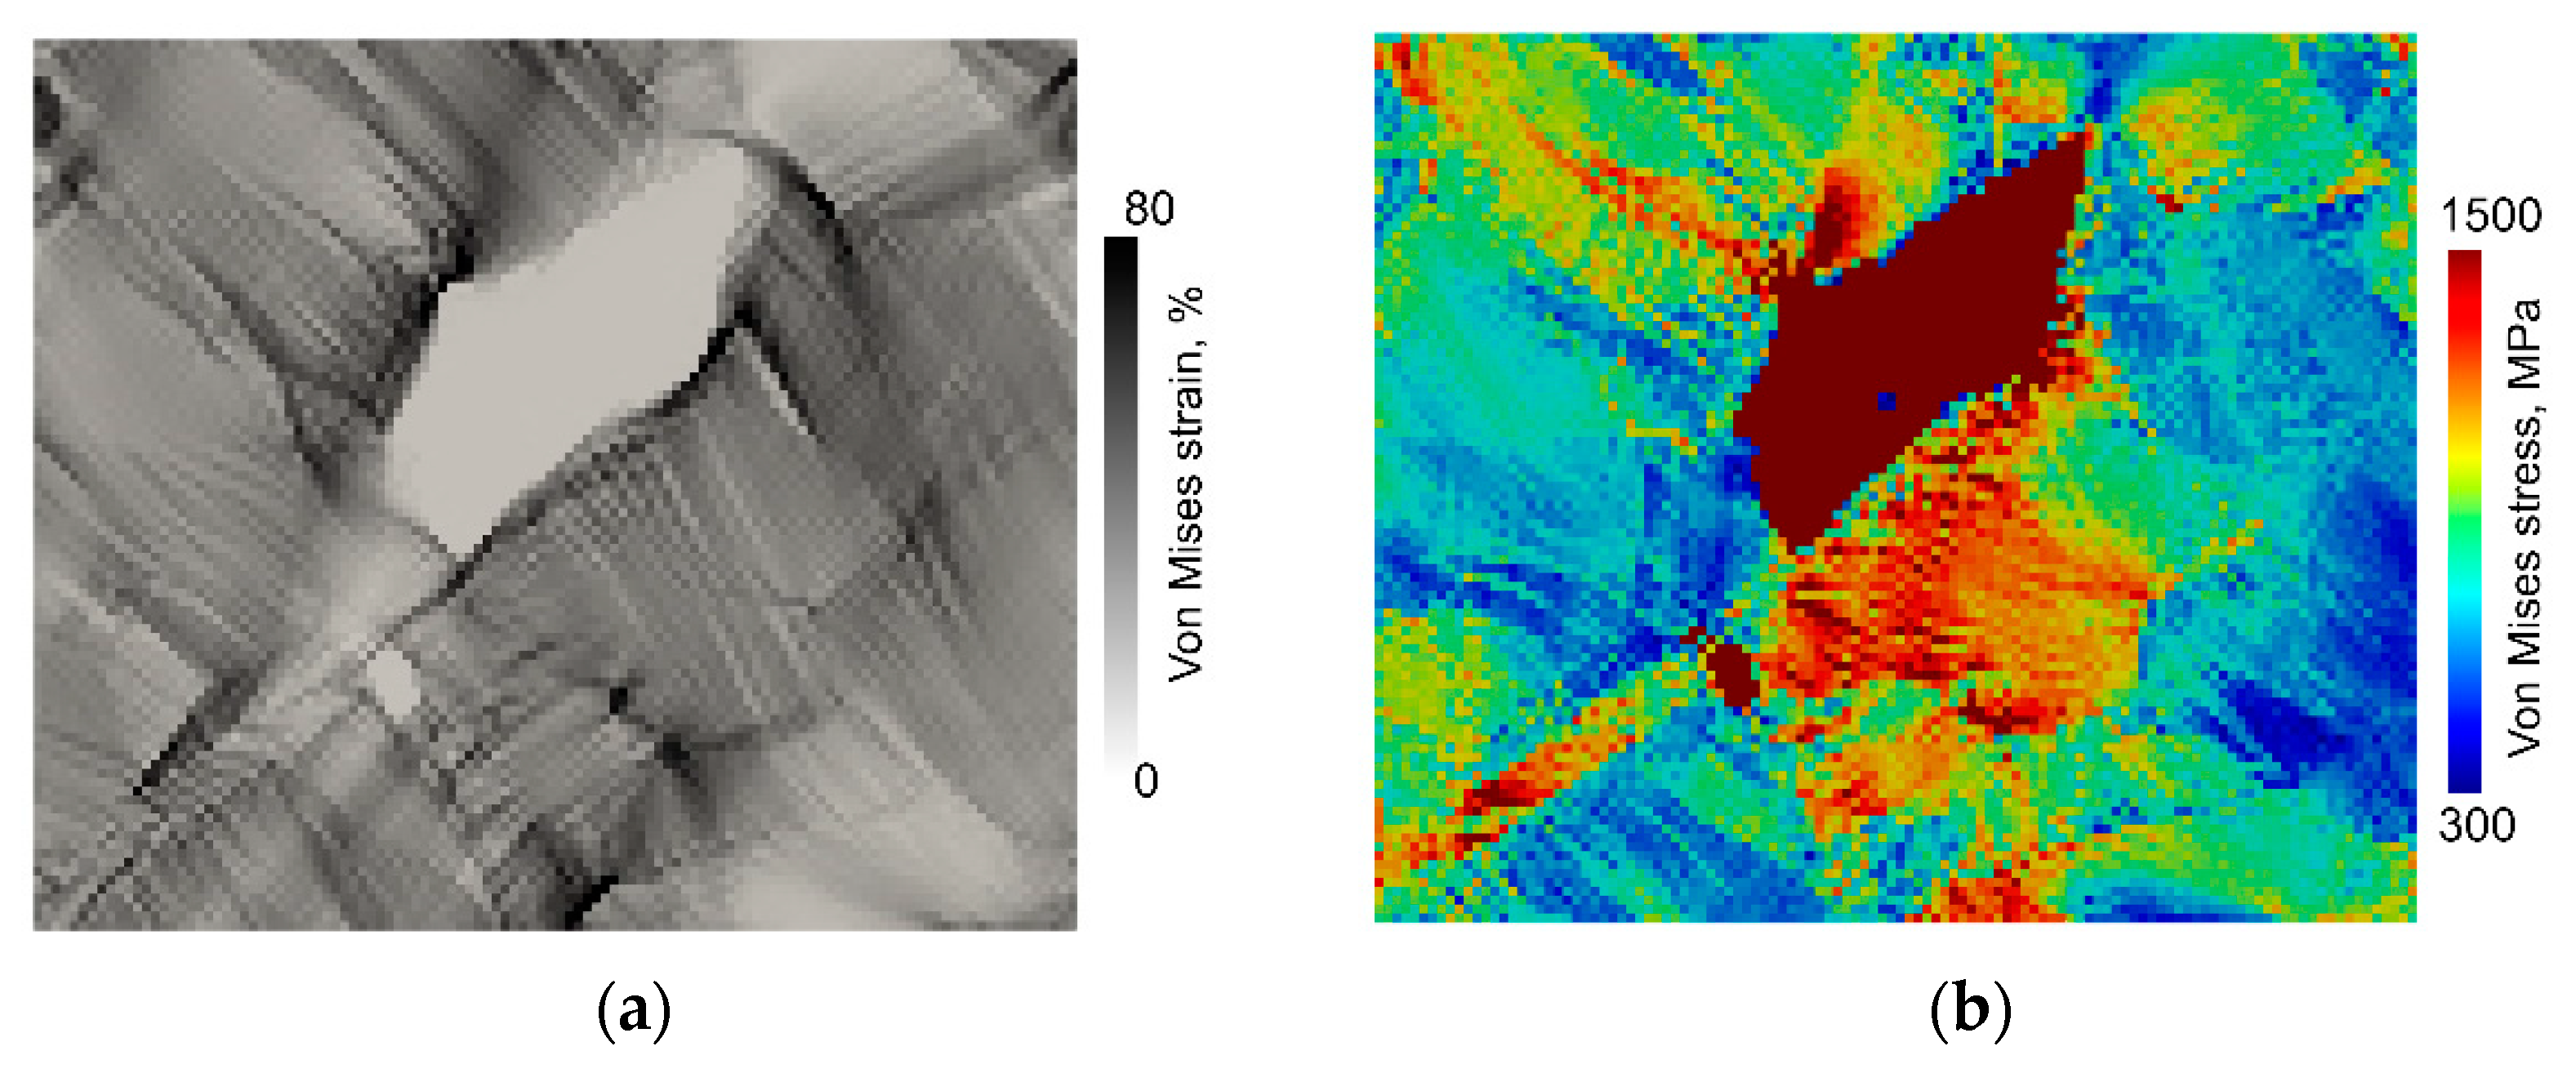
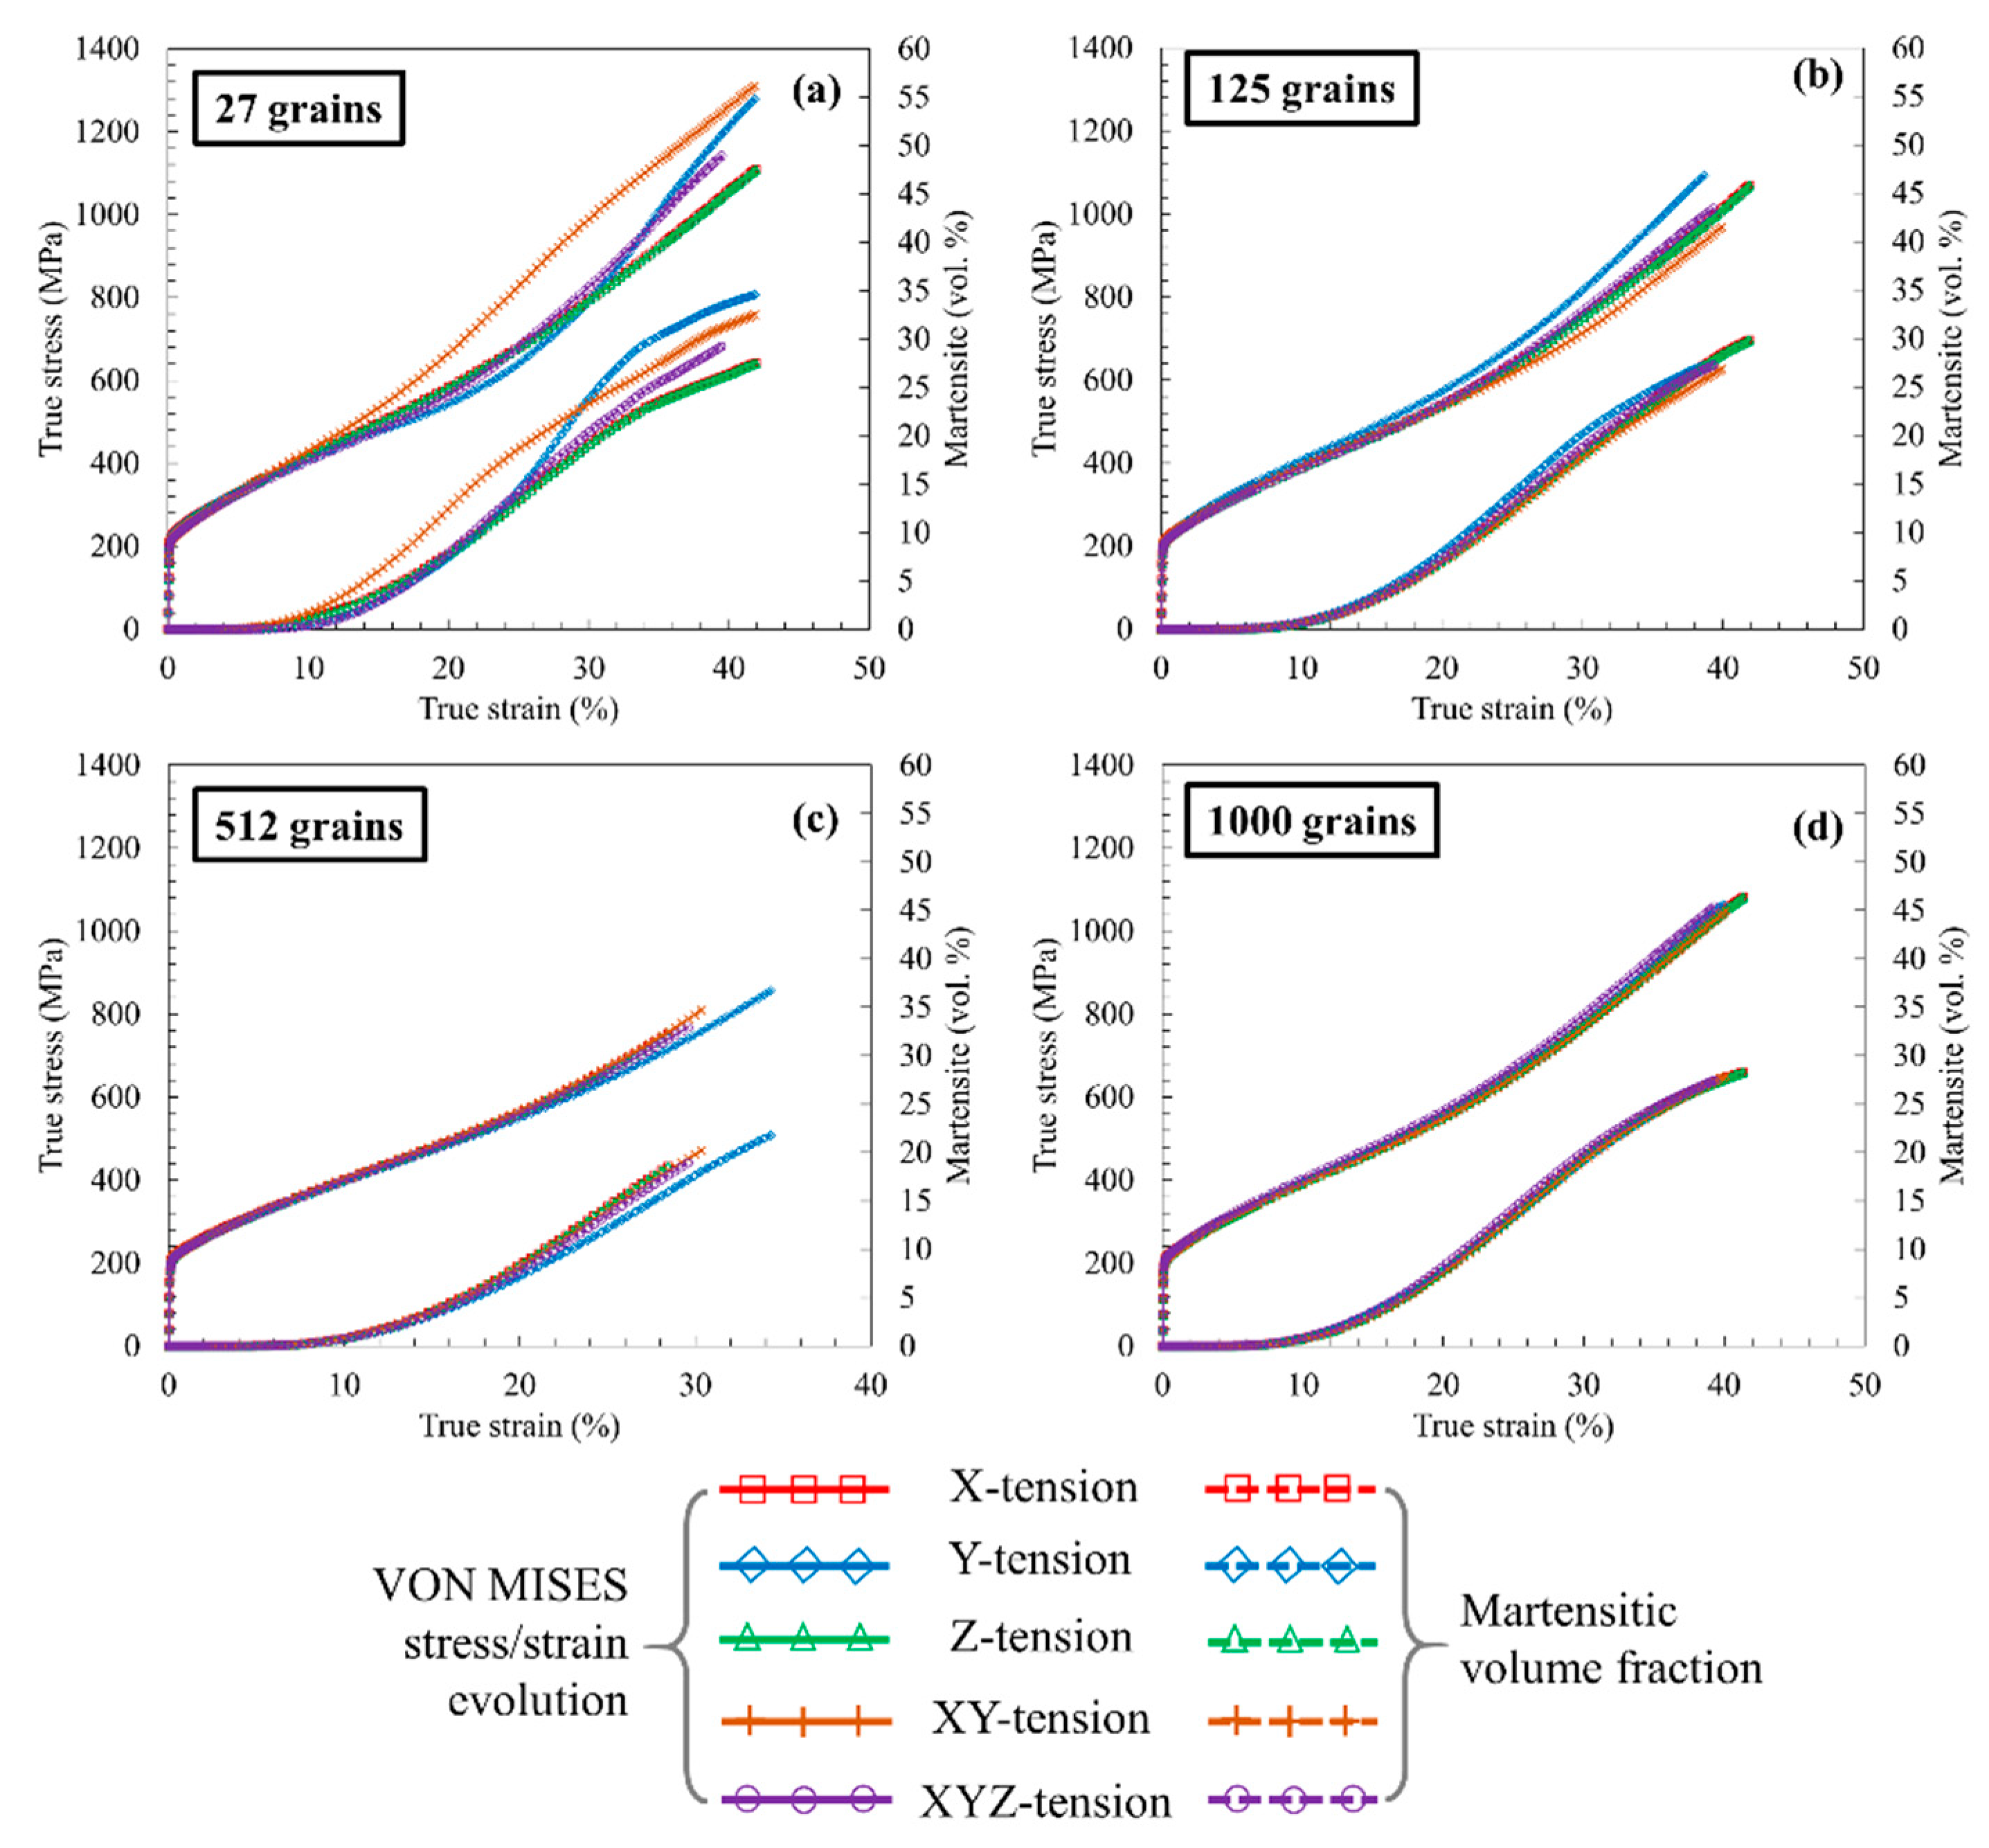
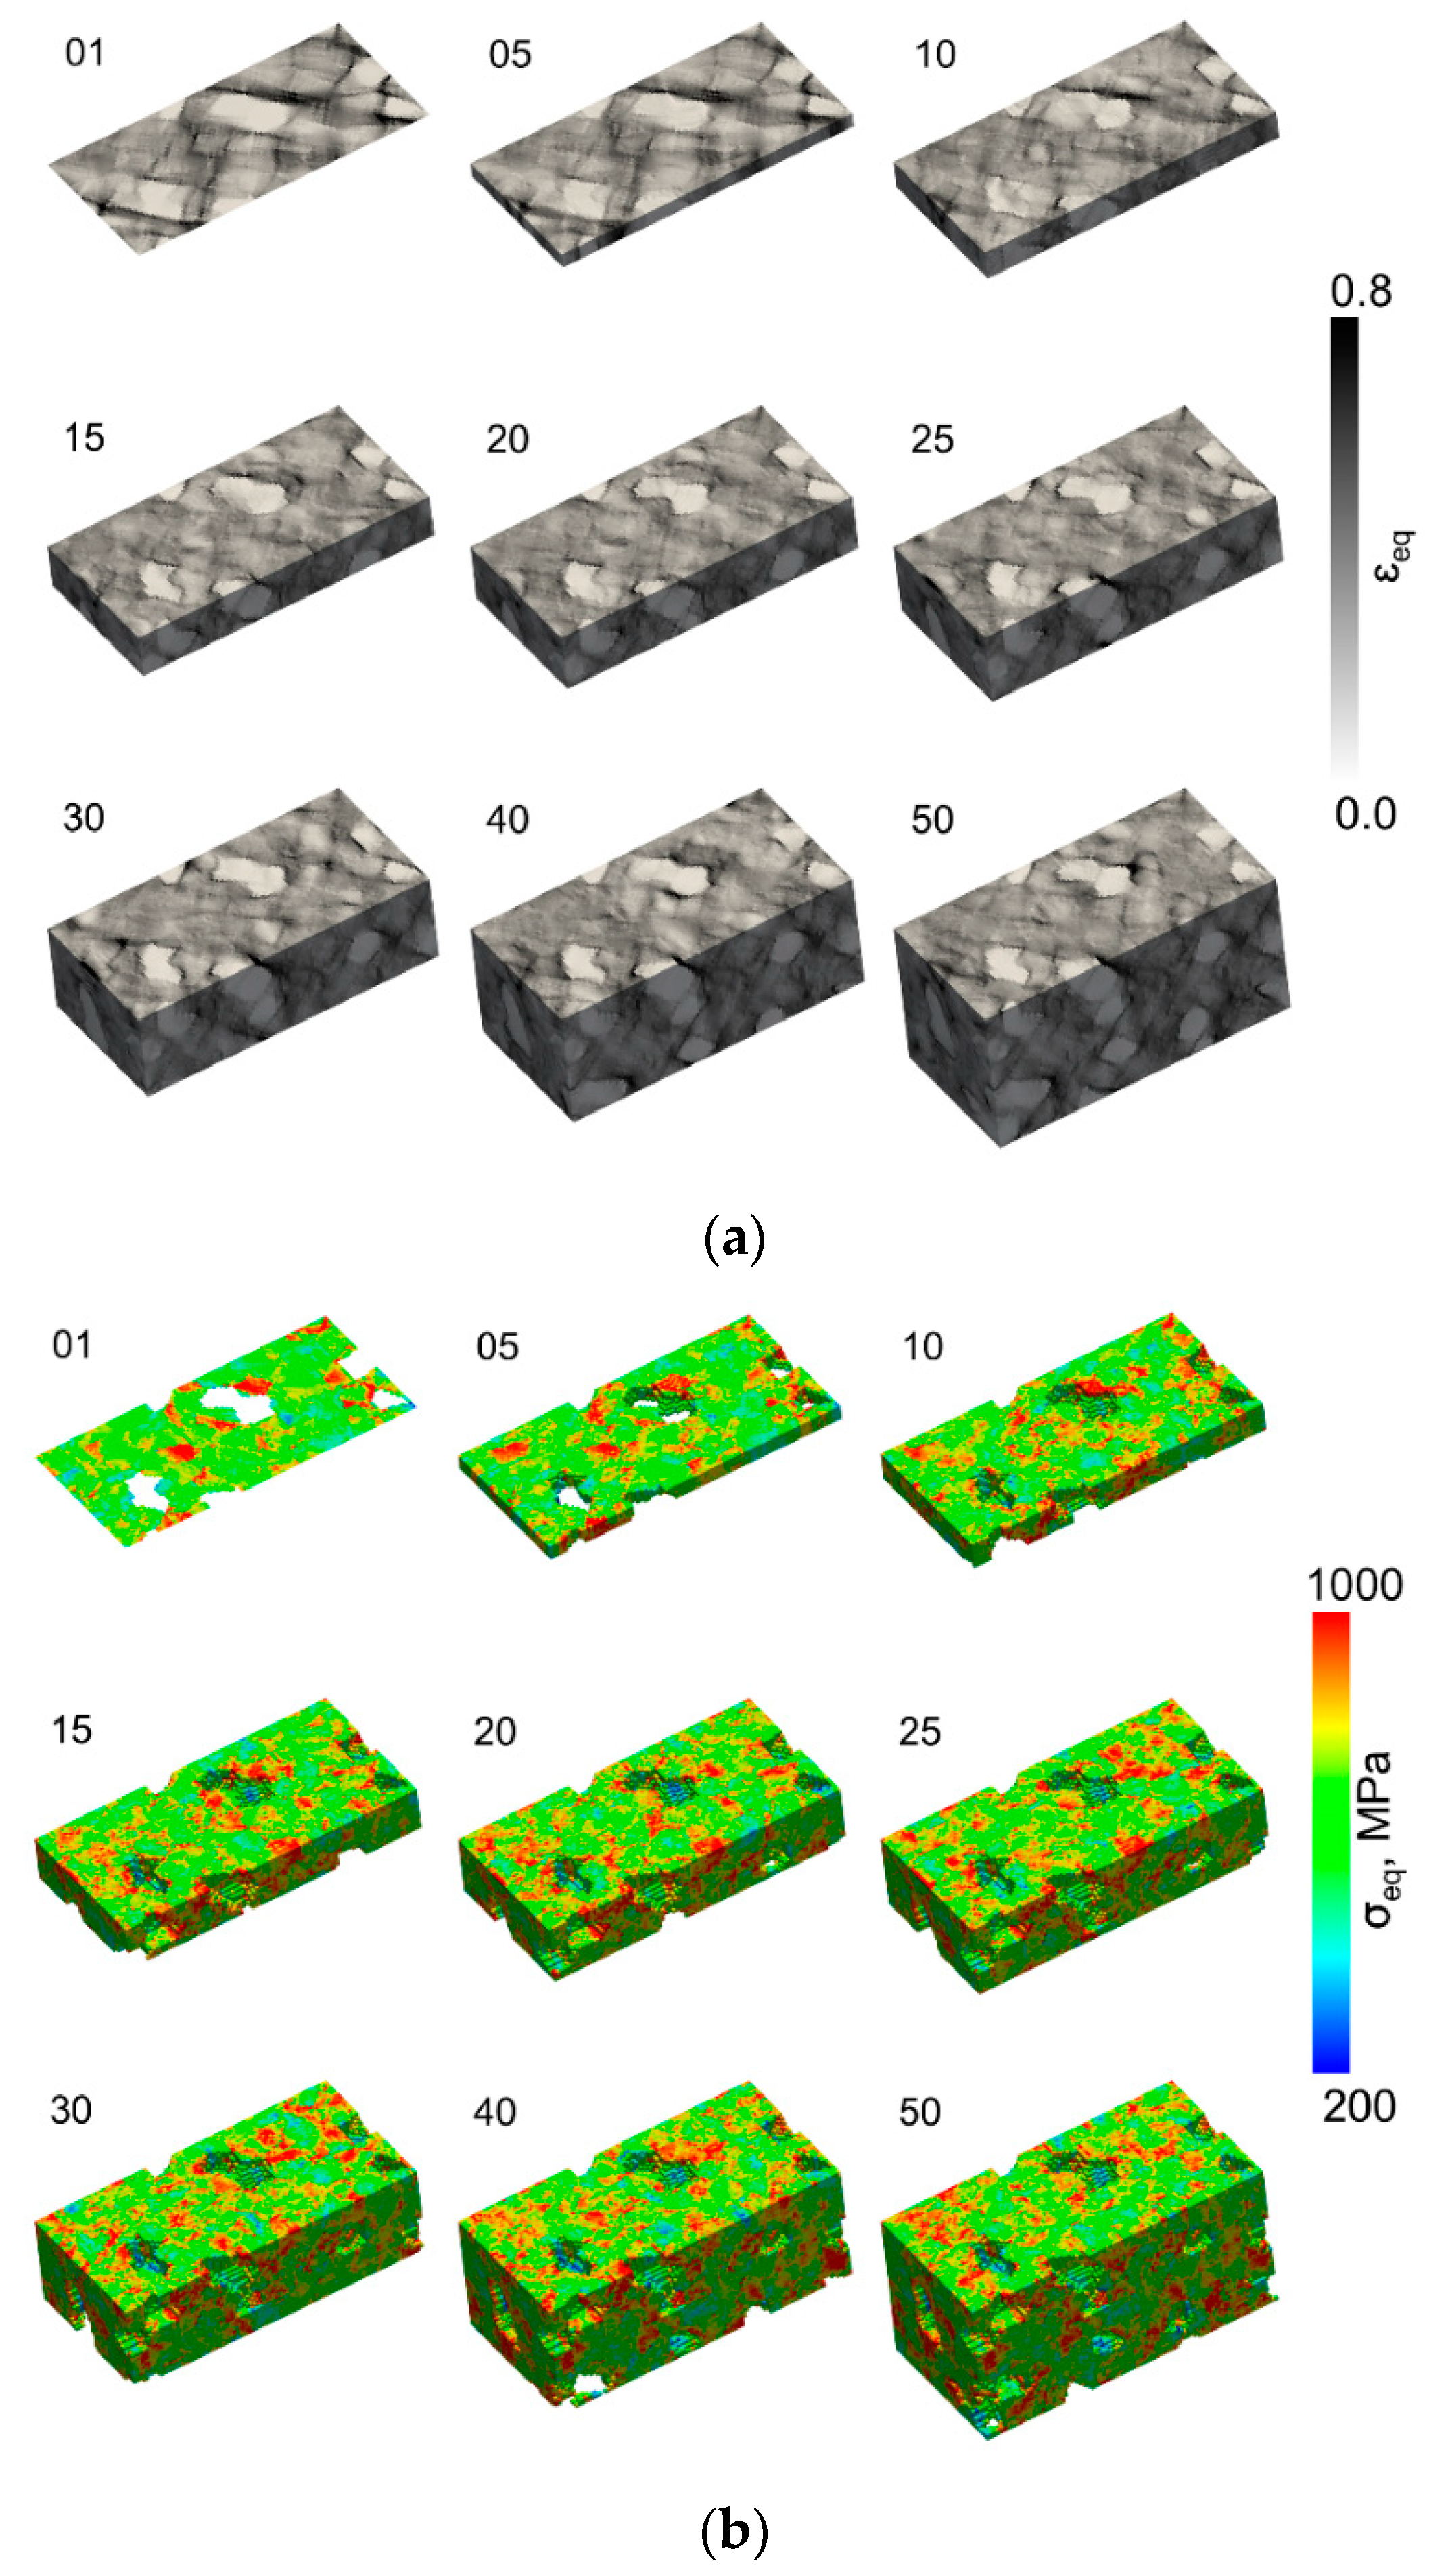
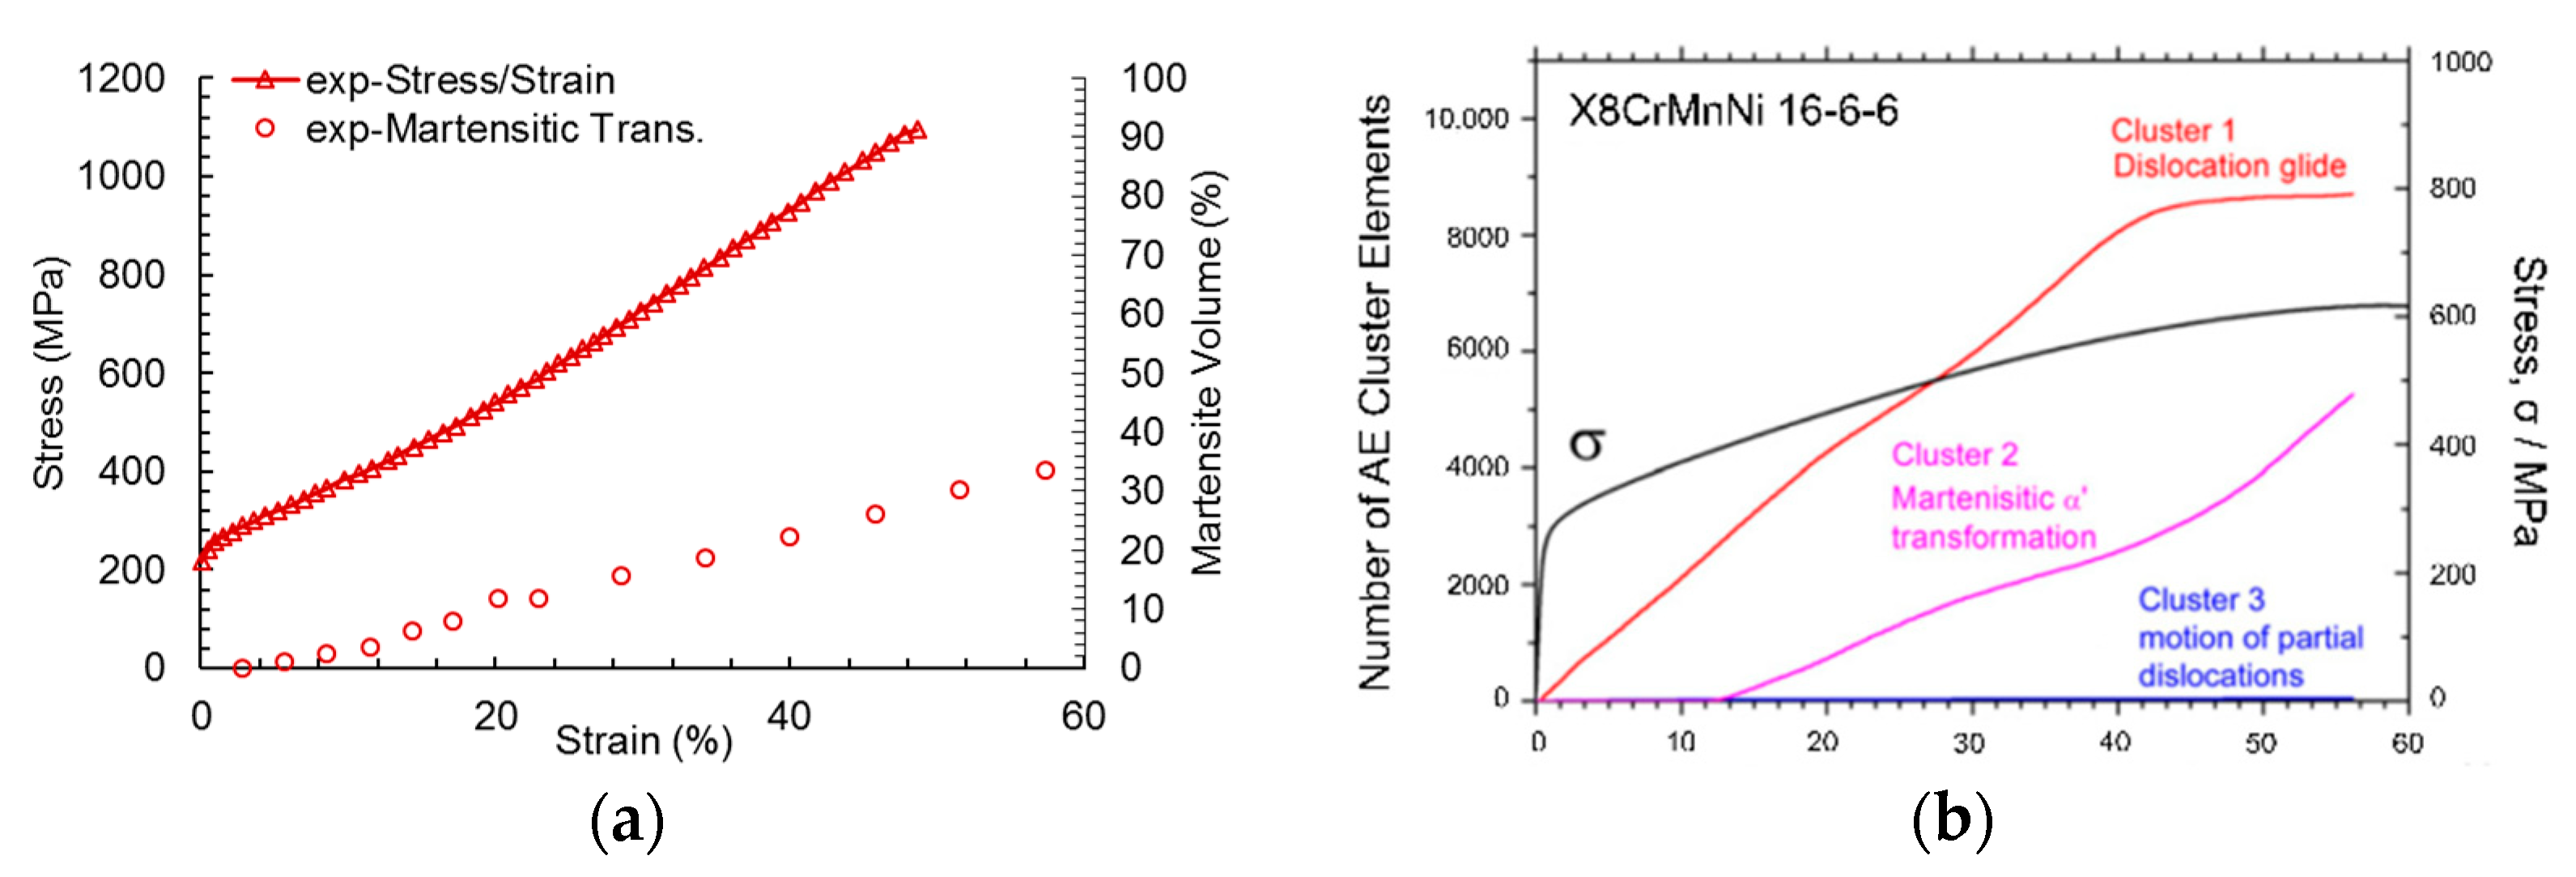
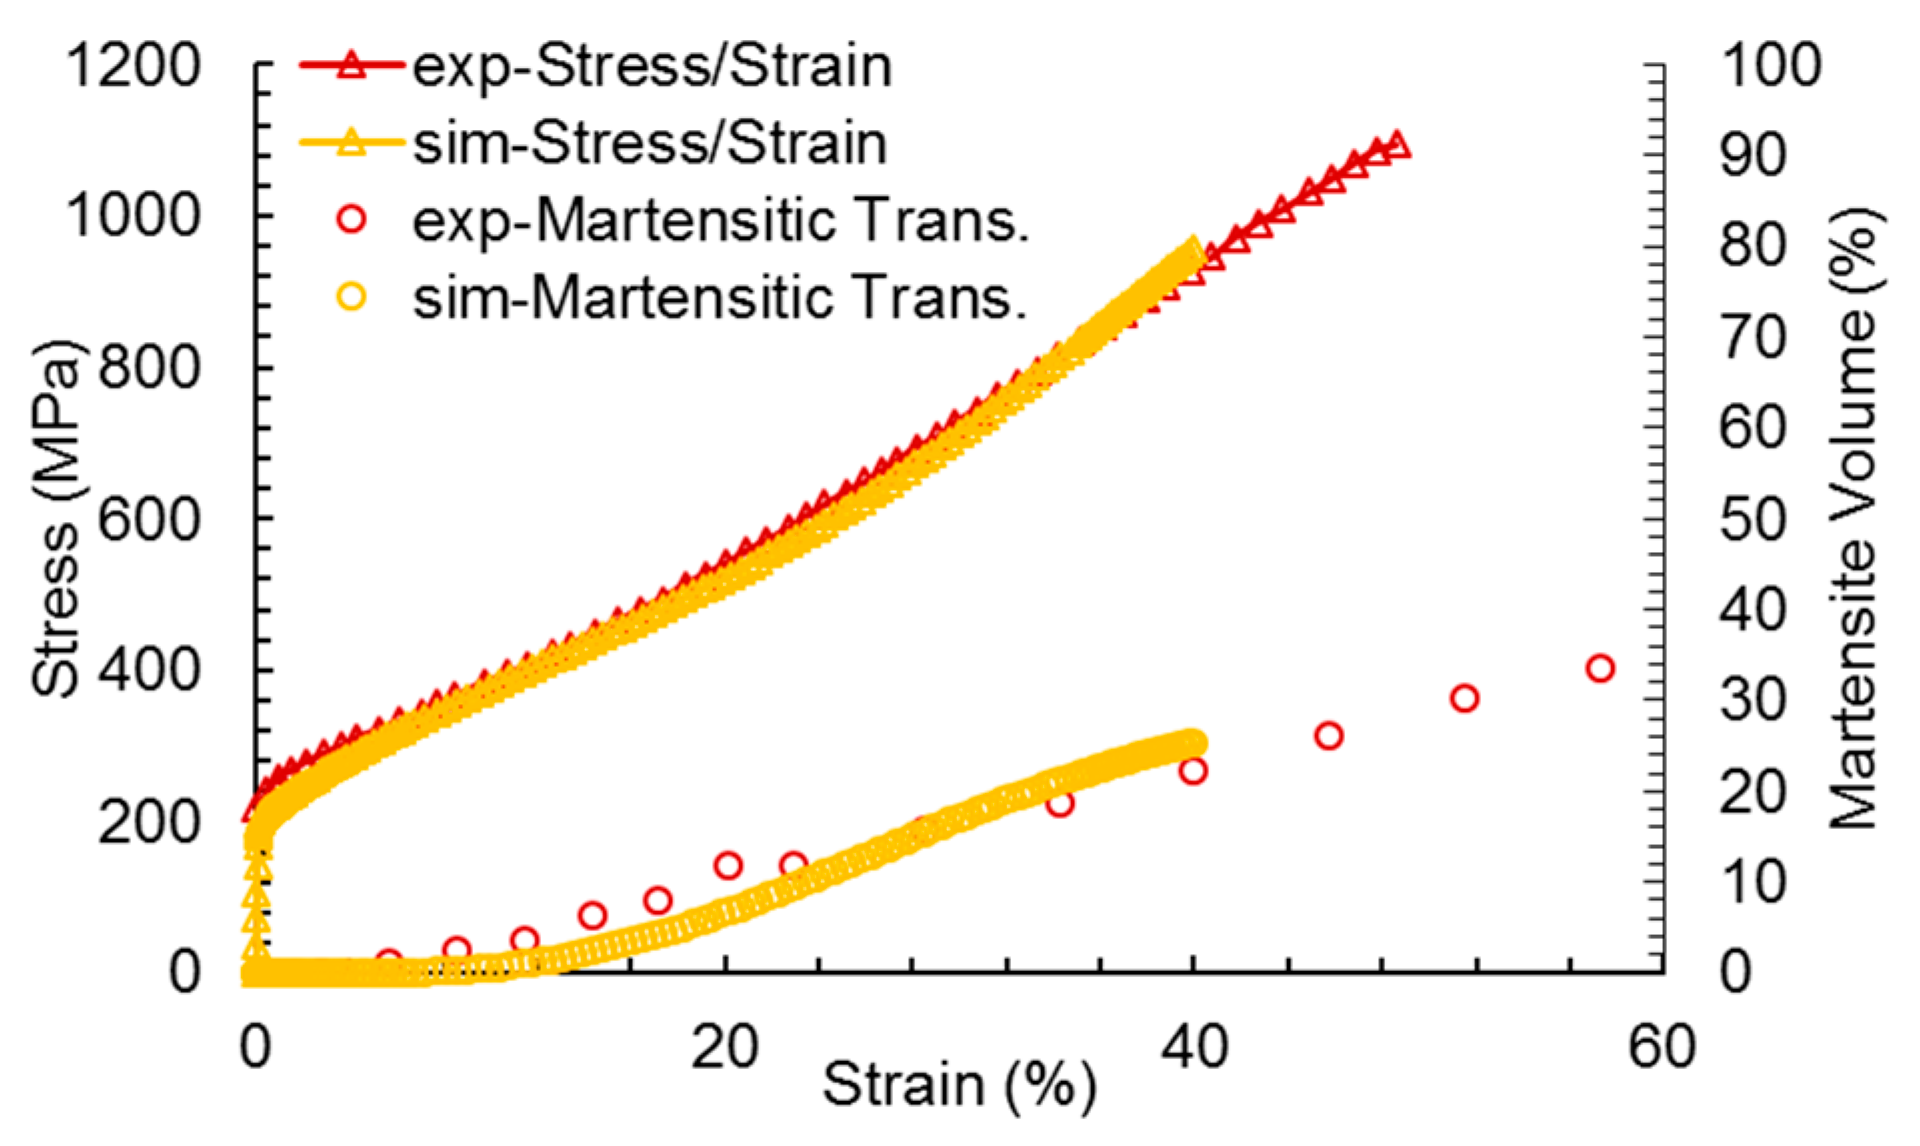
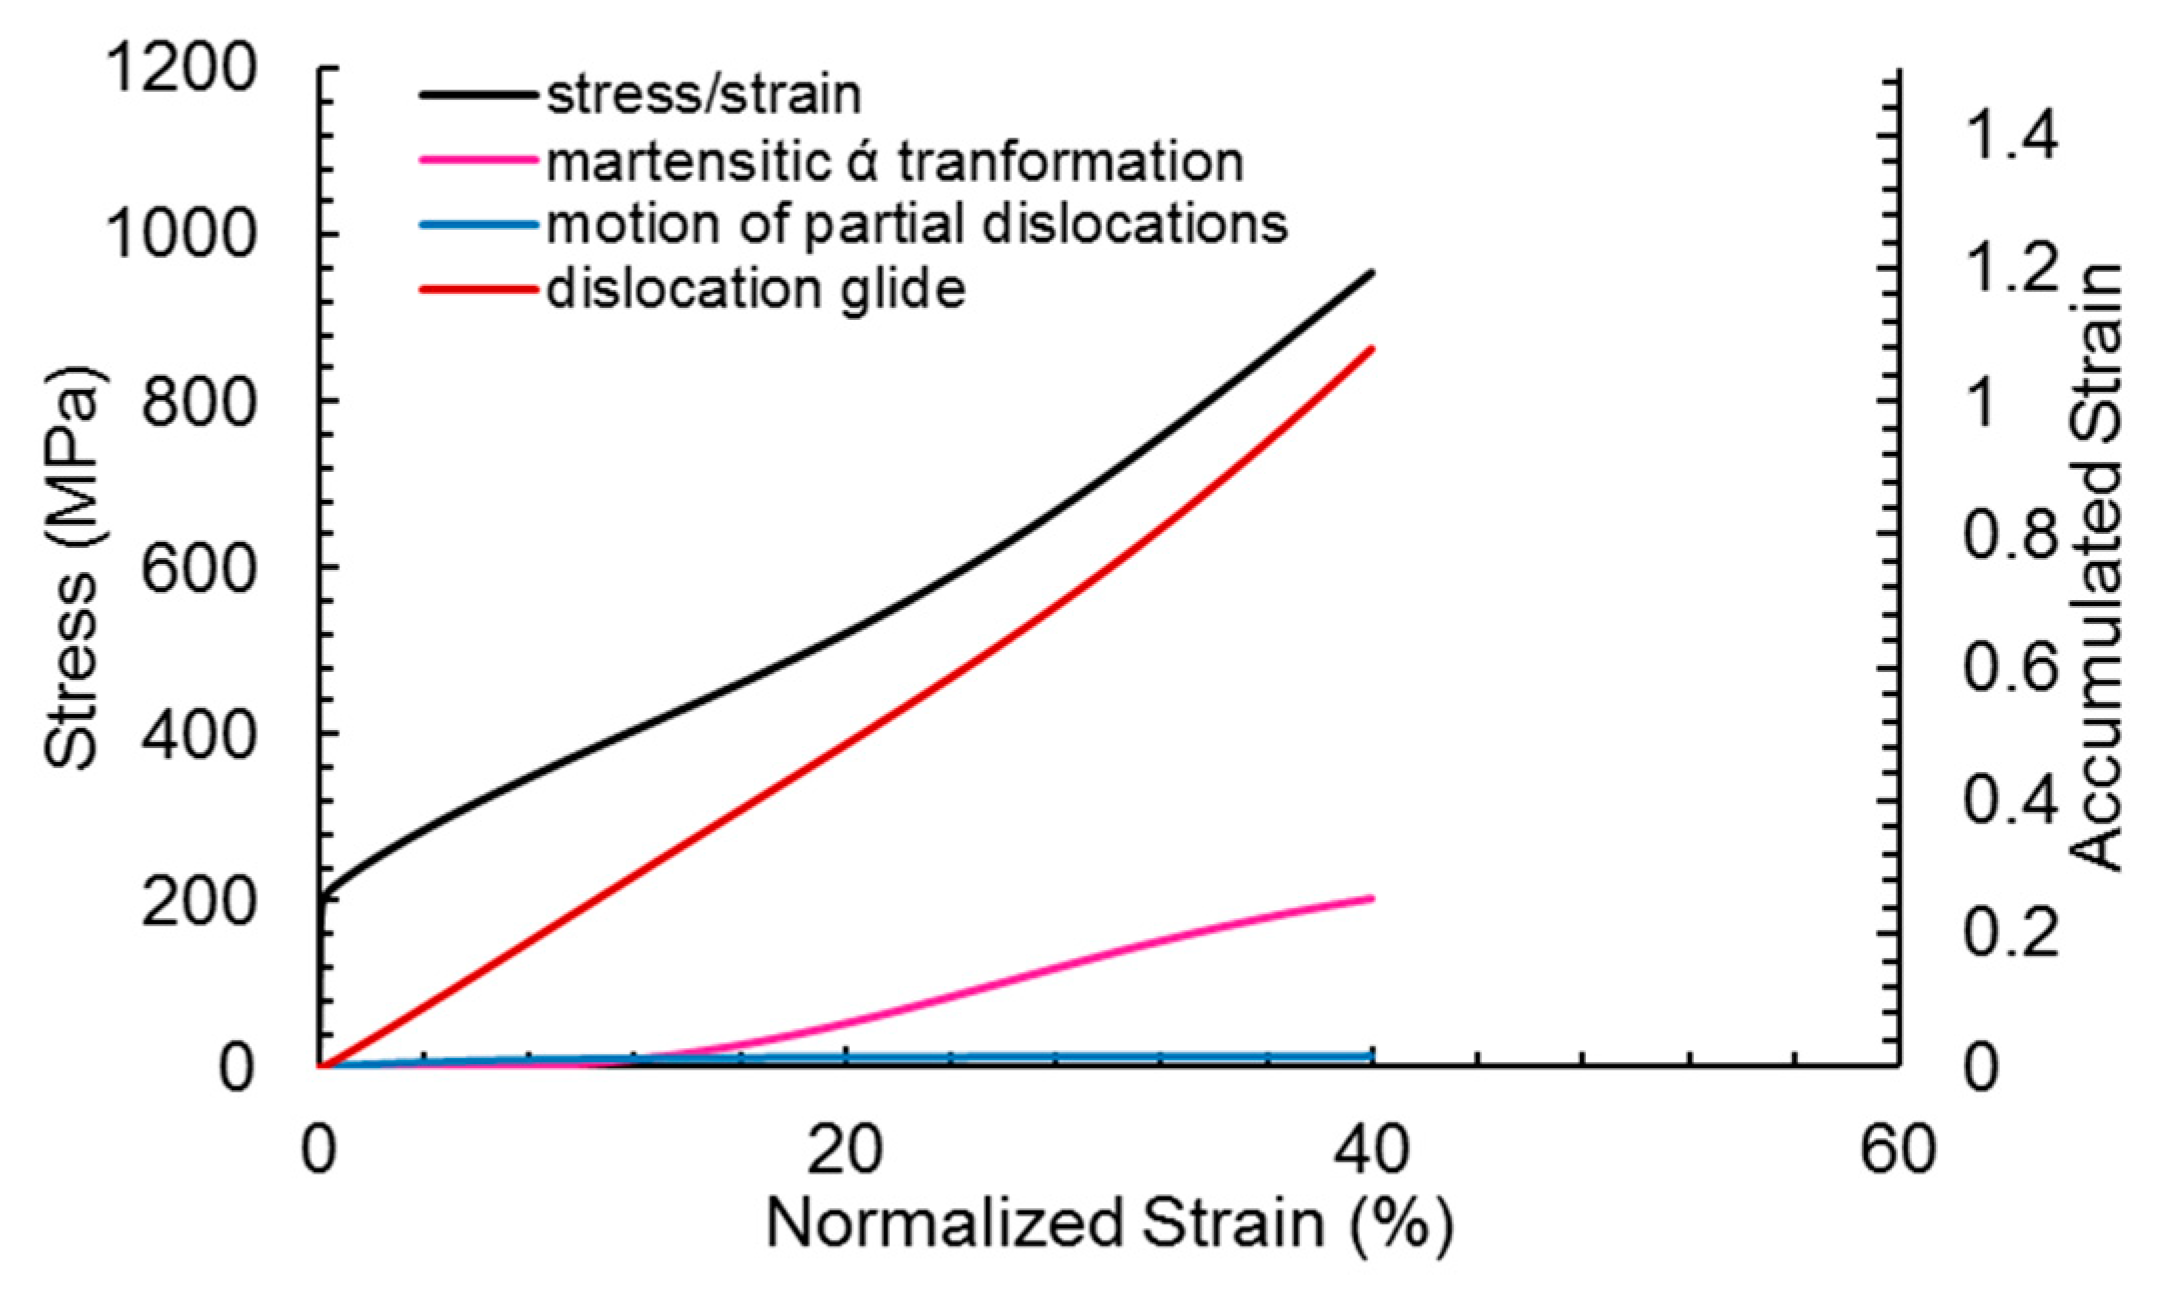
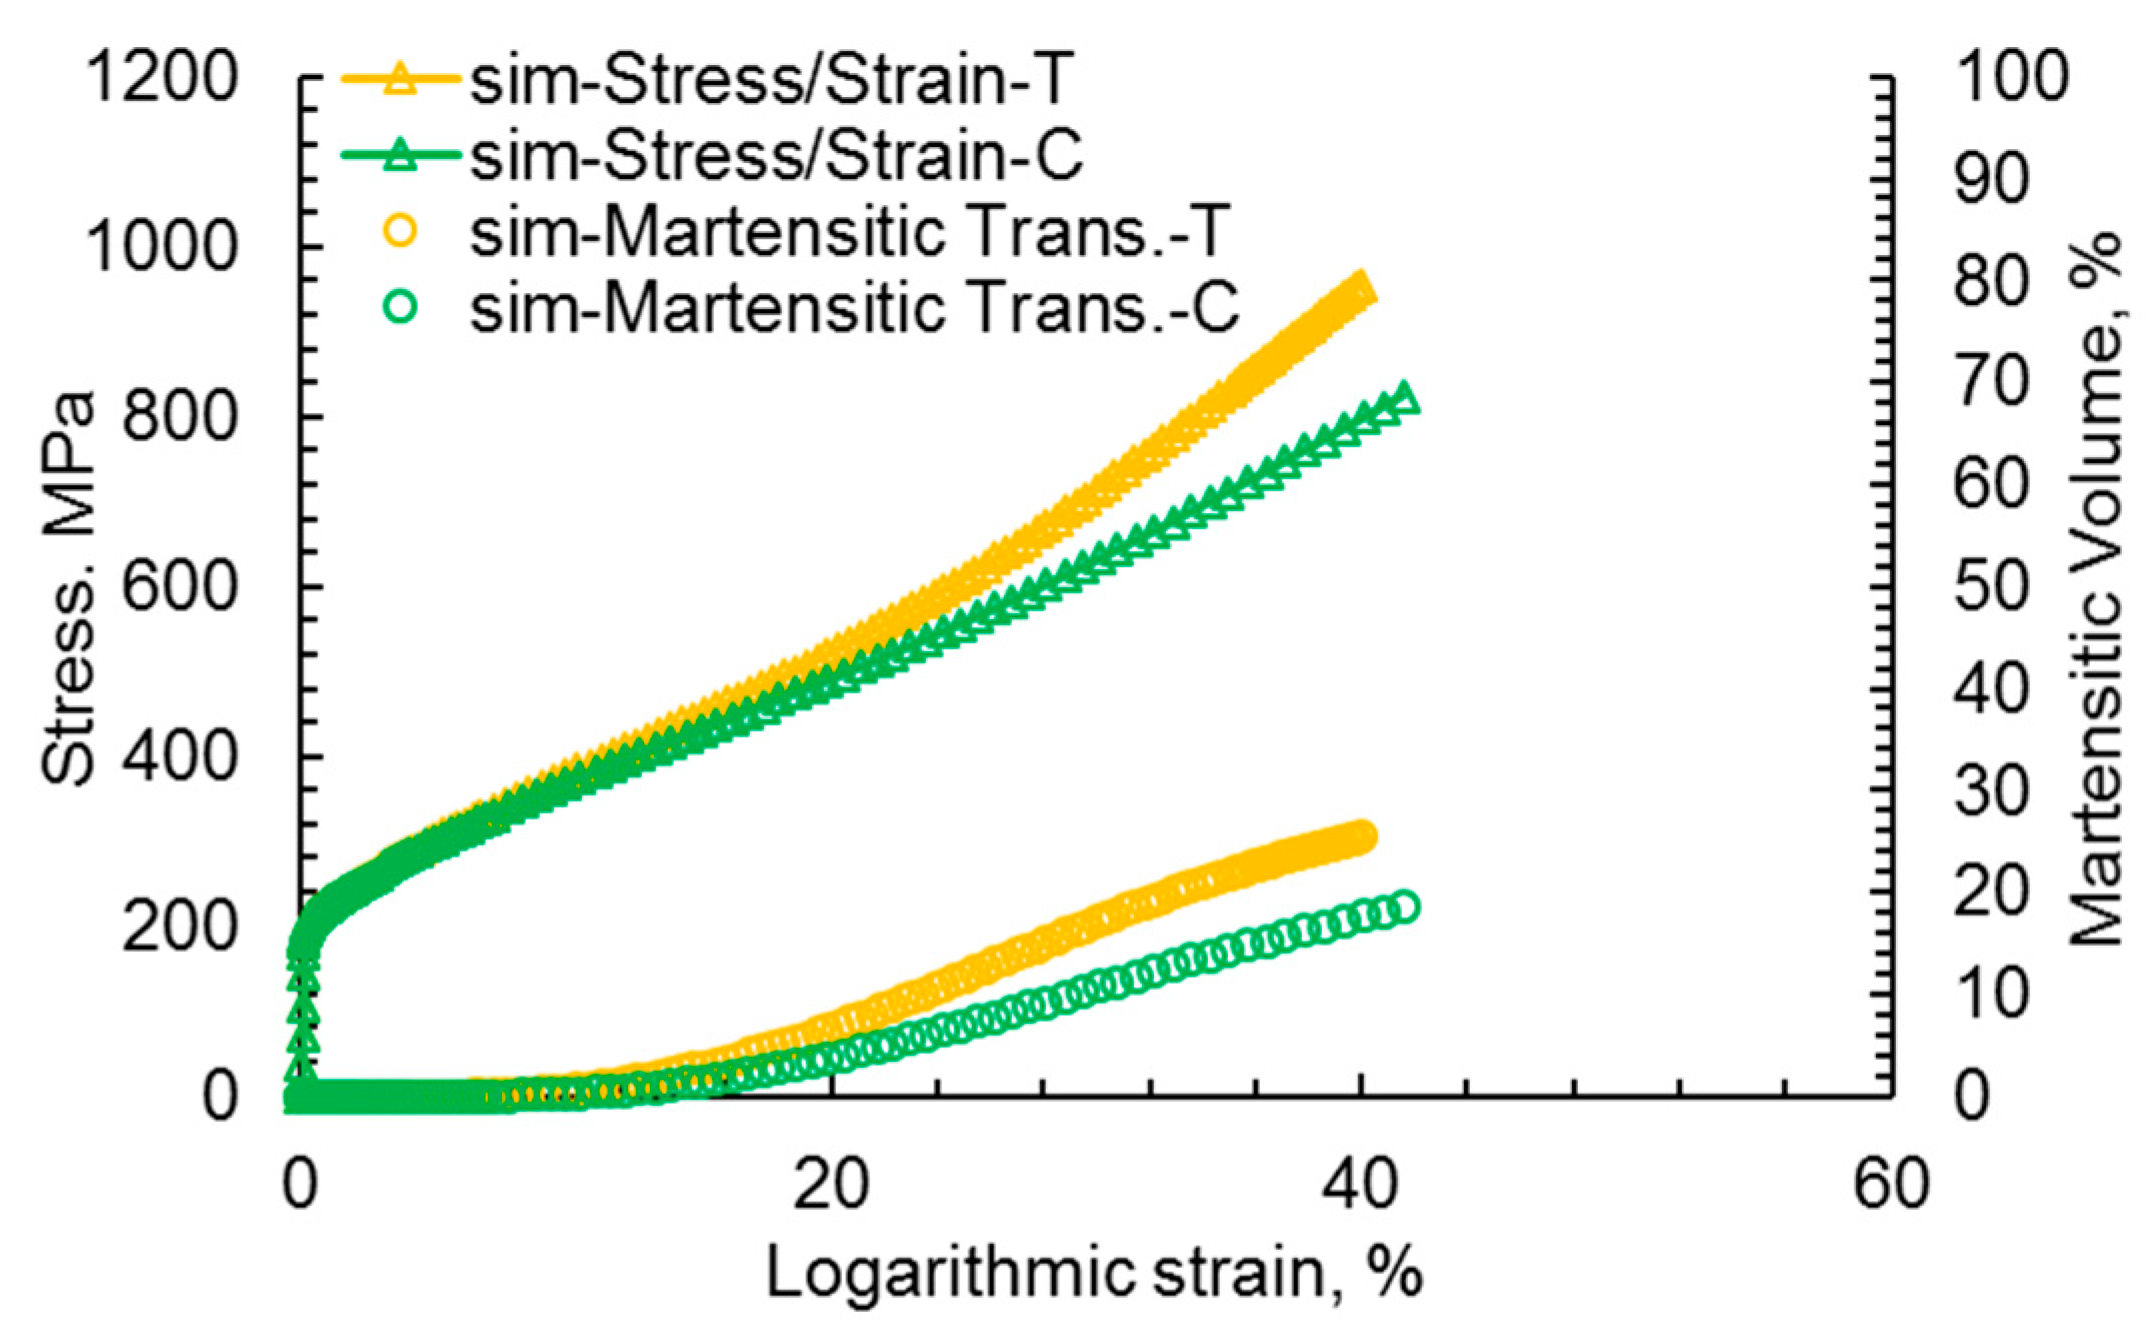


