Abstract
The anthropogenic pollution of lake ecosystems by human activities (e.g., mining industries) is recognized as a serious issue. The Osisko urban lake located in Rouyn-Noranda (Quebec, Canada) was used partially as a waste disposal facility for many decades, causing a heavy pollution. The main undertakings of this study are (i) assessing the mineralogical and geochemical properties of lake Osisko sediments, and (ii) studying the pollution that occurred within lake water due to the sediments’ reactivity. Water and sediments across the lake were collected in different sensitive locations. Within the sediment samples, two parts were distinguished: a small layer of black vase over grey sediments. The black vase resembled organic matter while the gray sediment seemed close to clean lake sediments. The collected samples were characterized for their physical (particle size distribution, specific gravity and specific surface area), chemical (minor and major elements as well as total sulfur and carbon) and mineralogical (X-ray diffraction and scanning electron microscope) properties. Additionally, the reactivity of sediments was studied using weathering cells to quantify chemical species leaching and their releasing rates. The results showed that the vase was the only contaminated part with high concentrations of sulfur and metals such as copper, zinc and iron. Geochemical data showed that the composite sample and the vase potentially cause contaminated acid drainage if they are exposed to atmospheric conditions. Indeed, the pH values of the leachates from both samples were between 4 and 6, while those corresponding to sediments remained around circumneutral values. Quantitatively, the contaminant release from the tested samples was variable. Indeed, the Fe cumulative concentrations were around 200, 80 and 20 mg/kg for the vase, composite and sediment samples, respectively. Similarly, the Zn cumulative concentrations were around 4500, 4200, and below the detection limit for vase, composite and sediment samples, respectively. The same tendency was observed for Cu, S, and Fe. Thus, sediments within Osisko lake present a risk for water contamination if they are resuspended or dredged out of the lake. Consequently, they should be stabilized before their disposal. The samples’ high Cu contents also offer the possibility of their reprocessing.
1. Introduction
Uncontrolled metal(oid)s inputs from various sources, such as industrial, mining, municipal sewage and agricultural activities, have contributed to the increased pollution in aquatic ecosystems [1,2,3,4,5,6]. The metal(oid)s are generally accumulated in the sediments, which become a source of water pollution. The lake system acts as a receiving body of the sediments transported by rivers or wastewaters [7]. The contaminants are spread in water by the resuspension and reactivity of sediments. Consequently, the chemical quality of lake water is altered and may present a serious risk for the lake ecosystems [8]. If the toxic levels are reached, metal(oid)s can affect benthic organisms and can affect human health via the food chain [4,9,10,11]. Accordingly, quantifying the environmental impact of lake sediments on the aquatic environment will help to design the best sediment management strategy to prevent the contamination of lake ecosystems. The environmental impact of sediments is greatly influenced by their chemical and mineralogical properties [12]. The reactivity of sediments is determined by the type of their forming minerals and their concentrations [13]. Additionally, the profiles of pore water and water sediment are often used to determine the contamination history of an aquatic system [14,15,16].
In this study, the sediments and the water of Osisko Lake, located in the city of Rouyn-Noranda (Abitibi-Temiscamingue, Quebec, Canada), were characterized for their chemical and mineralogical qualities. This lake was used as a deposit for many years [17]. The metals concentration measured in 1976 are ten times higher than those of an uncontaminated lake. The pollution being so high led to the disappearance of the aquatic fauna, and bathing was not recommended [18]. The lake is now mainly metal-contaminated through the sediments and vase. The metals can be released into the column due to a reworking of the contaminated sediments, which enhances the eutrophication phenomenon in the lake [19]. Sediments possess a biogeochemical reactivity responsible for the oxidation of organic matter and/or sulfides [20]. Oxidation reactions may be responsible for the direct and/or indirect dispersion of contaminants into the underlying soil and aquifers. Thus, sediments of Osisko Lake require an adequate management plan. One of the most used techniques for lake sediment management is dredging. The management of these sediments is of environmental and societal importance, and can also be an economic opportunity. Indeed, these sediments could contain valuable elements (e.g., Cu-bearing minerals) that can be efficiently recovered by flotation and/or gravity methods [21,22].
Sediment dredging is planned. It is thus necessary to consider a management scheme adapted to the collected sediments. Sediment management will depend on the level of toxicity in the sediments based on the soil protection and contaminated site remediation policy developed by the Canadian Department of the Environment and Climate Change (MEL), and their environmental behavior. If the sediments are not polluted, their disposal in open water is allowed. For slightly contaminated sediments, their discharge into open water can be done in low volumes. For the medium scale, it is necessary to study the environmental impact of sediment injection into open water. Finally, for significant amounts of sediments, land disposal is the most suitable. Heavily contaminated sediment must be land-disposed. The discharge into open water impacts the quality of the water, the quality of the receiving sediments and the fauna. The particles are suspended during rejection. Land disposal can cause contamination of the water system (groundwater runoff, wells and water intakes) and induces occupation of the territory. Compared to management in open water discharge, the disposal management costs can be two to five times higher for good quality sediments, and up to seven times higher for slightly contaminated sediments. The accurate characterization of sediments is therefore essential in order to determine the best management method.
The reactivity of the sediments due to the change in physicochemical conditions must be considered. When the sediments are dredged from the lake, the geochemical conditions are modified. The sediments are desaturated by evaporation and gravity flow. The sediments become exposed to oxidizing agents such as oxygen and water. The reduced phases such as pyrite can then undergo direct or indirect oxidation and thus result in the release of associated metals. The direct oxidation formula of pyrite is as follows in Equation (1) [23]:
2FeS2 + 7O2 + 2H2O → 2Fe2+ + 4SO42− + 4H+
Many intermediates are actually formed, including, for example, native sulfur (S0), sulfites (SO32−) or thiosalts, which are partially oxidized compounds that are metastable under aqueous conditions and conditions wherein acid generators are delayed. Taking into account the oxidation of Fe(II) to Fe(III) and the precipitation of Fe(III), the overall reaction of the direct oxidation of pyrite can be written as in Equation (2):
FeS2 + 15/4Fe3+ + 7/2H2O → Fe(OH)3 + 2H2SO4
The indirect oxidation of pyrite occurs when the pH is sufficiently low (pH < 3), whereat Fe (III) becomes the main electron acceptor of the reaction (Equation (3)):
FeS2 + 14Fe3+ + 8H2O → 15Fe2+ + 2SO42− + 16H+
Similarly, the acid generation is then accelerated. The oxidation of chalcopyrite is as follows (Equations (4) and (5)):
CuFeS2 + 4O2 → Cu2+ + 2SO42− + Fe2+
CuFeS2 + 16Fe3+ +8H2O → 17Fe2+ + Cu2+ + 2SO42− + 16H+
The acidity produced by sulfide oxidation can be neutralized if carbonates are present (behaving like pH buffers). The neutralization reaction can be written as follows in Equation (6):
MCO3 + H+ → M2+ + HCO3−
Organic compounds are soluble and mobile and their effects on the complexation of metal elements will promote the sorption of the metals during sediment dredging [24]. Soil organic matter forms complexes with metals by ion exchange, surface adsorption, or chelation [25]. However, the release of organic matter is influenced by pH variation. Metals bound to dissolved organic matter can be found in solutions [26].
This study was undertaken with the following objectives: (i) to determine the extent and levels of the contamination of the sediments of Lake Osisko by physical, chemical and mineralogical characterization; (ii) to perform a first evaluation of the quality of the water and sediments; (iii) to carry out leaching tests mimicking the exposure of dredged sediments to oxidizing agents in order to quantify the sediments’ reactivity.
2. Materials and Methods
2.1. Lake History
As early as 1927, the Horne mine discharged wastewater from the processing plant and mine waste storage. In 1949, the Quémont and Donalda mines also discharged part of their waste rock piles drainage into the northern part of the lake. Finally, the lake received wastewater from both cities. Osisko Lake was then divided into three parts by dikes in 1972. The northern part received the acidic waters of the mines, the east received the sewers of the city of Noranda and the south had to be recovered for recreational purposes. A previous study [27] showed that it is the surface of the sediments (the first 5 cm) that contains the highest concentrations of heavy metals. These first few centimeters of sediments correspond to a black vase of fine particle size without consistency. The chemical and mineralogical analysis showed a high content of metals of which 1% was copper, predominantly as chalcopyrite and bornite. The gray sediments appear naturally, and are of silt and gray type containing clay minerals. Their metal contents were also found to be high and could be attributed either to contamination during sampling, or a metal migration of vase to sediments through the top centimeters. In this lake, most of the trace elements showed high concentrations, which can potentially affect benthic organisms [27]. The concentrations of trace elements in the surface sediments (0–5 cm) would have changed very little since the 1970s. These concentrations would also be above the concentration of naturally occurring trace elements in the lake. These trace elements (with the exception of Zn and Se) seem, however, to be not very bioavailable.
2.2. Sampling and Samples Preparation
Sediment and water samples were collected during winter (water glaciation). Sampling locations (Figure 1) were chosen to consider different sectors of the lake. The sampling was then done across two perpendicular lines close to the shore of the peninsula and the nearby area of the city, and the hospital. The samples were collected using polyvinyl chloride (PVC) tubes of 5 cm diameter and 3 m height. After making a hole in the ice with an ice drill, the tube was driven into the sediment (Figure 2). One or more tubes can be added to reach the desired depth. A cap closes the top to create suction to keep the samples inside the tubes when removed. A blackish vase was observed at the interface of the water column and fine gray sediment. In this way, several types of samples were recovered: cores ranging from 40 to 60 cm with vase and sediment and with vase only. To retrieve only the vase, a bin/excavator was used to take only the very first few centimeters of surface sample. A sample of water from the column was also taken to compare the water in the column with the pore water. In total, 14 solid samples and a sample of lake water were collected. Moreover, pore water of the solid samples was also collected by filtration. The solid samples were collected in hermitically sealed bags and shipped to a laboratory where they were preserved in a cold room (4 °C).
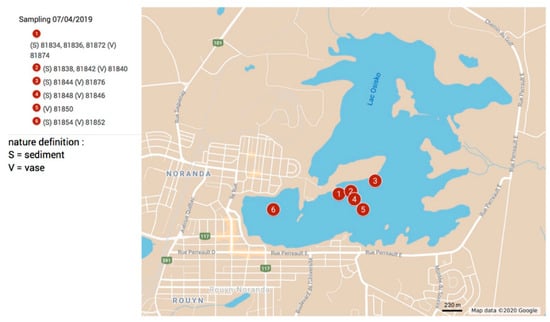
Figure 1.
Sampling localization, Lake Osisko, Rouyn-Noranda, Abitibi-Temiscamingue, Québec, Canada. A number was assigned to each sample, along with “S” for sediment and “V” for vase.
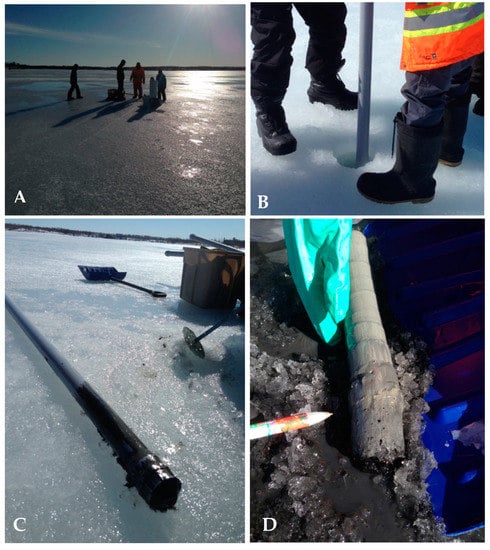
Figure 2.
Pictures illustrating sample collection during winter, (A) Osisko Lake frozen, (B) driving the polyvinyl chloride (PVC) tube into the hole made in the ice, (C) PVC tube once retrieved containing the sample core, and (D) core sample, with black vase on the first few cm.
2.3. Methods
2.3.1. Physical and Chemical Characterizations
The particle size distribution of the samples was analyzed using a Malvern Mastersizer S laser analyzer (0.05 to 880 µm). The specific surface area was measured by micrometrics implementing the Brunauer–Emmett–Teller (B.E.T) method [28] and the relative density was measured by a helium pycnometer (AccuPyc 1330, Rouyn-Noranda, QC, Canada).
The total sulfur and carbon were analyzed by an induction furnace (ELTRA CS-2000, Rouyn-Noranda, QC, Canada) with a detection limit of ±0.09 wt. %. The samples were pulverized to 74 µm and 130 mg was analyzed by the furnace. The blank samples within this analysis consisted of a sample containing tungsten and iron. The organic matter was analyzed by loss on ignition by heating the samples to 375 °C for 16 h [29]. The bulk chemical composition of the solid samples was determined by inductively coupled plasma atomic emission (ICP-AES, Perkin Elmer 3000 DV, Rouyn-Noranda, QC, Canada) after a total digestion of the solid samples using HNO3/Br2/Hf/HCl (HF and HCl added to dissolved silicate, and HNO3 and Br2 to oxidize the sulfur) at the URSTM (Rouyn-Noranda, QC, Canada). The ICP-AES is calibrated using SY-4 which is an international rock standard. Moreover, a duplicate was analyzed for each of the six samples [22]. Major elements contents (Al2O3, CaO, Cr2O3, K2O, MgO, MnO, Na2O, P2O5, Fe2O3, SiO2, TiO2 and LOI) were analyzed using X-ray fluorescence in the whole rock at SGS (Canada). The detection limit of X-ray fluorescence (XRF) analysis is 0.1 wt. %. The pH, conductivity and redox potential, as well as the alkalinity and the acidity and dissolved metals, are measured on the pore waters after filtration.
The acid generation potential (AP) is a measure of the total acidity that can be generated by a sample’s oxidation. It is determined for a sample of vase and a sample of sediment by the following calculation: AP (kgCaCO3/t) = 31.25 × %Ssulfide [30]. Sulfides are considered to behave like pyrite. The main sources of acid are the oxidation of sulfurous minerals (especially pyrite and pyrrhotite), the dissolution of acidic salts and the hydrolysis of metal (Fe, Al).
The neutralization potential (NP) is a measure of the amount of acid that can be consumed by a sample. It can be determined using chemical or mineralogical tests. The chemical tests consist of calculating the NP based on total carbonate (NP (kgCaCO3/t) = 83.3 × %Cinorg) and the mineralogical method [31] is based on the classification of minerals according to their neutralization capacity. The NP is then the sum of each mineral’s NP given by its proportion:
NP = (1000 kg/t ÷ 100%) × MCaCO3 × ∑i=1n(RiCi ÷ Mi)
With Ri being the relative reactivity of the mineral “i”, Ci its concentration (%), Mi its molar mass and MCaCO3 the molar mass of calcite.
The interpretation of these static tests uses the acid balance and consists of comparing the AP and the NP in two ways, as follows.
Net neutralization potential (NNP): NNP = neutralization potential (NP) − acid generation potential (AP)
- If NNP < −20 kg CaCO3/t to acidic drainage generator
- If NNP > 20 kg CaCO3/t to non-acid drainage generator
- Uncertain if NNP between −20 and + 20 kg CaCO3/t
NP/AP ratio (NPR): NPR = NP/AP
- If NPR < 1 to acid drainage generator
- If NPR > 3 to non-acid drainage generator
- Uncertain if NP/AP between 1 and 3
2.3.2. Mineralogical Characterization
The mineralogical composition of the sediments was determined by X-ray diffraction (XRD) using a Bruker AXS D8 Advance X-ray diffractometer equipped with an anticathode of Cu. The scans were performed over a diffraction angle (2θ) ranging between 5 and 70°. Crystallized mineral species were identified using Diffract Eva software (v.9.0 rel. 2003) and their quantification was performed by TOPAS software (v 2.2) implementing the Rietveld method [32]. Additionally, a scanning electron microscope (SEM, SDD X-Max 20 mm2) was used for the determination of minerals stoichiometries using energy-dispersive X-ray spectroscopy (EDS).
2.3.3. Environmental Leaching Tests
The leaching procedures were reproduced according to the methodology developed by Cruz et al. (2005) in order to promote the natural alteration of the sample. [33]. Weathering cells involves placing 67 g of dry sample on a Buchner polyethylene funnel with a filter at the bottom in order to retain the sample. Each sample is flushed with 100 mL of deionized water two times per week, in order to obtain enough leachate for the analysis. The sample is allowed to react with deionized water for 3 to 4 h under oxidizing condition and then the leachates are collected for further analysis. The pH, Eh and electrical conductivity (EC) were analyzed using pH/Eh/EC meters. The chemical composition of the leachates was analyzed by ICP-AES on filtered (0.45 um) and acidified (2% v/v HNO3) samples.
The leaching tests was performed on a lake sediment sample (number 81,872, sample point 1), a vase sample (number 81,850, sample point 5) and a composite sample (50% sediments:50% vase). These three tests allow us to evaluate the reactivity of those materials separately from each other and mixed. At the end of weathering the cells, the samples were dismantled and analyzed for their chemical composition and mineralogical properties. The mineralogical observations post-weathering allow the identification of the mineralogical changes that occurred during sample weathering (e.g., formation of secondary minerals, dissolution of primary minerals).
3. Results
3.1. Physical Characteristics
The results of particle size distribution, specific gravity (Gs) and specific surface area (SSA) are presented in Table 1 and Table S1. The particle size distribution of sediments belongs to the category of clays or silts according to the unified soil classification system (USCS classification [34]). Their D90, which corresponds to 90% passing over the cumulative particle size distribution curve, varied between 12.83 and 28.04 µm. Their particle size distributions are within the typical particle size of tailings from copper mines. The specific gravity of sediments varied between 2.49 and 2.64 g/cm3, while that of vase was around 2.42 g/cm3. The average specific surface area of sediments was 19.85 m2/g and the vase was characterized by higher SSA (27 m2/g) (Table 1). Specific surface area is inversely proportional to the grain size of soil. The high average value for the vase (27 m2/g), which is much higher than the values observed for sulfurous tailings (<2 m2/g), could be explained by the presence of organic matter.

Table 1.
Specific surface area, specific gravity and particle size distribution of studied samples (NA = not analyzed, SSA = specific surface area).
3.2. Chemical Characteristics of Pore Waters, Lake Water and Solid Samples
3.2.1. Pore Water and Lake Water
Results of the chemical compositions of sediments and vase pore waters, as well as lake water (sampled at point 5), are presented in Table 2 and Table S2. The liquid samples analyzed were mainly composed of Na, Ca, Mg and S. Na concentrations exceeded 19 mg/L, those of S varied between 1.98 and 42 mg/L, and those of Ca ranged between 11 and 36 mg/l. The sediments’ pore water showed near neutral pH values and low ion contents (electrical conductivity of drinking water). Leachate hardness did not exceed 120 mg CaCO3/L for all the samples except the one at 130 mg CaCO3/L (number 81,852, sample point 6). Pore water and lake water can thus be classified as soft to moderately hard, and the water from sample point 6 is classified as hard. In terms of metals such as Zn, Se, Pb and Cu, their concentrations did not exceed 1 mg/L. Sulfur was detected at variable concentrations within liquid samples. Its concentrations were higher than 7 mg/L for lake water and between 2 and 42 mg/L for the sediments and vase pore waters. The chemical quality of pore water and lake water suggest the low reactivity of sediments and vases in saturated conditions.

Table 2.
Results of chemical composition of lake water, sediments and vase pore waters (DL = detection limit, n/d = not defined).
3.2.2. Chemical Characteristics of Sediments and Vase
The total S and C analysis highlighted the presence of sulfide in the vase in addition to organic matter in considerable quantities (Table 3, Table S3). Loss on ignition confirmed the presence of organic matter in the vase samples, which presented an average of loss on ignition (LOI) of 24 wt. % against 7.8 wt. % for sediments (Table 3, Table S4). All the oxides analyzed are present in a greater quantity in the sediments, except for Fe2O3 and P2O5, which are respectively at 26.15 wt. % and 1.03 wt. % on average in the vases, compared to 6.62 wt. % and 0.18 wt. % on average in the sediments. The vases are therefore enriched in iron oxides. The presence of phosphorus oxide at remarkable quantities in the vases may come from the spillage of fertilizers in lake water. Table 3 and Table S5 present the ICP-AES result in mg/kg of metal(oid)s contents within solid samples. The solid samples are enriched in Al, Ca, Fe, Mg, K, Si, and Ti compared to the other elements. All the analyzed major elements’ concentrations were higher within sediments than in vase except Fe and S. However, trace elements such as As, Ba, Cd, Co, Mo, Ni, Pb and Zn were more enriched in the vase. This may be explained by the high capacity of the organic matter contained in the vase to absorb several metal(oid)s.

Table 3.
Inductively coupled plasma atomic emission (ICP-AES), total S and C, and X-ray fluorescence (XRF) results of sediments and vase samples (DL = detection limit, n/d = not defined and NA = not analyzed).
The heavy metal contents analyzed within the vase samples almost exceed the frequent effect concentration criteria (CFE) (Table 4), i.e., the concentration at which harmful effects are apprehended for the majority of benthic species. For the sediments, the As, Cr and Ni contents exceeded the CFE and the Cu contents exceeded the concentration producing a probable effect (CPE) criterion. The vase can be considered as a highly heavy metals-contaminated material, and the heavy metals contents have not decreased since the first analyses in 1976. In addition to the previous metals, the barium (Ba), cobalt (Co), molybdenum (Mo) and sulfur (S) contents within the vases were higher than the generic criteria for soils, given by the MEL (2019) [35]. These criteria for the contamination of excavated soil provide information on the management method to be undertaken. The limiting contents are given in the Table S6. The C and B contents within vases exceeded the criteria. Thus, if the vases are removed from the lake by dredging, they will require appropriate management.

Table 4.
Quality criteria for freshwater sediment (REC: rare effect concentration; TCE: threshold concentration producing an effect; COE: concentration of occasional effects; CPE: concentration producing a probable effect; CFE: concentration of frequent effects).
3.3. Mineralogical Characterization
The observation of the polished sections under an optical microscope enabled the rapid identification of the sulfurous minerals contained in the solid unreacted samples. Using optical microscope observations, the vase was determined to be characterized by the presence of large amounts of pyrite (FeS2), chalcopyrite (CuFeS2), iron oxides and traces of covellite (Figure 3). Chalcopyrite was present in circular form, which would indicate that the mineral has undergone a mineralurgical treatment. Pyrite was in the form of an angular fragment, but mainly in the form of framboïdal pyrite (Figure 3), composed of micro-cubes of pyrite, which is the most common form of pyrite in anoxic environments and also the most reactive one [36]. The sediments contained traces of sulfides such as pyrite and iron oxides.
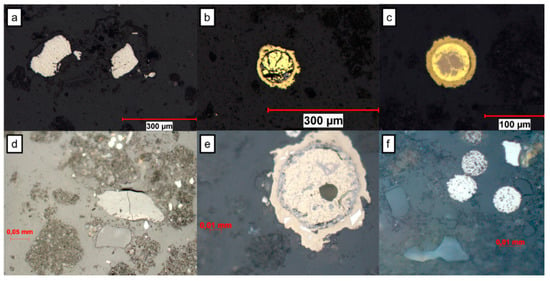
Figure 3.
Images of minerals observed by optical microscope in the polished section of sample vase number 81,850, (a) pyrite, (b,c,e) chalcopyrite with exsolution texture, (d) silicates, and (f) framboidale pyrite and silicate.
Quantitatively, in the sediments, the main occurring minerals were quartz (14–28 wt. %), epidote (3–7 wt. %), albite (19–30 wt. %), augite (2–5 wt. %), hornblende (4–8 wt. %), chlorite (9–14 wt. %) and traces of hematite (Figure 3 and Figure S1). Carbonate minerals, which are responsible for acidity buffering, were below the detection limit of XRD. Additionally, the mineralogical composition of the vases was similar to that of the sediments. The vases were mainly composed of silicates (quartz: 9–26 wt. %; epidote: 7 wt. %), feldspars (albite: 5–21 wt. %) and pyroxene (augite, enstatite), micas (chlorite) and oxides, such as hematite and traces of sulfides (arsenopyrite). Scanning electron microscope (SEM) observations of the rounded grains of sulfide (Figure 4 and Figure 5) allowed their identifications as isochalcopyrite, a mineral close to isocuprite, formed at more than 200 °C. Three phases can be distinguished (Figure 5): a rounded phase surrounded by a halo of iron oxide, which is also surrounded by an exsolution phase of the same nature as the grain. The iron oxides and the exsolution texture highlighted by the X-mapping may result from the first alteration of the mineral. Iron oxides are also visible in some places of the grain, mainly on the inner periphery, a sign of oxidation.
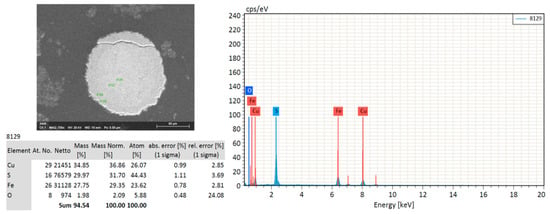
Figure 4.
Image observed at the SEM, energy-dispersive X-ray spectroscopy (EDS) spectrum and quantification of an isochalcopyrite from vase sample number 81,850.
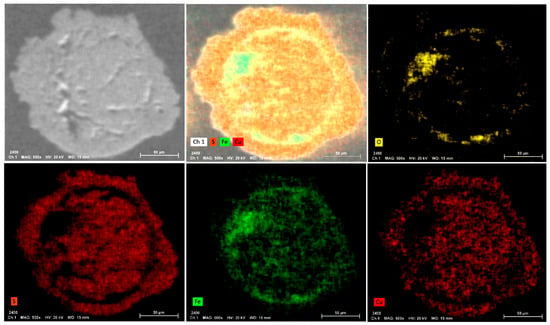
Figure 5.
Elemental SEM mapping of oxygen (O), sulfur (S), iron (Fe), and copper (Cu) in an isochalcopyrite grain from vase sample number 81,850.
The observation of a larger area on the polished section allowed us to highlight that copper and zinc are not only contained in sulfurous minerals, but they are also associated with the vases (on organic matter). Zinc is not always concentrated in the places where copper is. Their large dispersion suggests that they are attached to the small grain size, and thus readily available for oxidation.
3.4. Environmental Behavior of Sediments, Vase and a Composite Sample
3.4.1. Acidity and Neutralization Potentials
Results of the neutralization potential (NP) and acid generation potential (AP) calculations based on Ssulfide and total inorganic carbon are shown in Table 5. The AP of the sediments and vase was 1.25 and 116.56 kg CaCO3/t. The neutralization potential of the sediments was higher than that of the vase for the two methods presented before. Via the first method using the values of inorganic carbon, the NP value for the sediment was 19.44 kg CaCO3/t, compared to 13.29 kg CaCO3/t for the vase. Via the second method (mineralogical approach), the NP values for sediment and vase were 203.88 and 53.64 Kg CaCO3/t, respectively. For the vase, the net neutralization potential (NNP) calculated by the two methods was below −20 kg CaCO3/t, and the NPR was below 1 (Table 5). The two methods allow us to conclude that the vase will behave as an acid drainage generator material. For the sediment, the NNP calculated via the second method was higher than 20 kg CaCO3/t, implying that the sediment is a non-acid drainage generator, but the NNP calculated by the first method was between −20 and 20 kg CaCO3/t, implying an uncertain geochemical behavior. However, the NPR calculated by the two methods was higher than 3 (Table 5), allowing us to conclude that the sediments are non-acid generating.

Table 5.
Stotal, Ssulfide, Ssulfate, Ctotal, Cinorganic, and Corganic of vase sample number 81,850 and sediment sample number 81,872. AP, PN, NNP and NPR calculated by the 2 methods (NP by Cinorganic, and NP by Lawrence method).
3.4.2. Weathering Cells Results
The results of the geochemical behavior of the studied samples are presented in Figure 6 and Figure 7. The pH of the leachates from the sediment was circumneutral and varied between 7 and 8.3 (Figure 6A). These circumneutral pH values can be attributed to the low amounts of acid-producing minerals, such as pyrite and chalcopyrite, compared to the acid-consuming minerals contents, such as of carbonates. The electrical conductivities of the leachates from the sediment are relatively low, but tend to decrease slowly (3690 µS/cm at the beginning of the tests and 90.6 µS/cm at 70 days (Figure 6B)). The high values of electrical conductivity analyzed at the beginning of the process of weathering the cells can be attributed to the pre-oxidized and exchangeable elements.
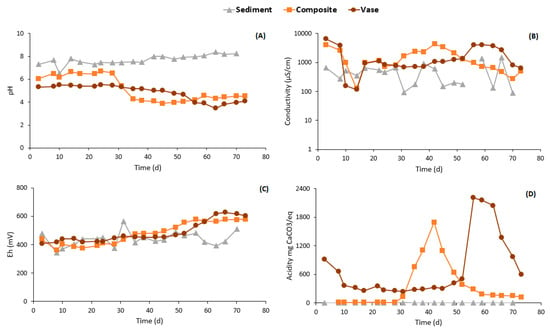
Figure 6.
pH (A), conductivity (B), Eh (C) and acidity (D) evolution within the leachates.
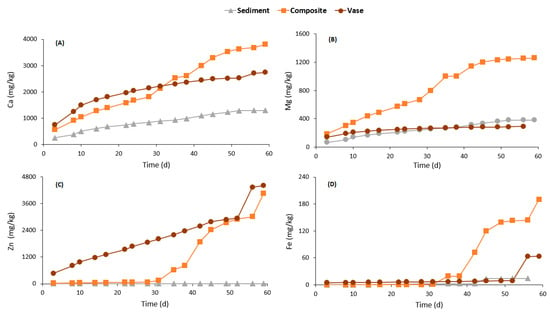
Figure 7.
Cumulative mass normalized curves of calcium (A), magnesium (B), zinc (C) and iron (D).
The pH of the vase leachate has gradually decreased; it initially remained close to the pH of the deionized water, then gradually decreased until a minimum of 3.48 was reached (Figure 6A). This decrease in pH suggests a release of metals and/or sulfide oxidation reactions. Similarly, the electrical conductivity fluctuated significantly; it started at 6500 µS/cm at 3 days, then reached 703 µS/cm after 30 days, then rose to 4040 µS/cm at 55 days when the pH decreased to attain acidic values (pH = 4) (Figure 6B). These electrical conductivity fluctuations are linked to pH variations; when the pH decreases, it causes a greater release of ions, thus increasing the conductivity of the leachate. Concerning the composite sample, the pH was around 6.5 for about 30 days and then decreased to attain acidic values ranging between 3.89 and 4.5 (Figure 6A). The electrical conductivity showed a similar trend in the sediment and vase samples (Figure 6B). The Eh values for the three studied samples ranged between 350 and 600 mV (Figure 6C).
The visible peaks in acidity (Figure 6D) can be related to variations in pH; the pH of the composite decreased at 30 days to reach a minimum of 3.89 at 42 days, and the acidity measured reached its maximum of 1697 mgCaCO3/eq at the same time. In the same way, for the vase, the pH gradually decreased to reach a minimum at 62 days, while its acidity reached its highest value. These fluctuations are also supported by the concentrations of Fe, Mg and Al obtained in the leachate (Figure 7).
The chemical quality of the leachates from the three studied samples is presented in Figure 7 and Figure 8. The concentrations are presented as cumulated mass normalized. Ca and Mg were chosen to represent acid-consuming minerals dissolution (carbonate dissolution), Fe and S indicate acid-producing minerals oxidation (sulfide oxidation), Al indicates aluminosilicate minerals dissolution and Zn and Cu were chosen as examples of metal-contamination. The composite sample was the most reactive one compared to the vase and sediments. Almost all the analyzed elements were released at greater quantities by the composite sample, except for Zn. The Ca normalized mass was about 1295, 2740 and 3808 mg/kg for the sediment, vase and composite samples, respectively. The Mg release rates were higher than 1200 mg/kg for the composite sample and lower than 400 mg/kg for the other samples. Zn was released at negligible concentrations by the sediments, while it was released at concentrations higher than 4000 mg/kg by the vase and composite samples. Similarly, the Fe release was about 14.5, 63.7 and 190.3 mg/kg for sediment, vase and composite samples, respectively. Additionally, Al, S and Cu were released at high concentrations by the composite sample. The rates of Al, S and Cu release by composite samples were around 68, 11,000 and 721 mg/kg, respectively.
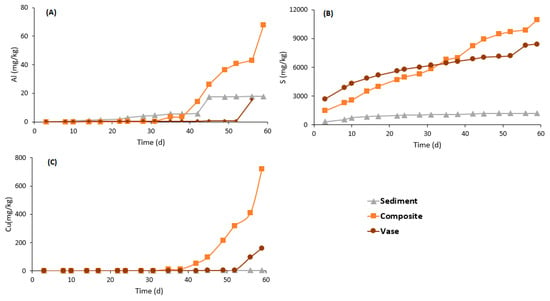
Figure 8.
Cumulative normalized curves of aluminum (A), sulfur (B) and copper (C).
3.4.3. Dismantling
At the end of the weathering tests, the resulting solid samples were analyzed chemically and mineralogically. The initially brown-colored vase turned orange, which is evidence of sulfide oxidation and the precipitation of secondary iron oxides. The composite sample showed a slightly orange color in the first centimeter, but remained overall brown–gray. However, the sediment did not show any new coloration. The results of the total sulfur and carbon and organic and inorganic carbon analyses of the three samples before and after the weathering of the cells are available in Table S7. The quantity of organic carbon clearly decreased within the studied samples, in particular in the vase. This is explained by the oxidation of organic matter. The sulfur content also halved, which corroborates the results obtained by the ICP examination of leachate (Figure 7). The observation of the polished sections via optical microscope showed that the grains from the composite and the vase samples were characterized by the formation of a coating by the secondary phases (e.g., Cu and Fe oxides) (Figure 9).
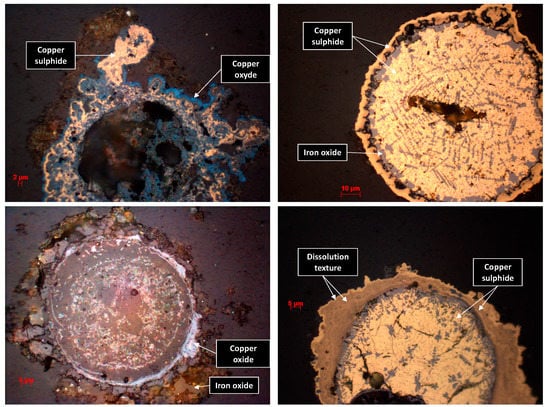
Figure 9.
Images of minerals from the polished section of the vase and composite sample at the end of the weathering test, observed with an optical microscope.
4. Discussion
4.1. Geochemical Quality of Sediments and Lake Water
The lake water, sediments and vase pore waters showed a chemical quality that was relatively similar. The pore water and lake water can be classified as soft to moderately hard, and the water from sample point 6 is classified as hard. The metal(oid)s concentrations were almost negligible (Table 2), with Zn, Se, Pb and Cu concentrations not exceeding 1 mg/L. This can be explained by the low reactivity of the acid-forming minerals in saturated conditions [37]. However, the lake water quality may be altered if the sediments and the vase are resuspended, due to wind energy impacting swells or passing boats [38]. The lake depth varies from 4 to 7 m in the sampled areas, but averages 2–3 m on the shores of the lake, especially near the town. The vase rich in organic carbon and sulfides is also enriched in trace elements such as As, Ba, Cd, Co, Mo, Ni, Pb and Zn. The sulfurous minerals are mainly pyrites and (iso)chalcopyrites. Consequently, this vase is considered as a highly heavy metals-contaminated material.
Consequently, dredging the lake sediments and vase will remove the risk of water contamination. Submitting sediment, vase and composite samples to alteration in weathering cells simulates their natural weathering processes under atmospheric conditions after their dredging. The sediment samples showed mineralogical compositions characterized by low acid-forming minerals (e.g., sulfides). Sulfides were detected at negligible contents and confirmed using a sulfur sulfide calculation based on the total sulfur and sulfates. The acid generation potential of the sediments did not exceed 2 kg CaCO3/t. The low sulfide content justifies the circumneutral pH values that were observed for sediments during the kinetic tests. It can be concluded that sulfide oxidation rate within the sediment samples is negligible, which is confirmed by the low Fe and S release rates (14.5 mg/kg and 1208 mg/kg, respectively). Apparently, the organic matter contained in the vase and composite samples is responsible for the short-term reactivity of the samples. The quantity of organic matter in the vase greatly decreased, going from 6.61% before the weathering cell test to 4.80% (Table S7). At the same time, as presented in Figure 10, Zn, Fe and Cu depletion was faster within the composite and vase samples compared to the sediments, which proves their high reactivity and chemical species release.
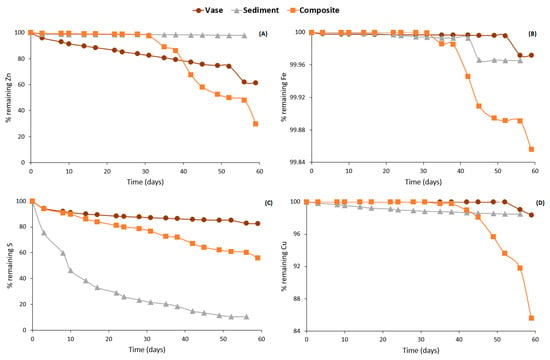
Figure 10.
Elementary depletion curves for Zn (A), Fe (B), S (C) and Cu (D) within the studied samples.
Under these geochemical conditions, the precipitation of secondary minerals (Figure S2) is favored, which may also reduce the mobility of metal(oid)s. the Fe–S pH/Eh diagrams (Figure 11 suggest the precipitation of iron hydroxides under the geochemical conditions analyzed within the sediment leachates. During secondary phase precipitation, several chemical species are immobilized due to several mechanisms, such as co-precipitation and sorption [39,40]. The vase sediments showed an acidic behavior with pH values ranging between 4 and 6 during the weathering cell test duration. This is explained by their high acid generation potential (117 kg CaCO3/t) compared to sediments. Additionally, the oxidation of organic matter contributes to increasing the acidity of the leachates [41]. The acid pH values increased the mobility of metal(oid)s. Consequently, the leaching rates of Fe, Zn, S and Cu were about 64, 4400, 8410 and 160 mg/kg, respectively. The low Fe release rate compared to S is explained by the precipitation of iron, as is suggested by the Fe pH/Eh diagrams (Figure 11). The composite sample, which is the most representative scenario of dredging, showed an acidic quality, with pH values between 4 and 6. This release of metals can be associated with the oxidation of the sulfides present in the vase (pyrite, and (iso)chalcopyrite) (Figure 9), as presented by Equations (1) to (5), as well as with the oxidation of organic matter [26].
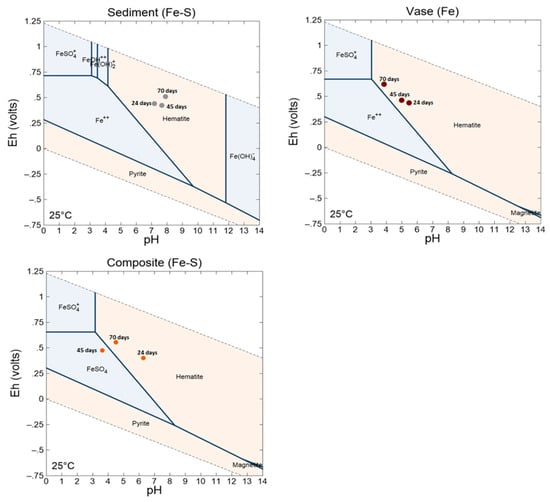
Figure 11.
Iron–sulfur Eh–pH diagram of the leachates from sediment, vase and composite samples at 24, 45 and 70 days.
The oxidation–neutralization curves with the projection of the initial S and C (Figure S3) allowed the classification of the geochemical behavior of the solid samples in the long-term [42]. These projections also confirmed that the sediments are non-acid-generating, but the vase was located between uncertainty and acid-generating. Considering the results of the weathering cell tests, the vase is considered acid-generating. Based on the chemical, mineralogical and weathering cells results, the dredging may present a serious risk of contamination (e.g., Fe, SO42−, Zn, Cu, Al) due to natural weathering. Consequently, the dredged materials must be adequately managed to prevent contamination by sulfide and organic matter oxidation. In the case of dredged sediments, several scenarios can be feasible, and the economic cost will allow one to choose the final sediment management plan.
4.2. Strategies to Mitigate the Risk Posed by Dredged Sediments
Stabilization/solidification is one of the most used techniques to reduce the risks related to contaminated sediments [43,44,45,46,47]. Indeed, more than 24% of cases of contaminated materials were treated using stabilization/solidification (S/S) technology between 2002 and 2005 [48]. This technique consists of adding cementitious materials to improve the geomechanical properties of the contaminated sediments [49]. One of the most used cementitious additives is Portland cement, which proved its efficiency in solidifying and stabilizing contaminated sediment [45]. The dredged sediments may need thermal pre-treatment to remove organic matter and decrease their water content [50]. Adding cement will improve the geomechanical properties and workability of the dredged sediments. During the process of sediments cementation, the contaminants are immobilized due to the physical and chemical processes that occur during cementation. Soluble inorganic contaminants can be immobilized by physical mechanisms, including (i) the precipitation of cement products, which reduce the free sediments’ pore water [51], (ii) and the precipitation of cement hydration products at the surface of the reactive sulfide, which reduce their exposure and reactivity [52]. Additionally, cements are characterized by a high acid-buffering capacity, which will increase the pH of pore water to achieve neutral to alkaline values [53]. Under these conditions, the precipitation of secondary iron oxyhydroxides is favored [40]. The precipitation of secondary iron oxyhydroxides is often associated with the removal of several contaminants from pore water [54].
Recently, the reprocessing of contaminated sediments to recover either acid-forming and/or valuable minerals has been recognized as an innovative approach to the circular economy [21,22]. The reprocessing of contaminated sediments may be done using flotation techniques and/or gravity methods, depending on their mineralogical and physical properties. Indeed, mineralogical observations showed the presence of Cu-sulfides (e.g., isochalcopyrite), which were circular and well crystallized (Figure 2). Additionally, the chemical analysis of the sediments and vase showed that the Cu contents were up to 790 mg/kg for sediments and 12,120 mg/kg for vase, which encourages their reprocessing for Cu recovery. Amar et al. (2021) showed that flotation combined with gravity methods is an effective techniques for recovering valuable minerals (base metals bearing mineral) from acid-generating mine wastes [21]. In the case of these contaminated lake sediments, gravity methods can be applied efficiently to concentrate copper sulfides given that they were identified as liberated minerals (Figure 3).
5. Conclusions
The chemical quality of the lake’s water showed negligible concentrations in terms of metals and metalloids, confirming a good water quality. However, the solid samples (vase and sediments) showed metal(oid)s contents that exceeded the frequent effect concentration criterion. Consequently, the reactivity of the sediments and vase will release the contaminants into the lake water. The simulation of sediments and vase reactivity using weathering cells showed that several contaminants can be released, such as Cu, Zn, Fe and S. The main mechanisms responsible for contaminants release are sulfides and organic matter oxidation. Sulfide (e.g., isochalcopyrite, pyrite) oxidation increases acidity and metal(oid)s mobility. In the same way, organic matter dissolution releases the adsorbed metal(oid)s. Thus, a thermal pretreatment to remove organic matter may reduce the contamination level of the dredged sediments. Furthermore, the dredged sediments will require an appropriate management plan (e.g., solidification/stabilization). Additionally, the reprocessing of dredged sediments to recover valuable minerals (copper sulfide) may be an option to partially cover the costs related to dredged sediment management.
Supplementary Materials
The following are available online at https://www.mdpi.com/2076-3417/11/5/2298/s1, Figure S1: Sulfur Eh-pH diagram of the vase pore water sample number 81,845, Figure S2: Zn-Fe Eh-pH diagram of vase pore water number 81,873 (left) and number 81,845 (right), Figure S3: Oxidation-Neutralization curve comparing the initial chemistry of the sediment and vase to the chemistry results of the weathering test.2, Table S1: Particle size distribution, specific gravity and specific surface area of samples from Osisko Lake, Table S2: Results of chemical composition of lake water, sediments and vase pore waters (DL = detection limit, n/d = not defined), Table S3: Sulfur-Carbon results of sediments and vases samples from Osisko Lake, Table S4: XRF whole rock results of sediment and vase samples, Table S5: Results of chemical composition of sediment and vase samples, Table S6: Generic criteria for soils, Table S7: Results of total S and C, and Corg-inorg analysis of the three samples before and after kinetic tests.
Author Contributions
L.D.: materials sampling, characterization, writing original draft; A.E.: writing original draft, reviewing, data analysis; M.B.: reviewing, data analysis, validation, supervision. P.M.: materials sampling, validation. All authors have read and agreed to the published version of the manuscript.
Funding
NSERC program ‘Engage’ in partnership with Patrick Martel ‘Technosub’.
Institutional Review Board Statement
Not applicable.
Informed Consent Statement
Not applicable.
Data Availability Statement
The data presented in this study are all available in the Supplementary Material.
Acknowledgments
The authors would thank Technosub for their support during sampling step and all members of the ‘comité territoire’.
Conflicts of Interest
The authors declare no conflict of interest.
References
- Liu, W.; Coveney, R.; Chen, J. Environmental quality assessment on a river system polluted by mining activities. Appl. Geochem. 2003, 18, 749–764. [Google Scholar] [CrossRef]
- Zheng, N.; Wang, Q.; Liang, Z.; Zheng, D. Characterization of heavy metal concentrations in the sediments of three freshwater rivers in Huludao City, Northeast China. Environ. Pollut. 2008, 154, 135–142. [Google Scholar] [CrossRef]
- Hang, X.; Wang, H.; Zhou, J.; Du, C.; Chen, X. Characteristics and accumulation of heavy metals in sediments originated from an electroplating plant. J. Hazard. Mater. 2009, 163, 922–930. [Google Scholar] [CrossRef] [PubMed]
- Sakan, S.M.; Đorđević, D.S.; Manojlović, D.D.; Predrag, P.S. Assessment of heavy metal pollutants accumulation in the Tisza river sediments. J. Environ. Manag. 2009, 90, 3382–3390. [Google Scholar] [CrossRef] [PubMed]
- Vicente-Martorell, J.J.; Galindo-Riaño, M.D.; García-Vargas, M.; Granado-Castro, M.D. Bioavailability of heavy metals monitoring water, sediments and fish species from a polluted estuary. J. Hazard. Mater. 2009, 162, 823–836. [Google Scholar] [CrossRef] [PubMed]
- Yang, Z.; Wang, Y.; Shen, Z.; Niu, J.; Tang, Z. Distribution and speciation of heavy metals in sediments from the mainstream, tributaries, and lakes of the Yangtze River catchment of Wuhan, China. J. Hazard. Mater. 2009, 166, 1186–1194. [Google Scholar] [CrossRef] [PubMed]
- Marvin, C.; Allan, L.; McCarry, B.; Bryant, D. Chemico/biological investigation of contaminated sediment from the Hamilton Harbour area of western Lake Ontario. Environ. Mol. Mutagen. 1993, 22, 61–70. [Google Scholar] [CrossRef] [PubMed]
- Klemt, W.H.; Kay, M.L.; Wiklund, J.A.; Wolfe, B.B.; Hall, R.I. Assessment of vanadium and nickel enrichment in Lower Athabasca River floodplain lake sediment within the Athabasca Oil Sands Region (Canada). Environ. Pollut. 2020, 265, 114920. [Google Scholar] [CrossRef] [PubMed]
- Louriño-Cabana, B.; Lesven, L.; Charriau, A.; Billon, G.; Ouddane, B.; Boughriet, A. Potential risks of metal toxicity in contaminated sediments of Deûle river in Northern France. J. Hazard. Mater. 2011, 186, 2129–2137. [Google Scholar] [CrossRef] [PubMed]
- Rath, P.; Panda, U.C.; Bhatta, D.; Sahu, K.C. Use of sequential leaching, mineralogy, morphology and multivariate statistical technique for quantifying metal pollution in highly polluted aquatic sediments—A case study: Brahmani and Nandira Rivers, India. J. Hazard. Mater. 2009, 163, 632–644. [Google Scholar] [CrossRef]
- Harikumar, P.; Nasir, U. Ecotoxicological impact assessment of heavy metals in core sediments of a tropical estuary. Ecotoxicol. Environ. Saf. 2010, 73, 1742–1747. [Google Scholar] [CrossRef] [PubMed]
- Blowes, D.W.; Jambor, J.L.; Alpers, C.N. The Environmental Geochemistry of Sulfide Mine-Wastes; Mineralogical Association of Canada: Québec, QC, Canada, 1994; Volume 22. [Google Scholar]
- Elghali, A.; Benzaazoua, M.; Bussière, B.; Genty, T. Spatial mapping of acidity and geochemical properties of oxidized tailings within the former Eagle/Telbel mine site. Minerals 2019, 9, 180. [Google Scholar] [CrossRef]
- Zhang, H.; Shan, B. Historical records of heavy metal accumulation in sediments and the relationship with agricultural intensification in the Yangtze-Huaihe region, China. Sci. Total Environ. 2008, 399, 113–120. [Google Scholar] [CrossRef] [PubMed]
- Viguri, J.R.; Irabien, M.J.; Yusta, I.; Soto, J.; Gómez, J.; Rodriguez, P.; Martinez-Madrid, M.; Irabien, J.A.; Coz, A. Physico-chemical and toxicological characterization of the historic estuarine sediments: A multidisciplinary approach. Environ. Int. 2007, 33, 436–444. [Google Scholar] [CrossRef]
- Lepland, A.; Andersen, T.J.; Lepland, A.; Arp, H.P.H.; Alve, E.; Breedveld, G.D.; Rindby, A. Sedimentation and chronology of heavy metal pollution in Oslo Harbor, Norway. Mar. Pollut. Bull. 2010, 60, 1512–1522. [Google Scholar] [CrossRef]
- Savard, N. L’Environnement à Rouyn-Noranda: Un Espace en Déséquilibre Suite à L’Activité Minière. Ph.D. Thesis, Université de Montréal, Montréal, QC, Canada, 1978. [Google Scholar]
- Beaulieu, M. Guide d’Intervention: Protection des Sols et Réhabilitation des Terrains Contaminés; Ministère du Développement Durable, de l’Environnement et de la Lutte contre les Changements Climatiques: Québec, QC, Canada, 2016.
- Bhagowati, B.; Ahamad, K.U. A review on lake eutrophication dynamics and recent developments in lake modeling. Ecohydrol. Hydrobiol. 2019, 19, 155–166. [Google Scholar] [CrossRef]
- Couvidat, J. Gestion d’un Sédiment de Dragage Marin Contaminé: Caractérisation de la Réactivité Biogéochimique, Valorisation en Mortier et Evaluation Environnementale. Ph.D. Thesis, INSA de Lyon, Lyon, France, 2015. [Google Scholar]
- Amar, H.; Benzaazoua, M.; Edahbi, M.; Villeneuve, M.; Joly, M.-A.; Elghali, A. Reprocessing feasibility of polymetallic waste rock for cleaner and sustainable mining. J. Geochem. Explor. 2021, 220, 106683. [Google Scholar] [CrossRef]
- Amar, H.; Benzaazoua, M.; Elghali, A.; Bussière, B.; Duclos, M. Upstream environmental desulphurisation and valorisation of waste rocks as a sustainable AMD management approach. J. Geochem. Explor. 2020, 215, 106555. [Google Scholar] [CrossRef]
- Nordstrom, D.K.; Southam, G. Chapter 11. Geomicrobiology of sulfide mineral oxidation. Geomicrobiology 1997, 35, 361–390. [Google Scholar] [CrossRef]
- Bao, J.; Wang, L.; Xiao, M. Changes in speciation and leaching behaviors of heavy metals in dredged sediment solidified/stabilized with various materials. Environ. Sci. Pollut. Res. 2016, 23, 8294–8301. [Google Scholar] [CrossRef]
- Weng, L.; Temminghoff, E.J.; Lofts, S.; Tipping, E.; Van Riemsdijk, W.H. Complexation with dissolved organic matter and solubility control of heavy metals in a sandy soil. Environ. Sci. Technol. 2002, 36, 4804–4810. [Google Scholar] [CrossRef] [PubMed]
- Grybos, M.; Davranche, M.; Gruau, G.; Petitjean, P. Is trace metal release in wetland soils controlled by organic matter mobility or Fe-oxyhydroxides reduction? J. Colloid Interface Sci. 2007, 314, 490–501. [Google Scholar] [CrossRef]
- Rouyn-Noranda, V.D. Etude sur L’état du lac Osisko; Rouyn-Noranda: Québec, QC, Canada, 2015. [Google Scholar]
- Brunauer, S.; Emmett, P.H.; Teller, E. Adsorption of gases in multimolecular layers. J. Am. Chem. Soc. 1938, 60, 309–319. [Google Scholar] [CrossRef]
- Schulte, E.E.; Hopkins, B.G. Estimation of soil organic matter by weight loss-on-ignition. SSSA Spec. Pub. 2015, 46, 21–31. [Google Scholar]
- Elghali, A.; Benzaazoua, M.; Bouzahzah, H.; Bussière, B.; Villarraga-Gómez, H. Determination of the available acid-generating potential of waste rock, part I: Mineralogical approach. Appl. Geochem. 2018, 99, 31–41. [Google Scholar] [CrossRef]
- Lawrence, R.W.; Scheske, M. A method to calculate the neutralization potential of mining wastes. Environ. Earth Sci. 1997, 32, 100–106. [Google Scholar] [CrossRef]
- Rietveld, H.M. A profile refinement method for nuclear and magnetic structures. J. Appl. Crystallogr. 1969, 2, 65–71. [Google Scholar] [CrossRef]
- Cruz, R.; Luna-Sánchez, R.; Lapidus, G.; González, I.; Monroy, M. An experimental strategy to determine galvanic interactions affecting the reactivity of sulfide mineral concentrates. Hydrometallurgy 2005, 78, 198–208. [Google Scholar] [CrossRef]
- Testing, A.S.F. Classification of soils for engineering purposes. Ann. B. ASTM Stand. 1985, 395–408. [Google Scholar]
- Environnement Canada et ministère du Développement durable, Canada. Critères Pour L’évaluation de la Qualité des Sédiments au Quebec et Cadres D’application: Prévention, Dragage et Restauration; Environment Canada: Fredericton, NB, Canada, 2007; p. 39. [Google Scholar]
- Wilkin, R.; Barnes, H. Formation processes of framboidal pyrite. Geochim. Cosmochim. Acta 1997, 61, 323–339. [Google Scholar] [CrossRef]
- Evangelou, V.P.; Zhang, Y.L. A review: Pyrite oxidation mechanisms and acid mine drainage prevention. Crit. Rev. Environ. Sci. Technol. 1995, 25, 141–199. [Google Scholar] [CrossRef]
- Migniot, C. Action des courants, de la houle et du vent sur les sédiments. La Houille Blanche 1977, 1977, 9–47. [Google Scholar] [CrossRef]
- Elghali, A.; Benzaazoua, M.; Bussière, B.; Genty, T. In situ effectiveness of alkaline and cementitious amendments to stabilize oxidized acid-generating tailings. Minerals 2019, 9, 314. [Google Scholar] [CrossRef]
- Cravotta, C.A. Dissolved metals and associated constituents in abandoned coal-mine discharges, Pennsylvania, USA. Part 2: Geochemical controls on constituent concentrations. Appl. Geochem. 2008, 23, 203–226. [Google Scholar] [CrossRef]
- Froelich, P.; Klinkhammer, G.; Bender, M.; Luedtke, N.; Heath, G.; Cullen, D.; Dauphin, P.; Hammond, D.; Hartman, B.; Maynard, V. Early oxidation of organic matter in pelagic sediments of the eastern equatorial Atlantic: Suboxic diagenesis. Geochim. Cosmochim. Acta 1979, 43, 1075–1090. [Google Scholar] [CrossRef]
- Benzaazoua, M.; Dagenais, A.-M.; Archambault, M. Kinetic tests comparison and interpretation for prediction of the Joutel tailings acid generation potential. Environ. Earth Sci. 2004, 46, 1086–1101. [Google Scholar] [CrossRef]
- Akcil, A.; Erust, C.; Ozdemiroglu, S.; Fonti, V.; Beolchini, F. A review of approaches and techniques used in aquatic contaminated sediments: Metal removal and stabilization by chemical and biotechnological processes. J. Clean. Prod. 2015, 86, 24–36. [Google Scholar] [CrossRef]
- Barjoveanu, G.; De Gisi, S.; Casale, R.; Todaro, F.; Notarnicola, M.; Teodosiu, C. A life cycle assessment study on the stabilization/solidification treatment processes for contaminated marine sediments. J. Clean. Prod. 2018, 201, 391–402. [Google Scholar] [CrossRef]
- Zhang, W.-L.; Zhao, L.-Y.; McCabe, B.A.; Chen, Y.-H.; Morrison, L. Dredged marine sediments stabilized/solidified with cement and GGBS: Factors affecting mechanical behaviour and leachability. Sci. Total. Environ. 2020, 733, 138551. [Google Scholar] [CrossRef]
- Todaro, F.; De Gisi, S.; Notarnicola, M. Contaminated marine sediment stabilization/solidification treatment with cement/lime: Leaching behaviour investigation. Environ. Sci. Pollut. Res. 2020, 27, 21407–21415. [Google Scholar] [CrossRef]
- Pan, C.; Chen, K.; Chen, D. Effect of organics on heavy metal-contaminated river sediment treated with electro-osmosis and solidification/stabilization methods. Materials 2020, 13, 1466. [Google Scholar] [CrossRef]
- United Stated Einvironmental Protection Agency (USEPA). Treatment Technologies for Site Cleanup: Annual Status Report, 12th ed.; EPA-542-R-03; USEPA: Washington, DC, USA, 2004.
- Gang, Y.; Won, E.-J.; Ra, K.; Choi, J.Y.; Lee, K.-W.; Kim, K. Environmental assessment of contaminated marine sediments treated with solidification agents: Directions for improving environmental assessment guidelines. Mar. Environ. Res. 2018, 139, 193–200. [Google Scholar] [CrossRef] [PubMed]
- Couvidat, J.; Benzaazoua, M.; Chatain, V.; Bouzahzah, H. Environmental evaluation of dredged sediment submitted to a solidification stabilization process using hydraulic binders. Environ. Sci. Pollut. Res. 2016, 23, 17142–17157. [Google Scholar] [CrossRef]
- Paria, S.; Yuet, P.K. Solidification-stabilization of organic and inorganic contaminants using portland cement: A literature review. Environ. Rev. 2006, 14, 217–255. [Google Scholar] [CrossRef]
- Elghali, A.; Benzaazoua, M.; Bussière, B.; Bouzahzah, H. Determination of the available acid-generating potential of waste rock, part II: Waste management involvement. Appl. Geochem. 2019, 100, 316–325. [Google Scholar] [CrossRef]
- Benzaazoua, M.; Belem, T.; Bussière, B. Chemical factors that influence the performance of mine sulphidic paste backfill. Cem. Concr. Res. 2002, 32, 1133–1144. [Google Scholar] [CrossRef]
- Elghali, A.; Benzaazoua, M.; Bussière, B.; Kennedy, C.; Parwani, R.; Graham, S. The role of hardpan formation on the reactivity of sulfidic mine tailings: A case study at Joutel mine (Québec). Sci. Total. Environ. 2019, 654, 118–128. [Google Scholar] [CrossRef]
Publisher’s Note: MDPI stays neutral with regard to jurisdictional claims in published maps and institutional affiliations. |
© 2021 by the authors. Licensee MDPI, Basel, Switzerland. This article is an open access article distributed under the terms and conditions of the Creative Commons Attribution (CC BY) license (http://creativecommons.org/licenses/by/4.0/).