Featured Application
The proposed research is beneficial in two main ways. Firstly, commuters are empowered to receive route guidance that incorporates a mix of transport modes, including cars, buses, trams, bicycles, and walking, in a bid to reduce travel-related carbon emissions and encourage sustainable travel behavior. Secondly, the traffic control and management authorities may use the multi-agent traffic recommender system to view and monitor the live status of the traffic, thus empowering them to take appropriate road traffic control actions to optimize the traffic streams.
Abstract
The use and coordination of multiple modes of travel efficiently, although beneficial, remains an overarching challenge for urban cities. This paper implements a distributed architecture of an eco-friendly transport guidance system by employing the agent-based paradigm. The paradigm uses software agents to model and represent the complex transport infrastructure of urban environments, including roads, buses, trolleybuses, metros, trams, bicycles, and walking. The system exploits live traffic data (e.g., traffic flow, density, and CO2 emissions) collected from multiple data sources (e.g., road sensors and SCOOT) to provide multimodal route recommendations for travelers through a dedicated application. Moreover, the proposed system empowers the transport management authorities to monitor the traffic flow and conditions of a city in real-time through a dedicated web visualization. We exhibit the advantages of using different types of agents to represent the versatile nature of transport networks and realize the concept of smart transportation. Commuters are supplied with multimodal routes that endeavor to reduce travel times and transport carbon footprint. A technical simulation was executed using various parameters to demonstrate the scalability of our multimodal traffic management architecture. Subsequently, two real user trials were carried out in Nottingham (United Kingdom) and Sofia (Bulgaria) to show the practicality and ease of use of our multimodal travel information system in providing eco-friendly route guidance. Our validation results demonstrate the effectiveness of personalized multimodal route guidance in inducing a positive travel behavior change and the ability of the agent-based route planning system to scale to satisfy the requirements of traffic infrastructure in diverse urban environments.
1. Introduction
Traffic congestion remains a global challenge in the transport domain, causing significant greenhouse emissions [1]. Other repercussions of traffic jams include prolonged travel times, traffic accidents, air pollution, noise, and disturbance [2]. However, the emergence of the so-called “smart cities” emphasized the need to implement and offer smart transportation as a service to the relevant stakeholders [3]. Moreover, the proliferation of intelligent traffic management systems [2] has opened a new horizon for realizing energy-efficient and carbon-free transport. Such systems undergo three primary phases. They usually start by collecting traffic data from heterogeneous sources (e.g., road sensors and mobile phones) available within the transport network. Next, the sensed data are cleaned, processed, and stored in appropriate formats within dedicated databases. Finally, smart services, such as emergency management and route guidance, are composed, tailored, and delivered according to the requirement of the relevant entities (e.g., commuters or traffic management authorities). Intelligent traffic management systems serve different services, including congestion avoidance, accident detection, and route suggestion, among others.
Although the prospect of fuel efficient vehicles (e.g., hybrid and electric vehicles) has recently enjoyed wider acceptability and adoption [4], and stricter CO2 emission regulations have been introduced [5], road transport still produces approximately a fifth (21%) of the total carbon footprint in European countries [6,7]. This increasingly worrisome phenomenon calls for further efforts to develop intelligent mobility frameworks that assist in (1) promoting sustainable commuting behavior and (2) balancing the flow of traffic across the entire transport network to reduce traffic congestions. In such mobility frameworks, sensing and navigation technologies play a pivotal role in recommending less congested routes that capitalize on multiple modes of transport by incorporating public transport, cycling, and walking. These technologies heavily rely on a transport network model and their perception and understanding of the current traffic conditions.
Intelligent transportation systems (aka ITSs) use various techniques to model the transport network [8,9,10]. Typically, to model and organize transport, one has to simulate (1) the static entities representing the physical infrastructure, e.g., road segments and intersections; and (2) the moving entities, e.g., vehicles. A traffic management system senses the traffic data and implements the routing algorithms to eliminate traffic jams, with the aim of producing faster and cost-effective journeys. The agent-based paradigm [11] is among the popular approaches used for modeling transport networks because of its advantageous characteristics, including autonomy and decentralization. These advantages enable dealing with unpredictability in urban areas, e.g., [12].
The literature provides ample examples that demonstrate the importance of intelligent transportation systems. For instance, the authors of [13] present Adapt-Traf, a hierarchical organizational multi-agent architecture, which models the real-time flow of traffic to overcome road traffic jams. This approach endeavors to provide unimodal route guidance to car-only commuters. In another example, Green Travelling Planner represents a multimodal travel planner that combines 11 modes of commuting using a heuristic approach and commuters’ travel needs [14]. However, the proposed tool does not use the multi-agent architecture, restricting its scalability and flexibility. Moreover, both examples do not use CO2 emissions as a factor to calculate and provide route recommendations; instead, they rely on travel time estimations from historical datasets.
The current research presents a human-centered driven multi-agent solution that (1) produces eco-friendly multimodal route recommendations, including public transport-reliant routes and fastest routes, and (2) empowers urban traffic management authorities to visualize and monitor the traffic conditions of their city. In essence, our intelligent transport solution models seven transport layers of a given city, including road segments, public transport journeys (e.g., buses, trams), bike paths, and pedestrian paths, and calculates the best combination of these modes while considering commuters preferences. The eco-friendly multimodal route guidance system (aka EMRG system) forms a detailed understanding of the typography of the transport network (i.e., physical infrastructure) and the live traffic data representing traffic stream properties (e.g., speed, travel time, and estimated CO2 emissions). In the validation section, we demonstrate the closeness of our simulations to real-world scenarios by applying routing algorithms to compute journey plans that not only fulfill commuter preferences (i.e., multi-modality and departure time), but also reduce traffic congestions and the resulting CO2 emissions.
Although past research claims that the provision of public transport information does change travel decisions [15,16], it remains unclear to what extent mobile applications change travel behavior, and further research is advocated [17]. For instance, a recent study has shown that personalized accessibility information may inflict more walking and less driving time; however, the self-reported travel behavior change was less than 10% [18]. Therefore, another motive for conducting this research is to explore the prospect of inducing sustainable travel behavior using efficient route recommendations.
The remainder of the paper comprises eight sections. Section 2 reports on the recent works in the field of multimodal transport management, with an emphasis on their strengths and weaknesses. Section 3 details the inner workings of our eco-friendly route guidance traffic management system. Section 4 and Section 5 describe the transport layers and traffic properties modelled by the multi-agent architecture. Section 6 presents a technical validation, along with the types of journey recommendations offered by our multimodal route guidance system. Section 7 shows the user validation results of the system in two European cities. Section 8 discusses the implications and limitation of the eco-friendly traffic management system. Finally, Section 9 concludes the paper with future research prospects.
2. State-of-the-Art Intelligent Transport Management Systems
Indeed, the literature offers several intelligent approaches to model, optimize, and resolve traffic problems [19]. Such approaches comprise analytical and mathematical models. The analytical approaches focus on analyzing the traffic network equilibrium before any planned disruptions to the transport network [10,20,21]. However, the mathematical approaches, such as the graph theory, assist in modeling the resources of a transport network. The nodes of the graph represent road intersections and graph links represent the urban road segments and their carriageways [10,22]. Petri net is an example of a mathematical modeling language that can be used to describe events within decentralized systems, such as the transport network, where transitions and flow of traffic are shown [23,24]. Queuing simulation models help to simulate and analyze traffic behavior and flow in different sections of the transport network, e.g., red lights and stop signs, where the available capacity fails to satisfy the required demand [25,26].
Recently, prominent works introduced intelligent transportation systems (ITSs) to empower the respective stakeholders to simulate and manage the transport infrastructure and its moving objects [27,28,29]. Some ITS implementations employ agent-based computing to offer distributed applications that react to the highly dynamic nature of traffic. In agent-based solutions, software agents are used as the building blocks to represent the traffic characteristics. The agents are self-organized, self-contained, and autonomous software entities that act on behalf of other users (e.g., cars, road segments, traffic lights, and so on) to accomplish common goals. In contrast to centralized problem-solving, intelligent agents of a multi-agent architecture communicate, interact, and collaborate to solve complex problems in a distributed manner [12,30].
Naturally, traffic is highly dynamic and geographically distributed in the transport network, making it perfect for modeling using multi-agent computing [9,31,32]. Moreover, it is expected that a distributed computational solution, such as the multi-agent architecture, will outperform centralized modeling systems owing to its autonomy and flexibility [32]. Multi-agent computing was applied to overcome several transport challenges, including urban traffic control [33,34,35,36], fleet management [37,38], and route planning and guidance [39,40]. Different agent-based frameworks were used in these applications to implement multi-agent environments, e.g., MATsim [41].
Artificial intelligence-based systems proposed for managing and optimizing the transport network have employed bird swarm optimizer, rule-based fuzzy logic, and artificial neural networks, among other techniques [39,40,42,43]. In essence, these systems are trained on the previous traffic data to prognosticate the traffic stream variables in the transport network. Such predictions are used to manage the traffic flows and optimize the recommendations of the ITS.
Recent traffic modeling systems addressed traffic management problems by integrating multiple modes of transport and considering eco-friendliness [44,45,46,47]. For example, a multi-agent decision support framework used the genetic algorithm to optimize transport graphs and recommend the best combination of transport modes to commuters [45]. However, our route recommender architecture simulates the transport network at a macroscopic level, i.e., creating transport agents for every road segment and considering real-time traffic information for them, and thereby provides more accurate estimations of the traffic situation, aggregation of travel times, and travel carbon emissions. In addition, our system encourages sustainable transport modes, such as walking and cycling, which can expand on co-modality and multi-modality.
In another example, a route recommendation system was developed to search for the best solution that suits user preferences while considering eco-friendliness [44]. However, the route recommendations are precalculated a priori and kept in a database, as the system does not incorporate a way to model traffic data updates or a mechanism to acquire real-time information for public transport [44]. In contrast, our transport agents simulate road segments and are updated by the live traffic status and public transport data provided by the traffic control centers. There are also other approaches, which are solely focused on solving the problem of routing for public transport. For instance, the authors of [48] used uni-modal routing graphs to suggest a transfer mechanism between uni-modals, thus providing a multimodal routing. In our architecture, we adopt shortest path algorithms, such as Dijkstra [49], and regional approaches similar to the transfer mechanism for journey optimization and route planning for our commuters.
Table 1 compares our proposed multi-agent solution with the most recent and relevant studies in the area of intelligent traffic management. To achieve a sound comparison, we have devised the following ten comparison criteria:

Table 1.
Comparison of our multimodal route recommendation approach with existing frameworks.
- System Architecture: The selected architecture can be either distributed or centralized.
- Attributes of the Transport Network: A transport network comprises several attributes, including characteristics of roads, the direction of traffic, flow of traffic, speed of cars, and timetable of buses and trams, among others.
- Use of Live Traffic Data: There are some traffic monitoring systems that provide real-time traffic data using traffic sensors. For example, the SCOOT system is used to date in the United Kingdom to collect real traffic data, including incidents and congestions.
- Traffic Monitoring System: Traffic monitoring systems or dashboards can help in observing traffic conditions and making decisions by the traffic management and control authorities.
- Multimodal Transport: Multimodal traffic solutions consider integrating several modes of transports to offer flexibility and reduce the load on the transport network. These modes may involve cars, trams, walking, bicycles, buses, and so on.
- Congestion Cost: Several traffic factors can be used to calculate the congestion cost, including carbon emissions, travel time, speed, and traffic flow and density, among others.
- Routing Guidance: Routing guidance is given to commuters to improve their travel experience by suggesting, for example, information about the shortest or less congested path to their destination. Currently, routing guidance is most likely delivered through dedicated mobile applications.
- Validation Type: This criterion refers to the validation of the ITS architecture, which can be performed through a software simulation or a real field trial.
- Beneficiaries: The expected beneficiaries of a traffic management solution could range from traffic management authorities to everyday commuters.
- Platform Used for Implementation/Simulation: This criterion reports on the technical frameworks and libraries used to realize the ITS architecture.
Indeed, the existing multi-agent-based approaches suffered from several shortcomings [46,51,54]. They did not propose a tool for the authorities, there is no application for route guidance, and they do not use the real-time traffic data in their experiments. Moreover, in some studies, the primary beneficiaries are commuters and not the authorities [46,51]. While the work proposed in [54] might be beneficial to the authorities, however, they focused on the tramway attributes and did not consider other factors like congestion cost, route guidance, and carbon emissions.
The works discussed in [14,50,52,53] focused on overcoming traffic management issues by deploying centralized architectures. Other works, e.g., [14,50], relied on travel time estimations calculated from historical datasets and did not use live traffic data. These solutions [14,52] did not consider the congestion cost (e.g., carbon emissions) for promoting sustainable travel. Finally, the offered solutions [52,53] did not offer a mobile app to guide commuters through the optimum route.
Our proposed approach fulfills all the criteria listed in Table 1. It also considers the attributes of the transport network (both static and dynamic information of traffic). We used the real-time traffic data provided by the SCOOT system installed in the road transport layer. Additionally, we guided commuters through the fastest and eco-friendliest routes using a mobile application. Our approach was validated in two European cities (Nottingham and Sofia) to showcase its usefulness for commuters and traffic management authorities.
3. A Multimodal Mobility Recommender System for Urban Areas
We start by giving an overview of the complete architecture that we devised to realize our intelligent transportation system, which integrated three vital software modules. Figure 1 shows the software modules and the fundamental interactions between these modules. The specific modular software tools are (1) the multimodal decision support tool, (2) the traffic congestion data estimator, and (3) the real-time traffic prediction tool. In essence, the multimodal traffic recommender suggests eco-friendly routes after receiving traffic flow forecasts from the real-time traffic prediction tool, an ant-based system for modeling and simulating traffic to predict stream characteristics [55]. This belongs to the class of holonic-based solutions [56]. The Erlang programing language was used to implement the real-time traffic prediction tool as it enables the creation of large-scale real-time systems that run a high number of parallel processes. The forecasts calculated here represent the costs of using transport segments that could take the form of estimated travel time or CO2 emissions. Finally, the traffic congestion data simulator fetches road traffic information from the urban traffic management and control center (i.e., UTMC) every four seconds. Moreover, traffic data can be collected using floating cars (through dedicated in-car WIFI devices) and roadside sensors periodically. The servers of public transport provide live information about their services. The central role of the traffic congestion data simulator is to estimate the level of traffic and amount of CO2 emissions and push these traffic estimations to the other two modules once every 4 s. Data are exchanged between the software modules using XML RPC and SOAP communication protocols. However, in this paper, we focus mainly on describing the multimodal mobility recommender system as it represents the core contribution of our work.
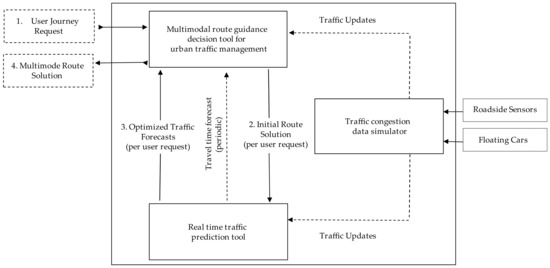
Figure 1.
Overview of the complete intelligent multimodal transportation system.
Mobility demands are continually rising, especially in urban areas, posing serious traffic management concerns [57]. We opted for the multi-agent architecture as the implementation paradigm as it can help mitigate several challenges, including scalability, efficient use of resources, and coordination [12]. The use of a multi-agent computing paradigm for traffic transport management and optimization offers a myriad of opportunities for improving traffic flows, reducing transport emissions, and satisfying commuter demands [58]. The eco-friendly multimodal system we propose models and combines several layers of the urban transport network. Each transport segment is represented by a software agent capable of making autonomous decisions for it to be included or excluded in the routing calculations depending on the cost contribution of the transport segment (i.e., carbon emissions or estimated travel time). Below, we outline a commuting scenario, which helped us derive the relevant requirements and observations for the proposed system.
A motivating scenario: “A commuter is regularly commuting to work from Marple to Piccadilly train station in Manchester, United Kingdom by car. On the day of the scenario, however, there has been an accident on A57 (part of the major route to the station), and one lane is blocked in the middle of a road segment. In such circumstances, the commuter uses a mobile phone application to search for an alternative route; the mobile phone app can serve as a frontend of the eco-friendly multimodal ITS system. In the app, the stored preferences, based on the patterns of past use, indicate that taking the tram directly from Marple is another viable alternative. Based on such recommendations from the app, the commuter chooses to take the tram today as this reduces his overall travel time and contributions toward carbon emissions”. From this scenario, one can derive several essential requirements that are crucial to developing an appropriate multi-agent architecture as follows:
- Provision of alternative multi-mode routing guidance to commuters, especially following unexpected disturbances in their usual commuting routes;
- Simulation of physical transport infrastructure that is geographically distributed and highly dynamic to accommodate the capabilities of a specific urban city;
- Use of real-time traffic information of the city, available through different sources, to produce accurate and up to date multimodal recommendations;
- Coordination of various modes of transport, including car, bus, trolleybus, tram, metro, cycling, and walking, to minimize waiting time and provide a smooth transition between these modes;
- Reduction of traffic congestions and transport emissions in urban environments, where either travel time or CO2 emissions are used as costs during the search, thus reducing the commuting time;
- Satisfaction of commuter preferences (e.g., time of travel, time of arrival, and mode of transportation), resulting in commuter satisfaction and continued use of the system in the future.
3.1. The Multimodal Route Guidance Architecture
Figure 2 depicts the architecture of the eco-friendly multimodal routing guidance system. The system is designed to serve two types of stakeholders, namely (i) commuters and (ii) traffic management and control authority. Figure 2 shows six critical roles undertaken by software agents, including a managing agent, transport agents, traffic data fetcher, commuter agent, route recommender agent, and visualization agent.
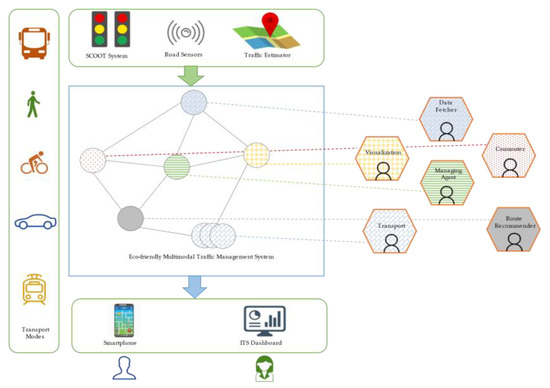
Figure 2.
The eco-friendly multimodal route guidance architecture using multi-agent computing.
These agents serve a specific goal ranging from the simulation of the physical transport infrastructure (e.g., road segments and traffic data), management of the agents, to interaction with commuters, as explained in Table 2.

Table 2.
Agent types used in our eco-friendly multimodal route recommender system.
Figure 3 summarizes the main actors that interact with our navigation routing system and describes how the system operates. Our system has three main entities, two located outside the system, namely the commuter and the urban traffic management and control authority (i.e., UTMC), and one located inside the system, namely software agents. The UTMC authority interacts with the system by providing the necessary traffic data at a regular interval. The authority collects static traffic data and real traffic information while considering various modes of transport (e.g., cars, trams, metro, bus, and trolleybus). It passes these data to the transport agents in the system. The commuter interacts with the system by submitting journey/commuting requests and modifying commuting preferences as desired. However, the software agents are responsible for simulating the transportation infrastructure, learning about the traffic characteristics of the environment, producing route recommendations, and responding to commuter queries. The execution of these functions relies on the interactions that take place between different agents in the system.
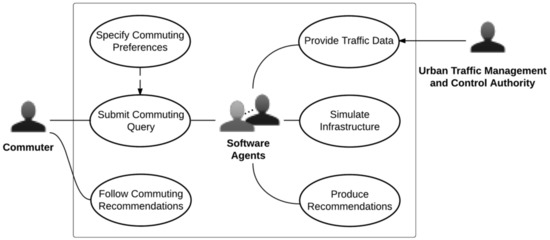
Figure 3.
Main use cases of the eco-friendly route recommender system.
3.2. Interactions of Software Agents
Figure 4 depicts a sequence diagram that explains the interactions between two agents and messages exchanged in order to produce a route recommendation for a commuter. In a nutshell, a sequence diagram captures the key objects of the system and exhibits the order of interaction between these objects during collaboration. The first message of the sequence diagram originates from the commuter who submits a journey request to the commuter agent, normally through a mobile app interface, which in turn reads the serialized message and extracts the commuter preferences, including the source, destination, departure time, and ideal modes of commuting (e.g., bus, metro, cycling, and walking). The commuter agent sends these trip details to the route recommender agent, which deciphers the request and calculates a routing solution given the knowledge it holds about the transport network. Finally, the recommended multimodal route is returned to the commuter mobile phone.
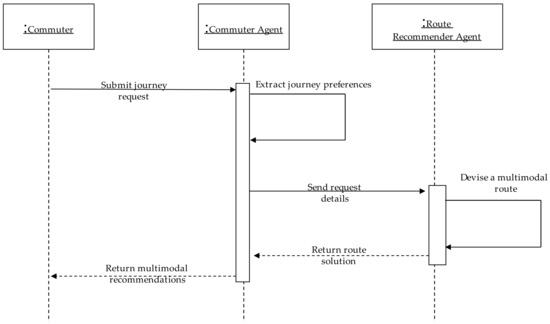
Figure 4.
A commuter journey request message sequence.
Figure 5 describes the interactions between three agents of the multimodal recommender system and one object outside the system (i.e., urban traffic management and control server) to update the agents’ internal state or knowledge base about the current situation of the transport network. This ensures that routing decisions are derived based on the latest status of the transport network. The traffic data fetcher, which plays the role of a sensing agent, requests real-time traffic data, e.g., from the UTMC server, which extracts and processes the raw sensory data and replies with the live traffic status (e.g., traffic density, average travel times, carbon emissions (g/m)) about the urban environment. Next, the traffic data fetcher forwards this information to the respective transport agents, which simulate the physical layers of the network. Only once the traffic updates become available, the traffic data fetcher agent sends these updates to the designated transport agents. Consequently, each transport agent updates its beliefs about the traffic network and its internal costs (i.e., estimated travel time and transport emission). Each transport agent sends a message containing the costs of using the transport segment that it represents to the route recommender agent, which in turn updates a table of journey objects holding the costs of all transport segments of the city being modeled. This table of journey objects is searched to retrieve the fastest or eco-friendliest routes depending on user queries. It is worth noting that this interaction sequence is repetitive. Therefore, the transport agents are updated with the status of traffic conditions every τ minutes.
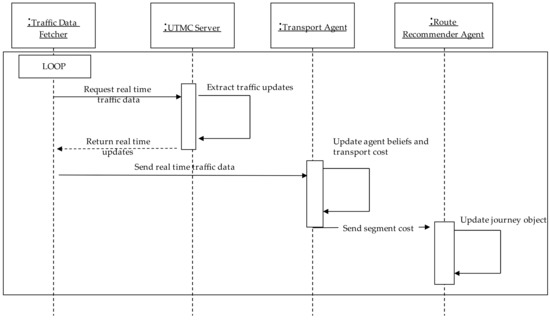
Figure 5.
A traffic updates message sequence. UTMC, urban traffic management and control.
Some notable advantages of our multiagent architecture include flexibility and extensibility. Indeed, the multi-agent architecture can be extended easily with new types of agents to account for other modes of transport (e.g., flight, ferry) or with other agents to optimize travel costs and solutions provided. Our multimodal recommender system can also be adjusted to accommodate any urban city regardless of the complexity of the traffic management system (for example, cities where real-time information is unavailable owing to lack of road monitoring sensors).
3.3. Implementation of the Backend of the Multimodal Route Guidance System
Indeed, there is a myriad of agent-oriented simulation frameworks for implementing multi-agent systems [59,60], such as D-MASON [61], LightJason [62], and JADE [63], among others. In our selection, we considered (1) open-source frameworks and (2) execution time of the framework and speed of transferring messages between the software agents in the simulated environment. Based on these criteria, we selected the AGlobe framework [64] for implementing the backend of our multimodal recommender system. There are several motifs for selecting AGlobe to tackle the prevalent traffic management challenges, including the suitability for real-world simulations, fast execution, ease of use, portability, lightweight, high scalability, and support for static and mobile objects [65,66]. AGlobe is Java-based and exhibited the least message communication overhead compared with other agent-oriented modeling frameworks and the smallest memory requirements to create software agents in the environment [64]. Using a Java-based framework was strategic for many reasons such as portability, efficiency, and support for network-centric applications. These criteria are essential for modeling and simulating urban cities effectively.
In a nutshell, AGlobe is a lightweight agent-based modelling platform, which comprises five main components, namely, the agent platform, agent container, services, environment simulator, and software agents [67]. The agent platform provides the necessary resources and libraries to host the agent containers. The platform runs as a Java application on top of the Java virtual machine (JVM) runtime environment, with the opportunity of creating and running up to 1000 platforms in parallel within the same workstation. The agent container exists within a specific platform and offers a set of low-level functions for storing and enabling communication between the agents. The available services (i.e., user and system services) are associated to one or several agent containers. The environment simulator agent helps to model real-world scenarios and control the communication between the various containers. The agents are the building blocks in a simulated environment where they ran as separate threads with basic functions such as the ability to execute on remote agent containers. Further details regarding the inner workings of the AGlobe framework are provided in [67]. We would like to emphasize here that it is possible to implement our multimodal traffic recommender architecture using other agent platforms and frameworks, such as those listed in [68].
4. Modelled Transport Layers and Traffic Properties
The proposed architecture is capable of simulating a complex urban transport network with its varied transport layers. In effect, a physical transport layer can be defined as a set of interconnected segments. Figure 6 depicts the seven layers that are modeled by the software agents. These transport layers cover road segments, public transport (bus, trolleybus, metro, tram) segments, bicycle segments, and walking segments. As shown in Figure 6, each mode of transport is represented by agents in a layer, which can interact with a segment of other layers (i.e., a different transport mode). So, an agent is connected to agents of the same type (i.e., same transport mode) and agents of other types (i.e., different transport mode) to enable multimodal collaboration.
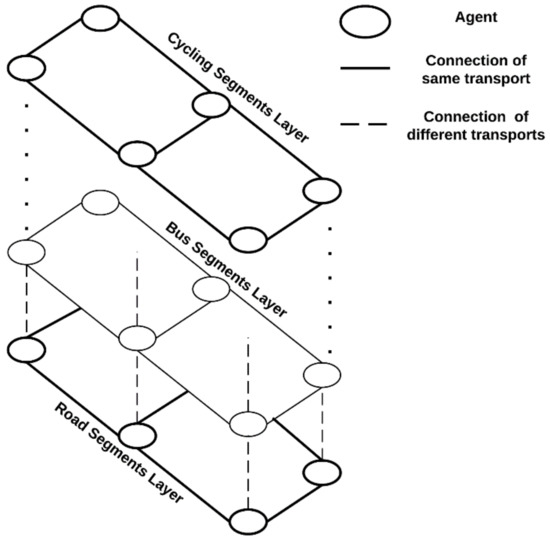
Figure 6.
Interconnected layers of transport segments.
Each segment in the transport layer has static and dynamic characteristics. The static characteristics define the physical aspects of the segments, such as the length, Global Positioning System (i.e., GPS) coordinates, and number of lanes. However, the dynamic characteristics refer to traffic stream properties (e.g., flow, speed) that change over time based on the data received from the road sensors and SCOOT system [69]. During the route recommendation, the system considers the capacity of the modes of transport with the aim of balancing between the use of the network on the one hand and the demands of the commuters on the other hand.
Table 3 summarizes the specific characteristics of the transport network that our system models when attempting to provide the fastest or eco-friendliest route guidance. The static characteristics of transport are properties of the physical transport network and are thus extracted from the Open Street Map (i.e., OSM). These properties are generally not linked to the behavior of travelers. Practically, for each segment in the network layer, the system collects static (e.g., length of road lanes, number of lanes, segment location) transport information.

Table 3.
Traffic characteristics of the transport segments.
Various agent types are used to model the traffic network, where each agent, referred to as a transport agent in our study, can be used to simulate one type of transport mode, e.g., buses, trolleybuses, metros, trams, bicycles, and walking. The transport map is divided into interconnected segments where each software agent simulates a single transport link instead of the whole roads. Consequently, multiple transport network layers are created (e.g., road network, bus network, and so on) by the system. The agents hold different static and dynamic information about the traffic. Despite their differences, these agents interact and collaborate to assist in the creation of the most appropriate multimodal route while considering user preferences and traffic conditions. Figure 7 highlights the exact properties of each agent while simulating various transport modes. Every agent will aim to keep commuters’ demands within the capacity of the segment it models.
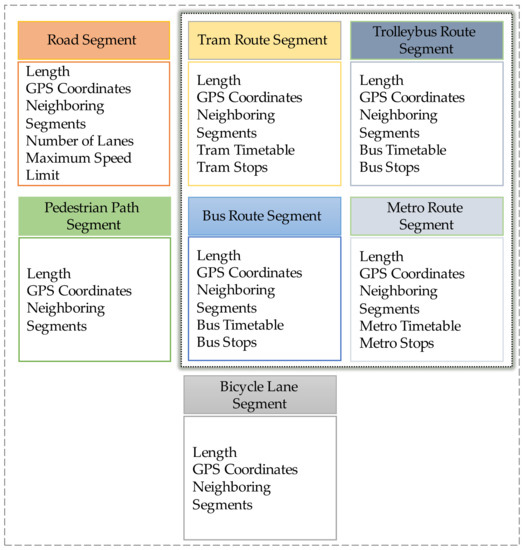
Figure 7.
Multimodal agents and their transport properties.
Next, the system models the dynamic (average speed, travel time, carbon emissions) traffic characteristics, which are obtained from the SCOOT system [69] and the traffic data estimator on a regular basis. We are estimating the carbon emissions for each transport segment based on the traffic patterns extracted from the historical and current congestion data. The historical data were collected the from the SCOOT system and roadway sensors. The patterns are produced using the traffic data estimator on a regular basis, e.g., every 5 min, and they comprise three traffic variables, namely, the average speed, traffic flow, and traffic density on a specific segment. However, the real-time predictions of travel times and CO2 emissions (gram per km) for all transport segments are calculated using the real-time prediction tool (refer to Figure 1).
5. Multimodal Route Planning and Guidance
The route recommender agent uses collective information about different regions (macroscopic) in the urban environment, such as available public transports in the region, as well as required information about road segments such as travel time and CO2 emissions to calculate the fastest and eco-friendliest routes. Each route-finding agent deals with one commuter request at a time, so that a cluster of route-recommender agents enables the multimodal recommender system to handle multiple commuter requests in parallel. Once the commuter submits a route request indicating the type of route he favors (i.e., the fastest or eco-friendliest), the route recommender agent searches the transport layers and computes a multimodal route that satisfies the commuter preferences (e.g., departure time). In this research, we used the Dijkstra algorithm [49] to find the route between two segments with the least cost, where cost is estimated as the total journey time (in the case of the fastest route) or CO2 emissions (in the case of the eco-friendly route), as summarized in the formula below. The cost of occupying a route solution is the aggregation of travel time and carbon footprint of all segments making up the route. Our recommendations aimed at reducing carbon emissions by inducing travel behavior change rather than improving the execution time of route planning and calculation.
where x is the origin segment, y is the destination segment, α is the number of road (C) segments in the solution, β is the number of public transport (PT) segments, γ is the number of bike (Bk) segments, and δ is the number of pedestrian (W) paths. It is worthwhile to point out here that we applied some heuristics to limit the number of switches between the different modes of transport based on the user preferences. Eventually, the shortest path finding algorithm achieves the objective of the simple formula by minimizing the cost of the suggested routes with respect to estimated travel time and CO2 emissions.
In an ideal scenario, the fastest route should include the use of cars with minimum idle time, resulting in fewer carbon emissions. Travel time is estimated in miles per second. However, the eco-friendliest route strives to combine public transport, cycling, and walking to promote sustainable travel behavior. Carbon emission is estimated in grams per kilometer. Whenever possible, the route recommender agent suggests the eco-friendliest route instead of the fastest route.
6. Recommender System Scalability and Validation
The empirical assessment was performed to verify that our system conforms to its operational specification as a scalable multi-agent system. The assessment also verified the solitary operation of the proposed system for modeling traffic infrastructure and its scalability for supporting larger traffic networks. All tests were carried out after the integration of the multimodal route guidance tool with the traffic data estimator and traffic management user interface.
6.1. Scalability and Validation
The correctness of the traffic infrastructure model and its primitive scalability are assessed by verifying the number of created software agents, which represent road and public transport segments. The agents’ initiation logs and console printouts enable checking the conformity of the agents created with the actual number of road and public transport segments retrieved from the static maps of our trial cities, namely Nottingham (United Kingdom) and Sofia (Bulgaria). Overall, we modeled approximately 4900 road segments, 267 bus segments, and 15 tram segments in the city of Nottingham, and 8440 road segments, 401 bus segments, 118 trolleybus segments, 157 tram segments, and 18 metro segments in the city of Sofia. These segments exclude service and residential roads.
The scalability of the proposed system is a critical factor for verifying system support for larger urban areas. Such scalability can be restricted by the computational (server) resources made available. In particular, the computational processing power and dedicated memory needed to initialize the system with the transportation infrastructure of the urban area, such as roads, pedestrian and cyclist paths, public transport, and their interconnections. Figure 8 depicts the performance of our multimodal route guidance system on three different machines in terms of the maximum number of agents and their initiation times.
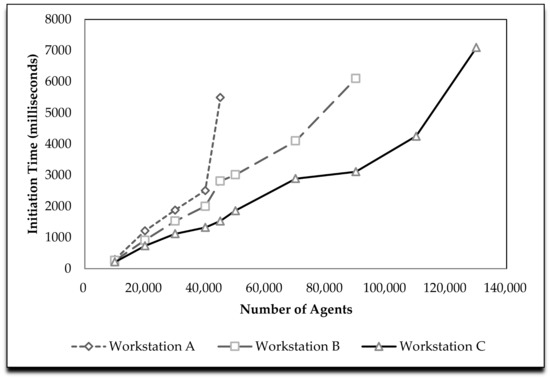
Figure 8.
Number of software agents initiated on three distinct workstations.
We tested the initiation of software agents in three different workstations, namely, machine A (with the following technical specifications: 2.7 GHz Opteron VM, 2 GB, Linux, 32-bit), machine B (with the following technical specifications: 2.8 GHz Intel Core i5, 2 GB, Linux, 32-bit), and machine C (with the following technical specifications: 3.1 GHz Intel Core i5, 4 GB, Win-7, 64-bit). Figure 8 shows that machine C creates more software agents (140,000 agents) in the environment than machine B (90,000 agents) and machine A (45,000 agents). This might be explained by the larger memory size of machine C. Moreover, machine C creates more agents than machine B and A for the same execution period. Within 2 s, machine C initiated approximately 56,000 agents, while machine B initiated 40,000 agents and machine A initiated 32,000 agents. This technical testing demonstrated the suitability of AGlobe in creating agent-based environments that are appropriate for modeling urban cities within reasonable times.
The purpose of creating the agents was to (1) pinpoint the hardware requirements for running the multimodal recommender system and (2) confirm the scalability of the platform and its ability to model a big number of transport segments. Overall, it was shown that a workstation with 4 GB of RAM enables us to create and simulate up to 140,000 physical transport segments. Figure 8 shows that these software agents (i.e., 140,000 agents) are initiated within approximately 7 s. It can also be noted that increasing the memory capacity of the workstation helps to accommodate for more transport segments in a particular city. Ideally, an agent-based implementation framework that empowers the creation of more agents to represent the full infrastructure of the city simply means the ability to support flexible multimodal route planning.
The multimodal route guidance tool implements a visual web interface for traffic management operators to view and monitor the status of city traffic. This module over-lays (1) the physical transport network and (2) traffic updates received from traffic congestion data estimator on the Open Street Map images. The visualization tool depicts a live view of the traffic of the city and empowers the operators to test the recommender system. Generally, the backend of the multimodal recommender system pushing transport data (i.e., map of the city to be visualized), traffic updates (density, flow, CO2 emissions, and so on), and route solutions to the connected web clients. Using a web client, the traffic operator can initiate a route request (source and destination) or block certain segments because of, e.g., roadworks, as shown in Figure 9. Multiple journey requests might be sent from different web clients (i.e., several traffic operators). Concerning the implementation the web visualization tool, the publicly available and free Open Street Map (OSM) was used to show the transport networks. The OSM is well maintained and continually updated by contributors from around the world. However, we used the Leaflet web framework to overlay traffic information on top of the OSM map and deliver the results to different devices including mobile interfaces. The communication between the multimodal recommender backend and the visualization web clients occurs using a full-duplex communication framework (e.g., Spring WebSocket).
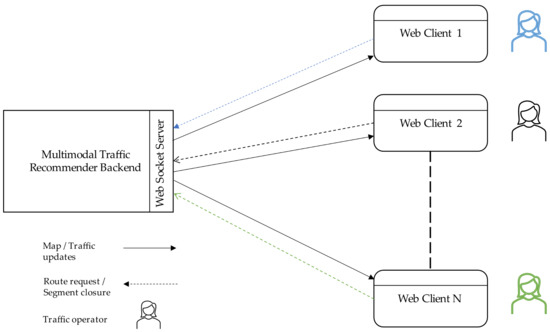
Figure 9.
Multimodal recommender system to web clients communication.
The provided web clients empower traffic operators to observe the traffic conditions of different modes of transport and test various scenarios to check the impact of their decisions. These clients are accessible using popular web browsers, e.g., Chrome, without the necessity to install any third-party software. The visualization interface comprises a total of five useful sections and features, as depicted in Figure 10a. The top section shows a pre-defined list of cities (for example, Sofia in Bulgaria, Coventry and Nottingham in the United Kingdom) to be simulated by the multiagent traffic management system. The second section enables the operator to submit a route request, containing some commuting preferences, such as the trip origin, trip destination, and type of route desired. The returned results yield the best route that satisfies these preferences, a mix of modes of transport, and estimated travel time and carbon emissions of the journey. The third section overlays the selected transport networks on top of the OSM map. The forth section allows the traffic operator to manipulate the traffic forecasts within a 30 min window and show various traffic attributes. The fifth and last section can be used to inspect specific route solutions. Furthermore, the traffic operators are supplemented with a k-shortest paths planner tool to simulate traffic conditions (e.g., number of vehicles, type, departure time) and observe its instant impact on route planning and guidance (Figure 10b).
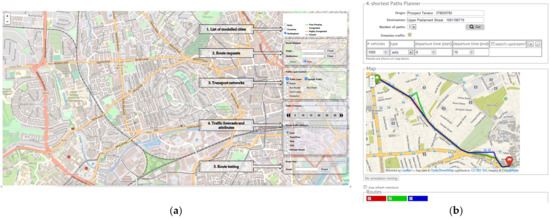
Figure 10.
(a) A visualization web client for the traffic management center operators, with Open Street Map (OSM) set to Nottingham (United Kingdom). (b) K-shortest path planner tool.
Figure 11 depicts the road segments, public transport segments, and public transport stops in the city of Sofia (Bulgaria). Different colors are used to depict the level of traffic congestion (heavy, medium, low) in the transport segments of the designated city. The regular traffic updates can be seen on the OSM map or verified through the log files. Moreover, the visualization tool provides a mechanism to test the quality of route recommendations. To this end, one can submit a commuting request that comprises a source and destination, departure time, and selected modes of transport. The submitted journey request is then passed to the route recommender agent for handling.
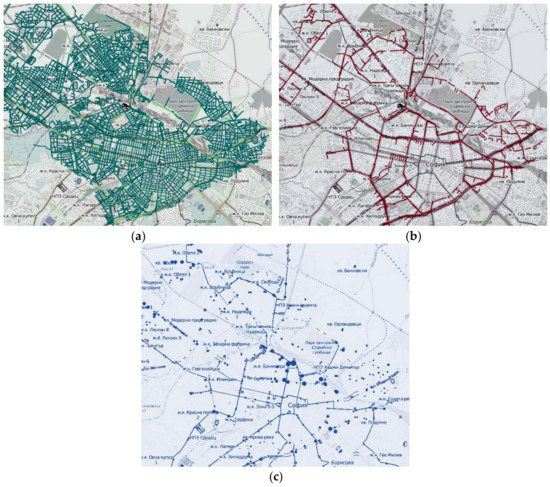
Figure 11.
(a) Road segments; (b) public transport segments; and (c) public transport stops (clockwise from top-left) overlaid on Sofia Open Street Map, where the segments represent agents.
We tested the accuracy of the multimodal routes by generating several random route requests. On every occasion, the visual interface showed receipt of the request and drawing of the route solution on the OSM map for the fastest and eco-friendliest routes. For example, Figure 12 suggests two route plans for the same journey request in Nottingham (United Kingdom). It can be seen that the fastest route includes road segments, while the eco-friendliest route avoids the same segments that might induce higher CO2 emissions. The route recommender system estimates that the fastest route will take approximately four and half minutes, producing 2.5 kg of carbon emission. On the other hand, the eco-friendly route is predicted to produce 2.0 kg of carbon emissions.
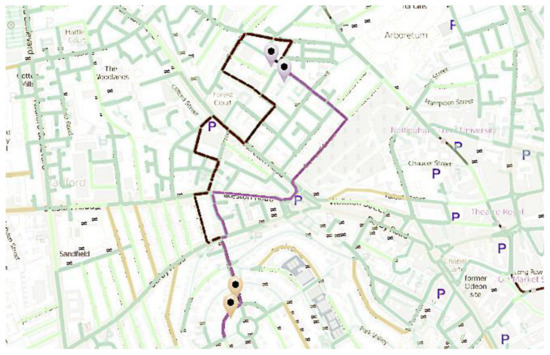
Figure 12.
The fastest (dark) and eco-friendly (light) route recommendation in the city of Nottingham.
6.2. Multimodal Route Guidance Evaluation
To evaluate the performance of the proposed multi-agent recommender system, we use a benchmarking method. This evaluation method allows us to compare the proposed multi-agent system with some well-known route calculation systems, such as Google Maps. Google Maps route calculation relies on floating vehicle data; it uses the location services available in the smartphones to present the traffic situation on roads. They can model real-time road traffic situations, but mostly for main roads. On the other hand, our proposed EMRG system relies on more data sources such as the SCOOT system, Bluetooth Travel Time sensors, and floating vehicle data (buses live locations and speeds). SUMO traffic estimator in the EMRG system extrapolates sensory information to the whole urban traffic infrastructure. In this sense, the EMRG system is always provided by real-time traffic information for some roads (where the monitoring equipment or sensors are installed), and it extrapolates, by taking the traffic history into account, to every single road, regardless of their type and capacity.
6.2.1. Route Calculation for Driving
In a comparative route calculation, we can observe some differences between our EMRG system and Google Maps. In most scenarios, Google Maps route finder suggests more than one route and picks the one with the fastest travel time. The EMRG system always returns the best route (one route), which is fastest and greenest, i.e., with the least CO2 emissions (Figure 10). On the other hand, with the availability of traffic information for all roads, including minor roads, owing to the extrapolated traffic information from all urban roads, the EMRG system can recommend routes via minor roads when the main roads are congested or when the user is likely to produce higher carbon footprint by using the main roads. This feature does not seem to be available in Google Maps as the traffic information is available only from the main roads (Figure 13).
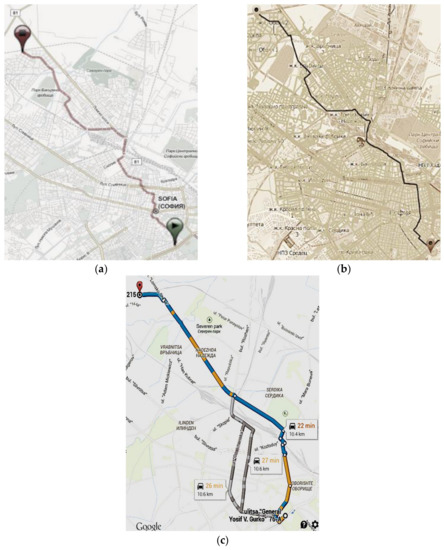
Figure 13.
A comparative driving route calculation (in city of Sofia): (a) eco-friendly multimodal route guidance system (EMRG) user app; (b) traffic management web visualization; (c) Google Maps (clockwise top-left).
6.2.2. Route Calculation for Public Transport
Our multimodal recommender system uses the bus, tram, metro, and trolley bus agents to calculate public transport routes. Along with the static timetables, waypoints, and stops, our EMRG system uses live updates for all means of public transport. The live update mechanism enables our system to provide route-finding services with accurate journey start time, travel time, and expected arrival time. As an example, Figure 14 shows the same route request handled by our EMRG system and Google Maps. In the Google response, we can see a recommended route with two partial bus journeys. The total travel time suggested by Google is 26 min. On the other hand, the suggested route by the EMRG system includes a tram and a bus journey, and the estimated journey time is 34 min.
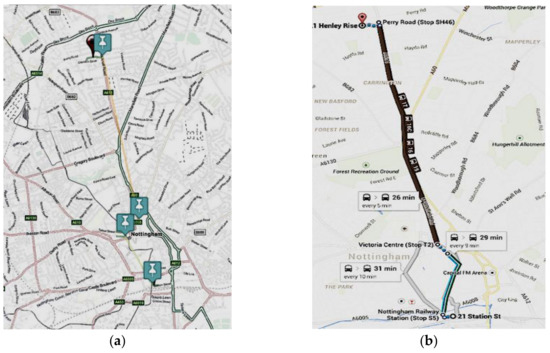
Figure 14.
A comparative public transport route calculation (in Nottingham): (a) EMRG result; (b) Google Maps result.
After looking into the logs, we could find a dynamic travel update for the first bus journey recommended by Google, showing a delay of 10 min. This shows the Google route was calculated using static bus timetables. However, our EMRG system used the dynamic timetable of public transport to suggest a travel time of 36 min for the same journey. Therefore, when compared against the more accurate and dynamic timetable of public transport journey route (i.e., 36 min), the EMRG system initially recommended a shorter and greener route, which included a tram and a bus journey with a journey time of 34 min.
We also tested the EMRG system for public transport route recommendations in a larger city, i.e., Sofia, and, as the results imply, the system could successfully recommend the use of combined public transport means, e.g., bus and trolleybus, as shown in Figure 15. We were unable to compare the results of public transport recommendations by the EMRG system with Google Maps as they do not support public transport recommendations in parts of Sofia yet.
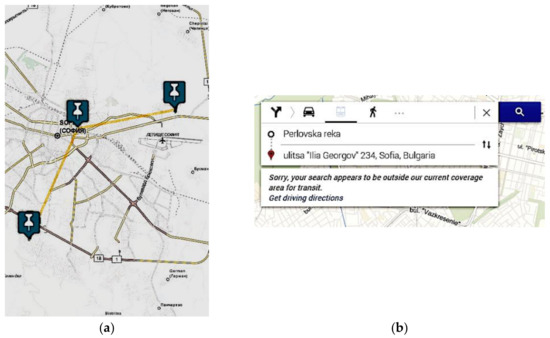
Figure 15.
A comparative public transport route calculation (in Sofia): (a) EMRG result; (b) Google Maps result.
The purpose of this quick benchmark is to show some instances where our system outperforms existing route planning systems, such as Google Maps. We demonstrated that we provide multimodal solutions for certain areas where public transportation services are not accounted for by Google Maps. The intention here is not to conduct a fully-fledged comparison experiment against Google Maps, but rather to show that, in some instances, we can provide better results. In future experiments, we plan to compare our solution against mainstream navigation systems, such as Google Maps and Apple Maps. On this occasion, the main purpose of the research is to demonstrate that our proposed route guidance system can trigger a sustainable travel behavior and change commuting decisions in favor of using public transportation.
7. Commuters’ Acceptance of the Multimodal Traffic Recommendation System
7.1. Pilot Study
Assisted by the Nottingham City Council (NCC) and Sofia Urban Mobility Center (SUMC), several users were recruited in both cities to take part in a pilot study. The users utilized the EMRG app for their regular home-to-work and work-to-home journeys for two weeks. The analysis shows that 70 and 478 trips were completed for Nottingham and Sofia, respectively. In Nottingham, 4.4% of the journey requests were submitted for the fastest route (car only), and 95.6% were made for the green route (a mix of public transport, walking, and cycling), whereas in Sofia, 10.38% of the requests were submitted for the fastest route and 89.62% for the green route.
Considering the reports of average emissions in different modes of transport [70], it is crucial to encourage commuting using public transport. For example, in the United Kingdom (Nottingham), the average emissions by private cars are estimated at 133.7 gCo2e/km for petrol cars and 133.3 gCo2e/km for diesel cars. In the same report, the average emission for buses is estimated as 111.6 gCo2e/passenger per km and 61.7 gCo2e/passenger per km for trams. Therefore, as the initial analysis suggests, 4.4% of 70 users produced 3.08 × 133.5 gCo2e/km or 411.18 gCo2e/km, whereas 95.6% of 70 users produced 66.92 × 111.6 gCo2e/km or 7.468 KgCo2e/km, in the worst public transport option (buses) in terms of pollution. In comparison, if 100% of the commuters were using their private cars, the generated emissions could amount to 70 × 133.5 or 9.345 KgCo2e/km. The difference of around 2 Kg of CO2 emissions per kilometer for just 70 commuters reveals the importance of encouraging public transport and utilizing green route recommendations, hence the importance of a route recommender that promotes CO2 emission awareness.
7.2. Field Trials
Motivated by the positive outcomes of the pilot study, we carried out two large-scale field trials to assess the effectiveness of our system in inducing sustainable travel behavior. To this end, we subjected the traffic management system to testing in two real environments, namely Nottingham (United Kingdom) and Sofia (Bulgaria). We started by recruiting participants who fulfill two criteria: (1) they live within the specified areas of the maps depicted in Figure 16; and (2) the participants usually commute to work by driving, cycling, walking, or public transport such as buses and trams. It is worth noting that the selected areas exhibit high traffic density and support the use of multiple modalities. Participants were recruited by distributing brochures and flyers in parking lots and metro stations, social media channels, two large SMS-campaigns, and emails targeting more than 10,000 users.
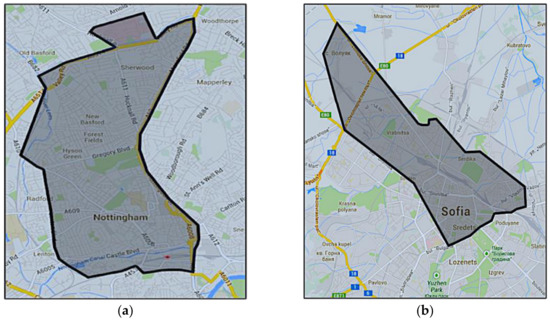
Figure 16.
Study areas and commuting corridors in (a) Nottingham (United Kingdom) and (b) Sofia (Bulgaria).
The trials were executed in two consecutive phases; the first phase consisted of at least five whole trips, while the second phase consisted of at least ten whole trips. Essentially, each trip involves going from location (A) to location (B) and returning from (B) to (A). Therefore, the participating commuters were requested to specify their departure location (A), coinciding with their home, and arrival location (B), coinciding with their workplace, before starting the actual trial. The trials were designed to inspect how our system could result in an effective travel behavior change during the trial period. The commuting trips were made during the weekdays (Monday to Friday). Weekends were excluded from the trials to avoid collecting noisy data in the travel behavior. To keep our commuters motivated and engaged in the trials, we offered an incentive in return for their participation at the end of the experiments.
Participants were requested to download our app, enable location tracking, input their routes, and record their daily journeys. At the end of the trials, participants were interviewed and asked to provide feedback about their commuting experience. All collected data were stored in a secured database and treated in strict confidentiality. We varied the trial scenarios to accommodate and test varying traffic demands. Our exemplary scenarios were as follows:
- Scenario 1: commuters driving in a congested area within the city.
- Scenario 2: drivers switching to green modes of transport.
- Scenario 3: commuters mixing several modes of transportation.
We were interested in investigating the below recommendations by our system, namely, alternative route planning, multimodal solutions, eco-friendly route guidance, real-time routing, and fast routing to avoid congestion.
A total of 280 potential commuters registered to take part in our experiments. Only 92 (32.85%) of the applicants fulfilled our selection criteria (i.e., filled out all trip details and lived or worked within the test sites). Thirty participants were registered in the Nottingham area and 62 participants were registered in the Sofia area. The age of the trial users varied between 19 and 65 years. When asked about their favorite modes of transportation, Nottingham participants indicated that taking the bus (93%) and walking (87%) were their preferred commuting modes. Similarly, Sofia participants selected the metro (89%) and trams (73%) as their preferred modes of transportation, as depicted in Figure 17. The exact locations of our participants in the trial cities are depicted in Figure 18.
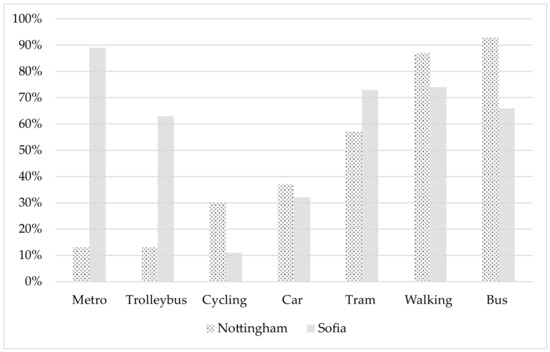
Figure 17.
Preferences of modes of transport by the trial participants.

Figure 18.
From-to locations of our trial commuters in (a) Nottingham (left) and (b) Sofia (right).
The total number of trips made in the first phase amounted to 408 (i.e., 56 trips in Nottingham and 317 trips in Sofia), while the trips made in the second phase amounted to 588 (i.e., 70 trips in Nottingham and 476 in Sofia). Therefore, the number of trips tallied to 126 in Nottingham and 795 in Sofia. When analyzing the travel times in both cities, we found that commuting peaks coincided with the morning (07:00–09:00 local time) and evening rush hours (16:00–18:00 local time).
We calculated the average CO2 emissions per trip from individual commuters in phase one. Overall, in 85% of the trips made in Nottingham and Sofia, users chose to commute using public transport (i.e., the eco-friendliest option), while the remaining trips were commuted via the fastest routes. A key metric for measuring the accuracy of our multimodal traffic management system is the estimated average travel time. On average, the difference between actual travel time and predicted travel time was (−9) min in Nottingham and (+0.5) min in Sofia. So, trips were faster than predicted in Nottingham and slightly later than predicted in Sofia.
In addition to the quantitative analysis, we carried out qualitative analysis of the feedback and reactions of the commuters with respect to the influence of the route guidance on their commuting experience. We aimed to find evidence of the effectiveness of our approach in inflicting travel behavior change. To motivate the analysis, we posited several questions as follows:
- How do commuters’ perceptions of the usefulness and usability of a multimodal route guidance system impact its use and adoption?
To answer this question, we conducted semi-structured interviews with 14 participating commuters (i.e., 12 commuters from Sofia and 2 commuters from Nottingham) about their opinions and attitudes concerning our concept and its influence on their travel behavior. The commuters were eight males and six females, and their age ranged between 26 and 40 years. Table 4 summarizes the general reactions of the commuters towards the concept of the multimodal traffic management system.

Table 4.
Commuters’ impressions about the multimodal recommender system. SUMC, Sofia Urban Mobility Center.
We also asked the commuters to rate their perception toward several aspects of the multimodal system. Generally, the respondents agreed that the multimodal traffic management system is useful for promoting sustainable travel behavior. Table 5 shows that the route planning and guidance app is perceived as easy to use (5.93) and provides clear interaction (5.93). More importantly, the participating commuters perceived the app as useful for the purpose of commuting (5.57).

Table 5.
Perceived usefulness and usability of the eco-friendly multimodal route guidance (EMRG) system (rating on a 7-point scale, where 1 = strongly disagree and 7 = strongly agree).
Finally, we asked our commuters about the potential impact of multimodal travel systems on promoting sustainable travel behavior and the environment (see Table 6). Moreover, commuters indicated their intention to continue using these types of travel information systems (5.92/7).

Table 6.
Impact of the multimodal travel guidance system on commuters’ travel behavior.
8. Implications and Limitations
The early results show that our multimodal solution is effective, to a certain extent, in changing travel behavior. This finding confirms previous claims that travel information, such as a bus timetable, impacts commuting decision making and travel behavior [15]. However, our research lacked a strong comparative experiment against existing systems. Table 1 lists some of the potential competitor frameworks and platforms; however, the comparison is not straight forward. For example, the authors in [53] presented a centralized architecture that aims to reduce journey times focusing on autonomous cars. Their solution balances the traffic flow of the city by considering the current and futuristic behavior of cars. On the positive note, the study simulates and validates the model in a European city using real traffic data and shows a reduction in travel times (up to 8%). On the other hand, it does not combine different modes of transport. In our view, our system cannot be directly compared to, e.g., the model presented in [53] because of obvious differences, including (1) our focus was on the scalability of the architecture to accommodate big metropolitan cities, (2) the combination of multiple types of transport, (3) the infliction of commuting behavior change, and (4) the estimation of CO2 emissions. Although our system suggested faster routes, it was meant to work as an alternative for those commuters who could give up using their cars for traveling. Instead, we conducted a preliminary comparison against mainstream solutions, such as Google Maps, and the results are encouraging. In the future, we plan to benchmark the performance of our architecture against a myriad of traffic management solutions.
Our architecture is unsurprisingly layered because it distinguishes and accommodates different types of transport modes. Layering the transport architecture enables us to represent its infrastructure using different types of software agents. In effect, each software agent type models segments that have similar physical characteristics. In our view, the layered architecture brings about multiple advantages, such as flexibility, modularity, and maintainability (e.g., separation of concerns), among other attributes. On the other hand, using a single type of agent (i.e., a non-layered architecture) to represent all transport segments is inefficient (i.e., with respect to computational resources and storage) and might introduce challenges if extensions or changes to the architecture are required.
Even though the software agents contribute towards resolving common goals within the same system, they are naturally autonomous and independent entities capable of making their own decisions and can exist in remote environments independently. No single agent has a global view of the whole system, but rather it has a partial understanding of the conditions of the environment unlike centralized systems. Multiagent systems are also called self-organized systems as agents can exercise self-control and exhibit complex behaviors without any intervention from a monolithic entity.
Implementing our intelligent multimodal traffic management architecture in a real environment, based on Figure 1, would result in cost implications. Firstly, our traffic management system would need to have traffic road sensors deployed in several parts of the transport network to feed the traffic data predictor so that reasonable traffic predictions are produced. The cost is highly reliant on (1) the number of sensors, which depends directly on the size of the city and number of roadway segments; (2) the type of sensors to be used (e.g., inductive loop inductors, radar, cameras, acoustic sensors, infrared sensors, and so on [71]); and (3) the purpose of using the sensors [72]. The costs of road sensing and monitories technologies ranges from 385 to 26,000 USD per unit [73]. In fact, there are advantages and disadvantages to using different road sensing technologies and, thereby, making an accurate estimation of the cost of our system is not a straightforward activity. However, we recommend installing road sensors for the main road segments and frequent bottlenecks, where high traffic volumes are anticipated. The data collected from these transport segments should supply sufficient lead information for the system to predict and organize the traffic to an acceptable degree.
There are further limitations that we would like to acknowledge here. The duration of field experiments could have been prolonged to observe more realistic and stable route calculations and predictions by the proposed system in different scenarios. Moreover, the number of commuters who took part in the experiments could be increased to solidify the findings of the study. The trial studies were conducted in two European cities with a specific set of conditions and infrastructure. The expansion of the trial studies to other metropolitan cities with huge and varying infrastructure, like London or Paris, could have properly tested the system reliability. Likewise, modelling a bigger city requires stronger computing power and infrastructure to simulate its transport segments. Furthermore, the focus of this study was not on route optimization with respect to execution time; therefore, only the k-shortest path Dijkstra algorithm was deployed. Some other algorithms could have been tested to observe the change in the route predictions and optimization of travel behavior.
The main purpose of the system is to convince commuters to take eco-friendly means of transport; however, we also provide the fastest route for those commuters who do not wish to take public transport. The recommender system uses estimations of future journey times (refer to Figure 1) instead of actual journey times to produce the fastest route. Travel time predictions are received every 30 min. This way, traffic is actually dispersed from bottleneck areas before traffic jams occur. However, we did not calculate the time reduction in the overall travel time. We believe this necessitates a separate experiment. Our architecture conducted macroscopic modelling where the whole road segments were modeled; however, the microscopic modelling, at the level of individual vehicles, could have been included to inspect its impact on the overall behavior of the system and the route recommendations. Lastly, a follow-up study with the users should have been conducted to accurately determine whether our system truly has a long-lasting impact on the choice of transportation modes of the commuters.
9. Conclusions and Future Directions
In this paper, we described the conceptual design and implementation of an eco-friendly multi-modal route guidance (EMRG) system. This system simulates and combines seven modes of transport, namely, roads, buses, trolleybuses, trams, metros, bicycles, and walking, to promote sustainable travel behavior in urban cities where traffic congestions and carbon emissions are among the most prevalent challenges. Our proposed intelligent transport system employs multiple software agents to represent and realize the simulation of the infrastructure and traffic conditions of an urban environment, and accordingly recommends two types of route solutions. The first suggested route is fast and tries to avoid congested road segments, thus balancing the traffic stream in the transport network and reducing the journey time. However, the second suggested route is eco-friendly for it endeavors to mix public transport, cycling, and walking, thus reducing the carbon footprint of trips. Moreover, our proposed system proved to be scalable in terms of accommodating new agents. Implementing and scaling the number of agents could also be performed with ease. Moreover, more modalities of transportation could be added in the infrastructure.
An initial pilot study was carried out, and the results showed that the proposed ITS can provide useful route recommendations, which are based on the live traffic and public transport information provided to the system. The pilot study demonstrated the scalability and adaptability of the ITS in different deployments, irrespective of their differences in the traffic infrastructure. Furthermore, we have undertaken two trial studies in two representative European cities, namely Nottingham (United Kingdom) and Sofia (Bulgaria), to demonstrate the usefulness and practicality of our approach. Ninety-two real commuters took part in the experiments and gave their impressions about the usability and effectiveness of our multimodal traffic management system. Overall, 85% of the selected trips were green routes, which demonstrates the effectiveness of the system in promoting green travel.
Our future works aim to augment the ITS recommender system with computational intelligence (e.g., machine learning and data analytics) to, firstly, predict traffic jams and incidents based on the commuting patterns and, secondly, suggest multimodal routes that evade congestions and delays based on these predictions. In addition to travel time and carbon emissions, we intend to consider other traffic metrics like traffic delays, queues, and accidents for route calculations. We also plan to explore the societal impact of our route recommender system with its emphasis on eco-friendliness to prove how such a system can really influence and encourage commuters to uptake commuting decisions that consider environmental factors. Furthermore, we envision to introduce a commuter profiling mechanism that could aid them in decision making based on various factors related to their internal and external constraints, past experiences, habits, preferences, and values, among others. We intend to compare the journey times of the predicted routes by our ITS recommender system to existing route optimization and planning systems.
Author Contributions
Conceptualization, A.N., N.M., and E.P.; Formal analysis, A.N. and A.T.; Funding acquisition, N.M. and E.P.; Methodology, A.N.; Resources, A.N. and A.A.; Software, A.N. and J.A.; Validation, A.N., N.M., E.P., and J.A.; Visualization, A.A. and J.A.; Writing—original draft, A.N., A.T., J.A., and N.M.; Writing—review & editing, A.N. and A.T. All authors have read and agreed to the published version of the manuscript.
Funding
This research was funded by the European Union, under grant number 288205, and the APC was funded by the authors.
Institutional Review Board Statement
Not applicable.
Informed Consent Statement
Informed consent was obtained from all subjects involved in the study.
Data Availability Statement
Data sharing not applicable.
Acknowledgments
We would like to acknowledge and thank the participants of the field trials in Nottingham (UK) and Sofia (Bulgaria) for taking part in this research. We extend our thanks to the Nottingham City Council (NCC) and Sofia Urban Mobility Center (SUMC) for the assistance in conducting the field trials in the cities of Nottingham and Sofia, respectively.
Conflicts of Interest
The authors declare no conflict of interest. The funders had no role in the design of the study; in the collection, analyses, or interpretation of data; in the writing of the manuscript; or in the decision to publish the results.
References
- Sun, D.J.; Zhang, Y.; Xue, R.; Zhang, Y. Modeling carbon emissions from urban traffic system using mobile monitoring. Sci. Total Environ. 2017, 599, 944–951. [Google Scholar] [CrossRef] [PubMed]
- De Souza, A.M.; Brennand, C.A.; Yokoyama, R.S.; Donato, E.A.; Madeira, E.R.; Villas, L.A. Traffic management systems, A classification, review, challenges, and future perspectives. Int. J. Distrib. Sens. Netw. 2017, 13, 155. [Google Scholar] [CrossRef]
- Mehmood, Y.; Ahmad, F.; Yaqoob, I.; Adnane, A.; Imran, M.; Guizani, S. Internet-of-things-based smart cities: Recent advances and challenges. IEEE Commun. Mag. 2017, 55, 16–24. [Google Scholar] [CrossRef]
- Plötz, P.; Funke, S.Á.; Jochem, P. The impact of daily and annual driving on fuel economy and CO2 emissions of plug-in hybrid electric vehicles. Transp. Res. Part A Policy Pract. 2018, 118, 331–340. [Google Scholar] [CrossRef]
- Thiel, C.; Schmidt, J.; Van Zyl, A.; Schmid, E. Cost and well-to-wheel implications of the vehicle fleet CO2 emission regulation in the European Union. Transp. Res. Part A Policy Pract. 2014, 63, 25–42. [Google Scholar] [CrossRef]
- European Commission. Transport Emissions in the European Union, Current Trends and Issues. Available online: https://ec.europa.eu/transport/sites/transport/files/2019-transport-in-the-eu-current-trends-and-issues.pdf (accessed on 3 October 2020).
- European Commission. Transport Emissions a European Strategy for Low Emission Mobility. Available online: https://ec.europa.eu/clima/policies/transport_en (accessed on 3 October 2020).
- Mangiaracina, R.; Perego, A.; Salvadori, G.; Tumino, A. A comprehensive view of intelligent transport systems for urban smart mobility. Int. J. Logist. Res. Appl. 2017, 20, 39–52. [Google Scholar] [CrossRef]
- Soon, K.L.; Joanne, M.L.; Parthiban, R. Coordinated Traffic Light Control in Cooperative Green Vehicle Routing for Pheromone-based Multi-Agent Systems. Appl. Soft Comput. 2019, 81, 105486. [Google Scholar] [CrossRef]
- Liu, H.; Ying, L.; Yanjie, F.; Huaibo, M.; Jingbo, Z.; Xu, M.; Hui, X. Polestar: An Intelligent, Efficient and National-Wide Public Transportation Routing Engine. In Proceedings of the 26th ACM SIGKDD International Conference on Knowledge Discovery & Data Mining, San Diego, CA, USA, 23–27 August 2020; pp. 2321–2329. [Google Scholar] [CrossRef]
- Railsback, S.F.; Grimm, V. Agent-Based and Individual-Based Modeling: A Practical Introduction, 2nd ed.; Princeton University Press: New Jersey, NJ, USA, 2019. [Google Scholar]
- Dorri, A.; Kanhere, S.S.; Jurdak, R. Multi-agent systems: A survey. IEEE Access 2018, 6, 28573–28593. [Google Scholar] [CrossRef]
- Kammoun, H.M.; Kallel, I.; Casillas, J.; Abraham, A.; Adel, M.A. Adapt-Traf: An adaptive multi agent road traffic management system based on hybrid ant-hierarchical fuzzy model. Transp. Res. Part C Emerg. Technol. 2014, 42, 147–167. [Google Scholar] [CrossRef]
- Sierpiński, G.; Staniek, M. Heuristic approach in a multimodal travel planner to support local authorities in urban traffic management. Transp. Res. Procedia 2017, 27, 640–647. [Google Scholar] [CrossRef]
- Skelley, T.; Namoun, A.; Mehandjiev, N. The impact of a mobile information system on changing travel behaviour and improving travel experience. In Proceedings of the International Conference on Mobile Web and Information Systems, Paphos, Cyprus, 26–29 August 2013; Springer: Berlin/Heidelberg, Germany, 2013; pp. 233–247. [Google Scholar]
- Gössling, S. ICT and transport behavior: A conceptual review. Int. J. Sustain. Transp. 2018, 12, 153–164. [Google Scholar] [CrossRef]
- Sunio, V.; Schmöcker, J.D. Can we promote sustainable travel behavior through mobile apps? Evaluation and review of evidence. Int. J. Sustain. Transp. 2017, 11, 553–566. [Google Scholar] [CrossRef]
- Guo, Y.; Peeta, S. Impacts of personalized accessibility information on residential location choice and travel behavior. Travel Behav. Soc. 2020, 19, 99–111. [Google Scholar] [CrossRef]
- Patriksson, M. The Traffic Assignment Problem: Models and Methods; Courier Dover Publications: Mineola, NY, USA, 2015; pp. 1–219. [Google Scholar]
- Simoni, M.D.; Christian, G.C. A simulation framework for modeling urban freight operations impacts on traffic networks. Simul. Model. Pract. Theory 2018, 86, 36–54. [Google Scholar] [CrossRef]
- Sun, J.; Liu, H.; Zian, M. Modelling and simulation of highly mixed traffic flow on two-lane two-way urban streets. Simul. Model. Pract. Theory 2019, 95, 16–35. [Google Scholar] [CrossRef]
- Cui, N.; Bokui, C.; Zhang, k.; Zhang, Y.; Liu, X.; Zhou, J. Effects of route guidance strategies on traffic emissions in intelligent transportation systems. Phys. A Stat. Mech. Its Appl. 2019, 513, 32–44. [Google Scholar] [CrossRef]
- Idel, M.Y.; Ahmed, N.E.; El Alaoui, C.; Tajer, A. Petri nets conflicts resolution for performance evaluation and control of urban bus networks: A (max, +)-based approach. Transp. A Transp. Sci. 2020, 16, 164–193. [Google Scholar] [CrossRef]
- Gaied, M.; Anis, M.; Dimitri, L.; Ben Othmen, K. Robust control for railway transport networks based on stochastic P-timed Petri net models. Proc. Inst. Mech. Eng. Part I J. Syst. Control Eng. 2019, 233, 830–846. [Google Scholar] [CrossRef]
- Mahmud, S.S.; Luis, F.; Shamsul, H.M.; Ahmad, T. Micro-simulation modelling for traffic safety: A review and potential application to heterogeneous traffic environments. IATSS Res. 2019, 43, 27–36. [Google Scholar] [CrossRef]
- Varga, B.; Tettamanti, T.; Balázs, K.; Xiaobo, Q. Public transport trajectory planning with probabilistic guarantees. Transp. Res. Part B Methodol. 2020, 139, 81–101. [Google Scholar] [CrossRef]
- Krajzewicz, D. Traffic simulation with SUMO–simulation of urban mobility. In Fundamentals of Traffic Simulation; Springer: New York, NY, USA, 2010; pp. 269–293. [Google Scholar] [CrossRef]
- Zammit, L.C.; Simon, G.F.; Kenneth, S. Real-time parametric modeling and estimation of urban traffic junctions. IEEE Trans. Intell. Transp. Syst. 2019, 20, 4579–4589. [Google Scholar] [CrossRef]
- Kucharski, R.; Guido, G. Simulation of rerouting phenomena in dynamic traffic assignment with the information comply model. Transp. Res. Part B Methodol. 2019, 126, 414–441. [Google Scholar] [CrossRef]
- Rocha, J.; Boavida-Portugal, I.; Gomes, E. Introductory Chapter: Multi-Agent Systems. In Multi-Agent Systems; IntechOpen: Rijeka, Croatia, 2017. [Google Scholar]
- Satunin, S.; Eduard, B. A multi-agent approach to Intelligent Transportation Systems modeling with combinatorial auctions. Expert Syst. Appl. 2014, 41, 6622–6633. [Google Scholar] [CrossRef]
- Zhang, H.; Siyuan, F.; Chang, L.; Yaoyao, D.; Yichen, Z.; Zihan, Z.; Weinan, Z.; Yong, Y.; Haiming, J.; Zhenhui, L. Cityflow: A multi-agent reinforcement learning environment for large scale city traffic scenario. In Proceedings of the World Wide Web Conference, San Francisco, CA, USA, 13–17 May 2019; pp. 3620–3624. [Google Scholar] [CrossRef]
- Mahajan, N.; Andreas, H.; Serge, P.H.; Bart, V.A. Design analysis of a decentralized equilibrium-routing strategy for intelligent vehicles. Transp. Res. Part C Emerg. Technol. 2019, 103, 308–327. [Google Scholar] [CrossRef]
- Abdoos, M. A Cooperative Multi-Agent System for Traffic Signal Control Using Game Theory and Reinforcement Learning. IEEE Intell. Transp. Syst. Mag. 2020. [Google Scholar] [CrossRef]
- Wu, T.; Pan, Z.; Kai, L.; Yali, Y.; Xiumin, W.; Huawei, H.; Dapeng, O.W. Multi-Agent Deep Reinforcement Learning for Urban Traffic Light Control in Vehicular Networks. IEEE Trans. Veh. Technol. 2020, 69, 8243–8256. [Google Scholar] [CrossRef]
- Torabi, B.; Rym, Z.; Robert, S.; Patrick, R. Deployment of a Plug-In Multi-Agent System for Traffic Signal Timing. In Proceedings of the 19th International Conference on Autonomous Agents and MultiAgent Systems, Auckland, New Zealand, 9–13 May 2020; International Foundation for Autonomous Agents and Multiagent Systems: Richland, SC, USA, 2020; pp. 1386–1394. [Google Scholar]
- Belmonte, M.V.; José, L.P.; Triguero, F. Ontologies and agents for a bus fleet management system. Expert Syst. Appl. 2008, 34, 1351–1365. [Google Scholar] [CrossRef]
- Inturri, G.; Le Pira, M.; Giuffrida, N.; Ignaccolo, M.; Pluchino, A.; Rapisarda, A.; D’Angelo, R. Multi-agent simulation for planning and designing new shared mobility services. Res. Transp. Econ. 2019, 73, 34–44. [Google Scholar] [CrossRef]
- Hu, J.; Pan, G.; Yunfei, Y.; Xudong, X. Traffic flow forecasting with particle swarm optimization and support vector regression. In Proceedings of the 17th International IEEE Conference on Intelligent Transportation Systems (ITSC), Qingdao, China, 8–11 October 2014; IEEE: Qingdao, China, 2014; pp. 2267–2268. [Google Scholar] [CrossRef]
- Zhang, S.Q.; Lin, K.P. Short-Term Traffic Flow Forecasting Based on Data-Driven Model. Mathematics 2020, 8, 152. [Google Scholar] [CrossRef]
- Matsim.org (Version 12.0). Windows. Available online: http://www.matsim.org/ (accessed on 2 October 2020).
- Castro, G.B.; André, R.H.; José, S.M. Adaptive traffic signal control based on bio-neural network. Procedia Comput. Sci. 2017, 109, 1182–1187. [Google Scholar] [CrossRef]
- Wang, Y.; Shuning, X.; Feng, D. A New Method for Short-term Traffic Flow Prediction Based on Multi-segments Features. In Proceedings of the 2020 12th International Conference on Machine Learning and Computing, Shenzhen, China, 19–21 June 2020; Association for Computing Machinery: Shenshen, China, 2020; pp. 34–38. [Google Scholar] [CrossRef]
- Chiu, D.K.W.; Oliver, K.L.; Ho-fung, L.; Eric, W.A.; May, C.W. A multimodal agent based mobile route advisory system for public transport network. In Proceedings of the 38th Annual Hawaii International Conference on System Sciences, Big Island, HI, USA, 3–6 January 2005; IEEE: Big Island, HI, USA, 2005; p. 92b. [Google Scholar] [CrossRef]
- Dotoli, M.; Hammadi, S.; Jeribi, K.; Russo, C.; Zgaya, H.A. Multi-agent decision support system for optimization of co-modal transportation route planning services. In Proceedings of the 52nd IEEE Conference on Decision and Control, Firenze, Italy, 10–13 December 2013; IEEE: Firenze, Italy, 2013; pp. 911–916. [Google Scholar] [CrossRef]
- Dotoli, M.; Zgaya, H.; Russo, C.; Hammadi, S. A multi-agent advanced traveler information system for optimal trip planning in a co-modal framework. IEEE Trans. Intell. Transp. Syst. 2017, 9, 2397–2412. [Google Scholar] [CrossRef]
- Keller, A.; Andrea, A.; Daniel, H. Car Sharers’ Interest in Integrated Multimodal Mobility Platforms: A Diffusion of Innovations Perspective. Sustainability 2018, 10, 4689. [Google Scholar] [CrossRef]
- Ayed, H.; Djamel, K.; Zineb, H.; Pascal, B.; Jean, F.M. Transfer graph approach for multimodal transport problems. In Proceedings of the International Conference on Modelling, Computation and Optimization in Information Systems and Management Sciences, Metz, France, 8–10 September 2008; Springer: Berlin/Heidelberg, Germany, 2008; pp. 538–547. [Google Scholar] [CrossRef]
- Qing, G.; Zheng, Z.; Yue, X. Path-planning of automated guided vehicle based on improved Dijkstra algorithm. In Proceedings of the 2017 29th Chinese Control and Decision Conference (CCDC), Chongqing, China, 28–30 May 2017; IEEE: Chongqing, China, 2017; pp. 7138–7143. [Google Scholar]
- Berrouk, S.; Sadgal, M. A Multimodal Route Recommendation Framework Based on Urban Congestion Management. In Proceedings of the International Conference on Smart Applications and Data Analysis, Marrakesh, Morocco, 25–26 June 2020; Springer: Cham, Switzerland, 2020; pp. 103–116. [Google Scholar] [CrossRef]
- Ghandeharioun, Z.; Bigi, F.; Kouvelas, A.; Corman, F. Integrated multimodal network management: An agent based approach. In Proceedings of the 20th Swiss Transport Research Conference (STRC 2020), virtual, 13–14 May 2020; STRC: Monte Verita, Ascona, Switzerland, 2020. [Google Scholar] [CrossRef]
- Van Gheluwe, C.; Semanjski, I.; Hendrikse, S.; Gautama, S. Geospatial Dashboards for Intelligent Multimodal Traffic Management. In Proceedings of the IEEE International Conference on Pervasive Computing and Communications (PerCom), Austin, TX, USA, 23–27 March 2020; IEEE: Austin, TX, USA, 2020. [Google Scholar]
- Zambrano-Martinez, J.L.; Calafate, C.T.; Soler, D.; Lemus-Zúñiga, L.G.; Cano, J.C.; Manzoni, P.; Gayraud, T. A Centralized Route-Management Solution for Autonomous Vehicles in Urban Areas. Electronics 2019, 8, 722. [Google Scholar] [CrossRef]
- Fujii, H.; Uchida, H.; Yoshimura, S. Agent-based simulation framework for mixed traffic of cars, pedestrians and trams. Transp. Res. Part C Emerg. Technol. 2017, 85, 234–248. [Google Scholar] [CrossRef]
- Philips, J.; Saint Germain, B.; Van Belle, J.; Valckenaers, P. Traffic radar: A holonic traffic coordination system using prosa++ and d-mas. In Industrial Applications of Holonic and Multi-Agent Systems; Springer: Berlin/Heidelberg, Germany, 2013; pp. 163–174. [Google Scholar]
- Krishnan, V.G.; Ram, N.S. Analyze traffic forecast for decentralized multi agent system using I-ACO routing algorithm. J. Ambient Intell. Humaniz. Comput. 2018, 1–8. [Google Scholar] [CrossRef]
- Jittrapirom, P.; Caiati, V.; Feneri, A.M.; Ebrahimigharehbaghi, S.; Alonso González, M.J.; Narayan, J. Mobility as a service: A critical review of definitions, assessments of schemes, and key challenges. Urban Plan. 2017, 2, 13–25. [Google Scholar] [CrossRef]
- Arbi, Z.; Driss, O.B.; Sbai, M.K. A multi-agent system for monitoring and regulating road traffic in a smart city. In Proceedings of the 2017 International Conference on Smart, Monitored and Controlled Cities (SM2C), Sfax, Tunisia, 17–19 February 2017; IEEE: Sfax, Tunisia, 2017; pp. 17–22. [Google Scholar] [CrossRef]
- Xie, J.; Liu, C.C. Multi-agent systems and their applications. J. Int. Counc. Electr. Eng. 2017, 7, 188–197. [Google Scholar] [CrossRef]
- Kamdar, R.; Paliwal, P.; Kumar, Y. A state of art review on various aspects of multi-agent system. J. Circuits Syst. Comput. 2018, 27, 1830006. [Google Scholar] [CrossRef]
- Cordasco, G.; Spagnuolo, C.; Scarano, V. Toward the new version of D-MASON: Efficiency, effectiveness and correctness in parallel and distributed agent-based simulations. In Proceedings of the 2016 IEEE International Parallel and Distributed Processing Symposium Workshops (IPDPSW), Chicago, IL, USA, 23–27 May 2016; IEEE: Chicago, IL, USA, 2016; pp. 1803–1812. [Google Scholar]
- Aschermann, M.; Dennisen, S.; Kraus, P.; Müller, J.P. LightJason, a highly scalable and concurrent agent framework: Overview and application. In Proceedings of the 17th International Conference on Autonomous Agents and MultiAgent Systems, Stockholm, Sweden, 10–15 July 2018; International Foundation for Autonomous Agents and Multiagent Systems: Richland, SC, USA, 2018; pp. 1794–1796. [Google Scholar]
- Bergenti, F.; Caire, G.; Monica, S.; Poggi, A. The first twenty years of agent-based software development with JADE. Auton. Agents Multi Agent Syst. 2020, 34, 36. [Google Scholar] [CrossRef]
- Šišlák, D.; Rehák, M.; Pěchouček, M.; Pavlíček, D. Deployment of A-globe multi-agent platform. In Proceedings of the Fifth International Joint Conference on Autonomous Agents and Multi-Agent Systems, Hakodate, Japan, 8–12 May 2006; Association for Computing Machinery: New York, NY, USA, 2006; pp. 1447–1448. [Google Scholar]
- Bellifemine, F.; Giovanni, C.; Agostino, P.; Giovanni, R. JADE: A software framework for developing multi-agent applications Lessons learned. Inf. Softw. Technol. 2008, 50, 10–21. [Google Scholar] [CrossRef]
- Kravari, K.; Bassiliades, N. A survey of agent platforms. J. Artif. Soc. Soc. Simul. 2015, 18, 11. [Google Scholar] [CrossRef]
- Šišlák, D.; Rehák, M.; Pěchouček, M.; Rollo, M.; Pavlíček, D. A-globe: Agent development platform with inaccessibility and mobility support. In Software Agent-Based Applications, Platforms and Development Kits; Unland, R., Klusch, M., Calisti, M., Eds.; Birkhäuser: Basel, Switzerland, 2005; pp. 21–46. [Google Scholar]
- Pal, C.V.; Leon, F.; Paprzycki, M.; Ganzha, M. A Review of Platforms for the Development of Agent Systems. arXiv 2020, arXiv:2007.08961e, department of transport (in press).
- The “SCOOT” Urban Traffic Control System. Available online: http://www.ukroads.org/webfiles/tal04–95.pdf (accessed on 1 October 2020).
- Department for Business, Energy & Industrial Strategy. Greenhouse Gas Reporting: Conversion Factors 2020. Available online: https://www.gov.uk/government/publications/greenhouse-gas-reporting-conversion-factors-2020 (accessed on 1 December 2020).
- Bernas, M.; Płaczek, B.; Korski, W.; Loska, P.; Smyła, J.; Szymała, P. A survey and comparison of low-cost sensing technologies for road traffic monitoring. Sensors 2018, 18, 3243. [Google Scholar] [CrossRef] [PubMed]
- Guerrero-Ibáñez, J.; Zeadally, S.; Contreras-Castillo, J. Sensor technologies for intelligent transportation systems. Sensors 2018, 18, 1212. [Google Scholar]
- U.S. Department of Transportation. Traffic Control Systems Handbook. Chapter 6; In Detectors. Available online: https://ops.fhwa.dot.gov/publications/fhwahop06006/chapter_6.htm (accessed on 30 January 2021).
Publisher’s Note: MDPI stays neutral with regard to jurisdictional claims in published maps and institutional affiliations. |
© 2021 by the authors. Licensee MDPI, Basel, Switzerland. This article is an open access article distributed under the terms and conditions of the Creative Commons Attribution (CC BY) license (http://creativecommons.org/licenses/by/4.0/).