Article

Assessment of Cold Ironing and LNG as Mitigation Tools of Short Sea Shipping Emissions in Port: A Spanish Case Study

by
Alba Martínez-López
1,*,
Alejandro Romero
2 and
José A. Orosa
3
1
Department of Mechanical Engineering, University of Las Palmas de Gran Canaria, 35014 Las Palmas de Gran Canaria, Spain
2
Oceanic Platform of the Canary Islands (PLOCAN), 35214 Telde, Spain
3
Department of Nautical Science and Marine Engineering, E.T.S.N.M., University of A Coruña, 15011 Corunna, Spain
*
Author to whom correspondence should be addressed.
Appl. Sci. 2021, 11(5), 2050; https://doi.org/10.3390/app11052050
Submission received: 19 January 2021 / Revised: 8 February 2021 / Accepted: 22 February 2021 / Published: 25 February 2021

Abstract

:
By the end of 2025 European ports are required to provide (Directive 2014/94/EU) facilities to ensure the Liquefied Natural Gas (LNG) use and on-shore electricity supply for vessels (Cold Ironing—CI). Even though this involves considerable port investment, many uncertainties about CI and LNG performance exist because their application depends on vessel operators’ willingness. Additionally, lag times for CI connection/disconnection along with methane emissions from LNG undermine their feasibility for Short Sea Shipping (SSS). Since, among the SSS aims are the reduction in berthing times and its effectiveness for-inter-islands’ traffic where, land electricity grids are frequently dependent on the fuel burning generation by penalizing the CI performance. This paper introduces a calculation method to evaluate the pollution savings in monetary terms by CI and LNG use in SSS. The method is applied to three European routes by testing the environmental performance of two fleets: feeder and Ro-Pax vessels. The results show that feeders reach higher environmental improvements by using port mitigation than Ro-Pax vessels. Additionally, the need for ensuring the sustainability of on-shore grids before the CI implementation was evinced, especially in insularity frameworks, where the environmental benefits from LNG use proved to be more effective.

1. Introduction

Directive 2014/94/EU requires European Union (EU) ports that are part of the core Trans-European Network for Transport (TEN-T) to provide the facilities to enable alternative fuel use by the end of 2025. Significant port investment is needed to accomplish this Directive; especially to provide on-shore electricity supply (Cold Ironing (CI)) for vessels during berthing and access to Liquefied Natural Gas (LNG) refueling points. Despite the investment required, the current European regulation does not oblige vessel operators to use them (Directive 1999/32/EC, Directive 2005/33/EC). Thus, it can be affirmed that CI and LNG might not be used, even if the facilities exist. Since their capacity to abate port pollution relies on the willingness of vessel operators (the penetration rate) the concern about “guesstimates” for the ports [1] is shared by all geographical zones where the use of sustainable solutions in port is governed by less strict legislation.
The uncertainties about the CI and LNG penetration rates for vessel operators open up an interesting discussion, not only about the expected effectiveness of these measures to mitigate port pollution [2,3,4] but also about who should pay for it. The answer is not self-evident [1,5] since the benefits of their use are related to society and the environment. Thereby, some of key investors (the vessel operators) do not necessarily obtain economic benefits from them.
This attitude contrasts with the EU treatment of other transport modes, where the “polluter pays” and “user pays” principles are consistently applied through the internalization of external costs via taxes and charges collected in European Regulation (Directive 1999/62/EC amended by Directive 2011/76/EU, and currently affected by the proposal to amend COM (2017) 275 for road transport). From an environmental perspective, the European regulation has been more restrictive and efficient for load transport by road than maritime transport [6]. Thus, the traditional green label for Short Sea Shipping (SSS) in the domestic traffic is currently under discussion [6,7], since its current technical limitations are far from meeting the emission standards required by the EU for the land transport (Euro VI standards) [8,9].
In light of the foregoing, the performance of port mitigation alternatives is particularly interesting for SSS [7,10]. The intensity of this type of traffic (high number of calls and sailing close to the coast), along with its energy requirements during berthing, have led to the identification of SSS vessels as the largest beneficiaries of CI [3,5,11] and LNG [12]. In this regard, Christodoulou and Cullinane, 2020 [10] highlighted the evidence of the environmental benefits obtained in SSS from the combination of technical and operational initiatives of shipping companies adopted as complementary measures to the normative efforts of the authorities.
However, a number of authors have raised concerns about this type of traffic’s mitigation practices in port: additional times are required for CI connection that could make SSS competitiveness unfeasible for short calls [13,14]; the islands are frequently involved in SSS activity and their electricity grids are mainly supplied by burning oil, leading CI to be a poor sustainable alternative [5].
Beyond the Sulfur Emission Control Areas (SECA) and Emission Control Area (ECA) zones, defined in Annex VI to MARPOL where SOx and NOx emissions are restricted during sailing, regulatory pressure has been increasing in ports. Hence, in the EU, since 2010 Community ports have demanded a maximum limit of 0.1% sulfur by weight for marine fuels used by inland waterway vessels and ships at berth (Directive 2005/33/EC; amending Directive 1999/32/EC). However, emission —equivalent to those that would be achieved through the limits on sulfur in fuel—can be authorized through the use of abatement technologies. Therefore, the sulfur limitations collected in the Directive were met through different operational solutions (e.g., MGO fuel types 0.1% sulfur, HFO fuel with scrubber use or LNG as fuel, etc.). Despite this restriction, the Commission in 2006 recognized that the regulation established up to that date had been insufficient to maintain port air quality. Consequently, it recommended shore-side electricity (CI) for use by ships at berth in Community ports (Recommendation 2006/339/EC), since it provides additional benefits such as noise reduction, which is especially important for ports situated near residential areas. The COM 2013(295) highlighted the need for stricter requirements on environmental performance in ports. In a further step, Directive 2014/94/EU forces Member States to ensure not only shore-side electricity supply (CI) for vessels but also available refueling points for LNG by 31 December 2025 in TEN-T Core Network ports. In parallel, EU Regulation (2017/352) seeks to define the common criteria (European Commission and Member States jointly) for voluntary environmental charges in port. Additionally, this Regulation gives ports the freedom to make changes in order to promote the sustainable use of their own infrastructures.
The provision of LNG and CI services involve significant port investment; nonetheless, CI is often presented as a feasible solution for emissions mitigation [1,2,3,4]. This is so, even when CI’s high dependence on on-shore energy (the vessels’ electricity consumption is met by plugging them into the on-shore electricity network during berthing time). The main advantage of CI is the relocation of the emission source far from ports where the existence of significant population centers in the port’s hinterlands makes NOx and SOx emissions from vessels especially harmful, since these pollutants have a direct impact on citizens. The additional advantages of CI in contrast to other mitigation solutions are the elimination of port waste, noise, vibrations etc. Nevertheless, Winkel et al. [5] warned about the risk of CI use in regions that are highly dependent on fossil fuels for electricity generation (many of the islands), while Zis et al. [14] highlighted the possible lack of feasibility of CI for short call traffic (lag connection times). In turn, LNG has proved to be the most suitable fuel alternative for SSS when cost, time and sustainability are jointly evaluated from the vessel operator’s point of view [12]. However, methane emissions remain a weak point that penalizes the reliability of LNG as a mitigation port solution.
In order to reduce the uncertainties about CI and LNG performance on the mitigation of SSS port pollutant emissions, this paper introduces a mathematical method to calculate emission savings by LNG and CI use versus traditional on-board electricity supply. The method quantifies in monetary terms the emissions savings for SSS in such a way that it permits us to assess in several routes, not only the performance of one port abatement alternative, but also to compare several systems’ performance with diverse types of suitable vessels to SSS. The method has been tested through its application on three SSS routes, where ports with different electricity grids are involved: the Atlantic coast between France and Spain; the South of Spain and the Canary Islands; and interisland traffic (Canary Islands). The application case considered two different kinds of vessels for the routes: feeder and Ro-Pax vessels.
The paper offers quantitative results that are useful not only for the port authorities and stakeholders involved in the case studies, but also for policy makers and ship operators who can evaluate the influence of on-shore electricity grids and vessel characteristics on the performance of the mitigation measures in port.

2. Methods

In order to accurately assess the impact of port mitigation solutions on SSS activity, the following paragraphs introduce a calculation model able to quantify in monetary terms the performance of these measures, with special attention being paid to CI and LNG alternatives. Appendix A provides the detailed nomenclature used in this section for the variables involved.
The calculation procedure assumes two circumstances: on-board electricity supply and off-shore electricity supply. The former offers two possibilities: the conventional generation of electricity on board through Low Sulfur Marine Gas Oil (LMGO) (0.5% sulfur content) and the use of on-board generating sets driven by LNG dual engines; while the latter involves CI use (see Figure 1). Even though CI is just an alternative for the berthing time of the vessels (see Figure 1), in order to offer greater knowledge of port pollution, the air emissions generated during vessel maneuvers are also evaluated.
Thus, Equations (1) and (3) provide the yearly environmental cost (EUR/year) for on-board electricity generation, during the maneuvering stage (ECMq, ∀q∈Q) and berthing stage (ECBq, ∀q∈Q) on a SSS line.
ECM q = N · k = 1 2 ( E C M q k ) ;   q Q
ECM q , k = u = 1 5 ( E F M u q · ( M T ) · U C u k v ) + I P B q · E F e · L F M q · M T · U C 6 k v ; q Q     k K     v V     e EE
ECB q = N · k = 1 2 ( E C B q k ) ;   q Q
ECB q , k = u = 1 5 ( E F B u q · ( B T q ) · U C u k v ) + I P B q · E F e · L F B q · B T q · U C 6 k v ;   q Q     k K     v V     e EE
Likewise, Equation (5) (ECGq, ∀q∈Q) offers information about the yearly environmental costs during berthing when the vessel is plugged into the electricity grid (CI option).
ECG q = N · k = 1 2 ( E C G q k ) ;   q Q
ECG q , k = u = 1 5 ( E F G u k · ( B T q + C T ) · P B q · U C u k v ) + P B q · E F G 6 k · ( B T q + C T ) · U C 6 k v ;   q Q     k K     v V
These Equations (1)–(6) quantify in monetary terms the impact of the pollutants (U = {1, …, u}): NOx (ozone precursors), SO2 (acidifying substances), PM2.5, PM10 (particular matter mass), and the greenhouse gases (CO2) that are emitted to the air by vessels that are suitable for SSS (Q = {1, …, q}, container and roll-on, roll-off vessels) by operating in several ports (K = {1, …, k}). Additionally, the methane impact (CH4 pollutant) is also integrated into the assessment by considering its emission factor (EFe; ∀e∈EE) for the different kinds of engines (EE = {1, …, e}) and their load factor (LFMq-maneuvering- LFBq-berthing-, ∀q∈Q).
The calculation of the environmental costs (Equations (1)–(6)) also considers the yearly trips of the shipping lines (N), the times (hours) invested in the stages (MT-maneuvering time-, BTq; ∀q∈Q -berthing time-), emission factors, unitary costs for the pollutants and the installed power-MCR- for operations during every operational stage (IPBq; ∀q∈Q). This power is only the auxiliary engines’ power for the berthing whereas, in the maneuvering stage propulsion power (main engine power) is also considered. Due to the features of the electricity grid, equation 6 additionally integrates the connection lag time (CT) and the required power for the berthing operations (PBq; ∀q∈Q).
The unitary cost of pollutants (UCukv; ∀u∈U ∧ ∀k∈K ∧ ∀v∈V) involves the average “damage cost” for transport emissions (EUR/kg) by taking into account the geographical location of the port (K = {1, …, k}) and the population density in its hinterlands (V = {1, …, v}). For European cases this information is regularly published by the European Commission in the "Handbook on the external costs of transport (last updated in 2019 [15]) for every country. Successive updates can be estimated with the national Consumer Price Index (CPI) for every country (National Institute of Statistics and Economic Studies of France [16], National Statistics Institute of Spain [17], etc.).
The emission factors for the vessels during the port operations—that is, during maneuvering (EFMuq;u∈U ∧ ∀q∈Q see Equation (2)) and berthing (EFBuq; ∀u∈U ∧ ∀q∈Q see Equation (4))—are highly dependent on the kinds of engines and power required at each operational stage. These emission factors (kg/h) can be obtained through the calculation tools, whereas the emission factors for CH4 (EFe; ∀e∈EE) can be taken from previous publications for each kind of engine (i.e., dual fuel engines operating with LNG [8,18] and for fuel-based engines [19]).
In turn, the emission factors related to the electricity grid (EFGuk; ∀u∈U ∧ ∀k∈K, see Equation (6)) are a direct consequence of the dominant sources in the land generating plants. Consequently, the localization of the port and the relative weight of renewable sources on the land-based energy mix are the main drivers of these emission factors (kg/kWh).

Practical Case Study

The selected case study attempt to extract significant findings through comparing CI and LNG performance not only in different frameworks but also through different fleets. Thus, the selected examples are application cases where the expected benefits from mitigation port systems use would reach maximum levels. This aim involves the analysis of the most demanding SSS lines: high frequency transport services (5 calls/week) through the operation of vessels with high electricity requirements in port: Ro-Pax vessels [3,5] and feeder vessels with reefer containers [11,14].
The analysis considers the fleets shown in Table 1; optimized container vessel (capacity to 185 reefer container) [20] and conventional Ro-Pax vessels by operating both of them under SSS conditions. The focus is on the vessels’ electricity balance, with the most demanding operational stage being maneuvering. This is so because this stage demands additional electrical power to supply, besides the steering and mooring systems, the bow thrusters (see Table 1). This fact, along with the significance of the time invested in maneuvering over the whole time in SSS, forces us to include this operational stage in the analysis.
Container vessels’ electricity plants are designed to supply all cargo units’ demand as reefer containers (which needs most electricity power). Likewise, the engine room arrangement for the Ro-Pax vessels is designed on the basis of two main engines, (with two main engine driven alternators; Power take off (PTO) in their gearboxes) by moving two propellers. This propulsion configuration, together with the installation of two bow thrusters, significantly improves the maneuvering capacity of these vessels, but also increases their electricity demands (see Table 1). Finally, the Ro-Pax vessels assumed in the application cases require a sufficient energy to supply in port: a plugging capacity for 100 reefer cargo units, high capacity for the cold storage warehouses, air conditioning systems, two stern amp doors and one movable car deck in the garage.
It should be borne in mind that the vessels’ boiler emissions have not been considered in the analysis, since shore power is not an alternative for their activity [4,14]. Consequently, even though the vessel is plugged into the land grid during the berthing stage, the vessels’ boilers are working to provide the steam required for the fuel tanks’ heating coils (among other uses).
Table 1 also shows the maritime routes selected for the case studies. These routes involve ports that belong to electricity grids with large differences in terms of sustainability. The first, between Vigo in the northwest of Spain and St. Nazaire in Brittany (France), was selected mainly due to the different environmental footprint of the electricity grids of both countries (see Section 3.1). Additionally, this route currently operates as a European Motorway of the Sea (MoS), having been a frequently studied route for optimizing fleets in the past [20,21]. This permits us to widen the analysis by comparing unconventional vessels (e.g., optimized feeder vessels) to the conventional ones.
Case study 2, between the Canary Islands (Las Palmas port) and the Iberian Peninsula (Huelva, Spain), represents a habitual kind of shipping between continental Europe and its islands. Each island is supplied by its own electricity plants and therefore the sustainability of its grid is completely different from that on the continent (see Section 3.1). Finally, case study 3, between two islands of the Canary archipelago (Las Palmas and Sta. Cruz de Tenerife), introduces one of the most frequented maritime routes in Europe (interisland), but with the singularity of a scarce share of renewable energy sources in their electricity generation.
The operation times in port were estimated through expressions published by Martínez-López et al. [21] for SSS vessels (feeder and Ro-Pax vessels). The results were tested with real values from Las Palmas port (an average loading/unloading time of 3.5 and 2.3 h for feeder and Ro-Pax, respectively, and 30 minutes for the maneuvering stage). Additionally, a hoteling time of 8 h per day (from 23 p.m. to 7 a.m.) was assumed for each shipping line. Despite some of the study ports being involved in CI projects (like the Core LNGas hive project, 2020 [22]) none of them has currently permanent on-shore supply facilities for SSS traffic. Thus, 1 hour as a connection/disconnection lag time (CT) was assumed for all cases.
The emission factors for the vessels (EFMuq; ∀u∈U ∧ ∀q∈Q see Equation (2) and EFBuq; ∀u∈U ∧ ∀q∈Q see Equation (4)) have been obtained through the calculation tools developed by Kristensen and Bingham [23] for container vessels and Ro-Pax vessels [24]. Moreover, the emission factors for CH4 (EFe; ∀e∈EE) have been assumed with the following values EF1 = 0.040 g/kWh for fuel-based engines and EF2 = 5.79 g/kWh dual engines operating with LNG [12].
The electricity grids’ emissions (EFGuk; ∀u∈U ∧ ∀k∈K) for the European application cases can be obtained, per country and year, through the European Pollutant Release and Transfer Register -E-PRTR- (Regulation (EC) No 166/2006) along with the Energy Statistics published by EUROSTAT (EU Commission, DG Energy, Unit A4,2020) [25]. Despite the E-PTRT providing a register for 91 different pollutants, the particulate matters PM2.5 are not specifically given. Due to the significant impact of this pollutant on human health (there were an estimated 412,000 premature deaths in Europe through long-term exposure to this pollutant in 2016 [26]), the PM2.5 amount can be estimated through its relationship with the PM10 (see Table 2), since the latter is offered by E-PTRT [27].
EUROSTAT (EU Commission, DG Energy, Unit A4, 2020) [25] collects information about gross electricity generation, by fuel or product, as well as by type of generation. In such a case, the calculation of the weighting factor of the source in an electricity grid can be calculated for each country and year by making it possible to estimate the PM2.5 amount from PM10 information. However, this information is not available for smaller geographical levels in EUROSTAT; for these application cases the official data from regional institutions must be consulted. The European Pollutant Release and Transfer Register (E-PRTR) (Regulation (EC) No 166/2006) not only offers information per kind of economic sector (NACE) and industrial activity, but also desegregates information beyond the national level [27].
Finally, Table 3 provides the air pollutant costs where metropolitan or urban areas are related to the port hinterland population: larger than 0.5 million or less than this population, respectively.

3. Results

Despite the varying maritime distances, a standard operational number (five calls per week) for transport services has been taken for all case study routes, in order to simplify the analysis.

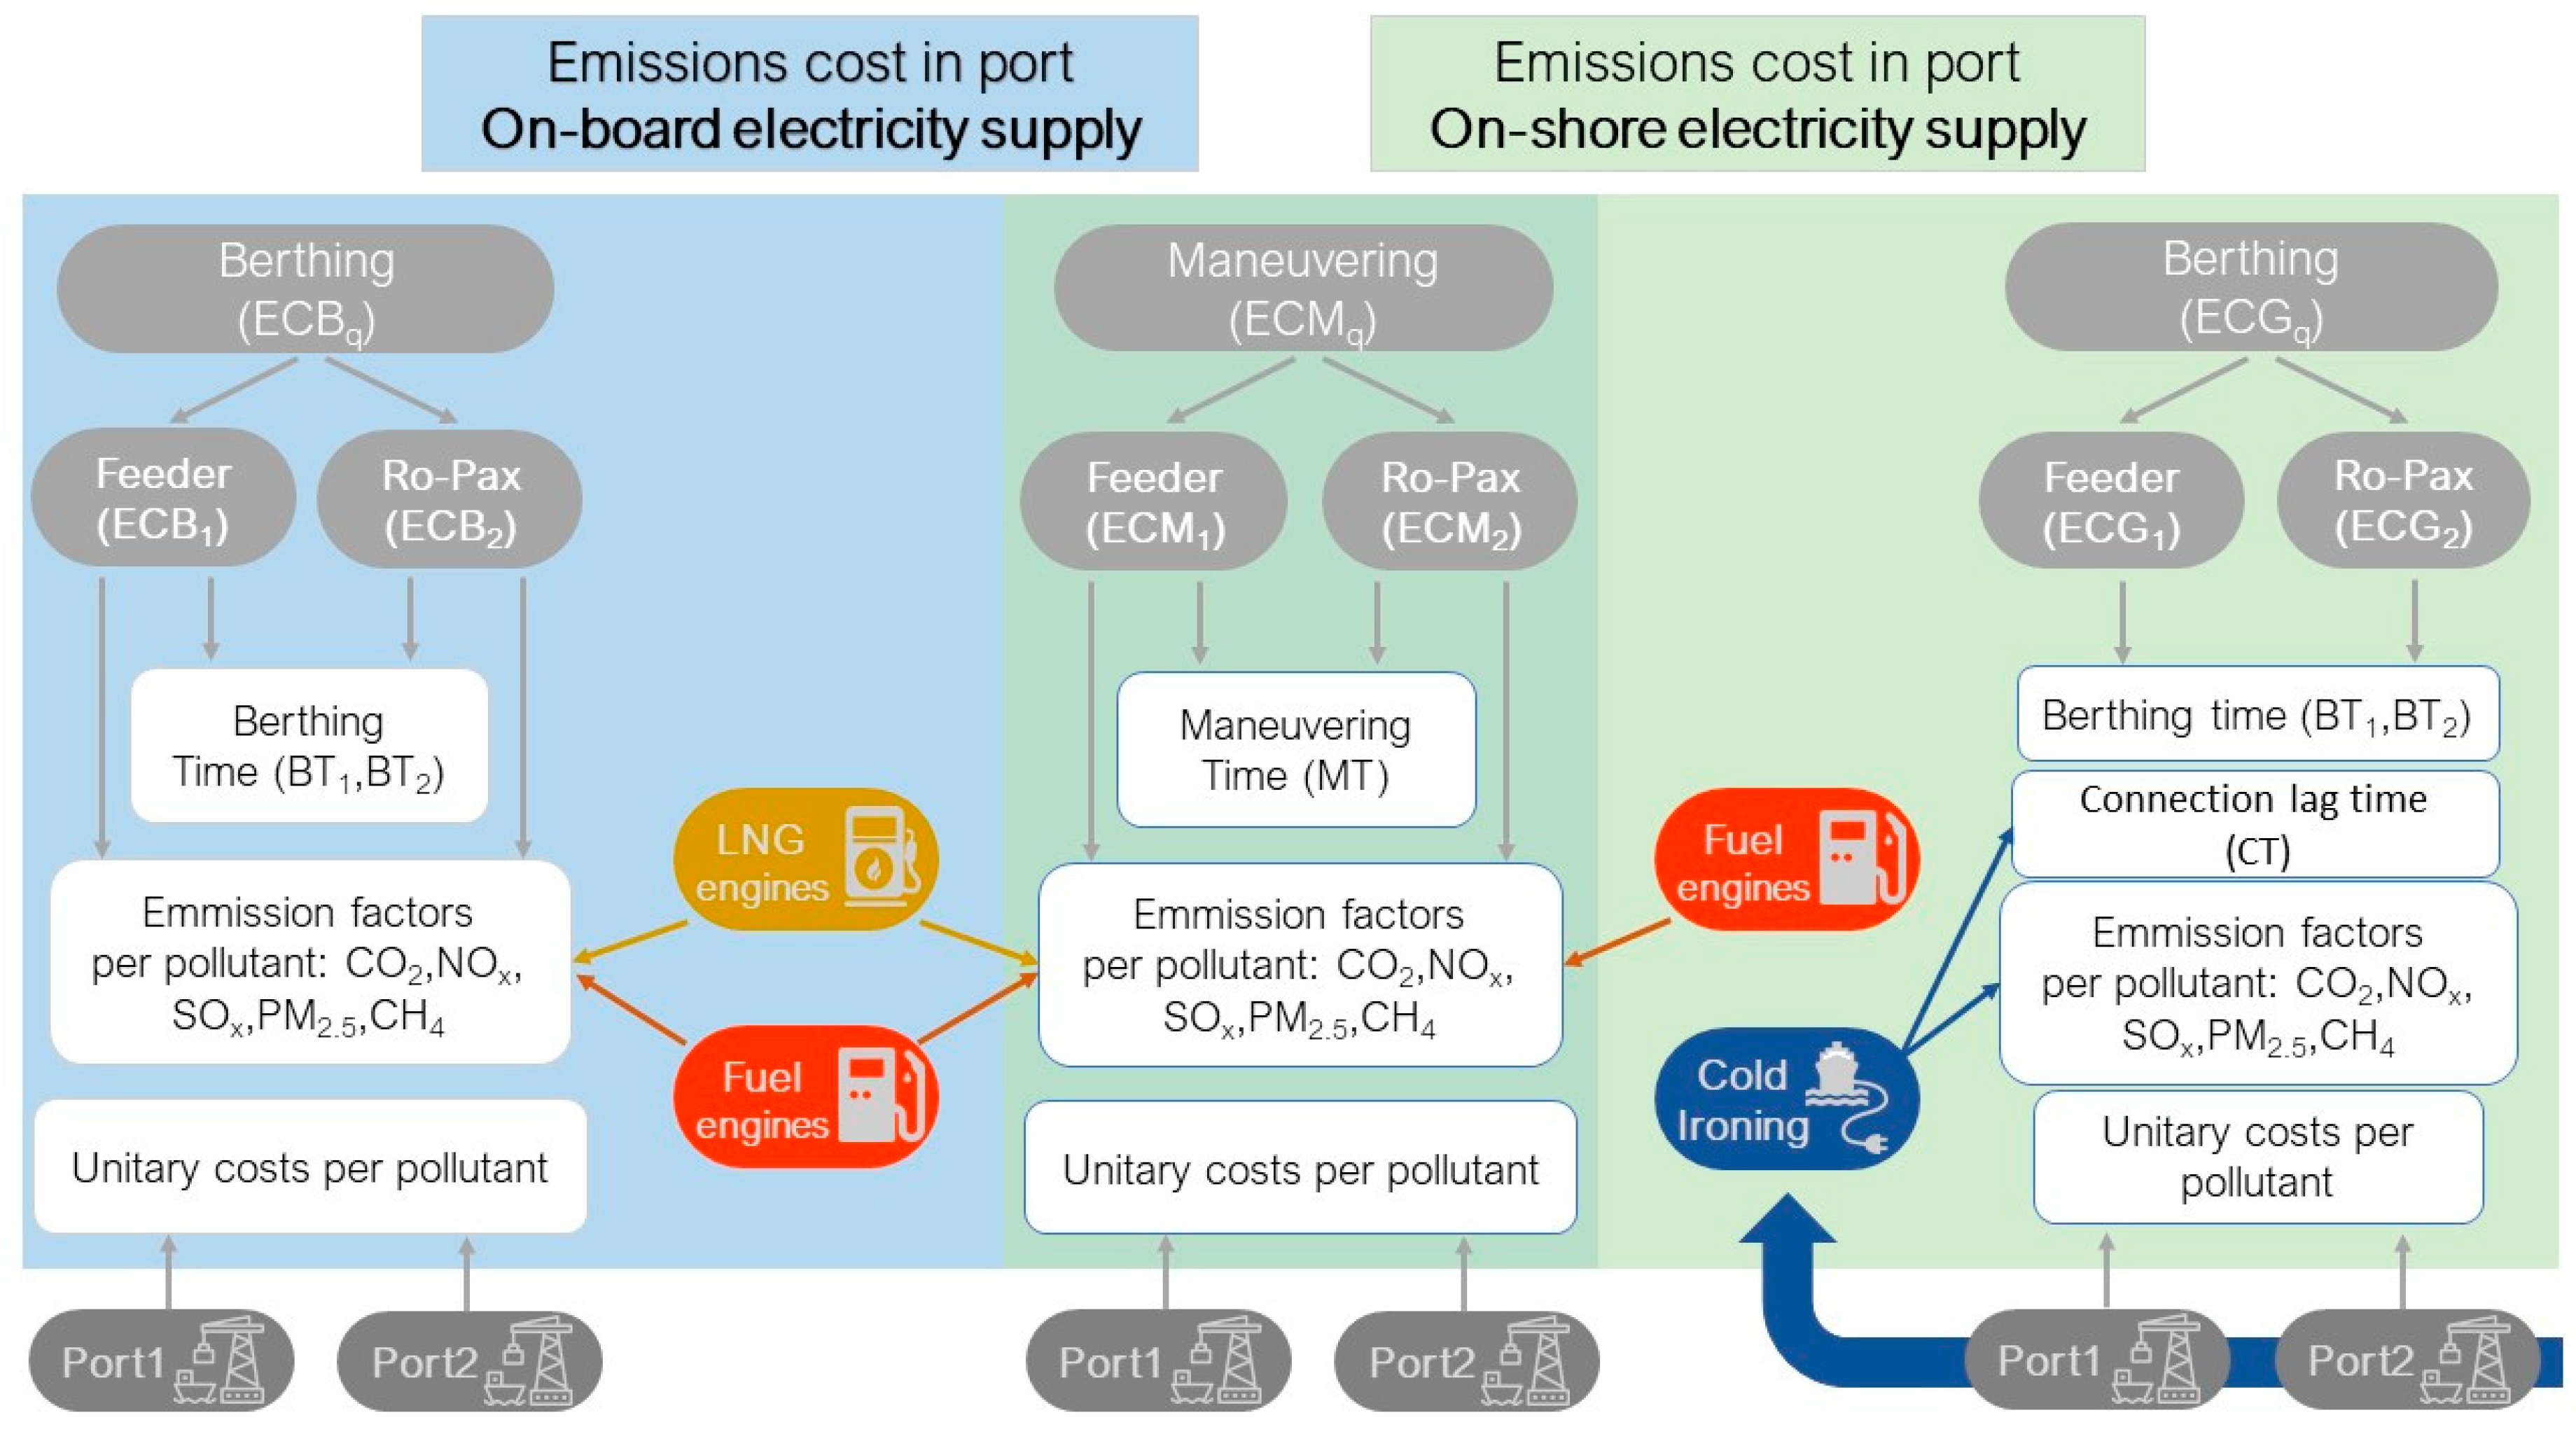
3.1. Estimation of Emission Factors for the Electricity Grids in the CI Alternative

EUROSTAT (EU Commission, DG Energy, Unit A4, 2020) [25] information about gross electricity generation per type of generation was used for the electricity grid of France and continental Spain, while the required information for the islands was taken from the Canary Islands’ Energy yearbook [29]. This information, reflected in Table 4, along with the relationship between PM2.5 and PM10 offered by E-PTRT (see Table 2) permitted us to obtain the emission factors of these pollutants, as reflected in Table 5.
Finally, the pollutant emissions of the electric power generating plants (main activity-NACE: 35.1 (Electric power generation, transmission, and distribution)) not just for the countries (France and Spain) but also for the islands, has been taken from the European Pollutant Release and Transfer Register -E-PRTR- (Regulation (EC) No 166/2006). This procedure is valid for all pollutants except for CH4 emissions on the islands [29], due to the absence of information in E-PRTR [27] in this regard.
In light of the foregoing, Table 5 shows the estimated emission factors for the European grids considered in the application cases: Spain, France, Gran Canaria island and Tenerife island (EFGuk; ∀u∈U ∧ ∀k∈K).

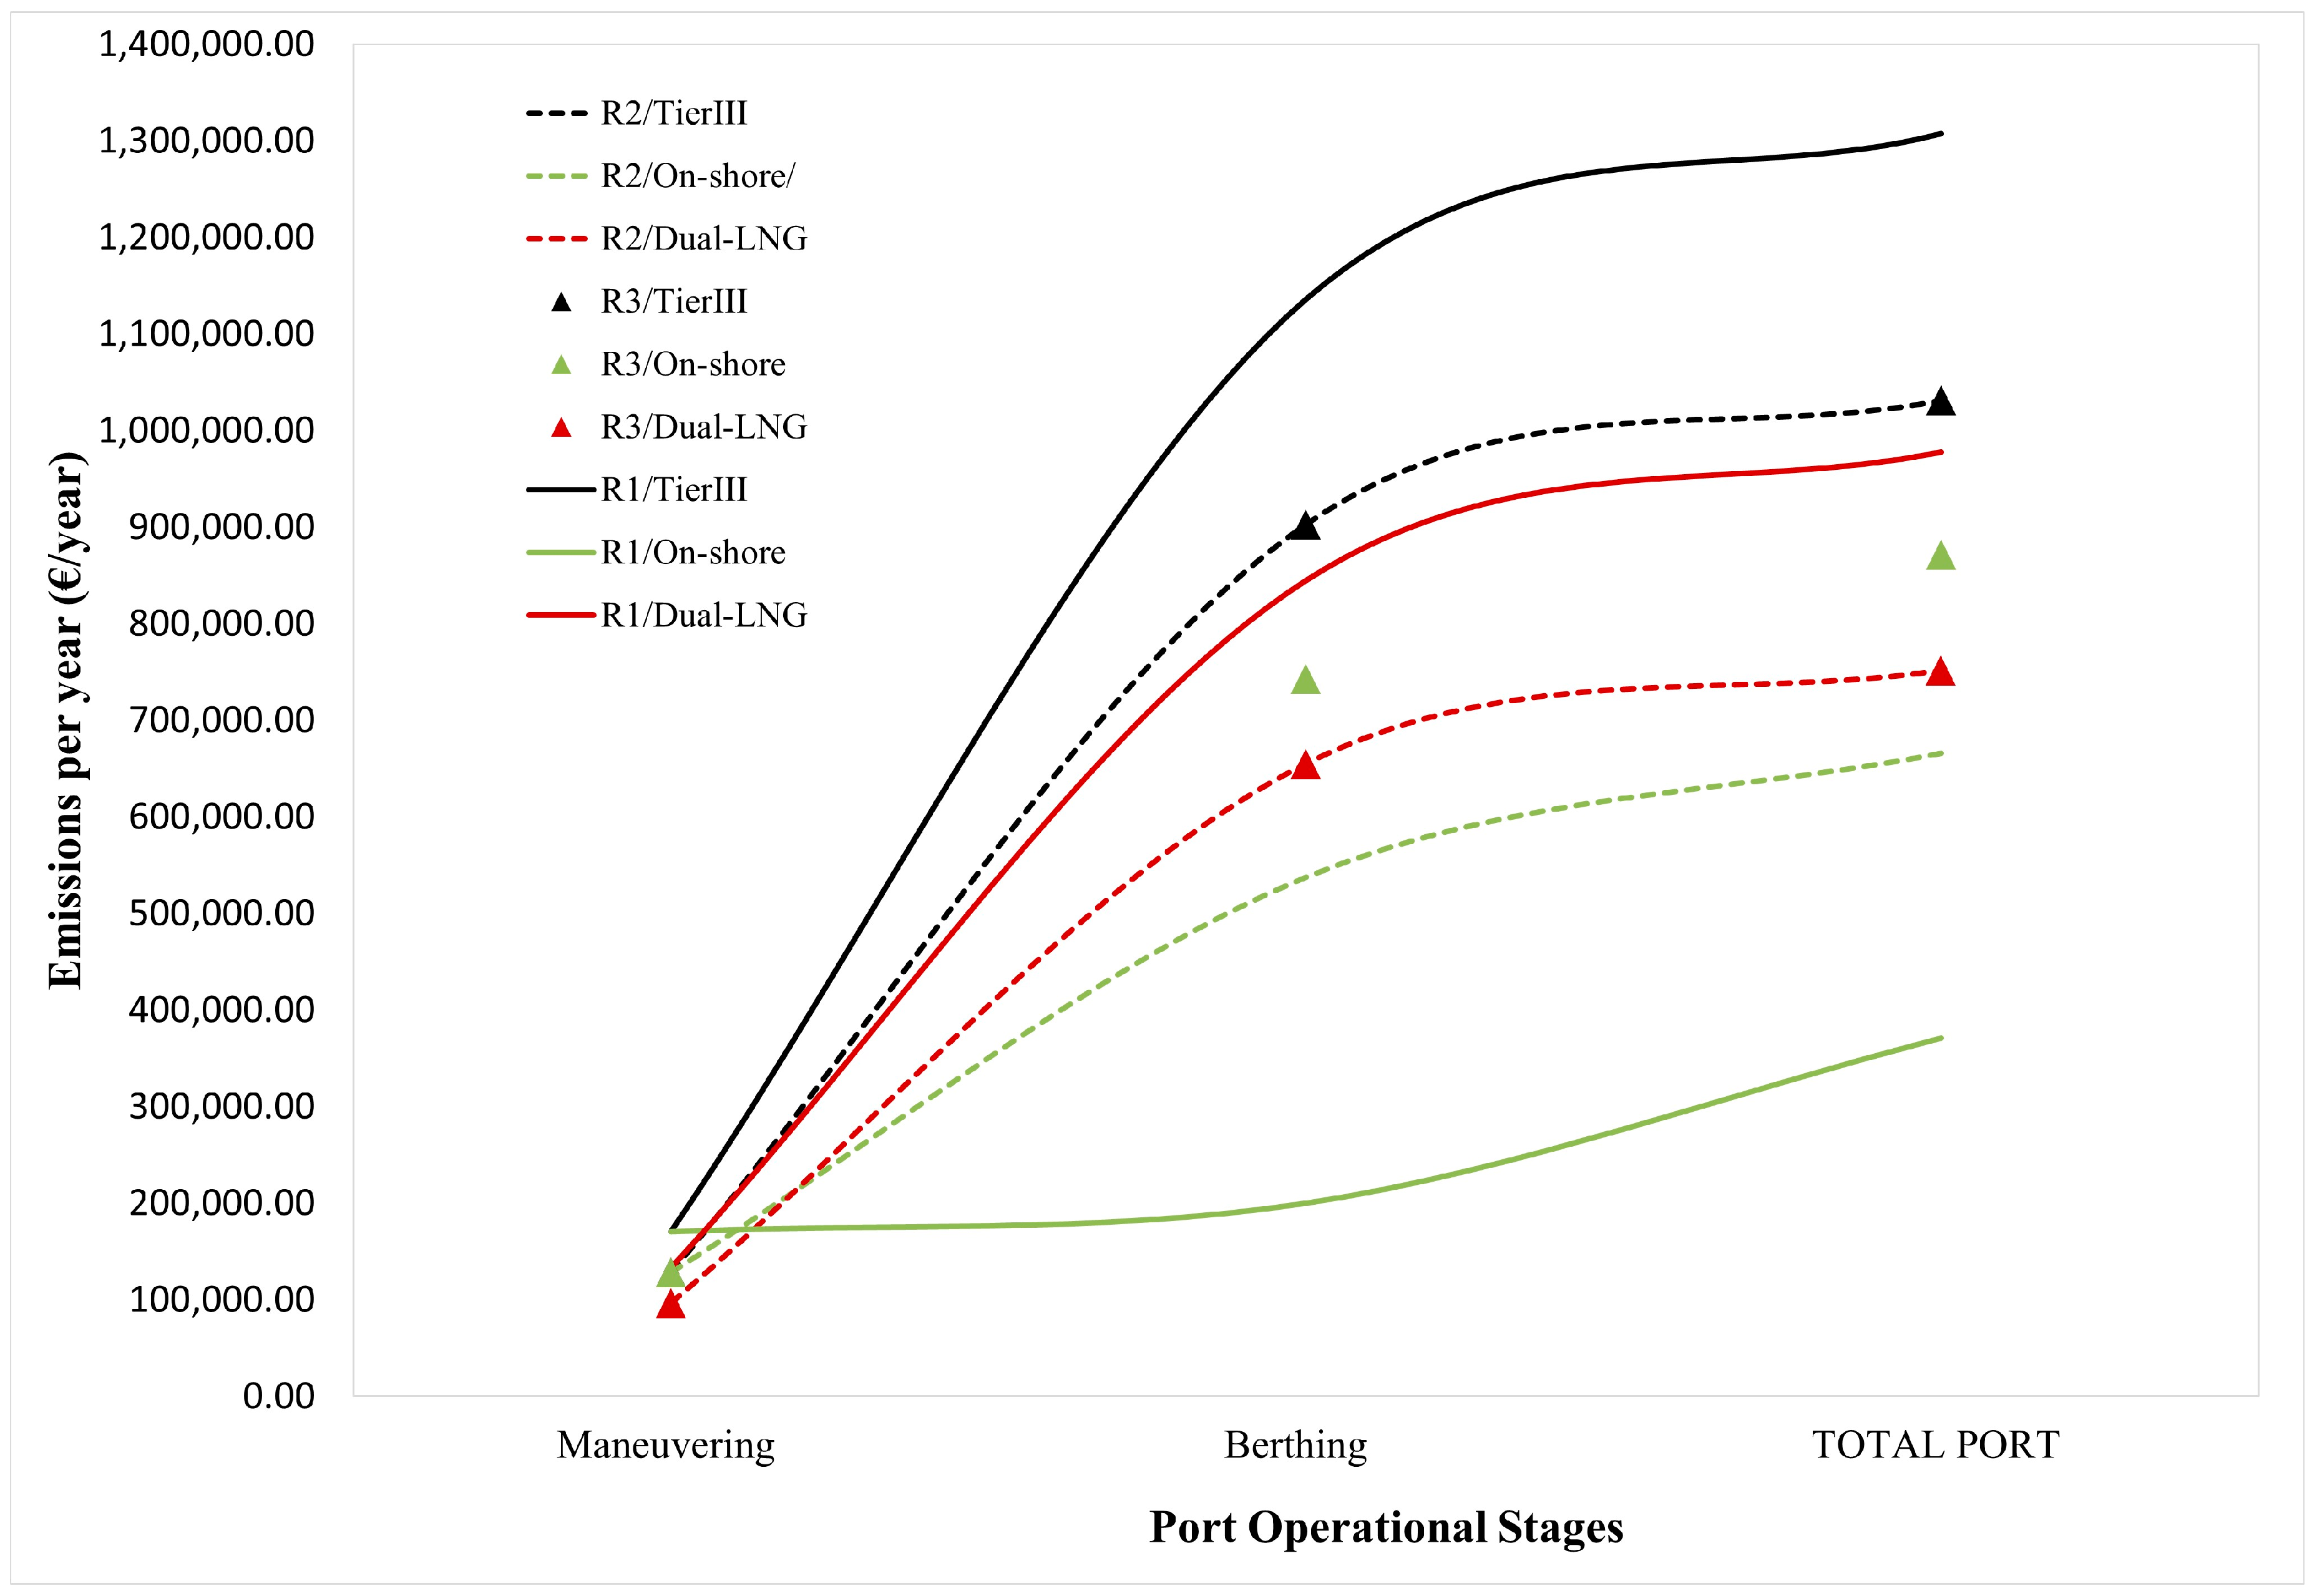
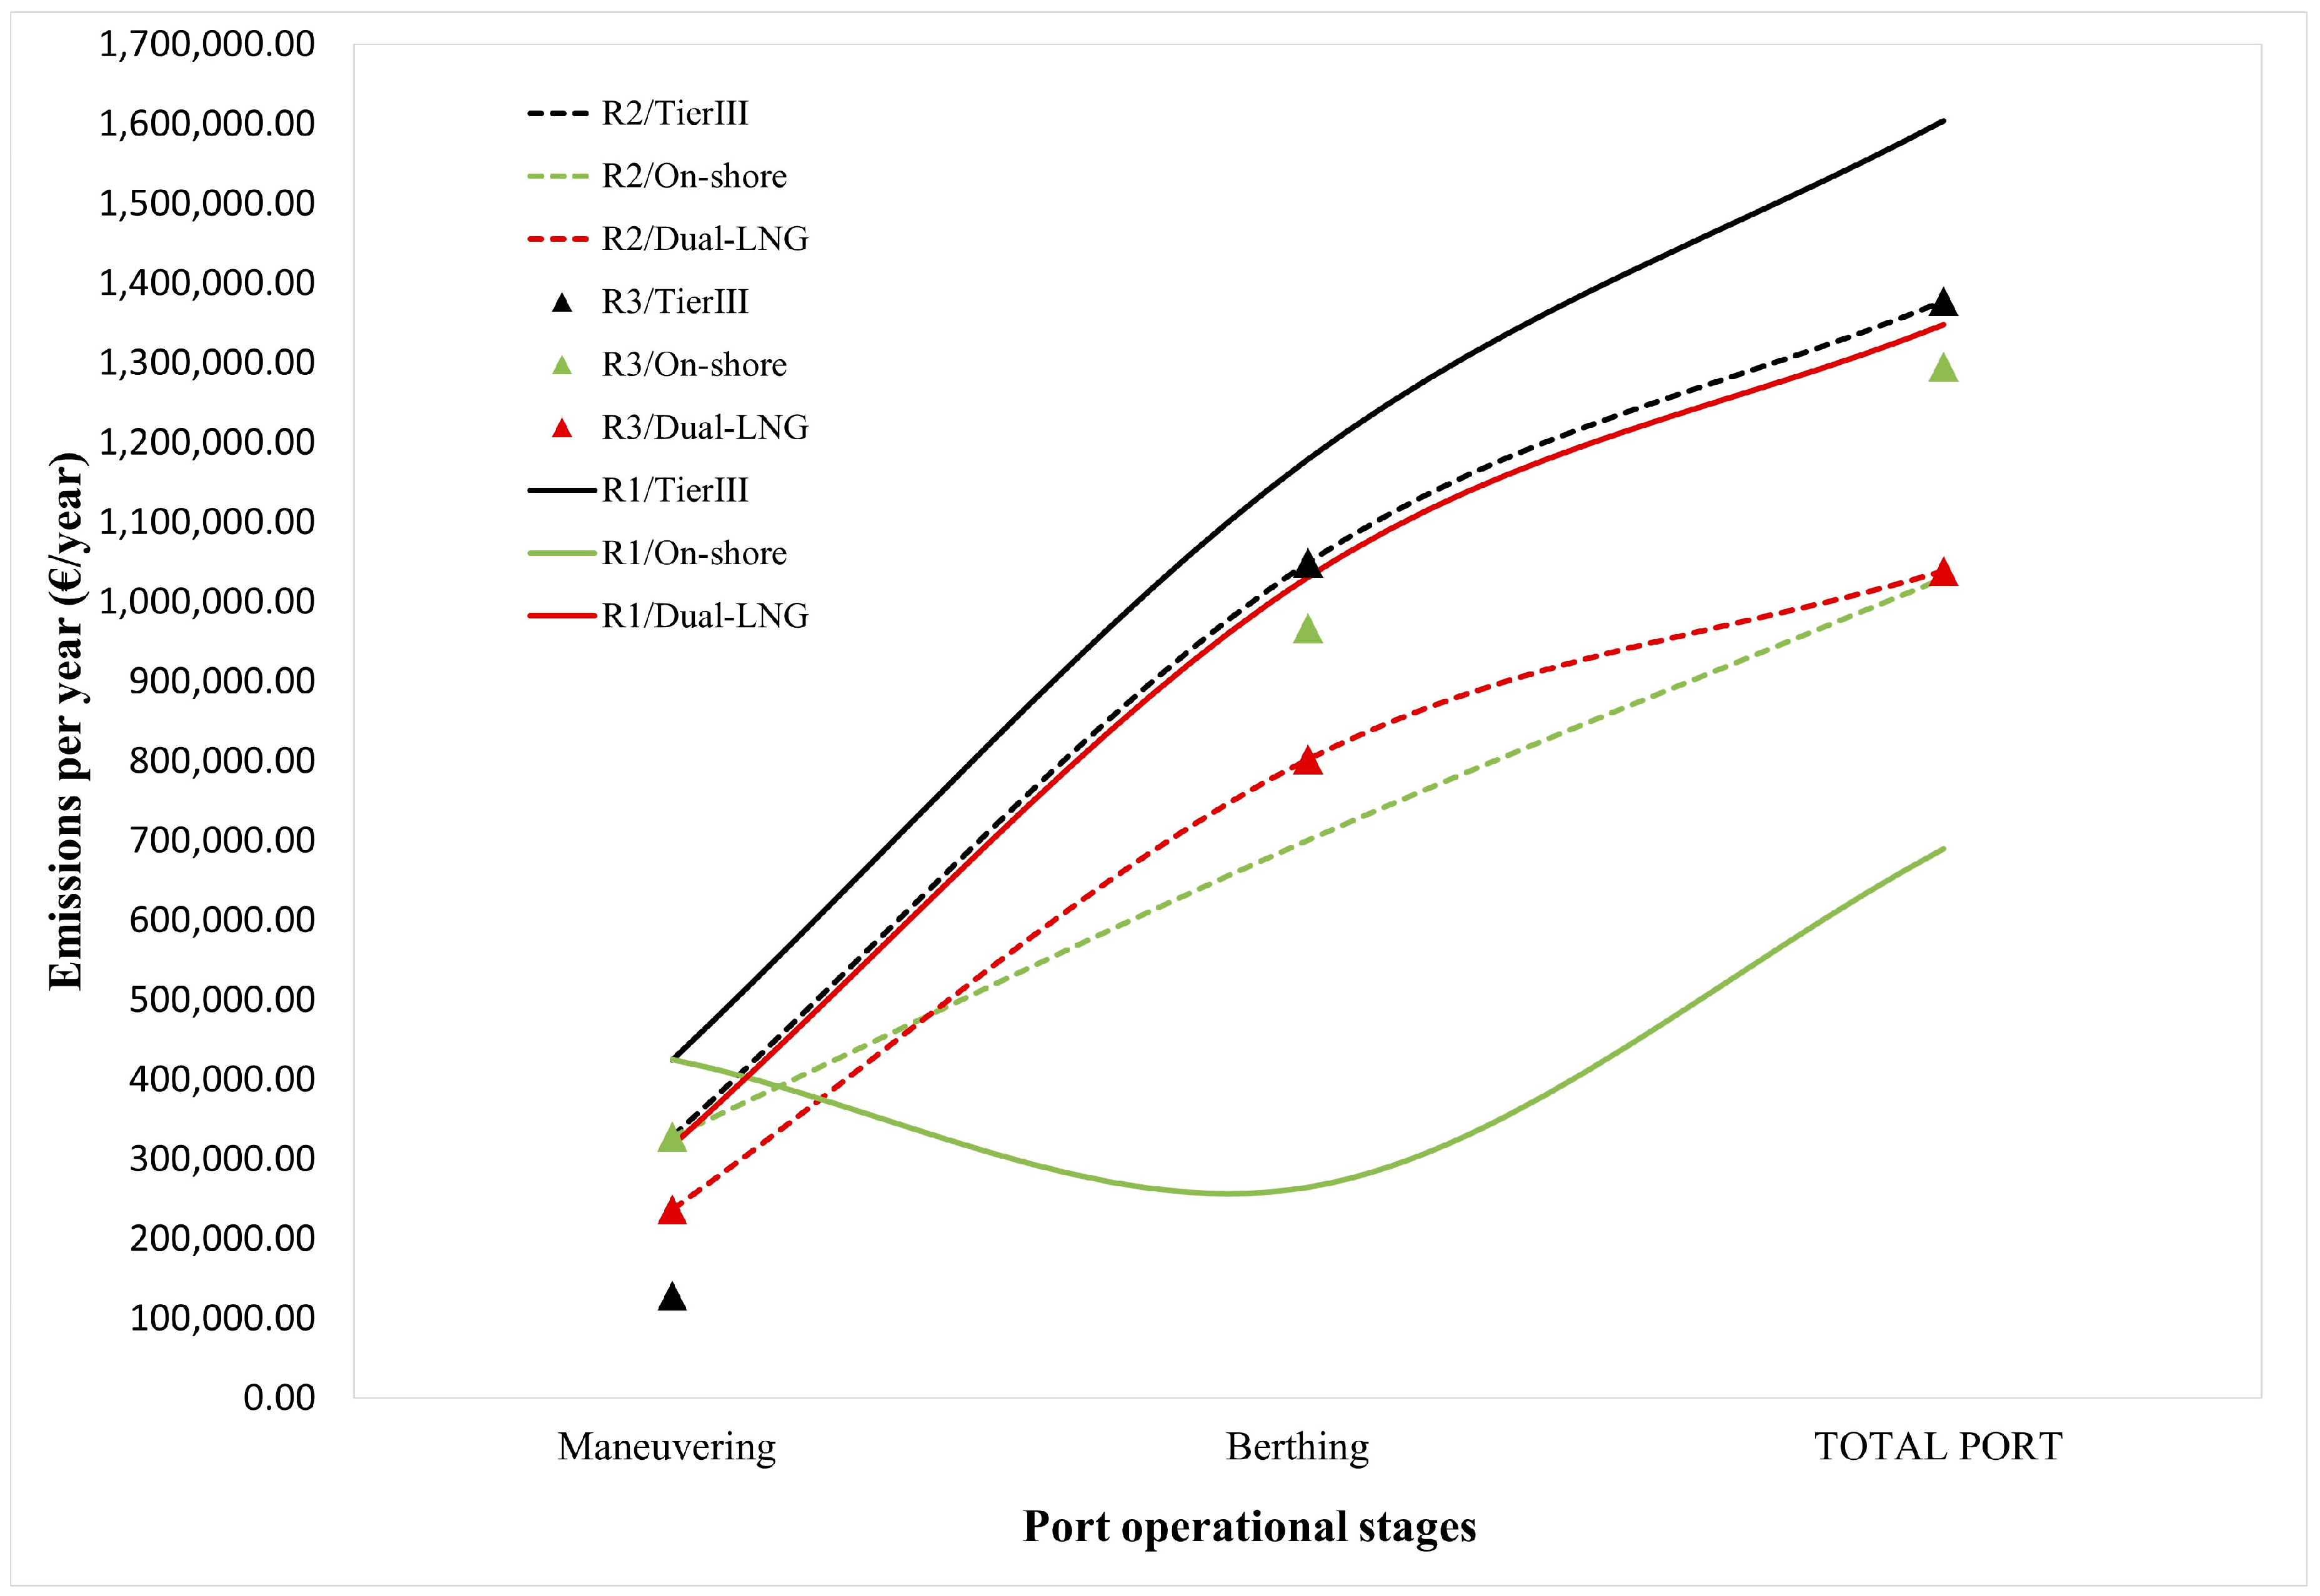
3.2. Performance of the Port Mitigation Alternatives

Table 6 and Table 7 show the “saved emissions” by onshore power supply and by dual engine use regarding fuel-based engines (conventional engines, see Table 1). This saving is measured in monetary terms per year (EUR) and in the percentage of saving emissions regarding fuel-based engines on-board.
Table 6 and Table 7 results show that the emissions reduction by CI use is strongly conditioned by the sustainability of the electricity grids in port. Since the French grids are the most sustainable (from the air emissions standpoint, see Table 4), the routes where St. Nazaire is involved are those most benefited by on-shore power supply.
The progressive reduction of the advantage provided by CI on the, on the routes between the Iberian Peninsula and inter-island, can be also explained by the nature of the electricity generation sources in those regions (see Table 3 and Table 4). Contrary to CI performance occurs when LNG is used as a fuel for on-board engines. In this latter case, the unitary costs of air pollutants per country (see Table 3) are the main drivers of the results. Consequently, the routes through French ports achieve the least advantage from LNG use.
This behavior can also be seen in Figure 2 and Figure 3 whereas the best environmental performance is achieved through CI for the routes involving French ports from peninsular Spain, SSS traffic among the Canary Islands provides the greatest sustainability by operating with LNG in dual engines (see Table 6 and Table 7). In this case, not only the berthing stage (ECBq, ∀q∈Q, see Figure 2 and Figure 3) but also the maneuvering stage (ECMq, ∀q∈Q) benefit from using sustainable fuel. These results are true regardless of the kind of vessel (see Figure 2 and Figure 3); however, when attention is focused on the kind of fleet, feeder vessels prove to be more sensitive to the mitigation alternatives. Thus, feeder fleets achieve greater improvements in terms of sustainability than Ro-Pax vessels (see Table 6 and Table 7), on all routes. This is mainly due to the feeder vessels’ longer berthing times in comparison to the Ro-Pax vessels.
Berthing time also determines sensitivity to the connection/disconnection lag times of CI use; the longer the berthing time is, the lower this sensitivity is. Therefore Ro-Pax is not only more influenced by this lag time but also, this additional time can make the CI alternative unfeasible. This is the case of Sta. Cruz de Tenerife port (see Table 7) where the CI alternative is less sustainable per trip than the on-board supply (Tier III-MGO- engines): 497.04 versus 407.11 EUR/trip (see Table 7); only when hoteling is considered in the analysis (inactive time in port from 23 p.m. to 7 a.m.) does the CI alternative become more favorable (1,377,603.66 EUR/year versus 1,295,189.64 EUR/year).

4. Discussion

Even though real measures for the case studies are not available to test the effectiveness of the method proposed, the first approach of its reliability can be made from the data published by other authors.
Spengler and Tovar [30] published external costs at berth (EUR/h) related to 2016 for several Spanish ports. Despite the authors’ advice about the nature of this indicator, it is a homogeneous value (an aggregated value that includes whole fleet activity and all the operational stages in port), that collects the same pollutants as this paper, excepting the CH4, and therefore this value can be taken as a reference point to test the reliability of the results obtained by the proposed method. For this aim, two assumptions are considered: firstly, most of the 2016 fleet operated with conventional on-board electricity supply in Spanish ports and secondly, since time invested in berthing is significantly higher than in maneuvering, the former has been predominant in the Spengler and Tovar (2020) indicators.
Spengler and Tovar [30] found that in 2016, the Las Palmas port had an external cost at berth of 215 EUR/h. Table 6 and Table 7 show that for Las Palmas port the values obtained for the berthing stage per trip (3.42 h for feeders and 2.3 h for Ro-Pax) are 178.92 EUR/h for feeder vessels (611.92 EUR/3.42 h see Table 6) and 257.61 EUR/h for Ro-Pax vessels (592.52 EUR/2.3 h see Table 7). Therefore, despite the simplifications assumed, the values obtained are close to those previously published by other authors, which suggest an acceptable level of reliability in the calculation model.
On the other hand, the results achieved in this paper confirm the need for increasing the energy environmental sources in electricity insular generation to enhance the desired effects from the application of Directive 2014/94/EU. To this aim, self-generated local renewable energy in port [5] has proved to be one effective solution (in Gothenburg, through local surplus wind generated power, among others). Nevertheless, due to the absence of a continental grid connection and the uncertainty about on-shore renewable resource availability, a challenge arises for the islands. Off-shore wind energy can reduce that uncertainty since the further away from the coast, the higher and more constant the wind energy source is. In fact, floating off-shore wind energy is currently able to overcome the inherent difficulties of traditional “bottom-fixed” foundations for larger depths (such a case of the Canary Islands) by avoiding interferences with port activity [31]. According to the FLOTANT project [32], two 600 MW floating off-shore wind farms (a turbine of 12 MW is supported by each floating substructure) could provide 2.8 TWh per year [32]. This is Gran Canaria island’s required renewable power to reach almost the same share of air pollutant sources in its energy mix as in France (see Table 4). In other words, in such a scenario CI performance in the Las Palmas de Gran Canaria port would be equivalent to that of St. Nazaire.
As has been shown in this paper, in the meantime, LNG use could be a more effective option in insular ports. Despite the fact that its mitigation potential has proved to be lower than CI (methane effect), LNG provides an additional benefit by also acting during the maneuvering stage. However, LNG feasibility is again conditioned by the availability of LNG refueling points in ports (Directive 2014/94/EU) and dual engines installed in vessels. An intermediate solution is currently being studied by some European ports—through the Core LNGas hive project [22]—where the shore-side electricity supply is based on off-grid power production through quayside generating sets. This solution does not eliminate local emissions and is not suitable for supplying the most demanding vessels but, by means of burning LNG, the emissions of port generating sets are cleaner, the system is more flexible and, in the short term, the cost–benefit analysis is favorable.

5. Conclusions

The obligation to provide CI facilities and refueling points for LNG in EU ports by 2025 (Directive 2014/94/EU) involves institutional support to boost these technologies to advance port sustainability. However, their effectiveness is highly conditioned on port features that include the hinterland population size and the share of renewable sources in the energy mix of the regions where the ports are located. This concern is especially justified when SSS is considered, since this type of traffic is characterized by short call times, shipping close to the coast, and frequent operation in insular scenarios with an electricity generation mix that offers few renewable sources.
In light of the foregoing, this paper contributes to knowledge about the port performance of LNG and CI alternatives for SSS traffic, by introducing a calculation method that is able to evaluate the environmental advantages provided by their use. The method was applied to three routes with ports located in regions with varying sustainability in their land electricity grids: Peninsular Spain–France, South Spain–Canary Islands and interisland (Canary Islands). Simultaneously, two different SSS fleets were analyzed: feeder and Ro-Pax vessels.
From the application cases, a number of findings can be drawn. One important influence is the connection/disconnection lag time on CI performance for SSS. Specifically, this is inversely proportionate to berthing time. Thus, the feeder vessels with longer loading times than Ro-Pax vessels show lower sensitivity to this variable by achieving greater environmental benefits by CI use. Likewise, SSS routes with ports located in regions where low-emission sources predominate in electricity generation clearly benefit more from CI use than the LNG alternative in port. On the other hand, on those routes whose ports offer an electricity supply with high dependence on fossil fuel generation, the convenience of CI versus LNG use is highly conditioned on the circumstances of the regions involved. The latter has been exemplified in this paper through the analysis of interisland traffic (Las Palmas de Gran Canaria–Sta. Cruz de Tenerife); the results show LNG performance is clearly greater in environmental terms, regardless of the fleet type.
Thus, the results obtained in this paper quantitatively confirm prior warnings about the benefits of CI in the insular framework, especially with short call traffic. This highlights the need for additional measures to ensure the sustainability of the on-shore electricity supply for the application of Directive 2014/94/EU in the insular territories. Otherwise, Directive 2014/94/EU will not only involve considerable port investment but also will not bring about the expected health benefits. These measures necessarily require a prior increase in the share of renewable sources in the port electricity supply.

Author Contributions

Conceptualization, A.M.-L., A.R. and J.A.O.; methodology, A.M.-L. and A.R.; validation, A.M.-L. and J.A.O.; formal analysis, A.M.-L. and J.A.O.; resources, A.R. and J.A.O.; data curation, A.R.; writing—original draft preparation, A.M.-L.; writing—review and editing, J.A.O.; visualization, A.R. and J.A.O.; supervision, J.A.O. All authors have read and agreed to the published version of the manuscript.

Funding

This publication has been supported by the H2020 project FLOTANT, which is coordinated by the Oceanic Platform of the Canary Islands (PLOCAN). The project has received funding from the European Union’s Horizon 2020 research and innovation program under grant agreement No. 815289.

Institutional Review Board Statement

Not applicable.

Informed Consent Statement

Not applicable.

Data Availability Statement

Not applicable.

Conflicts of Interest

The authors declare no conflict of interest.

Appendix A. Nomenclature

Subscripts:
EE = {1. ... . e}:Kinds of engines involved. Medium speed four-stroke diesel engine with MGO (Tier III) and four-stroke dual-fuel engines (LNG plant).
K = {1. ... . k}Ports for linear shipping line: Vigo. St. Nazaire. Las Palmas de Gran Canaria and Sta. Cruz de Tenerife. These ports articulate the lines: Vigo (Spain)–St. Nazaire (France); Las Palmas de Gran Canaria (Gran Canaria island)–Huelva (Spain) and Las Palmas de Gran Canaria (Gran Canaria island)–Sta. Cruz de Tenerife (Tenerife island).
Q = {1. ... . q}Kind of vessel: feeder vessel and Ro-Pax
U = {1. ... .u}Kind of emission pollutants: NOx, SO2, PM2.5, PM10, CO2 and CH4
V = {1. ... .v}Classification of ports according to the population of their hinterlands: metropolitan zone (over 0.5 million inhabitants) and urban zone.
Variables:
BTqBerthing time (h); this is the loading/unloading time. ∀q∈Q
CTLag connection time (h).
ECBqkEnvironmental costs during berthing for every kind of vessel and port (EUR); ∀q∈Q ∧ ∀k∈K
ECGqkEnvironmental costs by on-shore power use during berthing for every kind of vessel and port (EUR); ∀q∈Q ∧ ∀k∈K
ECMqkEnvironmental costs during maneuvering for every kind of vessel and port (EUR); ∀q∈Q ∧ ∀k∈K
EFeEmission factor of methane for every kind of engine (g/kWh)
EFBuqEmission factors for every kind of vessel and pollutant during berthing.(kg/h) ∀u∈U ∧ ∀q∈Q
EFGukEmissions from the electricity grid for every kind of pollutant and port during berthing (kg/kW.h) ∀u∈U ∧ ∀k∈K
EFMuqEmissions from every kind of vessel and pollutant during maneuvering (kg/h) ∀u∈U ∧ ∀q∈Q
IPBqThe installed power-MCR-of the engines involved in every operational stage and for every kind of vessel (IPBq; ∀q∈Q)
LFBqLoad factor of the engines involved in the berthing stage (%) ∀q∈Q
LFMqLoad factor of the engines involved in the maneuvering stage (%) ∀q∈Q
MTManeuvering time (h). This time collects the pilot and towing time when they are necessary.
NNumber of yearly trips of a shipping line.
NbNumber of vessels in a particular SSS line.
PBqRequired power for berthing operations for every kind of vessel (kW) ∀q∈Q
UCukvUnitary costs for every kind of pollutant and port (EUR/kg) ∀u∈U ∧ ∀k∈K ∧ ∀v∈V

References

  1. Tseng, P.H.; Pilcher, N. A study of the potential of shore power for the port of Kaohsiung. Taiwan: To introduce or not to introduce? Res. Transp. Bus. Manag. 2015, 17, 83–91. [Google Scholar] [CrossRef] [Green Version]
  2. Ballini, F.; Rozzo, R. Air pollution from ships in ports: The socio-economic benefit of cold-ironing technology. Res. Transp. Bus. Manag. 2015, 17, 92–98. [Google Scholar] [CrossRef]
  3. Innes, A.; Monios, J. Identifying the unique challenges of installing cold ironing at small and medium ports—The case of Aberdeen. Transp. Res. D Transp. Environ. 2018, 62, 298–313. [Google Scholar] [CrossRef]
  4. Zis, T.P.V. Prospects of cold ironing as an emissions reduction option. Transp. Res. Part A Policy Pract. 2019, 119, 82–95. [Google Scholar] [CrossRef] [Green Version]
  5. Winkel, R.U.; Weddige, U.; Johnsen, D.; Hoen, V.; Papaefthimiou, S. Shore Side Electricity in Europe: Potential and environmental benefits. Energy Policy 2016, 88, 584–593. [Google Scholar] [CrossRef]
  6. Hjelle, H.M. Short Sea Shipping’s Green Label at Risk. Transp. Rev. 2020, 30, 617–640. [Google Scholar] [CrossRef]
  7. Martínez-López, A.; Caamaño Sobrino, P.; Míguez González, M. Influence of external costs on the optimisation of container fleets by operating under motorways of the sea conditions. Int. J. Shipp. Transp. Logist. 2016, 8, 653–686. [Google Scholar] [CrossRef]
  8. Brynolf, S.; Magnusson, M.; Fridell, E.; Andersson, K. Compliance possibilities for the future ECA regulations through the use of abatement technologies or change of fuels. Transp. Res. D Transp. Environ. 2014, 28, 6–18. [Google Scholar] [CrossRef]
  9. Bengtsson, S.; Fridell, E.; Andersson, K. Fuels for short sea shipping: A comparative assessment with focus on environment impact. Proc. Inst. Mech. Eng. 2014, 228, 44–54. [Google Scholar] [CrossRef]
  10. Christodoulou, A.; Cullinane, K. Potential of, and drivers for, private voluntary initiatives for the decarbonisation of short sea shipping: Evidence from a Swedish ferry line. Marit. Econ. Logist. 2020. [Google Scholar] [CrossRef]
  11. Winkel, R.; Weddige, U.; Johnsen, D.; Hoen, V.; Papaefthymiou, G. Project number: TRANL14441: Potential for Shore Side Electricity in Europe. January 2015. Ecofys. Available online: https://es.scribd.com/document/366724117/Ecofys-2014-Potential-for-Shore-Side-Electricity-in-Europe (accessed on 11 June 2020).
  12. Martínez-López, A.; Caamaño, P.; Chica, M.; Trujillo, L. Choice of propulsion plants for container vessels operating under Short Sea Shipping conditions in the European Union: An assessment focused on the environmental impact on the intermodal chains. Proc. Inst. Mech. Eng. 2019, 233, 653–669. [Google Scholar] [CrossRef]
  13. Khersonsky, Y.; Islam, M.; Peterson, K. Challenges of connecting shipboard marine systems to medium voltage shoreside electrical power. IEEE Trans. Ind. Appl. 2007, 43, 838–844. [Google Scholar] [CrossRef]
  14. Zis, T.; North, R.J.; Angeloudisa, P.; Ochieng, W.; Bell, M.G.H. Evaluation of cold ironing and speed reduction policies to reduce ship emissions near and at ports. Logist. Marit. Econ. Logist. 2014, 16, 371–398. [Google Scholar] [CrossRef]
  15. European Commission. 4.K83 -Handbook on the External Costs of Transport; January 2019–V1.1; European Commission: Brussels, Belgium, 2019; ISBN 978-92-76-18184-2. [Google Scholar]
  16. National Institute of Statistics and Economic Studies of France. 2017. Available online: https://www.insee.fr/en/statistiques/4771934#tableau-ipc-flash-g1-en (accessed on 30 September 2020).
  17. National Statistics Institute of Spain. 2017. Available online: https://www.ine.es/en/prensa/ipc_tabla_en.htm (accessed on 30 September 2020).
  18. Contessi, C. Wartsila Ship Power 4 Stroke Applications Development. Gas Engine Emissions Wartsila Dual. December 2013. Available online: http://www.lngnordwest.de/files/lng_downloads/WS_131216/20131216%20Wartsila%20Leer_DF%20emission%20conference.pdf (accessed on 19 January 2016).
  19. Nielsen, J.; Stenersen, D. Emission factors for CH4. NOx. Particulates and Black Carbon for Domestic Shipping in Norway. Revision 1; Marintek. Klima og forurensningsdirektoratet; Norwegian Pollution Agency: Trondheim, Norway, 2010. [Google Scholar]
  20. Martínez-López, A.; Caamaño Sobrino, P.; Chica González, M.; Trujillo, L. Optimization of a container vessel fleet and its propulsion plant to articulate sustainable intermodal chains versus road transport. Transp. Res. D Transp. Environ. 2018, 59, 134–147. [Google Scholar] [CrossRef]
  21. Martínez-López, A.; Kronbak, J.; Jiang, L. Cost and time models for the evaluation of intermodal chains by using short sea shipping in the North Sea Region: The Rosyth-Zeebrugge route Int. J. Shipp. Transp. Logist. 2015, 7, 494–520. [Google Scholar] [CrossRef]
  22. CORE LNGas hive.2020; European Commission. Trans-European Transport Networks (Call 2014 Connect Europe Facility CEF). Available online: http://corelngashive.eu/en/ (accessed on 11 January 2020).
  23. Kristensen, H.O.; Bingham, H. Project no. 2016-108: Update of Decision Support System for Calculation of Exhaust Gas Emissions; Report no. 06; HOK Marineconsult ApS and Technical University of Denmark: Lyngby, Denmark, 2020. [Google Scholar]
  24. Kristensen, H.O.; Psaraftis, H. Project no. 2014-122: Mitigating and Reversing the Side-Effects of Environmental Legislation on Ro-Ro Shipping in Northern Europe; Work Package 2.3; Report no. 07; HOK Marineconsult ApS and Technical University of Denmark: Lyngby, Denmark, 2016. [Google Scholar]
  25. EU Commission DG Energy. Unit A4. EUROSTAT: Energy Statistics. Energy Datasheets: EU Countries. 2020. Available online: https://data.europa.eu/euodp/en/data/dataset/information-on-energy-markets-in-eu-countries-with-national-energy-profiles/resource/24184068-8ec3-470a-ba28-5ca2317c6f6f (accessed on 30 September 2020).
  26. European Environment Agency. EEA Report No 10/2019: Air Quality in Europe-2019 Report. 2019. Available online: https://www.eea.europa.eu/publications/air-quality-in-europe-2019 (accessed on 30 September 2020).
  27. European Environment Agency. European Pollutant Release and Transfer Register. 2020. Available online: https://prtr.eea.europa.eu/#/industrialactivity (accessed on 30 September 2020).
  28. European Environment Agency. 1.A.1 Combustion in energy industries GB2009 update June 2010. In EMEP/EEA Air Pollutant Emission Inventory Guidebook—2009; EEA Technical Report No 9/2009; European Environment Agency: Copenhagen, Denmark, 2009; p. 96. [Google Scholar]
  29. Government of the Canary Islands. Economy, Industry and Trade Counseling. Anuario Energético de Canarias 2017. 2018. Available online: http://www.gobiernodecanarias.org/istac/jaxi-istac/menu.do?uripub=urn:uuid:131cf873-66a9-408d-8cfa-537d6be05067 (accessed on 30 September 2020).
  30. Spengler, T.; Tovar, B. Potential of cold-ironing for the reduction of externalities from in-port shipping emissions: The state-owned Spanish port system case. J. Environ. Manag. 2021, 279, 111807. [Google Scholar] [CrossRef]
  31. FLOTANT Project. Innovative, Low Cost, Low Weight and Safe Floating Wind Technology Optimized for Deep Water Wind Sites. European Union’s Horizon 2020 Programme-No815289-Deliverable D4.1: Structural and Naval Architecture Design Basis. 2019. Available online: https://flotantproject.eu/wp-content/uploads/2020/12/191025-FLT_WP4_D4.1_DesignBasis_v3.pdf (accessed on 31 December 2020).
  32. FLOTANT Project Innovative, Low Cost, Low Weight and Safe Floating Wind Technology Optimized for Deep Water Wind Sites. European Union’s Horizon 2020 Programme-No815289-Deliverable D4.2: Specifications of a Generic Wind Turbine. 2019. Available online: https://flotantproject.eu/wp-content/uploads/2020/04/190927_FLT-D.4.2-Specification_Turbine_V2.pdf (accessed on 31 December 2020).
Figure 1. Dependences of the variables involved in the calculation model for port emissions costs.
Applsci 11 02050 g001
Figure 2. Emissions per year of feeder vessels in port. R1: Vigo (Spain)–St. Nazaire (France) R2: Las Palmas (Gran Canaria island)–Huelva (Spain) R3: Las Palmas (Gran Canaria island–Sta. Cruz de Tenerife (Tenerife island).
Applsci 11 02050 g002
Figure 3. Emissions per year of Ro-Pax vessels in port. R1: Vigo (Spain)–St. Nazaire (France) R2: Las Palmas (Gran Canaria island)–Huelva (Spain) R3: Las Palmas (Gran Canaria island)–Sta. Cruz de Tenerife (Tenerife island).
Applsci 11 02050 g003
Table 1. Technical features of the fleets considered for the application cases.
Feeder Vessel (reefer) **Ro-Pax Vessel ***
Technical FeaturesCargo units184 (reefer containers)Pax:1000
Lane length for
trailers: 1600 m
Cars: 160
Reefer cargo’s plugs: 100
Lbp (m)78.15153.25
B (m)14.4628.65
D (m) *7.4113.85
GT245626,916
Service Speed (kn)19.4923.00
Main Engine (kW)70002 × 15,600
Type of Main EngineTier III (MGO)Tier III (MGO)
Auxiliary engines (kW)2 × 6623 × 1254
Power take off (PTO) (kW)15002 × 1000
Bow thruster (kW)3502 × 1000
Electricity demandManeuvering (kW)16204936
Berthing (kW)-PBq-12001880
Electricity supportManeuvering PTO + 1 auxiliary engine2 PTO + 3 auxiliary engines
Berthing 2 auxiliary engines2 auxiliary engines
Maritime-Route 1Vigo(Spain)–St. Nazaire (France)
Maritime-Route 2Las Palmas (Gran Canaria island)–Huelva (Spain)
Maritime-Route 3Las Palmas (Gran Canaria island)–Sta. Cruz de Tenerife (Tenerife island)
* Depth to upper continuous deck for Ro-Pax vessel. ** More technical features in Martínez-López et al. [20]. *** More technical features on the base vessels: “Sorolla” (http://www.hjbarreras.es/?page=lis-ferries&idp=10) and “Martí i Soler” (http://www.hjbarreras.es/?page=lis-ferries.2&idp=35).
Table 2. Emission factors PM2.5/PM10 for source category in energy industries (g/GJ).
Hard CoalBrown CoalNatural GasDerived GasesHeavy fuel OilOther Liquefied fuelsBiomass
‘9/20’‘9/20’‘0.9/0.9’‘5/5’‘18/13’‘2/1’‘38/33’
Source: [28].
Table 3. The unitary cost of air pollutants for France and Spain in 2017.
Pollutants (EUR/kg)FranceSpain
UrbanMetropolitanUrbanMetropolitan
NOx28.5628.568.648.64
SO214.5914.596.916.91
PM2.5137.55427.35113.79353.57
PM106.196.1910.3610.36
CO20.100.150.100.10
CH42.622.622.542.54
Data source: [15,16,17].
Table 4. Gross electricity generation by fuel in 2017 (%).
Hard CoalBrown CoalOil and Petroleum ProductsNatural Gas and Manufactured GasSolid Biofuels and Renewable WastesRenewableNuclearMain Activity Electricity Only Plants [TWh]
SPAIN15.440.935.7223.681.8631.3121.06239.59
FRANCE2.280.001.247.641.0116.8470.98530.76
GRAN CANARIA ISLAND0.000.0091.860.000.008.140.003.48
TENERIFE ISLAND0.000.0092.270.000.247.490.003.53
Data source: [25,29].
Table 5. Average emission factor for European grids in 2017.
NOx (g/kWh)SO2 (g/kWh)PM2.5 (g/kWh)PM10 (g/kWh)CO2 (g/kWh)CH4 (g/kWh)
SPAIN (continental)0.5670.4020.0120.013291.3690.018
FRANCE0.0660.0420.0010.0014.3010.001
GRAN CANARIA ISLAND1.7960.7850.0300.015656.0340.026
TENERIFE ISLAND2.3440.7620.0330.016645.6090.026
Data source: [25,27,28,29].
Table 6. Emissions reduction in feeder vessels by port mitigation alternatives use.
Vigo-St. NazaireLas Palmas -HuelvaLas Palmas -Sta. Cruz de Tenerife
N (yearly trips)
Calls per week and direction
Number of vessels (Nb)
Maritime Distance (Nautical Miles)
476476476
555
341
46470253
PortsVigoSt. NazaireLas PalmasHuelvaLas PalmasSta. Cruz Tenerife
On-board power supply
(Tier III-MGO- engines)
Maneuvering
emissions
Per trip and port-ECM1k-(EUR/trip)112.03246.51157.49112.03157.49112.03
Per trip (EUR/trip)358.54269.52269.52
Per year-ECM1-(EUR/year)170,663.98128,291.96128,291.96
Berthing
emissions
Per trip and port-ECB1k-(EUR/trip)436.01883.19611.92436.01611.92436.01
Per trip (EUR/trip)1319.201047.941047.94
Per year-ECB1-(EUR/year)1,135,935.53902,932.98902,932.98
Port EmissionsPer trip (EUR/trip)1677.741317.461317.46
Per year (EUR/year)1,307,329.621,031,224.941,031,224.94
On-board power supply (dual-LNG- engines)Maneuvering
emissions
Per trip and port-ECM1k-(EUR/trip)95.00184.10107.6795.00107.6795.00
Per trip (EUR/trip)279.10202.66202.66 EUR
Per year-ECM1-(EUR/year)132,850.7796,468.2796,468.27
Berthing
emissions
Per trip and port-ECB1k-(EUR/trip)355.50624.81404.52355.50404.52355.50
Per trip (EUR/trip)980.31760.02760.02
Per year-ECB1-(EUR/year)844,661.29654,855.01654,855.01
Port emissionsPer trip (EUR/trip)1,259.40962.68962.68
Per year (EUR/year)977,512.06751,323.28751,323.28
On-shore power supplyManeuvering
emissions
Per trip and port-ECM1k-(EUR/trip)112.03246.51157.49112.03157.49112.03
Per trip (EUR/trip)358.54269.52269.52
Per year-ECM1-(EUR/year)170,663.98128,291.96128,291.96
Berthing
emissions
Per trip and port-ECG1k-(EUR/trip)201.5879.63475.07201.58475.07447.59
Per trip (EUR/trip)281.21676.65922.66
Per year-ECG1-(EUR/year)200,133.81537,585.04743,067.54
Port emissionsPer trip (EUR/trip)639.75946.171.192.18
Per year (EUR/year)370,797.79665,877.00871,359.50
Save emissions per yearOn-shore power supply (EUR)936,531.82365,347.94159,865.44
Dual LNG engines use (EUR)329,817.56279,901.67279,901.67
Emissions reduction per yearOn-shore power supply (%)71.64%35.43%15.50%
Dual LNG engines use (%)25.23%27.14%27.14%
Table 7. Emissions reduction in Ro-Pax vessels by port mitigation alternatives use.
Vigo-St. NazaireLas Palmas -HuelvaLas Palmas -Sta. Cruz de Tenerife
N (yearly_trips)
Calls per week and direction
Number of vessels (Nb)
Maritime Distance (Nautical Miles)
476476476
555
341
46470253
PortsVigoSt. NazaireLas PalmasHuelvaLas PalmasSta. Cruz Tenerife
On-board power supply
(Tier III-MGO- engines)
Maneuvering
emissions
Per trip and port-ECM2k-(EUR/trip)286.95605.54403.15286.95403.15286.95
Per trip (EUR/trip)892.49690.10690.10
Per year-ECM2-(EUR/year)424,826.90328,488.10128,291.96
Berthing
emissions
Per trip and port-ECB1k-(EUR/trip)407.11845.36592.52407.11592.52407.11
Per trip (EUR/trip)1,252.47999.63999.63
Per year-ECB2-(EUR/year)1,178,840.381,049,115.551,049,115.55
Port emissionsPer trip (EUR/trip)2,144.971,689.731,689.73
Per year (EUR/year)1,603,667.281,377,603.661,377,603.66
On-board power supply (dual-LNG- engines)Maneuvering
emissions
Per trip and port-ECM2k-(EUR/trip)232.18433.82264.56232.18264.56232.18
Per trip (EUR/trip)665.99496.74496.74
Per year-ECM2-(EUR/year)317,013.32236,447.41236,447.41
Berthing
emissions
Per trip and port-ECB2k-(EUR/trip)356.23626.03407.90356.23407.90356.23
Per trip (EUR/trip)982.26764.12764.12
Per year-ECB2-(EUR/year)1,030,882.51801,948.83801,948.83
Port emissionsPer trip (EUR/trip)1648.251260.861260.86
Per year (EUR/year)1,347,895.841,038,396.241,038,396.24
On-shore power supplyManeuvering
emissions
Per trip and port-ECM1k-(EUR/trip)286.95605.54403.15286.95403.15286.95
Per trip (EUR/trip)892.49690.10690.10
Per year-ECM2-(EUR/year)424,826.90328,488.10328,488.10
Berthing
emissions
Per trip and port-ECG1k-(EUR/trip)229.11108.37533.14229.11533.14497.04
Per trip (EUR/trip)337.48762.251030.18
Per year-ECG2-(EUR/year)264,534.38700,627.20966,701.54
Port emissionsPer trip (EUR/trip)1,229.981,452.351,720.28
Per year (EUR/year)689,361.281,029,115.301,295,189.64
Emissions saved per yearOn-shore power supply (EUR)914,305.99348,488.3582,414.01
Dual LNG engines use (EUR)255,771.44339,207.41339,207.41
Emissions reduction per yearOn-shore power supply (%)57.0125.305.98
Dual LNG engines use (%)15.9524.6224.62
Publisher’s Note: MDPI stays neutral with regard to jurisdictional claims in published maps and institutional affiliations.

