Article

Two-Phase Flow Simulations Using 1D Centerline-Based C- and U-Shaped Pipe Meshes

School of Mechanical Engineering, Kyungpook National University, 41566 Daegu, Korea
*
Author to whom correspondence should be addressed.
Appl. Sci. 2021, 11(5), 2020; https://doi.org/10.3390/app11052020
Submission received: 21 January 2021 / Revised: 17 February 2021 / Accepted: 22 February 2021 / Published: 25 February 2021
(This article belongs to the Special Issue Computational Fluid Mechanics and Heat Transfer)

Abstract

:
This study aims to investigate the pressure changes, bubble dynamics, and flow physics inside the U- and C-shaped pipes with four different gravitational directions. The simulation is performed using a 1D centerline-based mesh generation technique along with a two-fluid model in the open-source software, OpenFOAM v.6. The continuity and momentum equations of the two-fluid model are discretized using the pressure-implicit method for the pressure-linked equation algorithm. The static and hydrostatic pressures in the two-phase flow were consistent with those of single-phase flow. The dynamic pressure in the two-phase flow was strongly influenced by the effect of the buoyancy force. In particular, if the direction of buoyancy force is the same as the flow direction, the dynamic pressure of the air phase increases, and that of the water phase decreases to satisfy the law of conservation of mass. Dean flows are observed on the transverse plane of the curve regions in both C-shaped and U-shaped pipes. The turbulent kinetic energy is stronger in a two-phase flow than in a single-phase flow. Using the 1D centerline-based mesh generation technique, we demonstrate the changes in pressure and the turbulent kinetic energy of the single- and two-phase flows, which could be observed in curve pipes.

1. Introduction

Flows in pipes are most commonly observed in an industrial system (e.g., energy plant and refrigeration); hence, many studies on straight and curve pipelines for single- and two-phase flows have been presented. In straight pipes [1], the axial velocity gradient, called the primary flow, is the dominant property of the velocity field. In curve pipes [2,3], the velocity field in the cross-section, called the secondary flow, is also an important characteristic in addition to the primary flow. Aside from the velocity field properties, curve pipes can also generate pressure gradients in the radial direction by flow inertia. A two-phase flow in a pipe [4,5] appears in various industrial sites, such as steam pipes, boilers, refrigerant pipes, and refineries in power plants. In the case of a straight pipe with two-phase flows, the buoyancy caused by the density difference is the primary force determining the volume fraction of two-phase fluids at a low Reynolds number. In the case of a curve pipe with two-phase flows, the volume fraction of two-phase fluids could be determined by the balance between the centrifugal and buoyancy forces. Thus, investigating the effects of buoyancy and centrifugal forces on the two-phase flow is critical for understanding the flow physics in curve regions and the redistribution of volume fraction.
Many studies on the curve pipe have been performed for the 90°- and 180°-curved cases. Abdulkadir et al. [6] studied the two-phase flow for the right angle-bent pipe and found that the annular flow pattern was maintained in both before and after the curve pipe. Andrade et al. [7] studied the water–oil two-phase flow in the curve pipe, showing the optimal condition for reproducing the annular flow with less friction. Helical structures are also widely used at the industrial site, and two-phase flows frequently occur in this pipe type. In addition, Saffari et al. [8] performed experiments on the inner flow in a helical pipe with both single- and two-phase flows. They found that the fluid friction can be determined by the gas volume fraction at the two-phase flow, and drags are less than those observed for a single-phase flow. Da Mota and Pagano [9] obtained both experimental and numerical results of two-phase flows in the helical pipe and utilized centrifugal force to separate the two phases. Meanwhile, Lee [10] numerically investigated the bubbly flow in a U-shaped curve pipe. The secondary flow at the curve pipe was found to be less dominant in the two-phase flow compared to the single-phase flow. The secondary flow depends on the curvature of the pipe, which is a characteristic length of the pipe section [11]. Thus, the secondary flow that occurs in C- and U-shaped pipes causes a much more complex interphase interaction compared with that in L-shaped pipes. This phenomenon allows for unstable flow, which leads to danger at industrial sites.
Several industrial applications of C- and U-shaped pipes have been investigated. For instance, Rachman et al. [12] studied the effect of U-shaped pipes on relative humidity and reported that a U-shaped pipe can reduce relative humidity by up to about 21%. Thus, the use of U-shaped pipe decreases the required work of heating, ventilation, and air conditioning (HVAC) systems by up to 647 W. Likewise, Ong et al. [13] studied the performance of a C-shaped pipe in a typical HVAC system and concluded that the aspect ratio of the pipe could affect its performance in the heat exchanger. Takemura et al. [14] performed an experiment to investigate the flow behavior and pressure drop in air–water two-phase flows by imposing two opposite gravitational directions on a U-shaped pipe, i.e., a U-shaped pipe and an inverted-U-shaped pipe. They found that the inverted U-shaped pipe has a wider safety region, which is better than that of the U-shaped pipe at preventing drying out. Therefore, inverted-U-shaped pipes are preferable for industrial design.
Based on these backgrounds, it is essential to perform a comprehensive study to investigate the single- and two-phase flows in C- and U-shaped pipes simultaneously. Moreover, the inverted-C and inverted-U-shaped pipes also need to be analyzed [14]. Therefore, the present study aims to investigate the pressure changes, bubble dynamics, and flow physics in vertically and horizontally positioned curved pipes. We assessed the effects of four different gravitational directions (i.e., upward-C-shaped pipe, downward-C-shaped pipe, U-shaped pipe with upward injection, and U-shaped pipe with downward injection) on flow energy, pressure drop, volume fraction, flow behaviors, and turbulence physics. This different pipe positioning is often observed at actual industrial sites.
Furthermore, we constructed an algorithm that connects the entire procedure—pre-processing, CFD simulation, and post-processing. First, we utilized our semi-automatic mesh generator for uniform and nonuniform mesh generation for quantitative analyses. This approach divides the analysis domain into several zones, thereby offering a considerable advantage in the quantification of energy changes of the flow for the subdomains. Next, CFD simulation was performed using the open-source software OpenFOAM. The post-processing of CFD after the CFD simulation could be expedited, because the domain had already been divided into subzones.

2. Numerical Methods

We employed the open-source software, OpenFOAM v.6, based on the finite volume method solving the incompressible Navier–Stokes equations. The pressure-implicit method for pressure-linked equation was used to obtain the transient pressure and velocity fields. The implicit Euler and central difference schemes were particularly used for the temporal and spatial discretizations, respectively. We used the van Leer and limited linear for the discretization of the convective terms in the momentum and phase equations, respectively. The mass and momentum conservation equations, including a two-fluid model, are described below.

2.1. Governing Equations

A two-fluid model is mostly used to simulate dispersed flows. It permits multiple bubbles or droplets in a grid; hence, it can predict bubbly flows with a small number of grids [15]. The continuous Eulerian phases are treated as dispersed systems, and each phase has its own density and viscosity properties. The governing equations are as follows:
α i t + ( α i u i ) = 0 ,
( α i ρ i u i ) t + ( α i ρ i u i u i ) = α i p + ( α i τ ) + α i ρ i g + f σ i + M i ,
where αi, ui, ρi, p, τ , g, f σ i , and Mi are the volume fraction, flow velocity vector, fluid density, static pressure, viscous stress tensor, gravitational acceleration, surface tension force, and momentum transfer, respectively. Subscript i indicates the respective phases for liquid: 1 and gas: 2. On account of independent momentum equations, the velocity of each phase can be different at the cells, and the momentum transfer term Mi is necessary. We considered the drag, lift, and virtual mass force effects:
M i = M i , d r a g + M i , l i f t + M i , V M ,
where Mi,drag, Mi,lift, and Mi,VM are the momentum transfers caused by the effects of drag, lift, and virtual mass force, respectively. The momentum transfer caused by the Basset force was neglected, because the particle diameter herein was greater than 1 μm [16]. The drag force term is described as follows
M i , d r a g = 3 4 α i α i ( α j C D , i ρ i d p , i + α i C D , j ρ i d p , j ) | u r | u r ,
where CD,i, dp,i, and ur are the drag coefficient, particle diameter, and relative velocity vector at the ith phase, respectively. Subscript j indicates the fluid phase counterpart of the phase indicated by i. The lift force term is defined as follows:
M i , l i f t = α i α i ( α i C L , i ρ i + α i C L , i ρ i ) u r ( × u l ) ,  
where CL,i and ul are the lift force coefficient and the velocity vector of the liquid phase, respectively. The virtual mass force term is evaluated as
M i , V M = α i α j C V M ρ j { ( u j t + u j u j ) ( u i t + u i u i ) } .
The virtual mass coefficient CVM was set to 0.5.

2.2. Turbulence Model

The Smagorinsky LES turbulence model was used in OpenFOAM to resolve the sub-grid scale turbulent eddy viscosity. The turbulent sub-grid scale eddy viscosity in the LES model is defined as follows:
ν t = ( C s Δ ) 2 | S | ,
| S | = 2 S S ,
S = 1 2 ( u + u T ) ,
where Cs, Δ , and S are the Smagorinsky coefficient, characteristic grid length, and strain tensor of the filtered velocity, respectively. The Smagorinsky coefficient Cs was set to 0.094 herein.

2.3. Mesh Generation

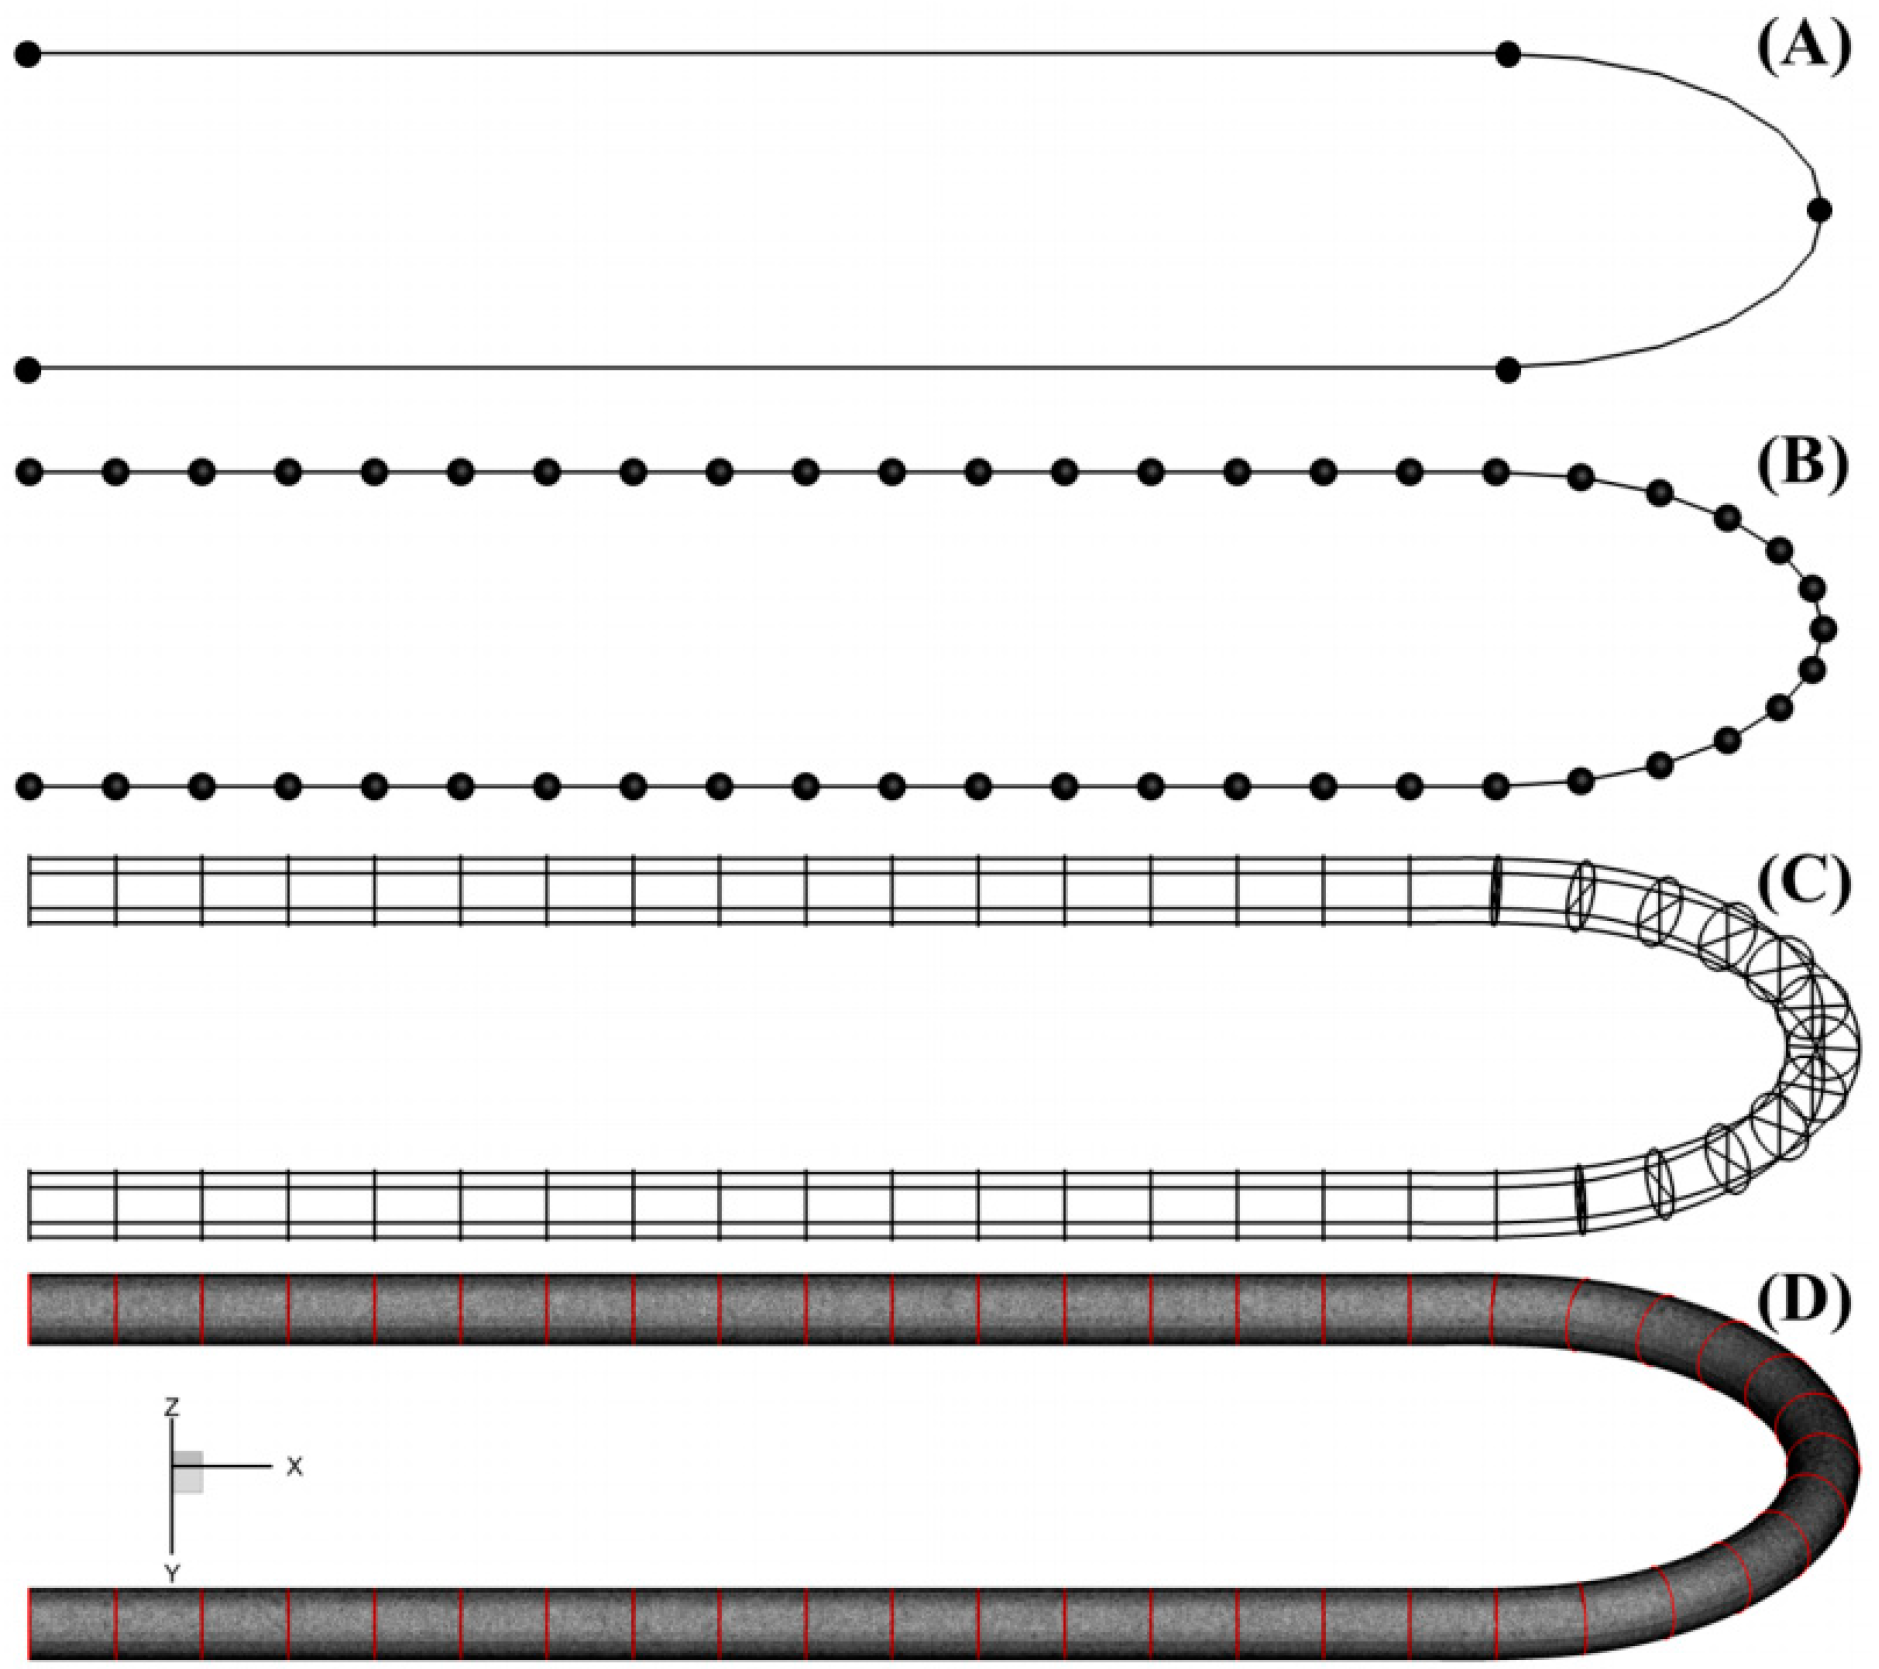
We employed a 1D centerline-based mesh generation algorithm [17] to construct a curve pipe, which is beneficial when performing a control volume analysis in a subdomain. The pipe geometry (Figure 1) was composed of a horizontal part and a curvature part with a specific cross-section diameter. The cross-sectional area was constant, and the inner surface was smooth; hence, the pipe mesh was generated by specifying the number of nodes via the radial and angular directions of the cross-section. In our code, the cross-sectional faces are defined at the pre-described nodal points of individually divided lines. These faces then become the intermediate boundary of each volume zone. The algorithm for the mesh generation in the pipe is elaborated below:
  • Sweep the centerline (Figure 2A) to create the geometry. The linear and curve lines are written at the output file as the start and end points of each line, where the curve line additionally has the center point of the arc.
  • Divide the 1D centerline into several linear lines (Figure 2B) using the Python programming language. Each line contains information of the cross-section radius and the divided line length; thus, we use the radius–length ratio to set the number of divided parts.
  • Generate the last output before applying the meshing algorithm (Figure 2C).
  • Apply the existing meshing algorithm [17]. The bold red circles represent the edges of every cross-section zone (Figure 2D). Surface and volume meshes are then constructed.
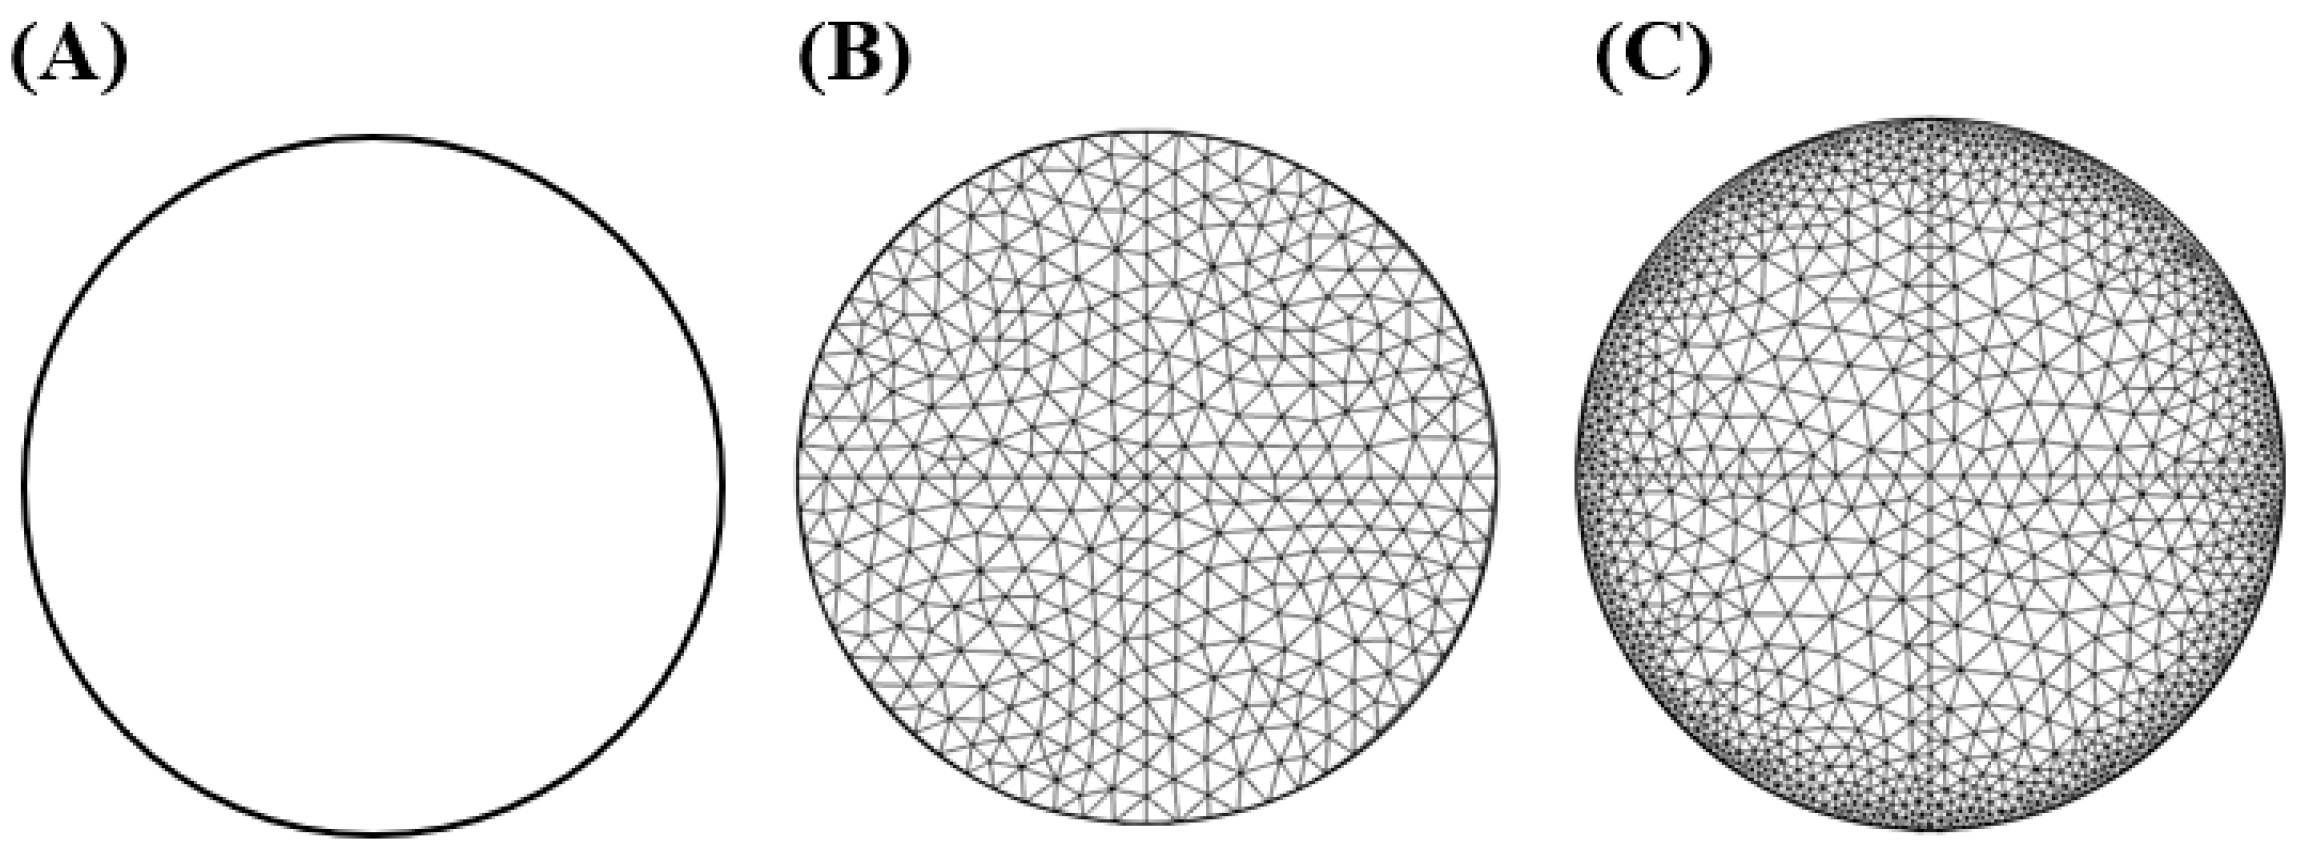
Along with a library, called TetGen, the freeware mesh-generating software “Gmsh” [18] was used to construct the surface and volume meshes (Figure 3A,B). The inlet, outlet, walls, divided volumes, and cross-section zones at the pipe meshes are defined accordingly. This algorithm could also generate non-uniform meshes (Figure 3C) in both axial and radial directions by providing the surface geometry and non-uniform grid size distribution to Gmsh and the non-uniform surface mesh to TetGen for generating the non-uniform volume mesh. Further details could be found in the reference [17].

2.4. Benchmark Case

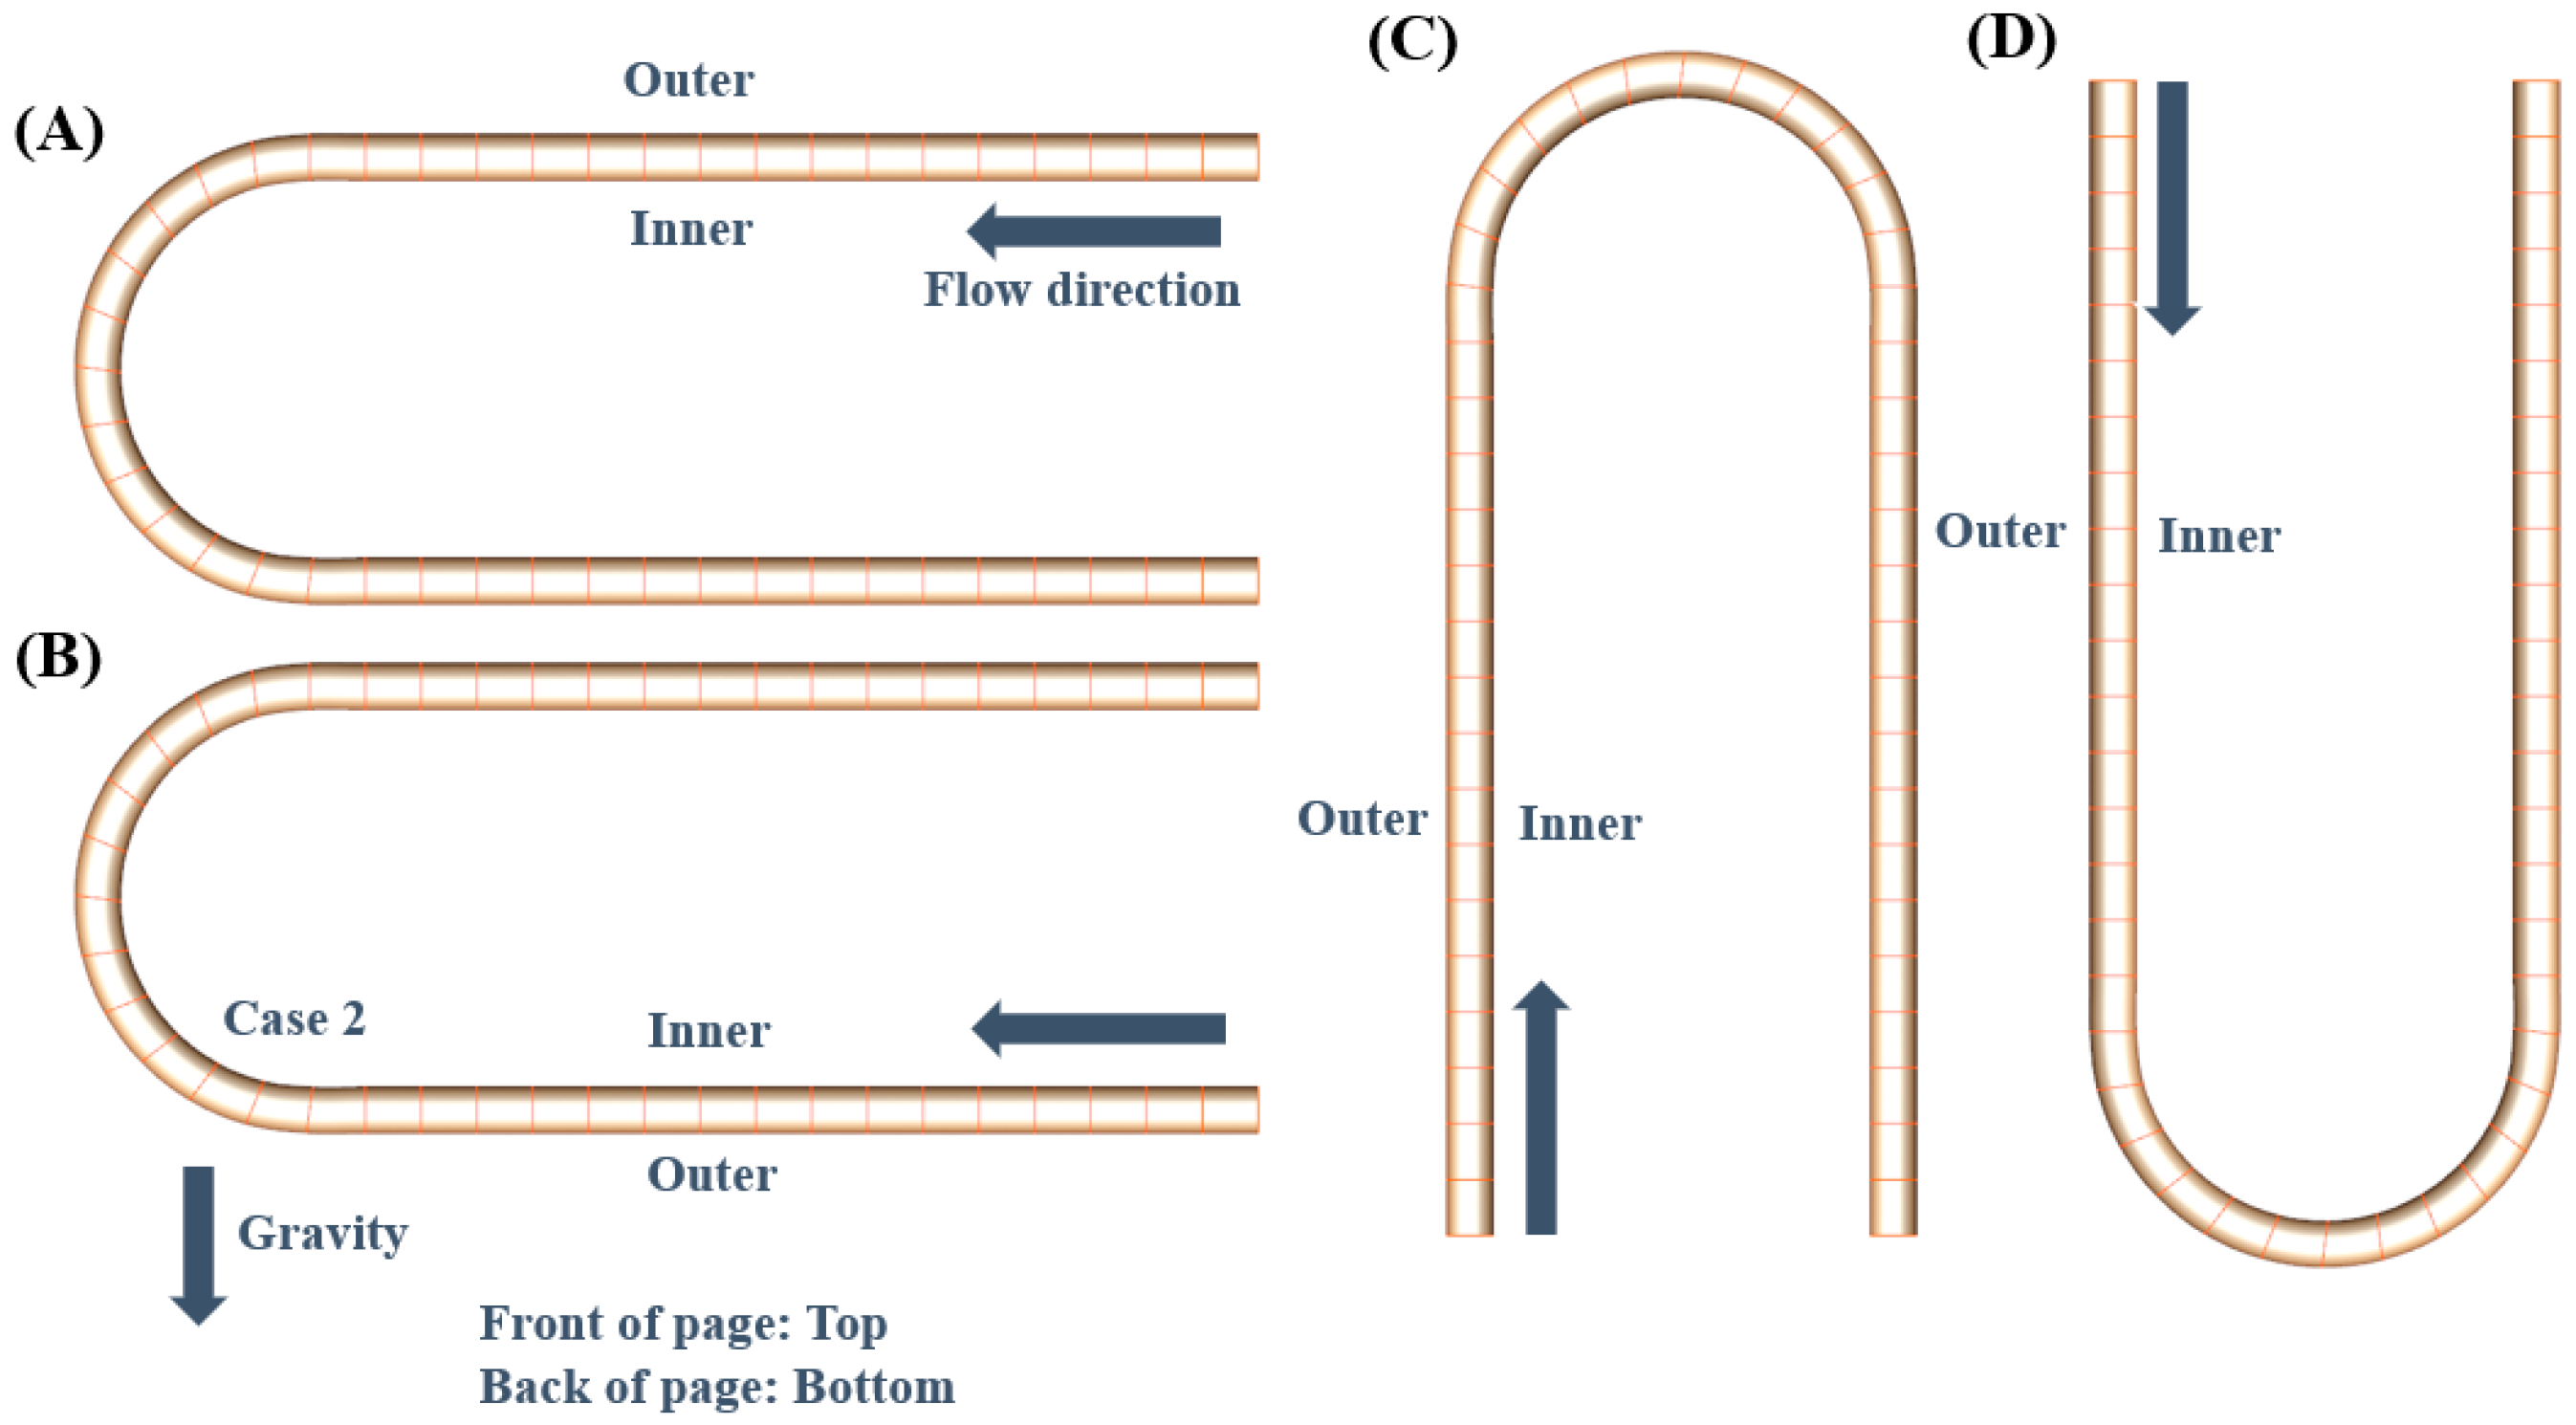
This section presents the benchmark cases for validating CFD results. A C-shaped curve pipe with an upward injection (Figure 4A) was used to evaluate the interaction between the bubble and the liquid in the internal flow. In the benchmark case, water was used for filling an initial computational domain. The pipe dimensions were 560, 28, and 125 mm for L, D, and R, respectively (see Figure 1), consistent with the experimental device [19]. Air bubbles and water were uniformly injected from the whole inlet face with 0.94% air volume fraction. To be similar with the experimental condition, the inflow velocity magnitudes were set to 1.43 m/s for water phase, and 0 m/s for air phase [19], resulting in a Reynolds number of 40,000 for the water phase. The Re was computed as
R e w = ρ w U w D μ w
where ρ w , Uw, D, and μ w are the water density, average velocity magnitude of water, diameter of the pipe, and dynamic viscosity of water, respectively.
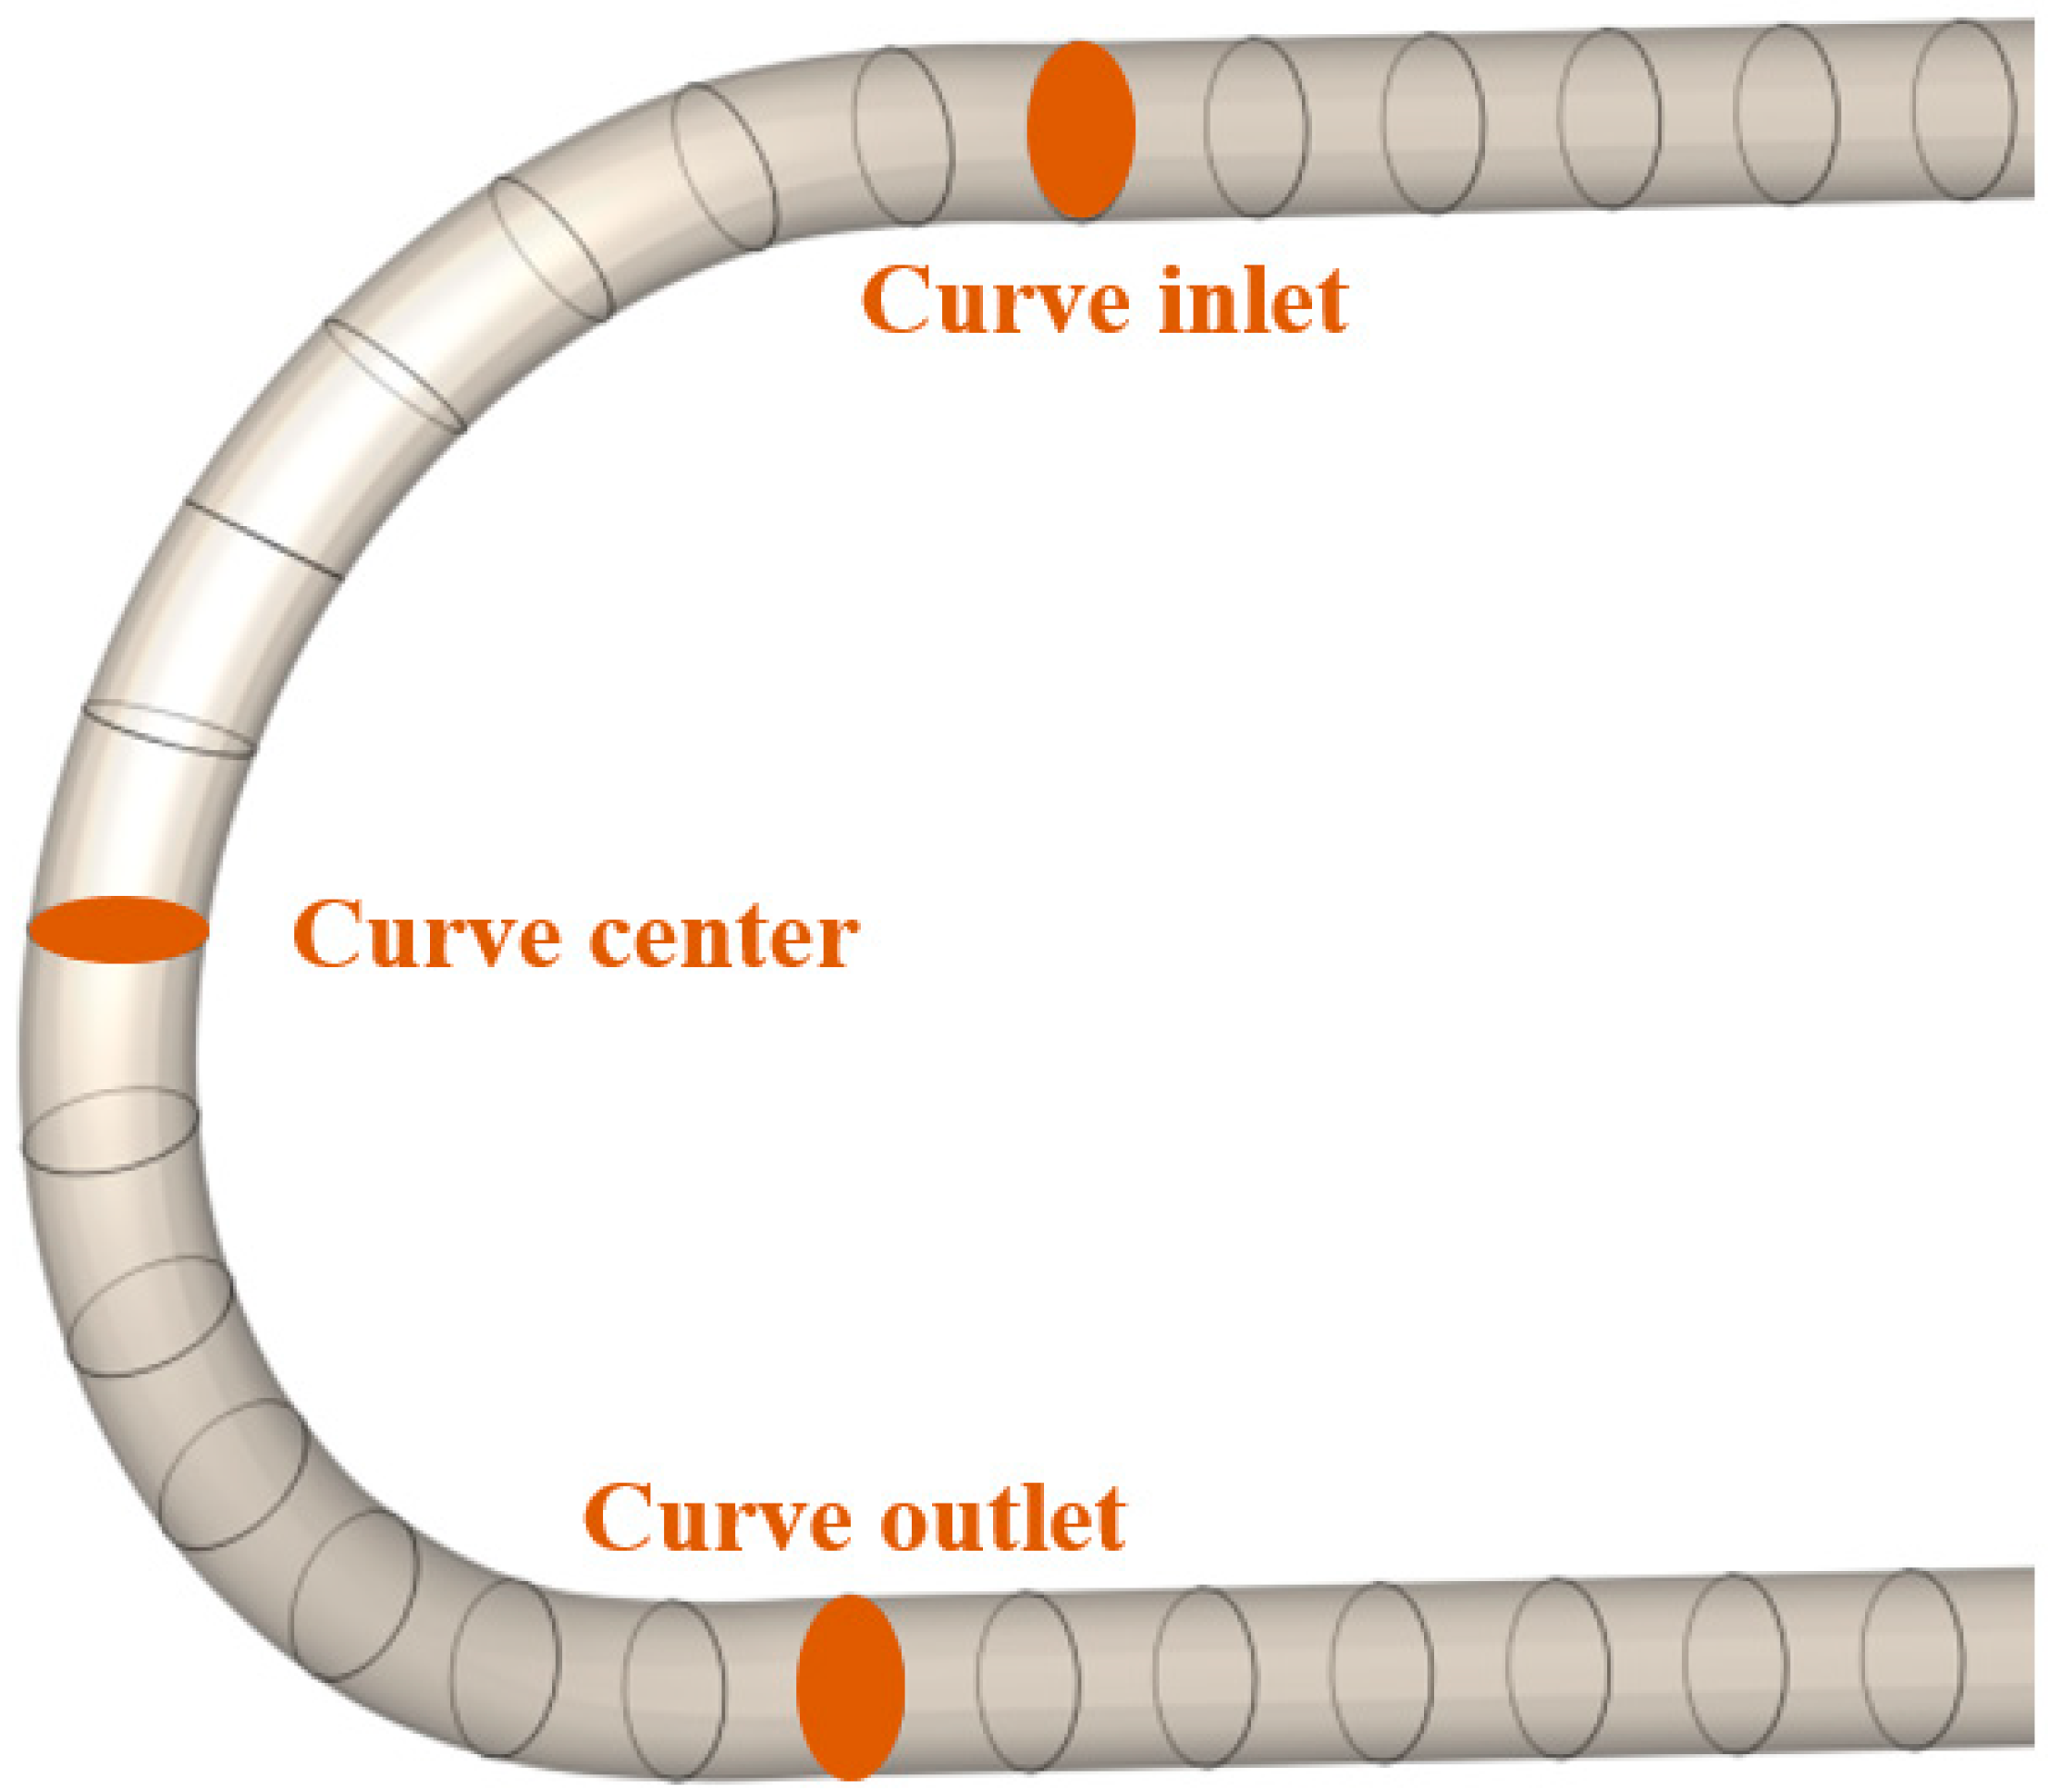
After validating the velocity behaviors with the experiment, the inflow velocity magnitudes were set to 1.43 m/s for both water and air phases. This leads to a superficial velocity of 1.416 and 0.0134 m/s for water and air phases, respectively. We then performed two additional simulations with air volume fractions of 2% and 3%, respectively, to see the effect of volume fraction in the two-phase flow through 180 bends. The superficial velocities of water and air phases for 2% were 1.401 and 0.028 m/s, respectively; those for 3% were 1.387 and 0.043 m/s, respectively. No-slip boundary conditions were imposed at all walls. A zero-gradient velocity condition and a constant pressure were applied at the outlet. The detail numerical settings and boundary conditions are listed in Table 1. The fluid is injected to the pipe inlet with the uniform velocity (uface = uref, where ref is the reference value) and the air fraction of 0.94%; the velocity at the outlet is extrapolated to the patch from the nearest cell value, and thus its gradient is equal to zero in direction perpendicular to the outlet ( u n = 0 , where n is the unit outward normal vector on the boundary). The direction of gravity was −z (Figure 2) with 9.81 m/s2 magnitude. A two-phase fluid was injected at the inlet (i.e., the start of the upper horizontal pipe). It then went downside through the curve pipe and emitted at the outlet at the end of the lower horizontal pipe (Case 1, Figure 4). For a quantitative validation, the axial velocities of the fluids were compared at angles of 0° (curve inlet), 90° (curve center), and 180° (curve outlet) of the curve region.

2.5. Four Different Gravity Cases

We performed three additional simulations with different gravitational directions (Figure 4B–D) and set different gravitational directions with the same magnitude from that of the benchmark case. Thus, cases 2 to 4 involved a C-shaped pipe with a downward injection, a U-shaped pipe with an upward injection, and a U-shaped pipe with a downward injection, respectively. We calculated the static pressure in the control surface, dynamic pressure in the control surface, hydrostatic pressure change in the control volume, and total pressure change in the control volume as follows depending on the gravitational directions:
P ST = p d A d A ,
{ P K E a i r = 0.5 ρ a i r α a i r U a i r 2 d A d A P K E w a t e r = 0.5 ρ w a t e r α w a t e r U w a t e r 2 d A d A P KE = P K E a i r + P K E w a t e r =   0.5   ( ρ a i r α a i r U a i r 2 d A   +   ρ w a t e r α w a t e r U w a t e r 2 d A ) d A
Δ P PE = ( α air ρ air   +   α w a t e r   ρ water ) g z   d V d V ,
Δ P T O T = Δ P S T + Δ P K E + Δ P P E
where ρ a i r , ρ w a t e r , α a i r , α w a t e r , U a i r , and U w a t e r are the air density, water density, air volume fraction, water volume fraction, air velocity magnitude, and water velocity magnitude, respectively. The simulations were calculated with a time step of 1 × 10⁻⁵ s to satisfy the CFL number below 1. The computational simulations are first performed until they reach a quasi-steady or steady state (t = 1.4 s for this case), and they are additionally performed until t = 4 s for the turbulent statistics to obtain the mean velocity and pressure fields. In this study, the maximum CFL number of 0.5 is imposed to guarantee the temporal stability of the simulation.

3. Results and Discussion

3.1. Benchmark Results

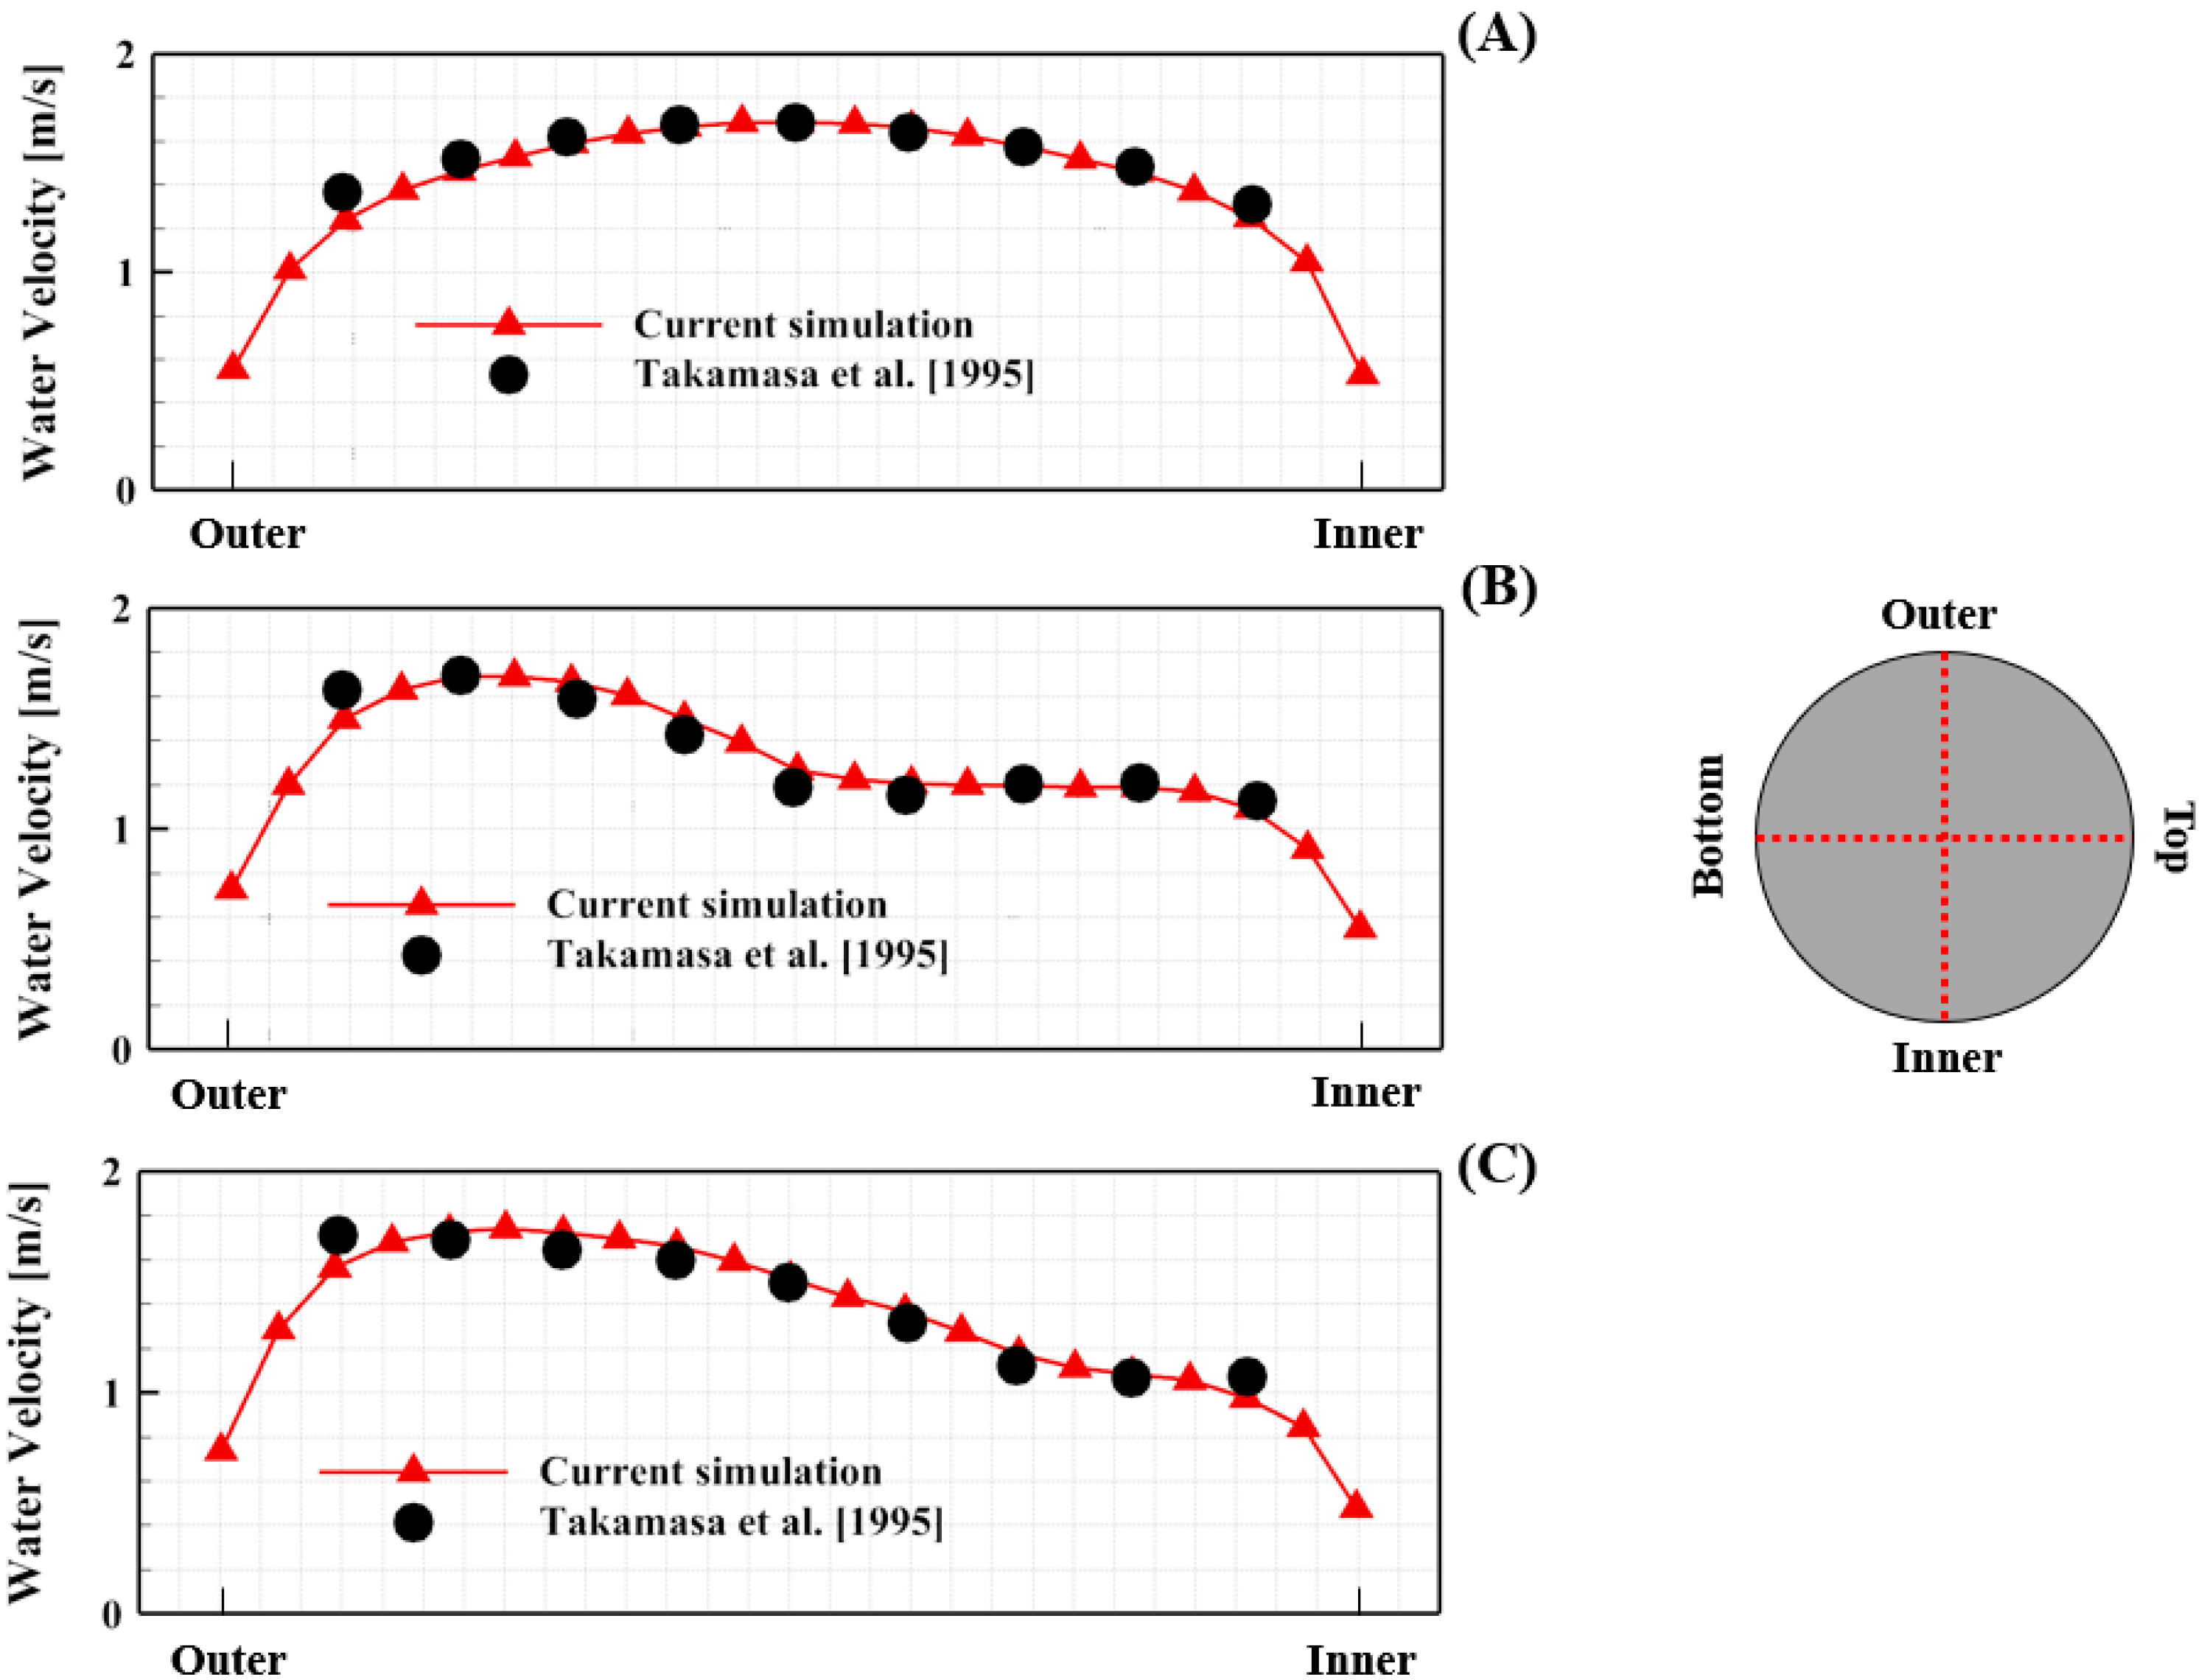
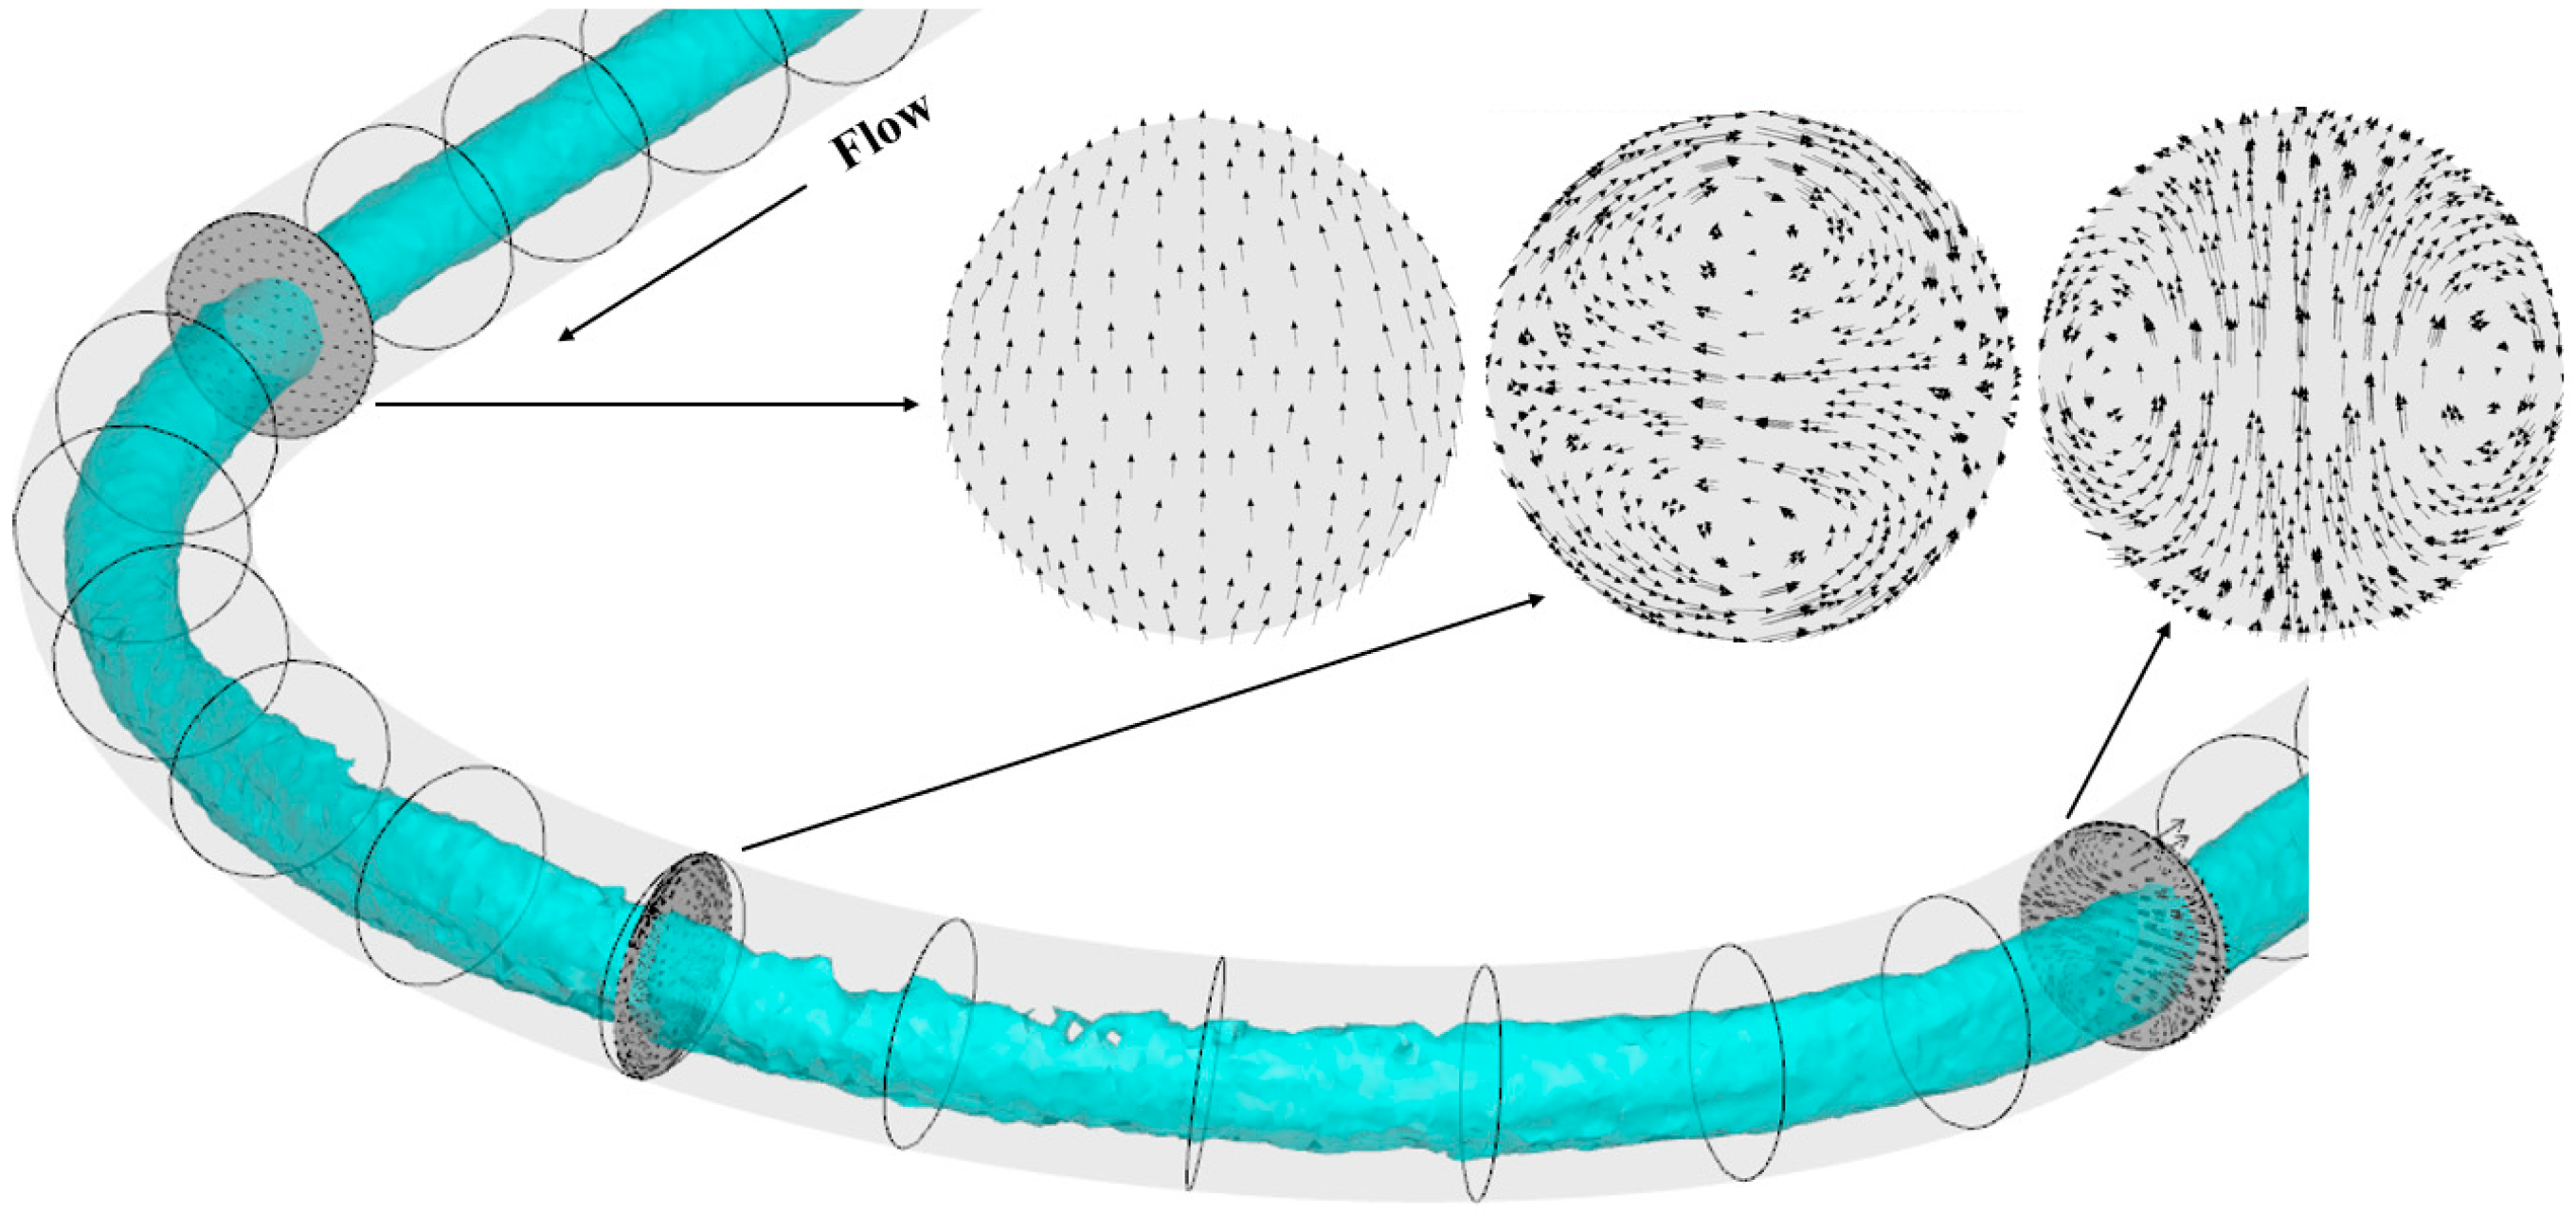
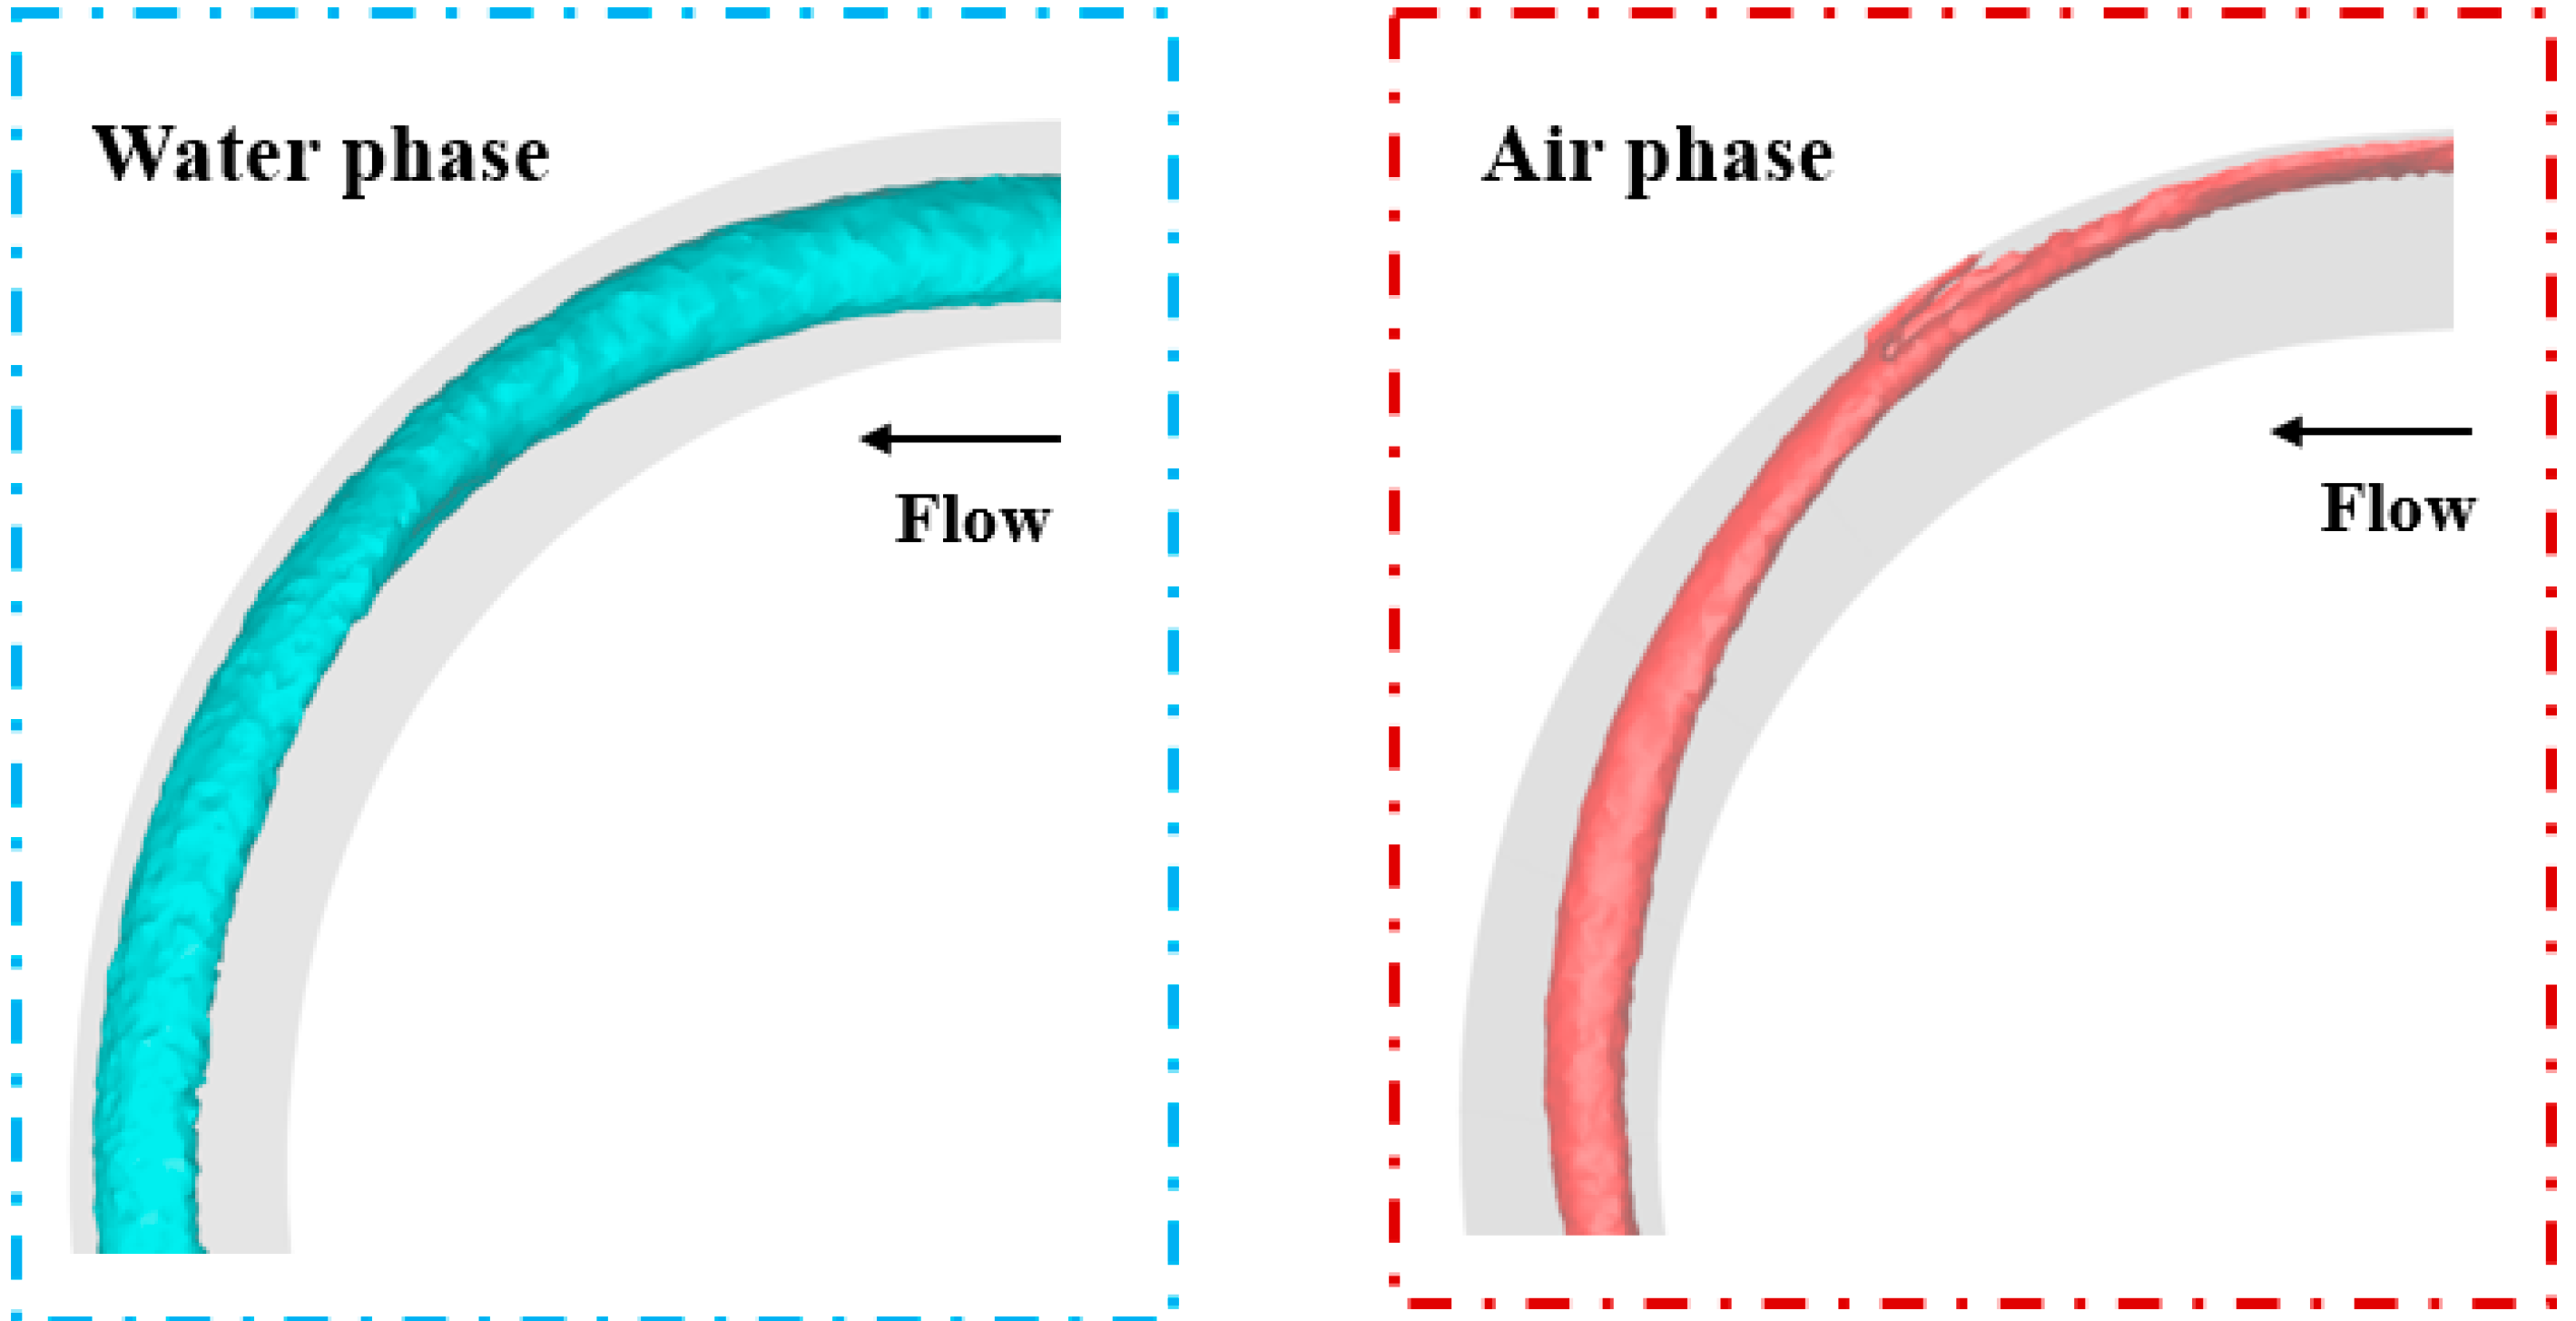
For the validation of the CFD results, we checked the axial velocity of the water phase at the three cross-sectional zones of the curve inlet, curve center, and curve outlet (Figure 5) in consistency with a previous study [19]. Figure 6 presents the axial velocities of the water phase. The results in the three cross-section zones were in a good agreement with the existing experimental data. In the case of the curve inlet, which started to enter the curve section, the flow seemed to be fully developed, showing a symmetric distribution of the velocity profile. The maximum axial velocity magnitude at the curve center seemed to shift from the center to the region near the outer wall. Subsequently, the trend became much clearer at the curve outlet, which is quantitatively consistent with the benchmark results. Figure 7 also shows the dynamic behavior of the water phase inside the C-shaped curve pipe along with a visualization of the velocity vectors in the three cross-sections. Note that iso-surface of α a i r = 0.0001 is used in the entire simulation for the visualization of both cases. Initially, the water phase was evenly distributed in the cross-section at the curve inlet and moved near the outer wall under the influence of the inertia force at the curve center and outlet because of the large density ratio between water and air. As the flow passes the curve outlet, the water phase was positioned far away from the inside wall, and the asymmetric distribution of the two phases was sustained in the horizontal straight pipe after the curved region.

3.2. Grid Convergence Test and Sensitivity Analysis of Turbulence Model

This section introduces the grid convergence test for the case of uniform and non-uniform grid. In addition, we carry out a sensitivity analysis of turbulence model to justify the choice of turbulence model in this study.
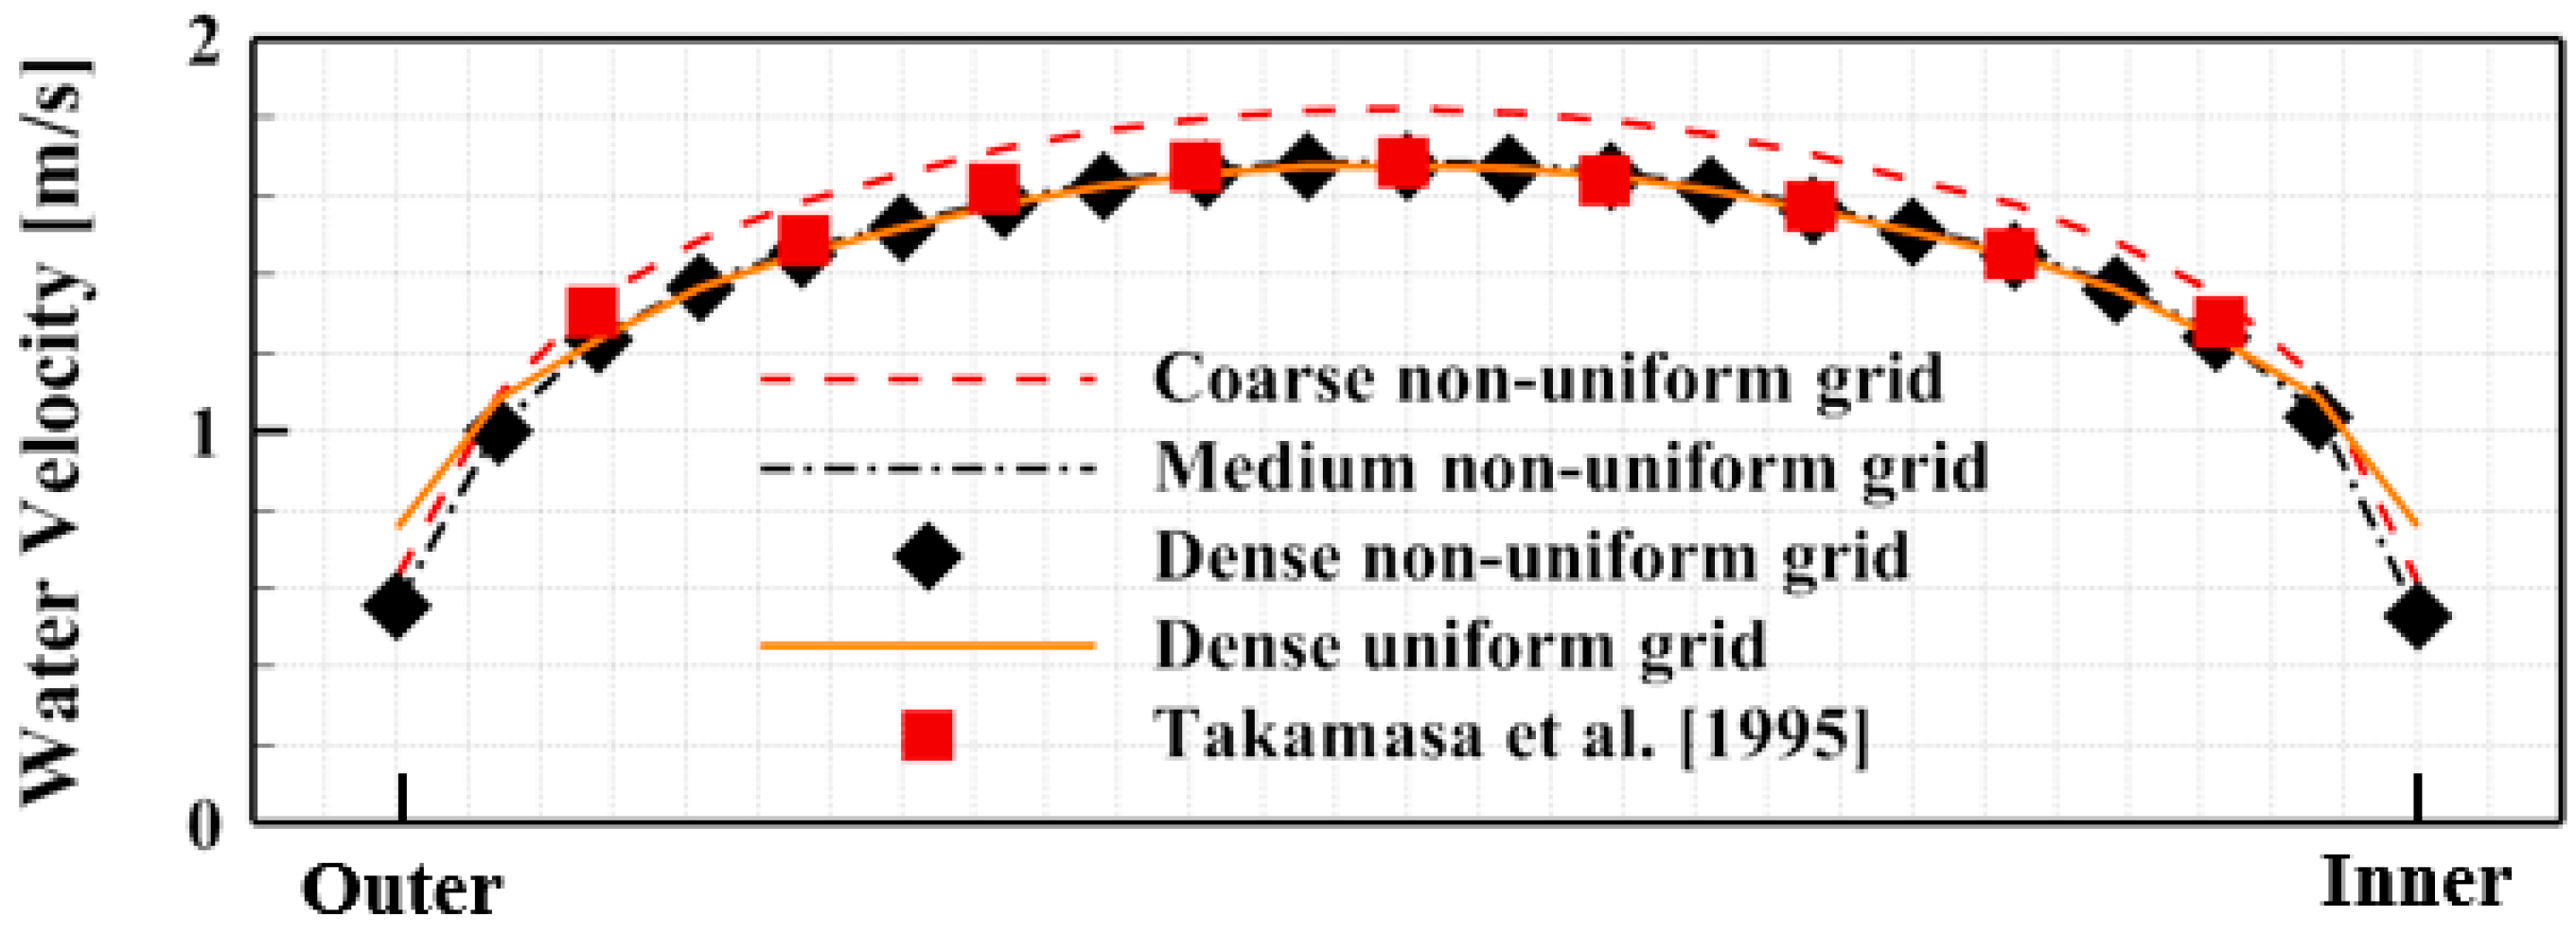
With the benchmark case (i.e., Case 1), we performed a grid convergence test with three different grid sizes (i.e., coarse, medium, and dense grids) to ensure that all solutions are satisfied with the given mesh size (Table 2). The tetrahedral grid is constructed in the entire domain, because our semi-automatic meshing algorithm is optimized for the mesh morphology. In addition, the average y+ and maximum skewness are obtained at 12.4, 4.8, and 2.6, and 0.86, 0.84, and 0.83, for the three types of grids, respectively, ensuring a sufficiently fine mesh near the wall to validate the prediction data using LES turbulence model. Figure 8 shows the quantitative results of the axial water velocity at the curve inlet. The numerical simulations using both medium and dense grids provided almost the same results, while the water velocity was overestimated in the coarse non-uniform grid. Based on the grid sensitivity test, we decided to use a medium grid to ensure both numerical accuracy and computational cost. Figure 8 also depicts a comparison of the water velocity profiles obtained with the uniform and non-uniform grids. The dense uniform grid case contained 4,855,391 tetrahedral cells with 847,095 nodes. The dense non-uniform grid case contained a similar number of cells and nodes, with 5,021,251 tetrahedral cells and 905,524 nodes, but with finer grids near the wall. Overall, the numerical results obtained with the uniform and non-uniform meshes were in a good agreement. However, a slight difference was observed near the inner and outer walls with a large velocity gradient. This difference can possibly be attributed to the non-uniform case with finer grids near the wall capturing the velocity gradient well relative to the uniform case with a finer grid.
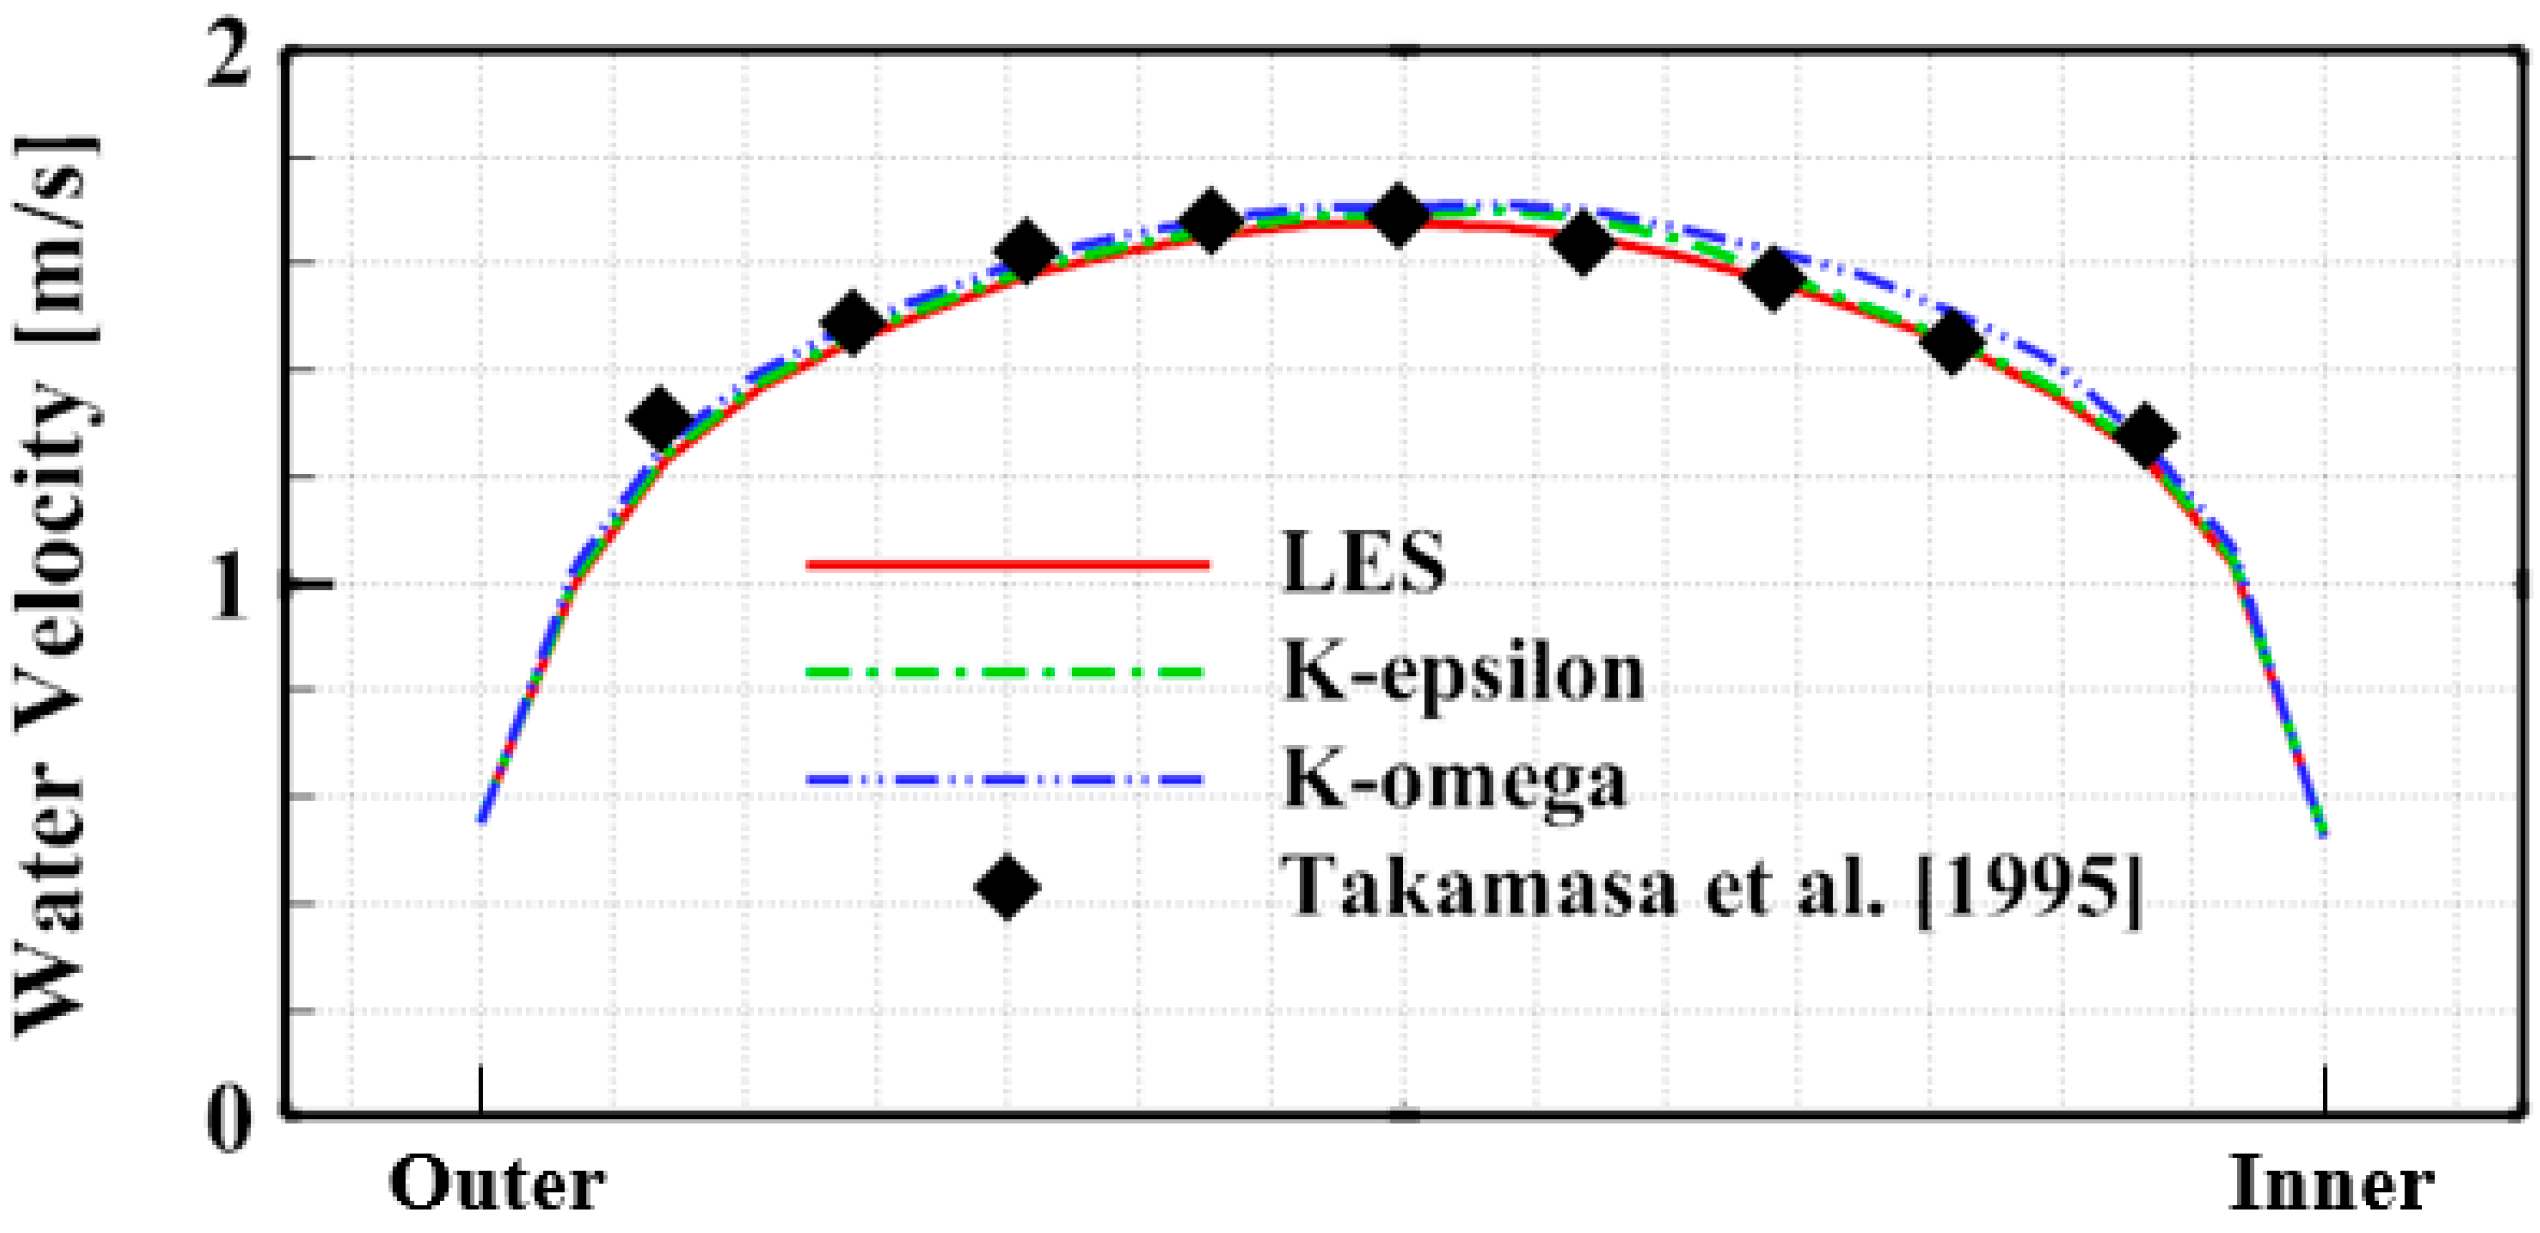
Three turbulence models including LES, k- ω , SST, and k- ε , are carried out for the sensitivity analysis. Figure 9 shows the quantitative results of the axial water velocity at the curve inlet. The numerical simulation using the LES turbulence model is in a good agreement with the experimental data, whereas the axial water velocity obtained from k- ω and k- ε turbulence models were not aligned with the experimental results. Therefore, we employed the LES turbulence model to perform the numerical simulations.

3.3. Velocity and Pressure Distributions Depending on Four Gravitational Directions

3.3.1. Water and Air Velocity Distributions of Two-Phase Flows

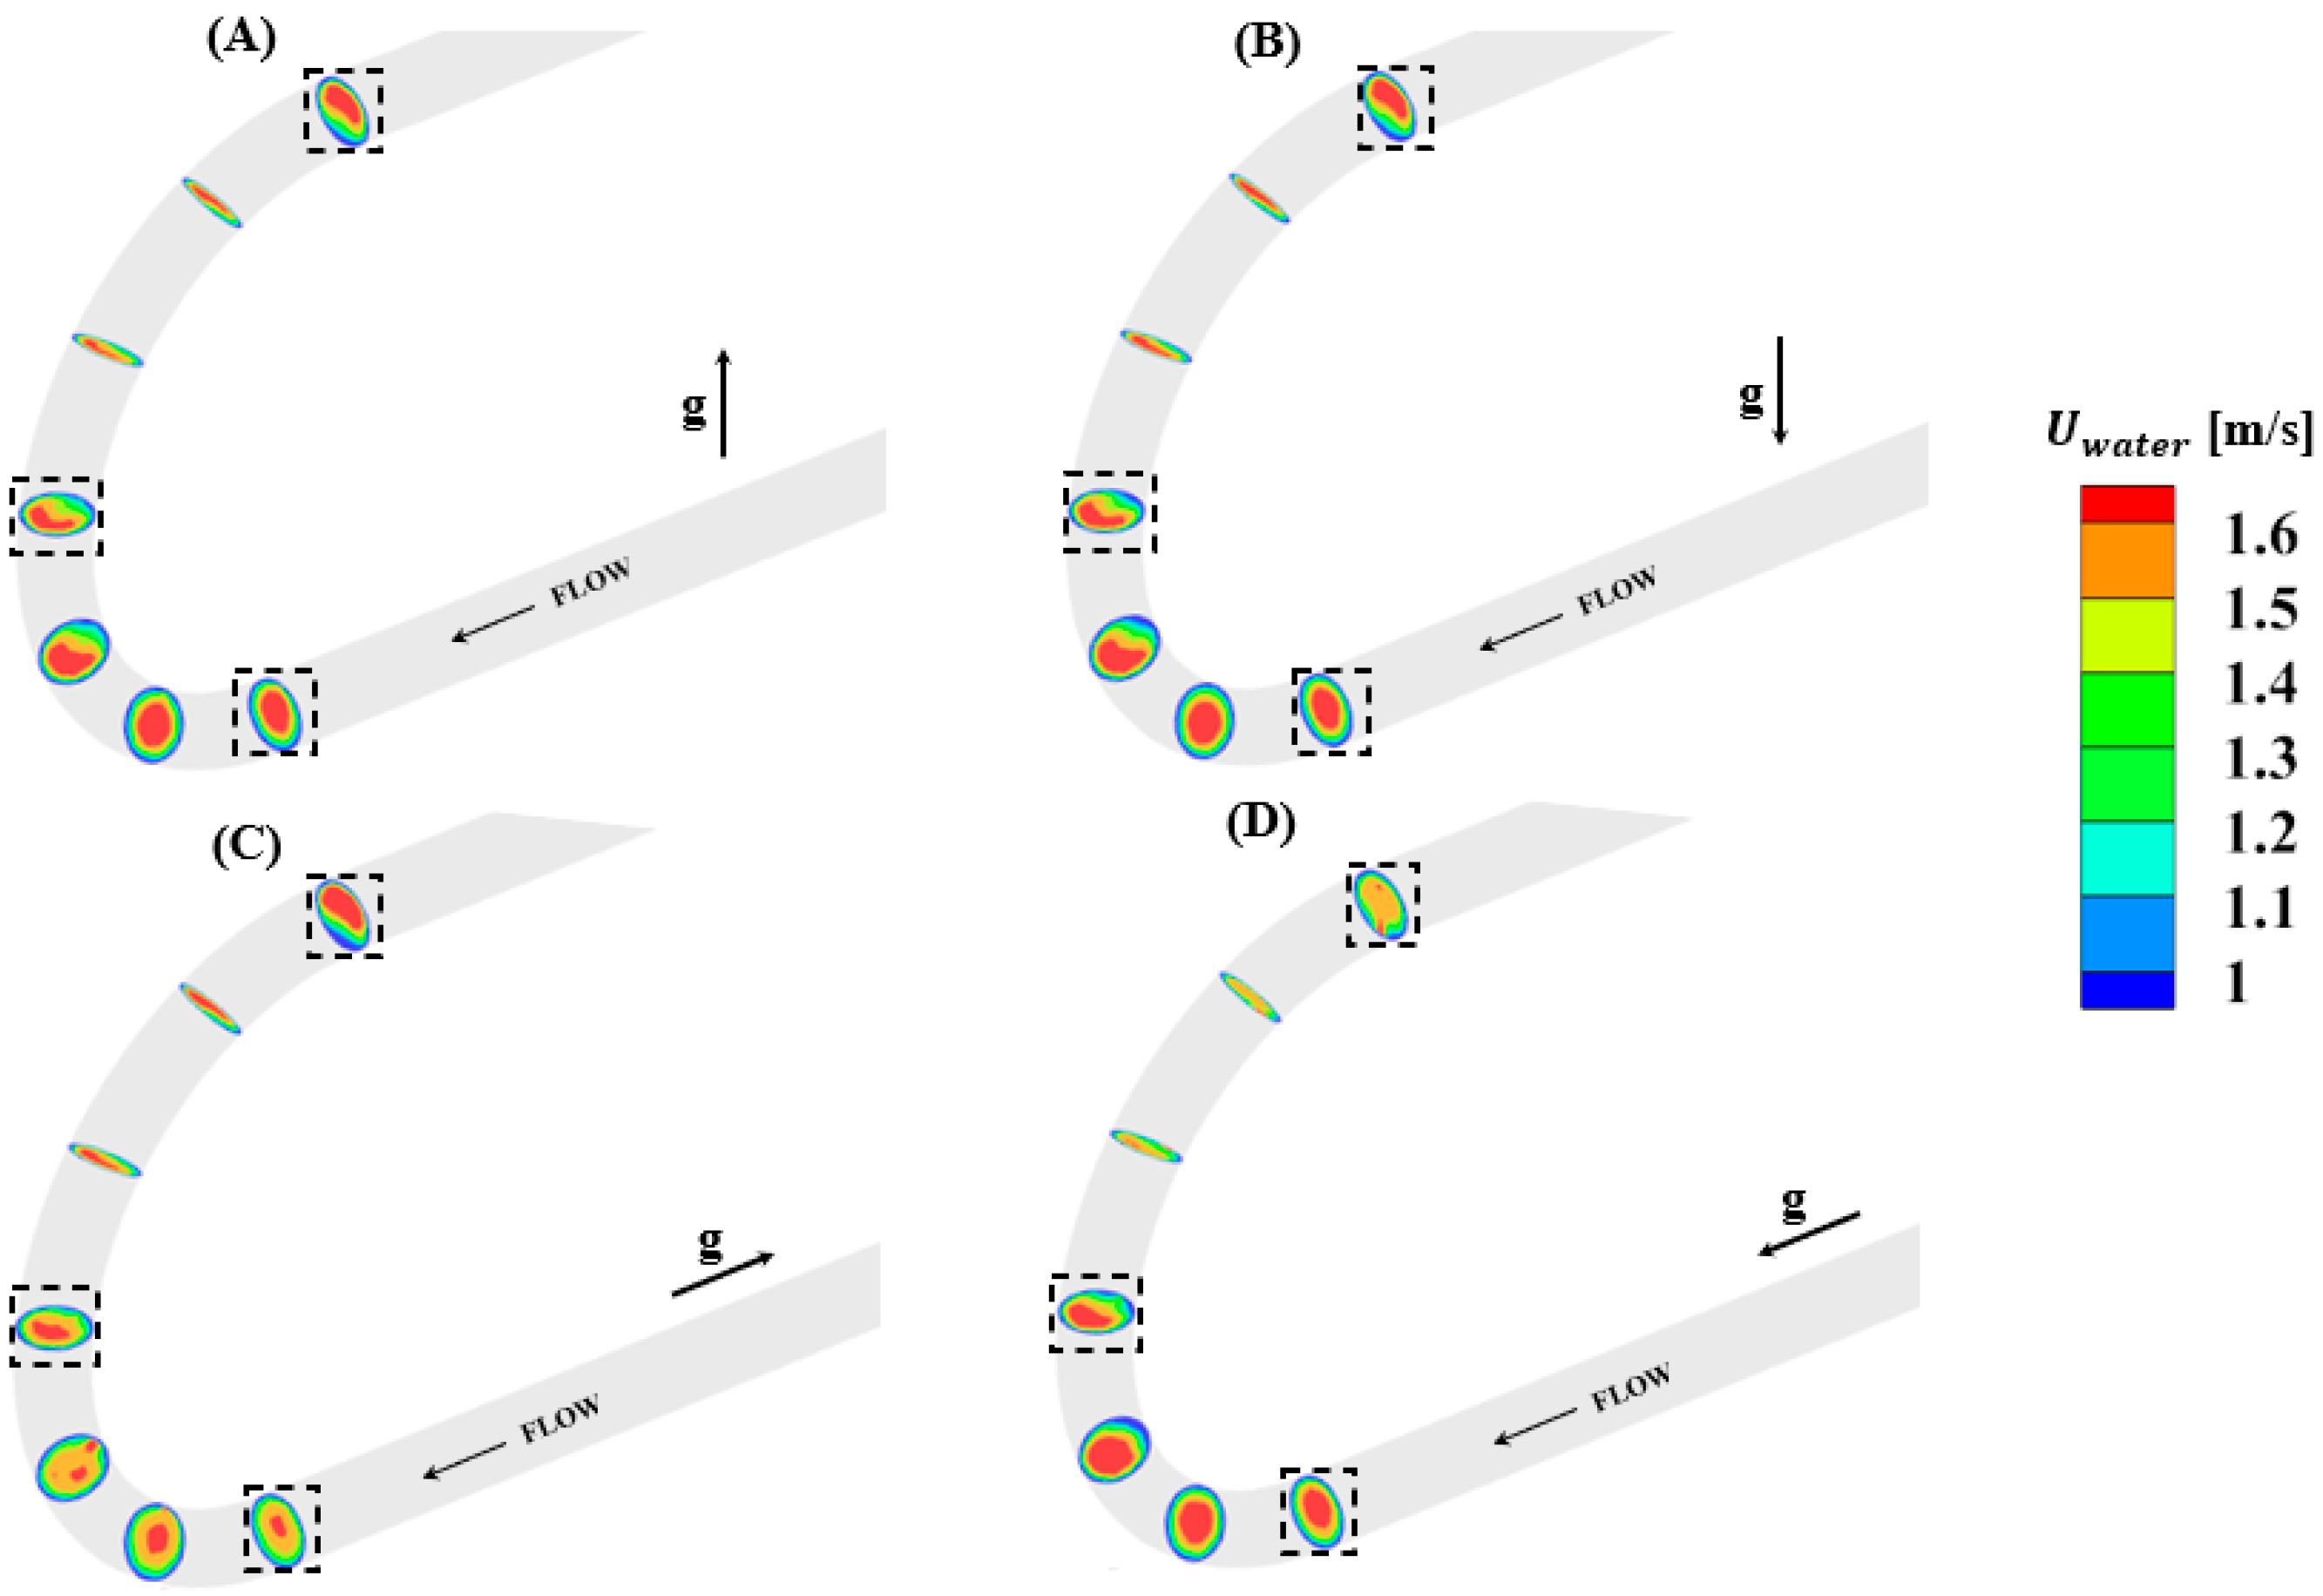
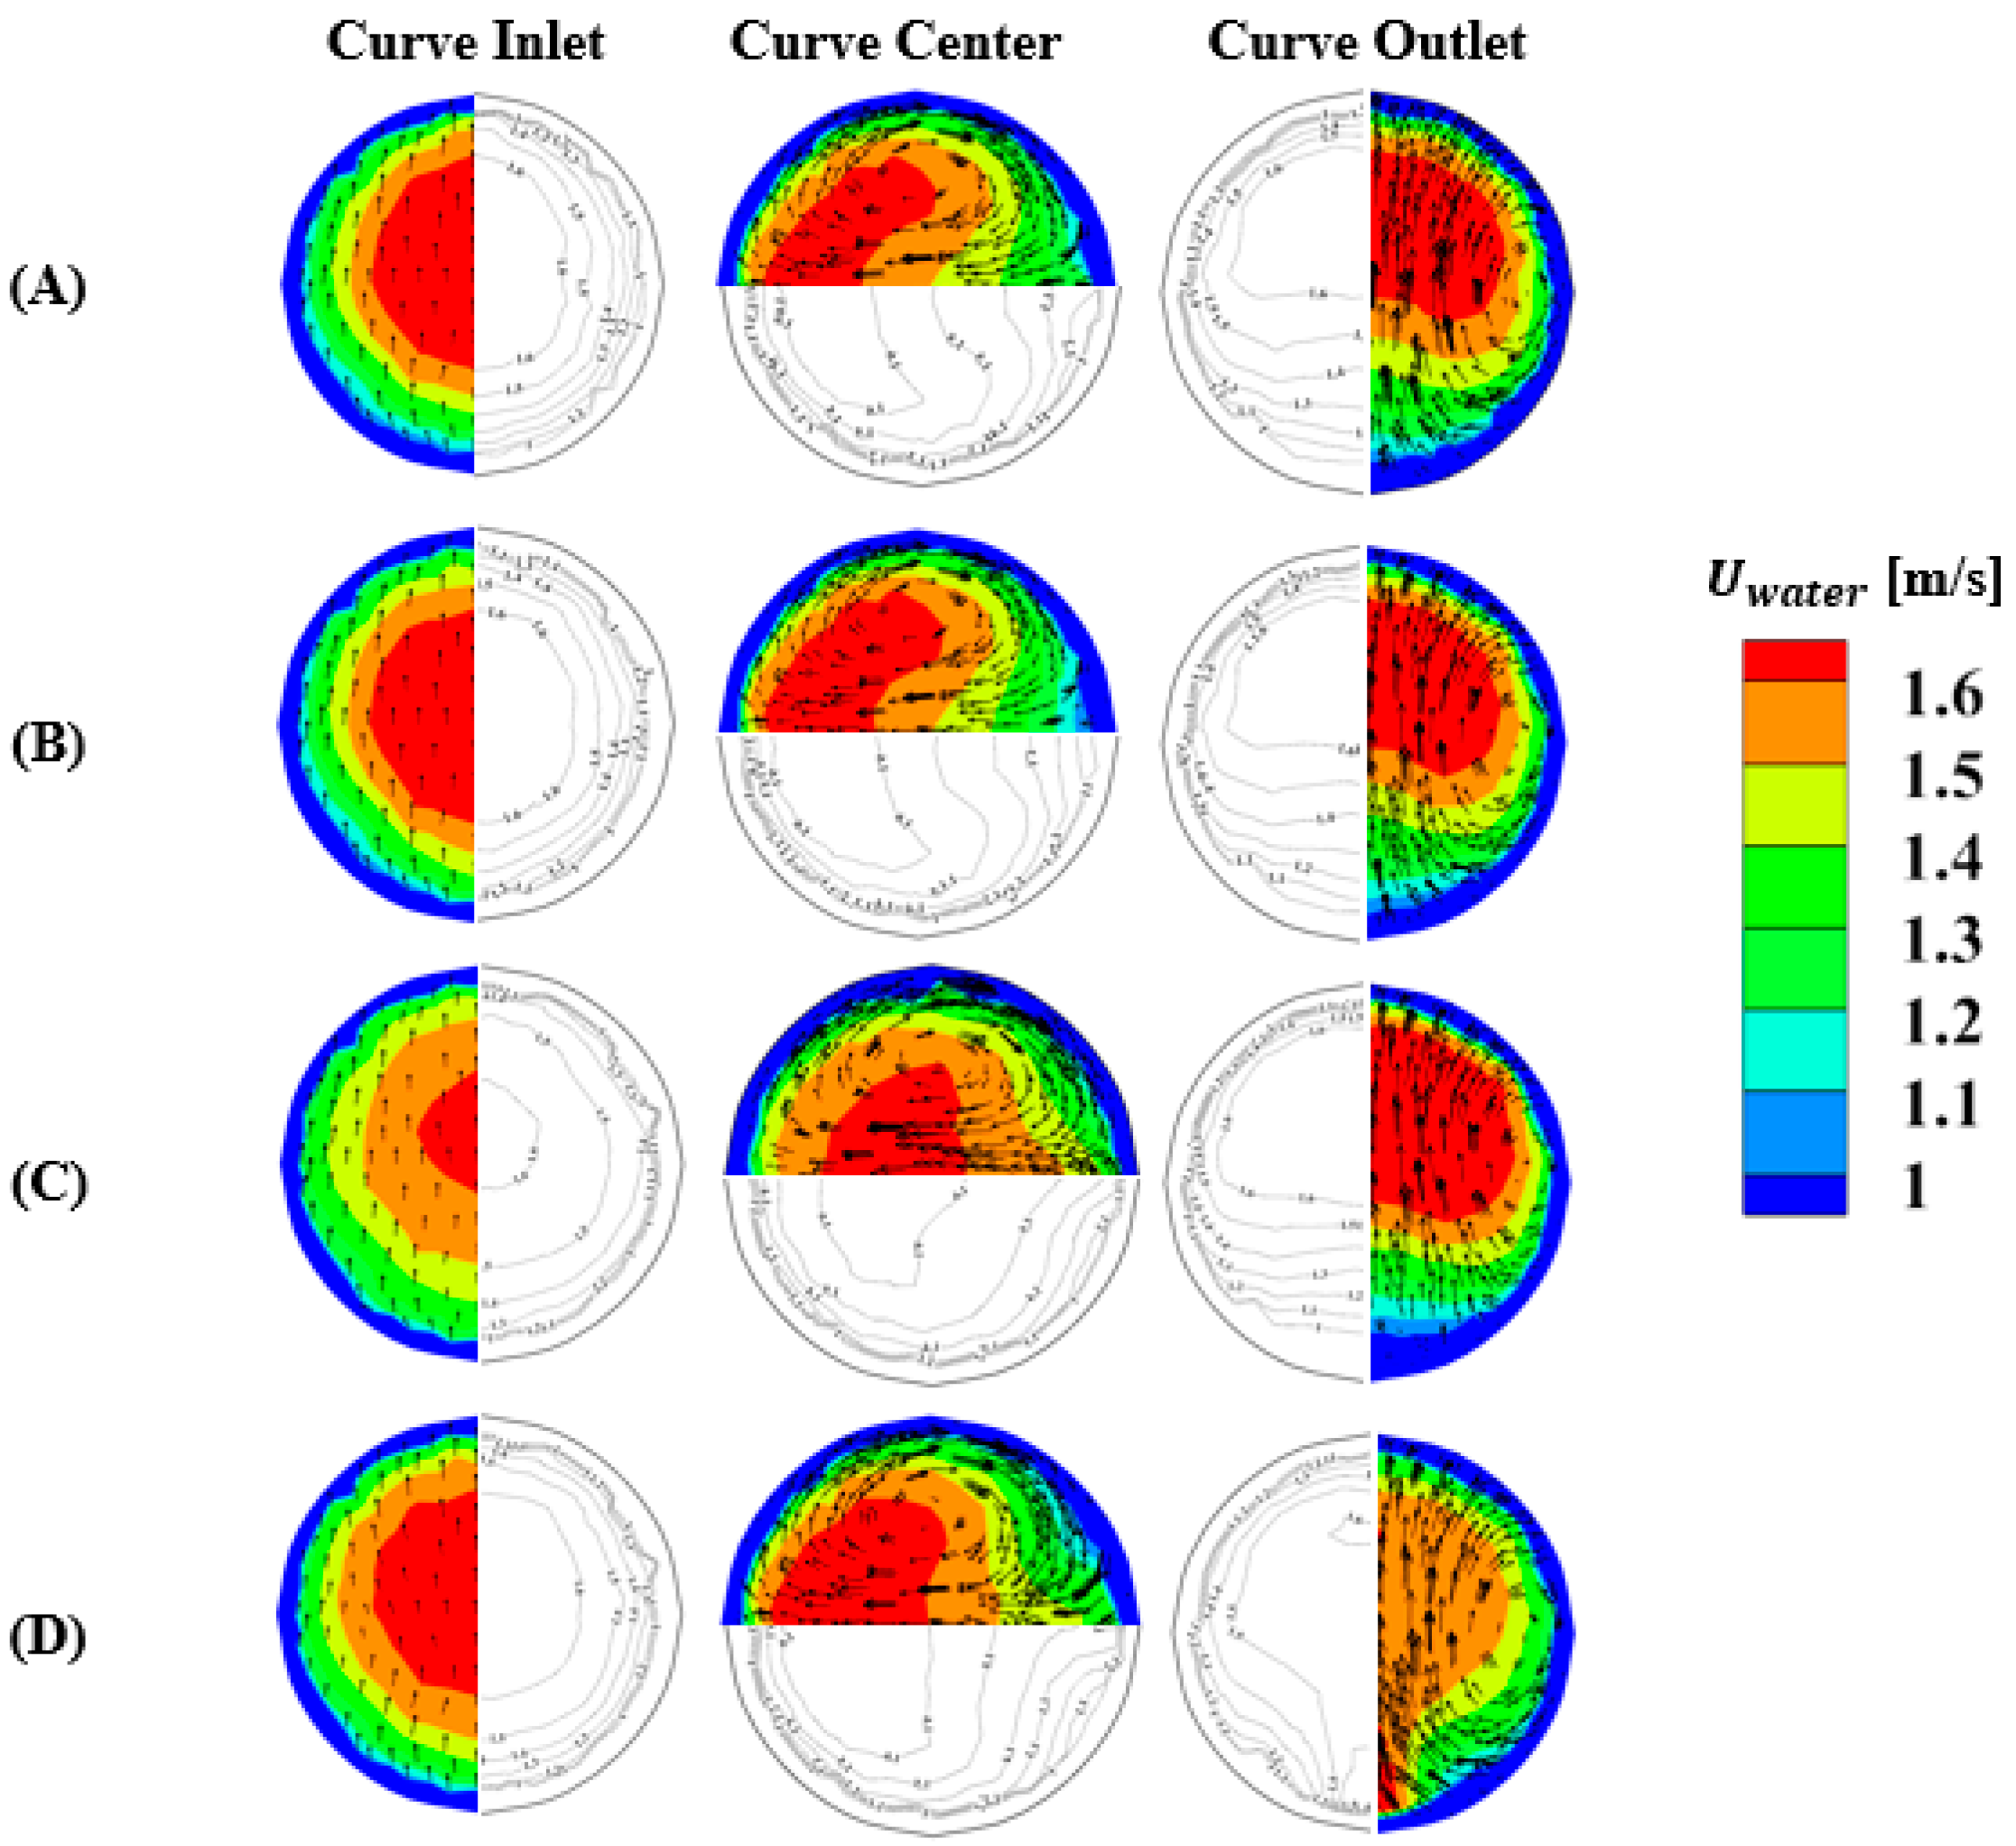
Figure 10 shows the water velocity magnitude and their corresponding tangential velocity vector presented at the curve inlet, curve center, and curve outlet according to four gravitational directions. This visualization can help us understand the dynamic changes of the water velocity when both water and air pass the curved regions of the pipes. In all cases, the water phase velocity was normally distributed when water entered the curved region. After some distance from the curve inlet, the effect of the secondary flows (i.e., counter-rotating vortices) caused by the flow inertial force became stronger and directly influenced the water velocity distribution. The counter-rotating vortices caused by the curved geometry manifested to the curve outlet and were sustained until some distance of the straight pipe, even after the curve outlet.
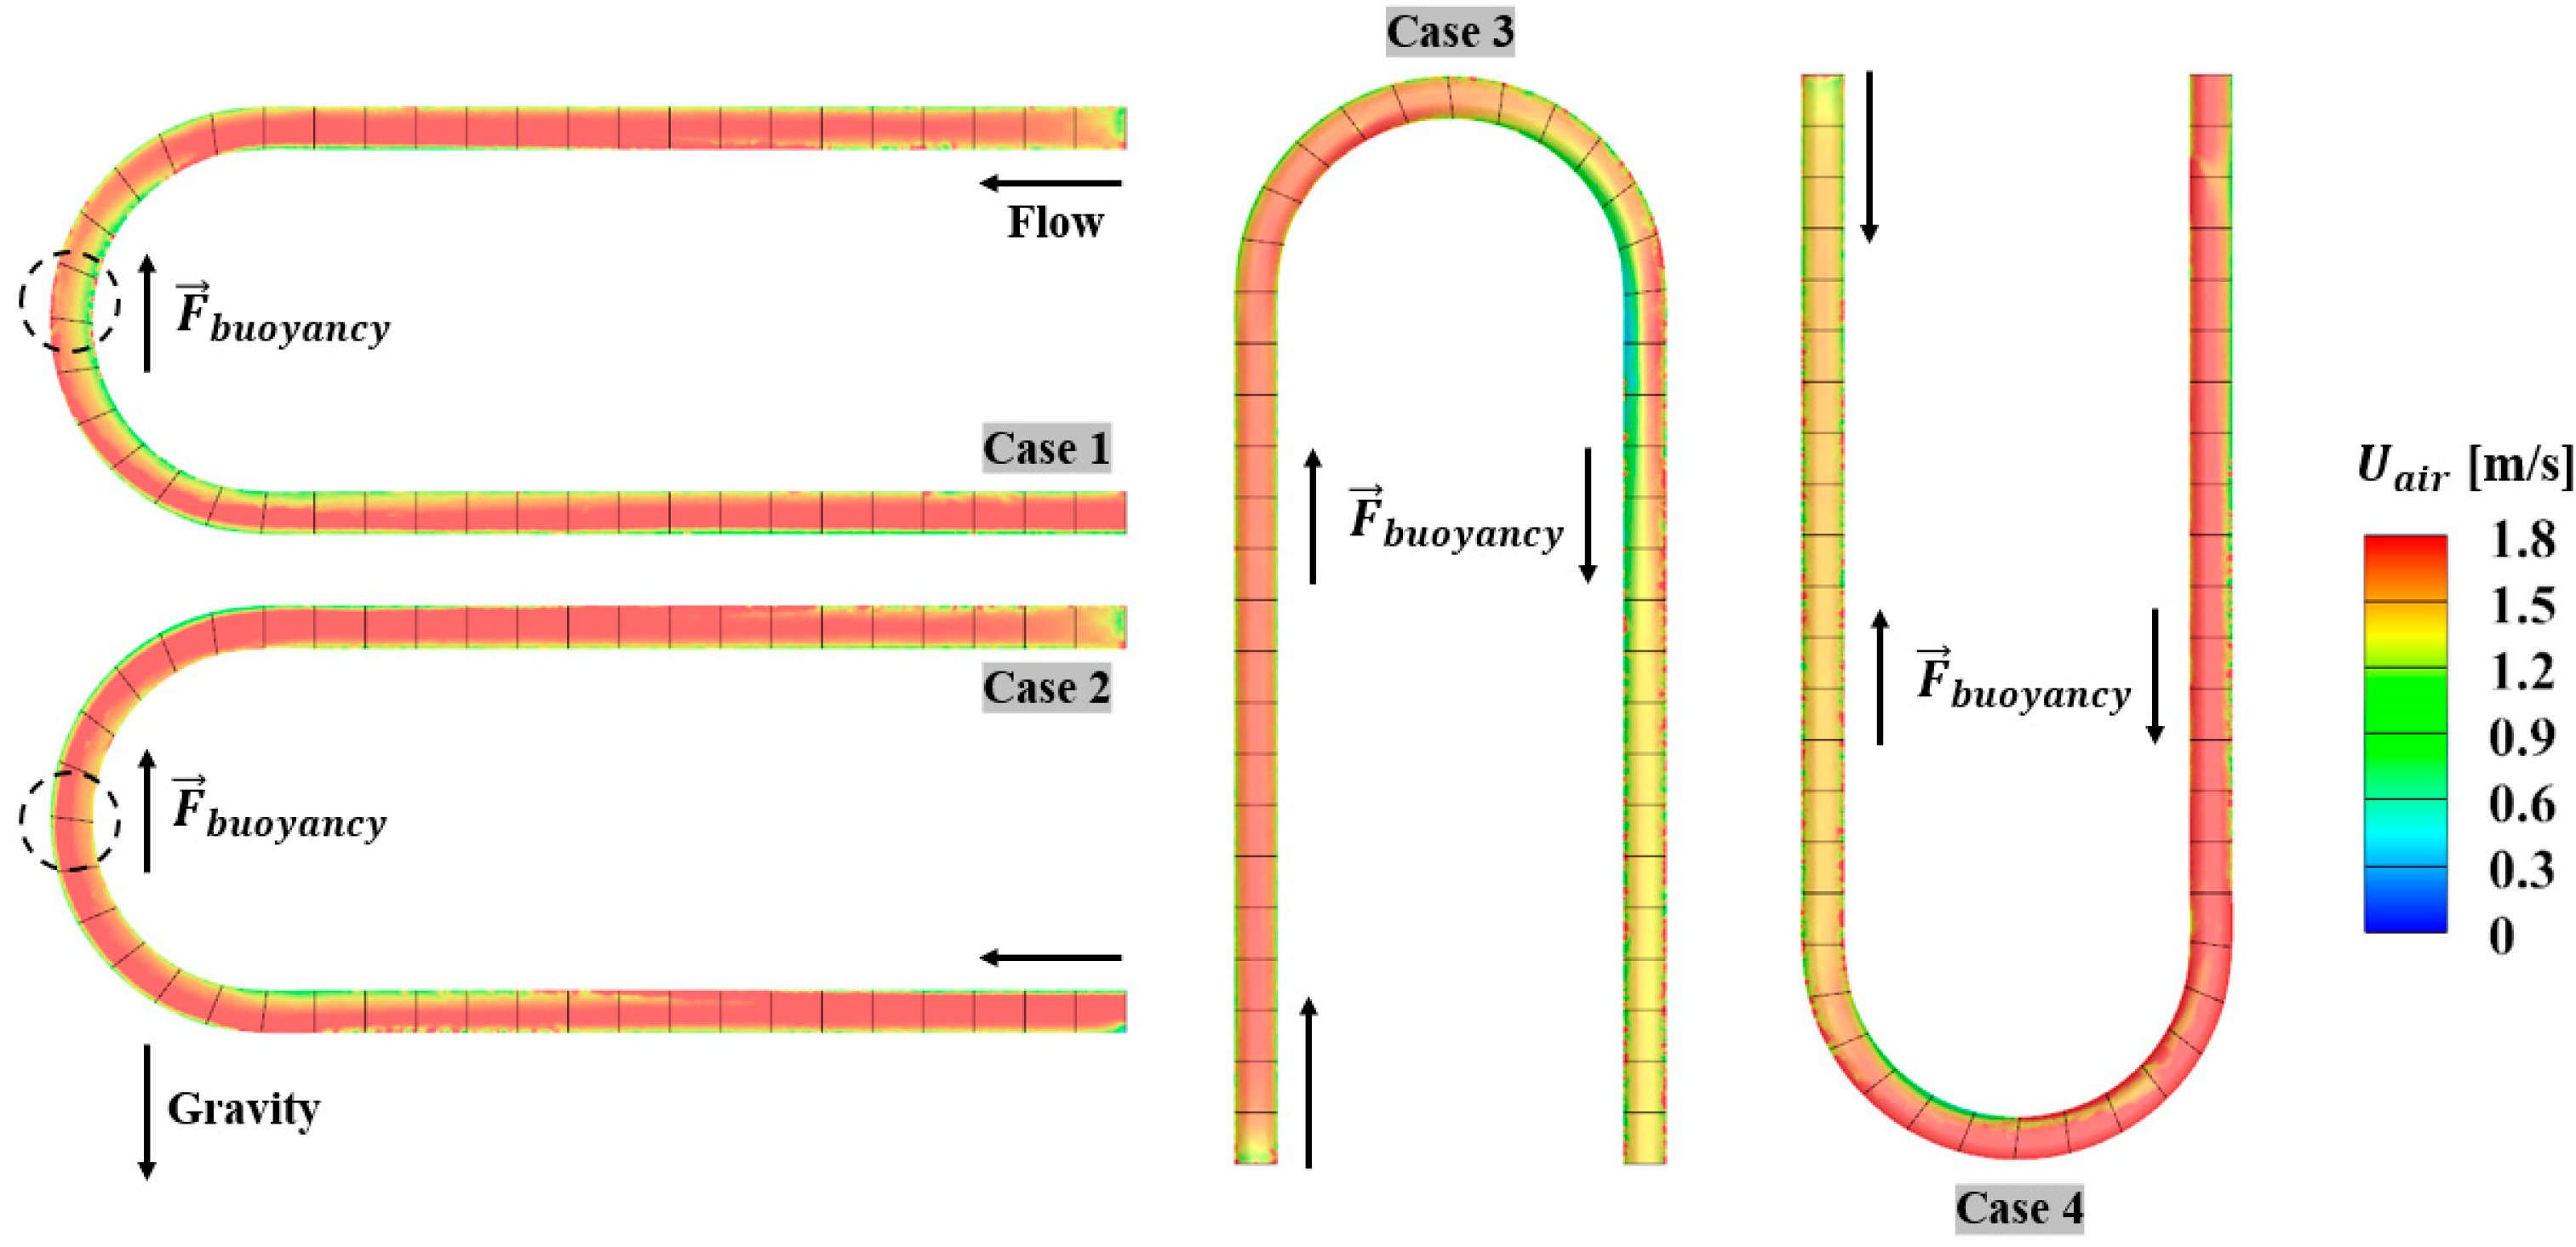
For cases 1 and 2, the water phase velocity distributions at the curve inlet and outlet were similar. At the curve center, there was a slight difference between the two cases due to the influence of the buoyancy force. The air velocity at the curve center of case 1 was smaller than that in case 2. Thus, the water phase velocity of case 1 was larger than that of case 2 in order to fulfill the law of conservation of mass. For cases 3 and 4, the water phase velocity magnitude of case 3 was smaller at the curve inlet, but it became larger at the curve outlet (Figure 11C and Figure 12). The opposite case was observed in case 4 (Figure 11D and Figure 12), where the water phase velocities at the inlet and outlet were larger and smaller, respectively. This phenomenon could be explained by the influence of the buoyancy force. For instance, in case 3, the air phase velocity was larger and smaller at the curve inlet and outlet, respectively (Figure 12). Based on the mass conservation, the trend of the air phase velocity was opposite that of the water phase velocity. Therefore, the buoyancy force is critical for determining both the air and water phase velocities.

3.3.2. Static, Hydrostatic, and Dynamic Pressure Distributions in the Curve Pipes

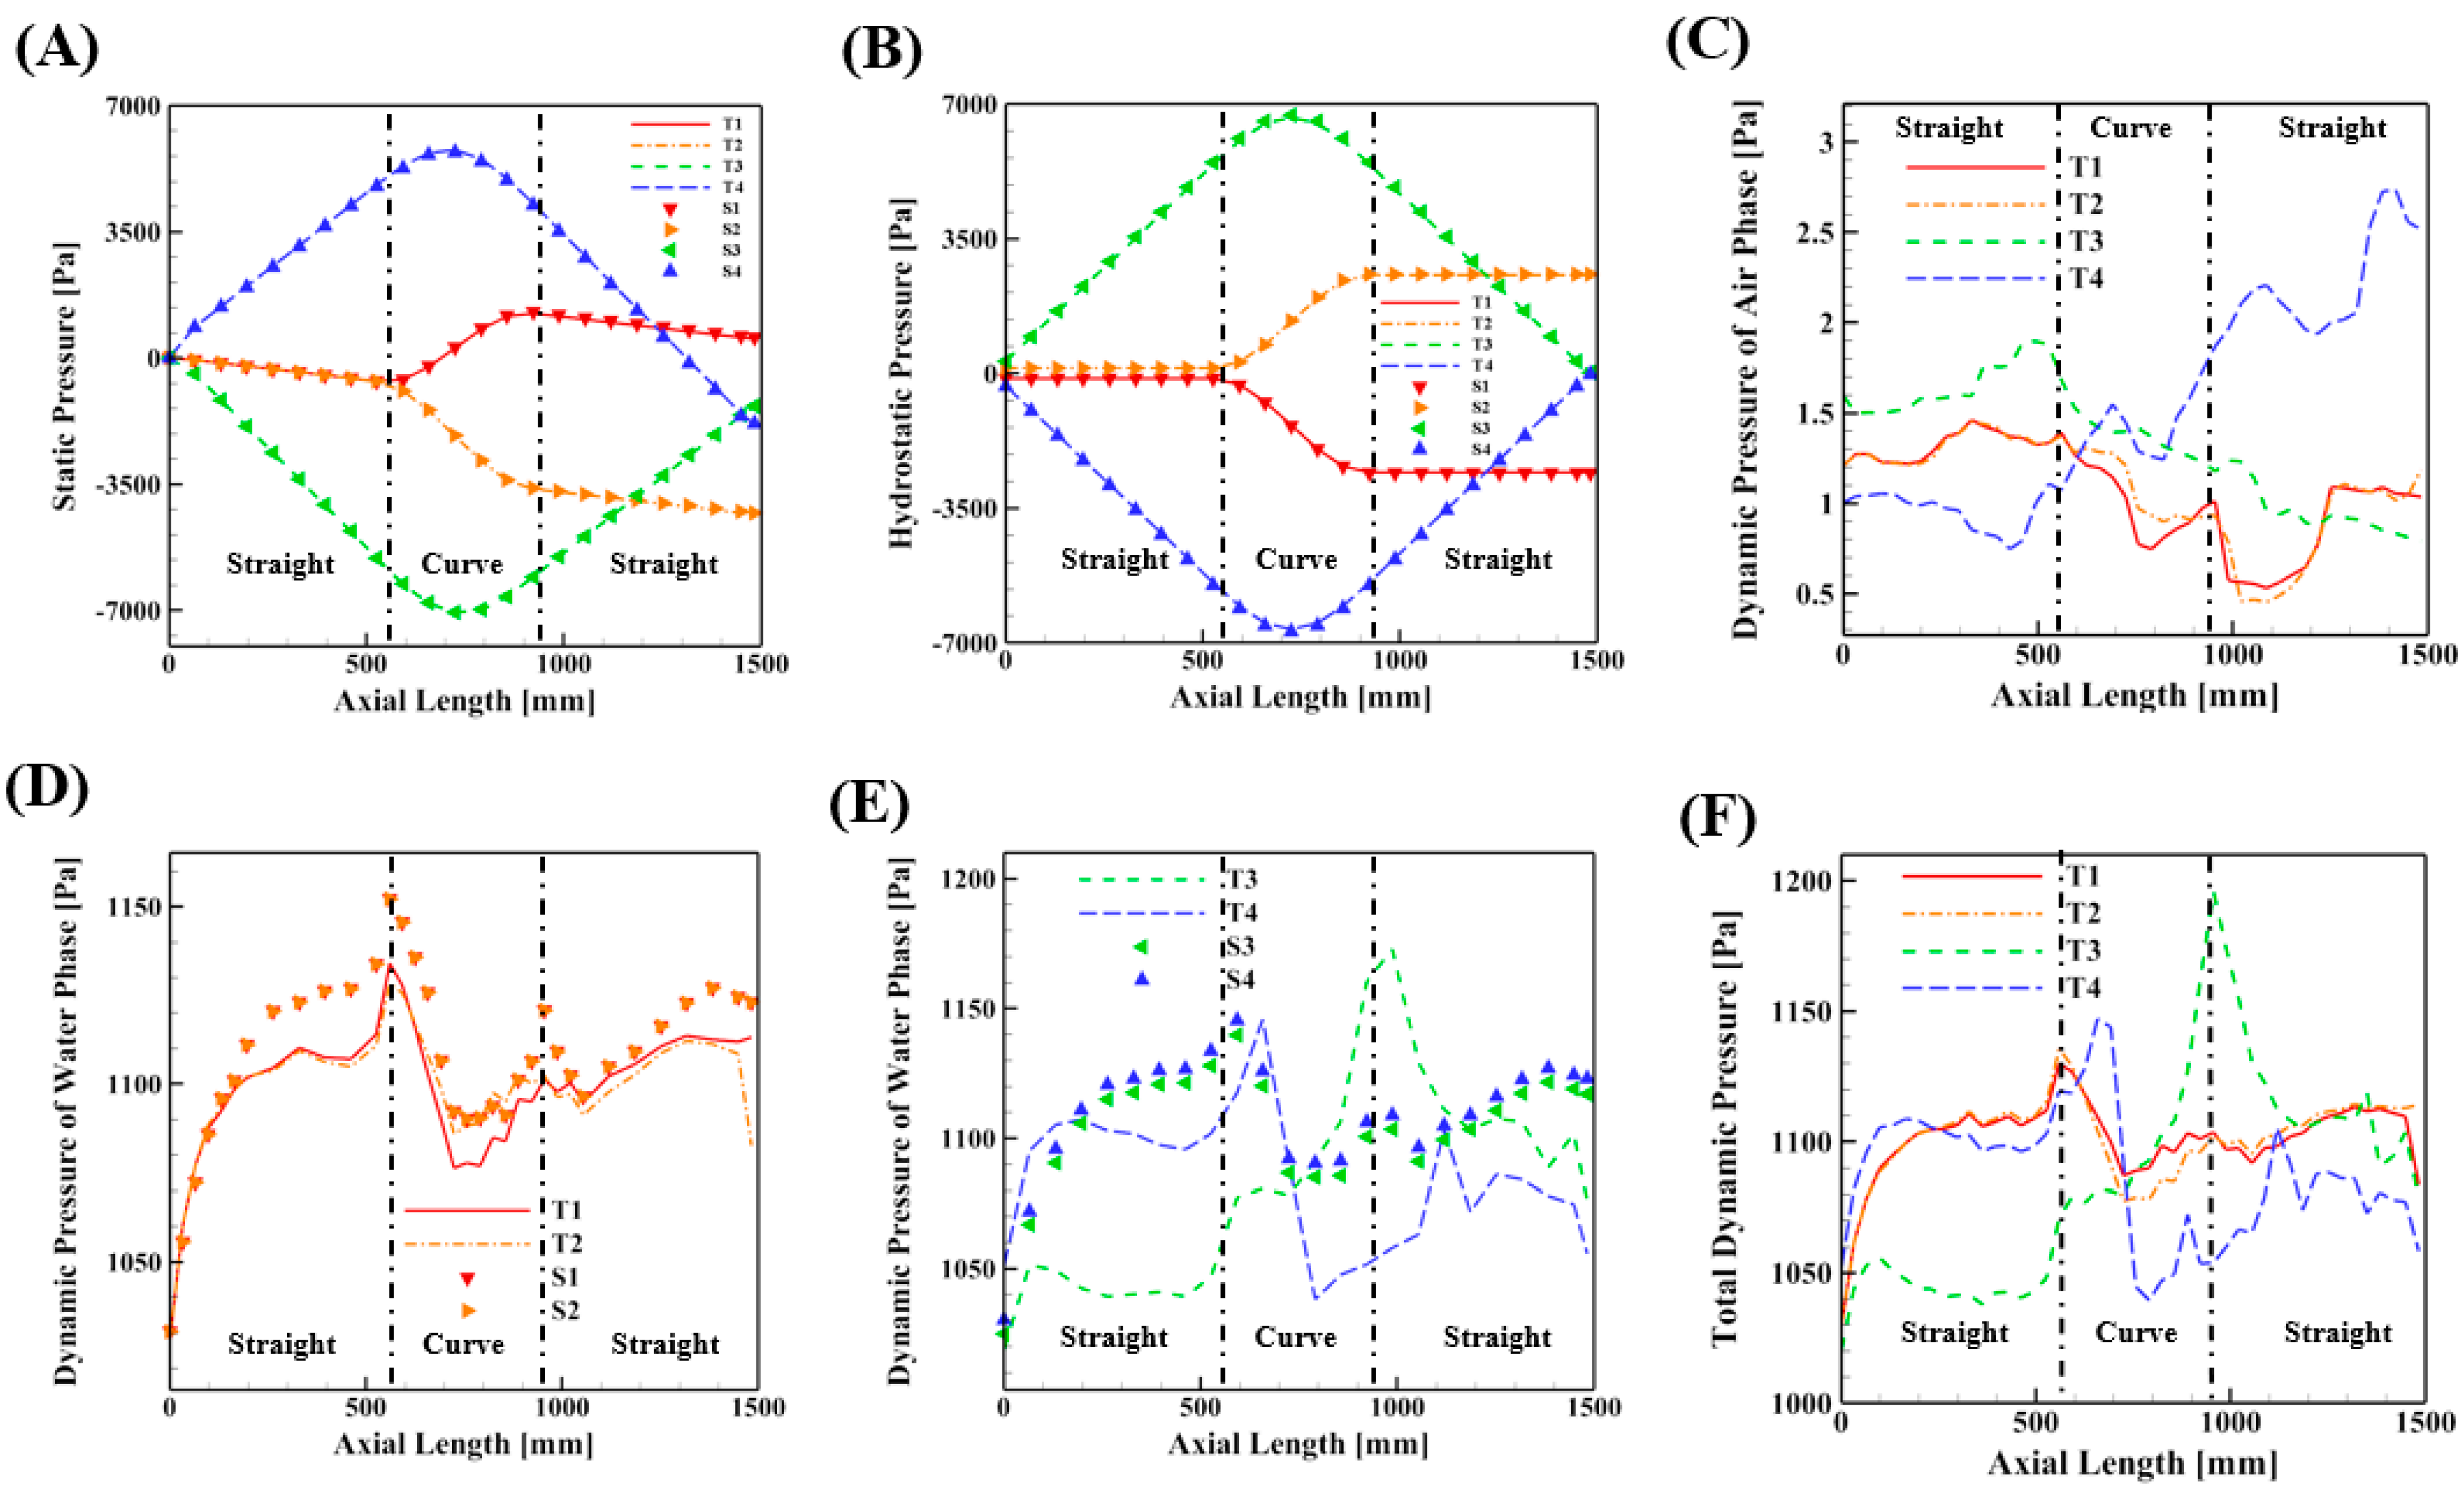
Figure 13 presents an analysis of the pressure changes of the single- and two-phase flows for cases 1–4. The following symbols were used to demonstrate the following flow types: S1: single phase for Case 1; S2: single phase for Case 2; S3: single phase for Case 3; S4: single phase for Case 4; T1: two phases for Case 1; T2: two phases for Case 2; T3: two phases for Case 3; and T4: two phases for Case 4. The curve inlet, curve center, and curve outlet were located at 560, 756, and 1345 mm, respectively. No noticeable differences were found between the single- and two-phase flows in terms of static and hydrostatic pressures. In Case 1, the static pressure for both single- and two-phase flows steadily decreased after the inlet and rapidly increased because of the height rise in the curve pipe, then finally slowly decreased in the straight pipe (Figure 13A). The trends were observed in an opposite manner for the hydrostatic pressure (Figure 13B). In Case 2, the height was higher in the curve pipe, which was opposite to that in Case 1. In Case 3, the height increased along the vertical pipe after the inlet; thus, the pressure continuously dropped because of the reduced hydrostatic pressure. Meanwhile, in Case 4, the pipe was inversely oriented against Case 3; hence, the static pressure was also opposite to that in Case 3. Although the geometrical shapes in all four cases were the same, the static pressure difference according to the gravitational directions was large in these high-density fluid flows.
Figure 13C shows the dynamic pressure of the air phase in all four cases (i.e., C- and U-shaped pipes with different injections). A small pressure difference was observed between T1 (upward injection) and T2 (downward injection). T1 had a slightly reduced dynamic pressure near the curve center. The reduction of the air dynamic pressure in T1 was caused by the decreased air velocity (Equation (8-b)), because the buoyancy force direction was opposite to the main stream direction (Figure 12). Unlike in cases 1 and 2, the dynamic pressure distribution was significantly different between T3 and T4. T3 had a larger air dynamic pressure than T4 from the inlet to the curve center, which was reversed after the curve center until the outlet. This trend was also caused by the directional change of the buoyancy force from the inlet to the outlet. For example, in Case 3, the buoyancy force acted with the same flow stream direction, leading to an air velocity increase (Figure 12). On the contrary, in Case 4, the buoyancy force acted with the opposite flow stream direction, leading to an air velocity decrease.
Figure 13D shows the dynamic pressure of the water phase for the single- and two-phase flows of cases 1 and 2. The water dynamic pressures of the single-phase flows were greater than those of the two-phase flows. This characteristic could be explained by the average density of the single-phase case being greater than that of the two-phase case, because it contained 100% water (i.e., α w a t e r = 1 in Equation (8-b)), allowing for a greater water dynamic pressure throughout the pipe. For the two-phase flow case (i.e., T1 and T2), different from the air phase, the dynamic pressure of the water phase in T2 was smaller than that in T1 (Figure 13D). This alteration in the dynamic pressure associated with the velocity magnitude between the air and water phases could try satisfying mass conservation.
Figure 13E depicts the dynamic pressures in cases 3 (U-shaped pipe with an upward injection) and 4 (U-shaped pipe with a downward injection) for both single- and two-phase cases. Similar to that in cases 1 and 2, no noticeable difference in the dynamic pressure was found in the single-phase flows between S3 and S4. However, in detail, S3 showed a slightly reduced dynamic pressure below S4. Different from the single-phase cases, the dynamic pressure of the water phase was significantly different between T3 and T4. T3 had a smaller water dynamic pressure than T4 from the inlet to the curve center, which was reversed after the curve center until the outlet. The features were consistent with the velocity profiles observed in Figure 11. As discussed earlier, this trend was caused by the change of the buoyancy force direction from the inlet to the outlet. For example, in Case 3, the buoyancy force acted with the same direction of the flow stream, leading to an air velocity increase (Figure 12) and a water velocity decrease. In contrast, in Case 4, the buoyancy force acted with the opposite flow stream direction, leading to an air velocity decrease and a water velocity increase. Figure 13F illustrates the total dynamic pressures, including the air and water dynamic pressures in the two-phase case (Equation (8-c)). Note that the total dynamic pressure was primarily determined by the water dynamic pressure because of the large density difference. The total pressure was larger in T1 than in T2, as demonstrated in the water dynamic pressure in Figure 13D. Moreover, the total dynamic pressure was smaller in the case of the U-shaped pipe with an upward injection (Case 4) from the inflow to the curve center, but greater when the flow went from the curve center to the outflow in opposition to that in Case 3.
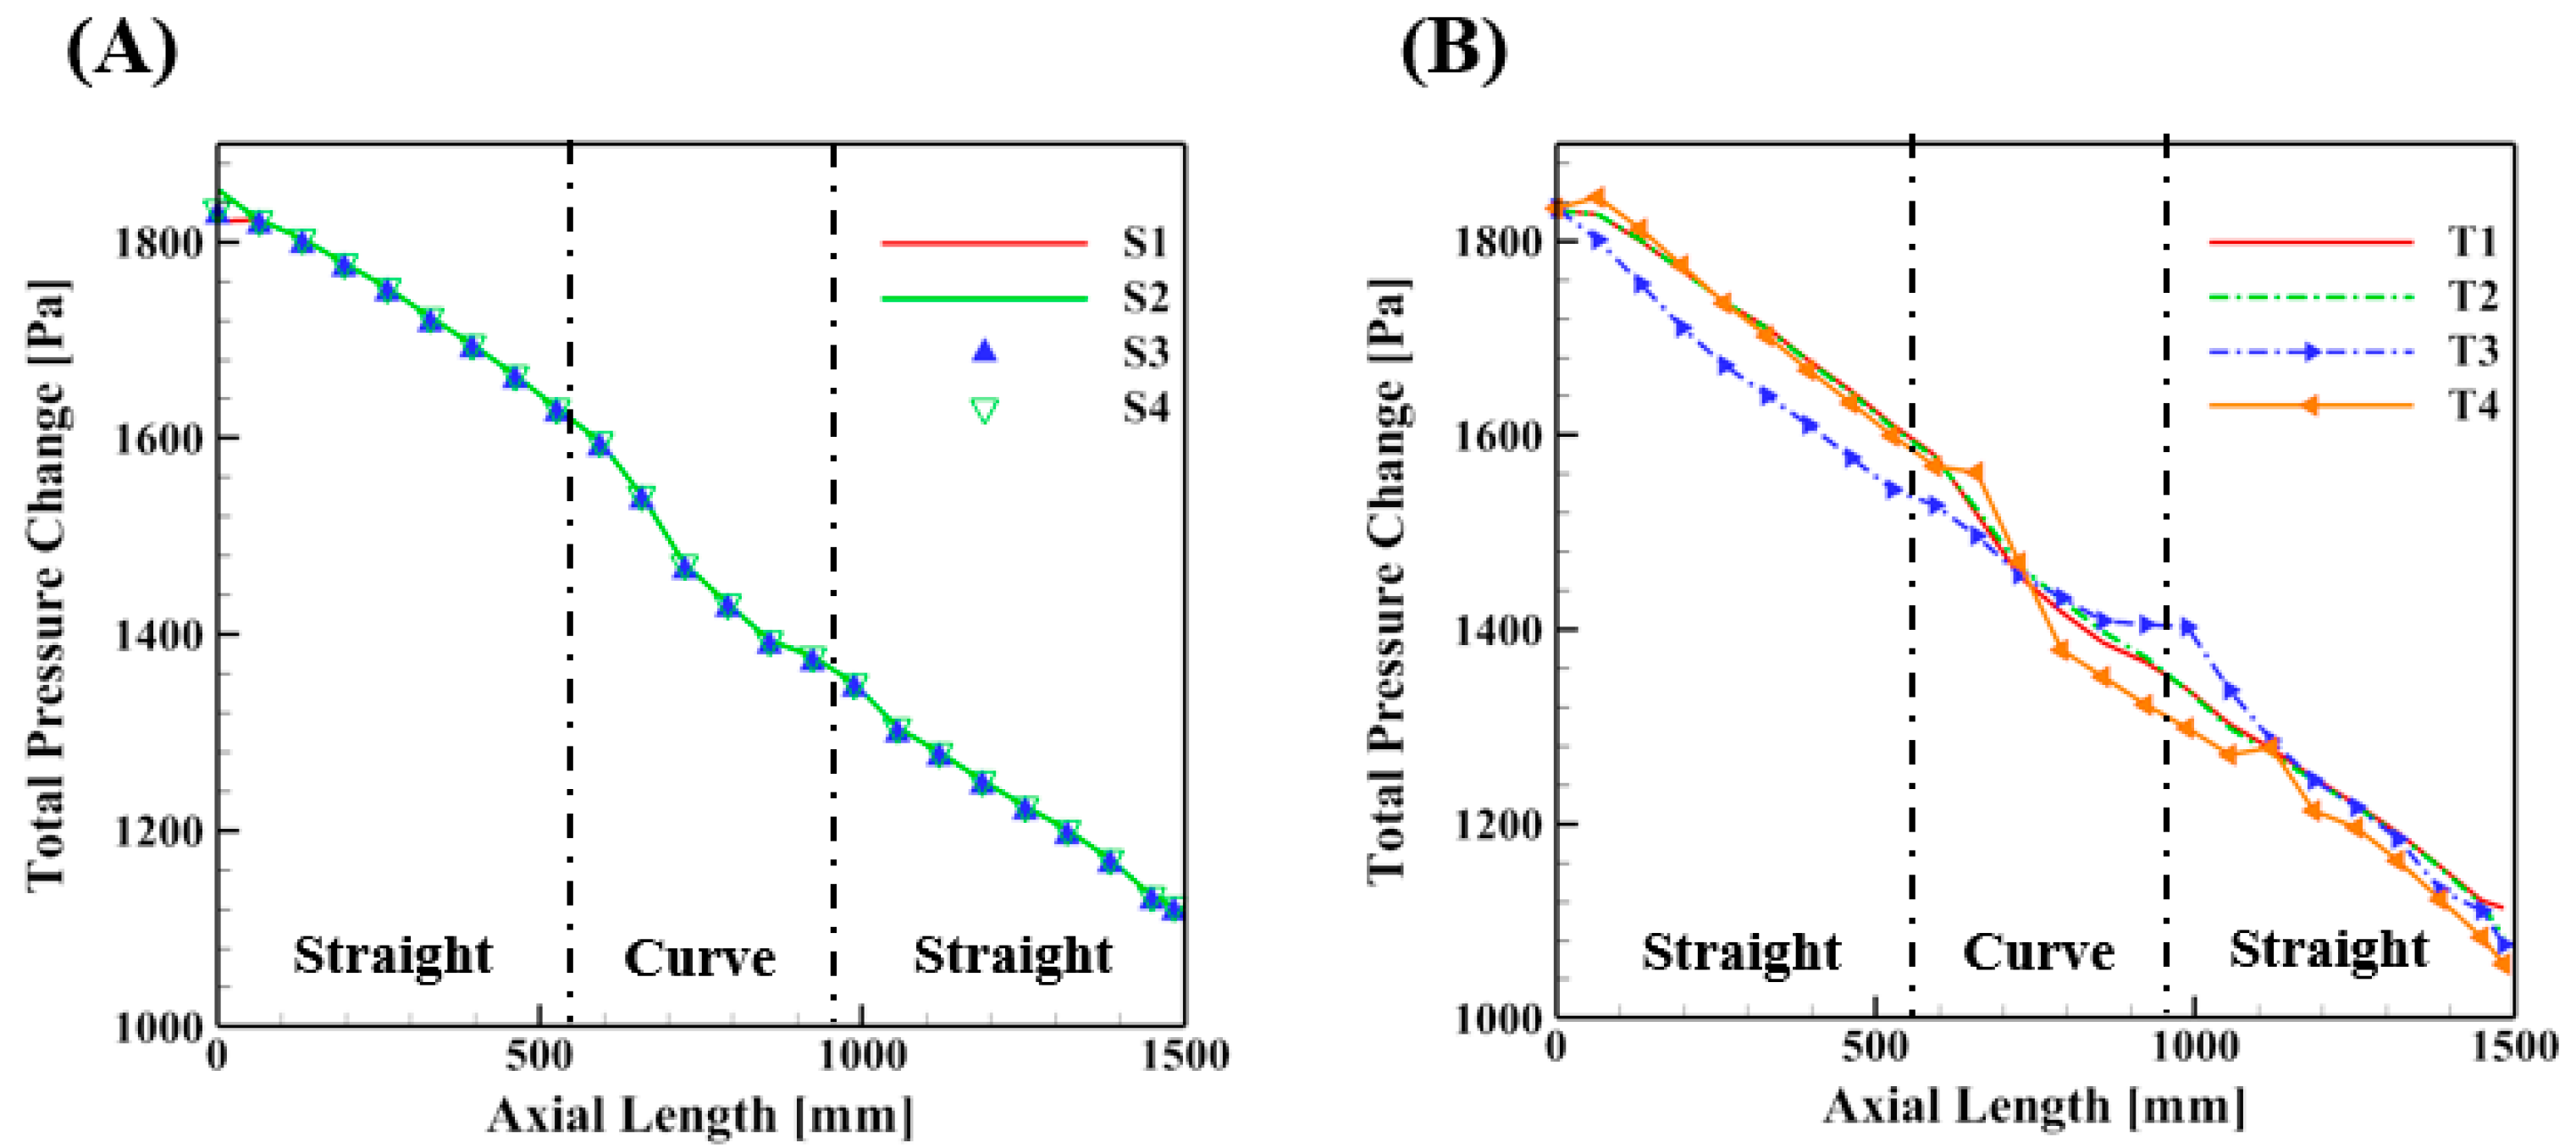
Figure 14 illustrates the total pressure change along the axial direction caused by the influence of the static, hydrostatic, and dynamic pressures on both single- and two-phase flows. The total pressure drops and gradient were further quantified in straight (inlet), curve, and straight pipes (outlet) (Table 3). The results showed that for the single-phase flow, the trends were consistent in all four gravitational directions, implying that gravitational directions play a less important role in determining the total pressure of single-phase flows. For the two-phase flows, the total pressure gradient was always greater in the curved region than in the straight pipe, because the asymmetric velocity profiles induced an increase in the dynamic pressure and shear stress. The total pressure change of the two-phase flows in the C-shaped pipes showed similar trends for T1 and T2. The total pressure change was also similar in the U-shaped pipes (i.e., T3 and T4). Meanwhile, the total pressure drop in the U-shaped pipes (i.e., T3 and T4) was much larger than that in the C-shaped pipes (i.e., T1 and T2) (Table 3), indicating that the viscous friction between the two-phase cases was stronger when the flow ascended and descended against gravity. Moreover, T4 had a peak total pressure change in the curved region because of the sudden change in the dynamic pressure at the curve center (Figure 13F).
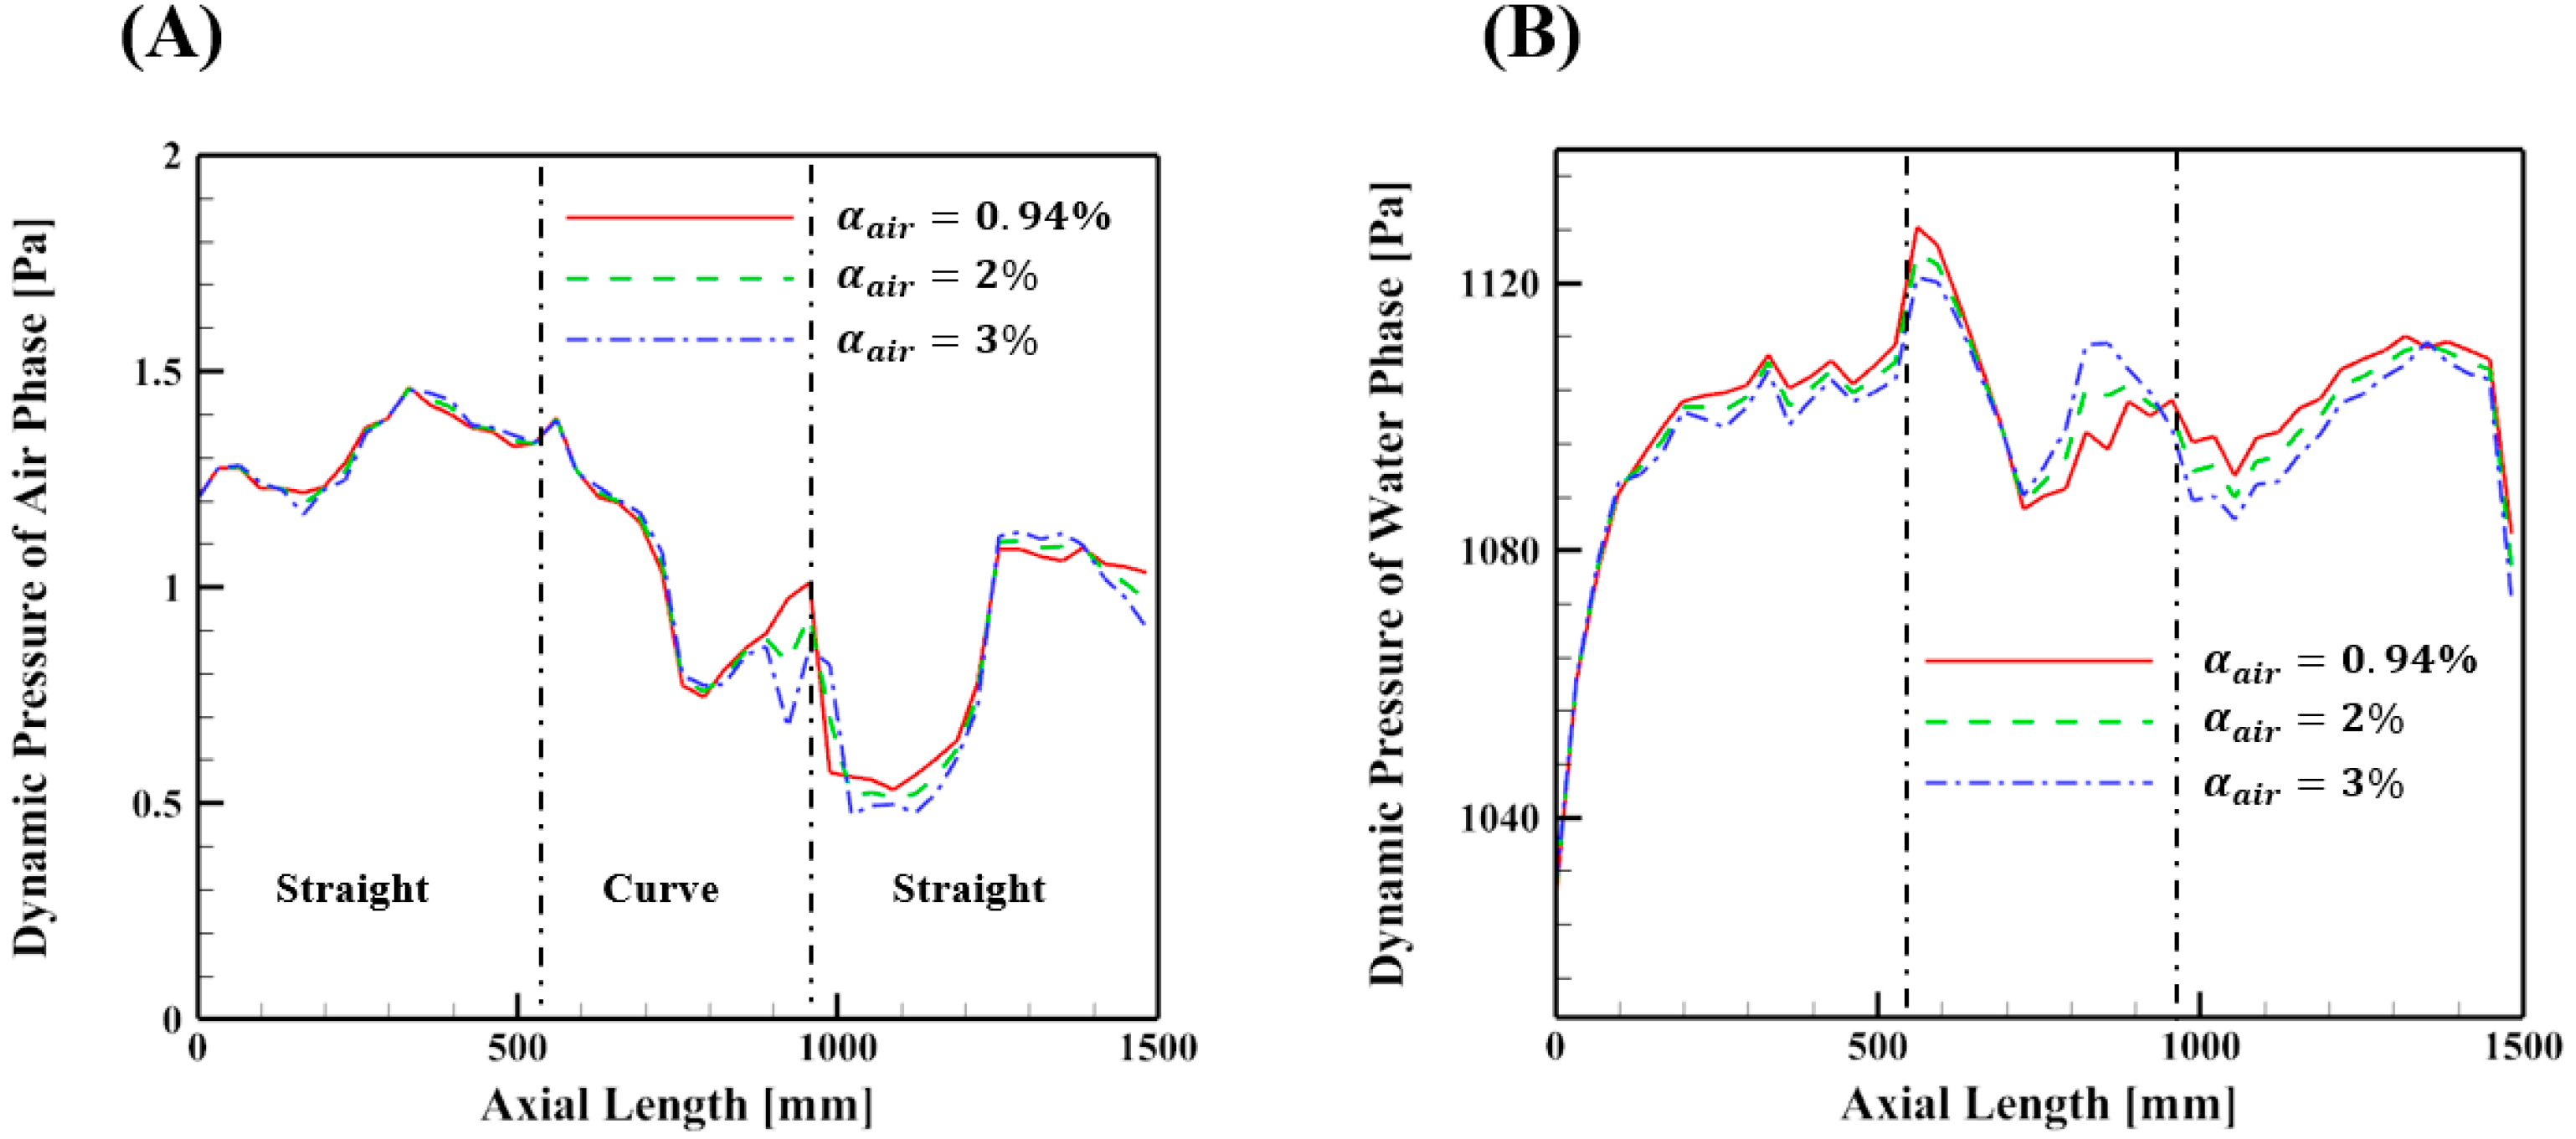
Figure 15 shows dynamic pressures of air and water phases in three different air volume fractions, i.e., 0.94%, 2%, and 3%. The air volume fraction ( α a i r ) represented the ratio of air volume to the total volume. The dynamic pressure decreases after passing the curve center, as the α a i r increases. The reduced dynamic pressure is based on the direction of buoyancy force inversely aligned with the flow direction (see Figure 15). Due to the mass conservation, the dynamic pressure of water phase was elevated with increasing α a i r (see Figure 15B).

3.4. Flow Physics in the C-Shaped Pipe (Case 1)

3.4.1. Flow and Bubble Redistribution in the C-Shaped Pipe

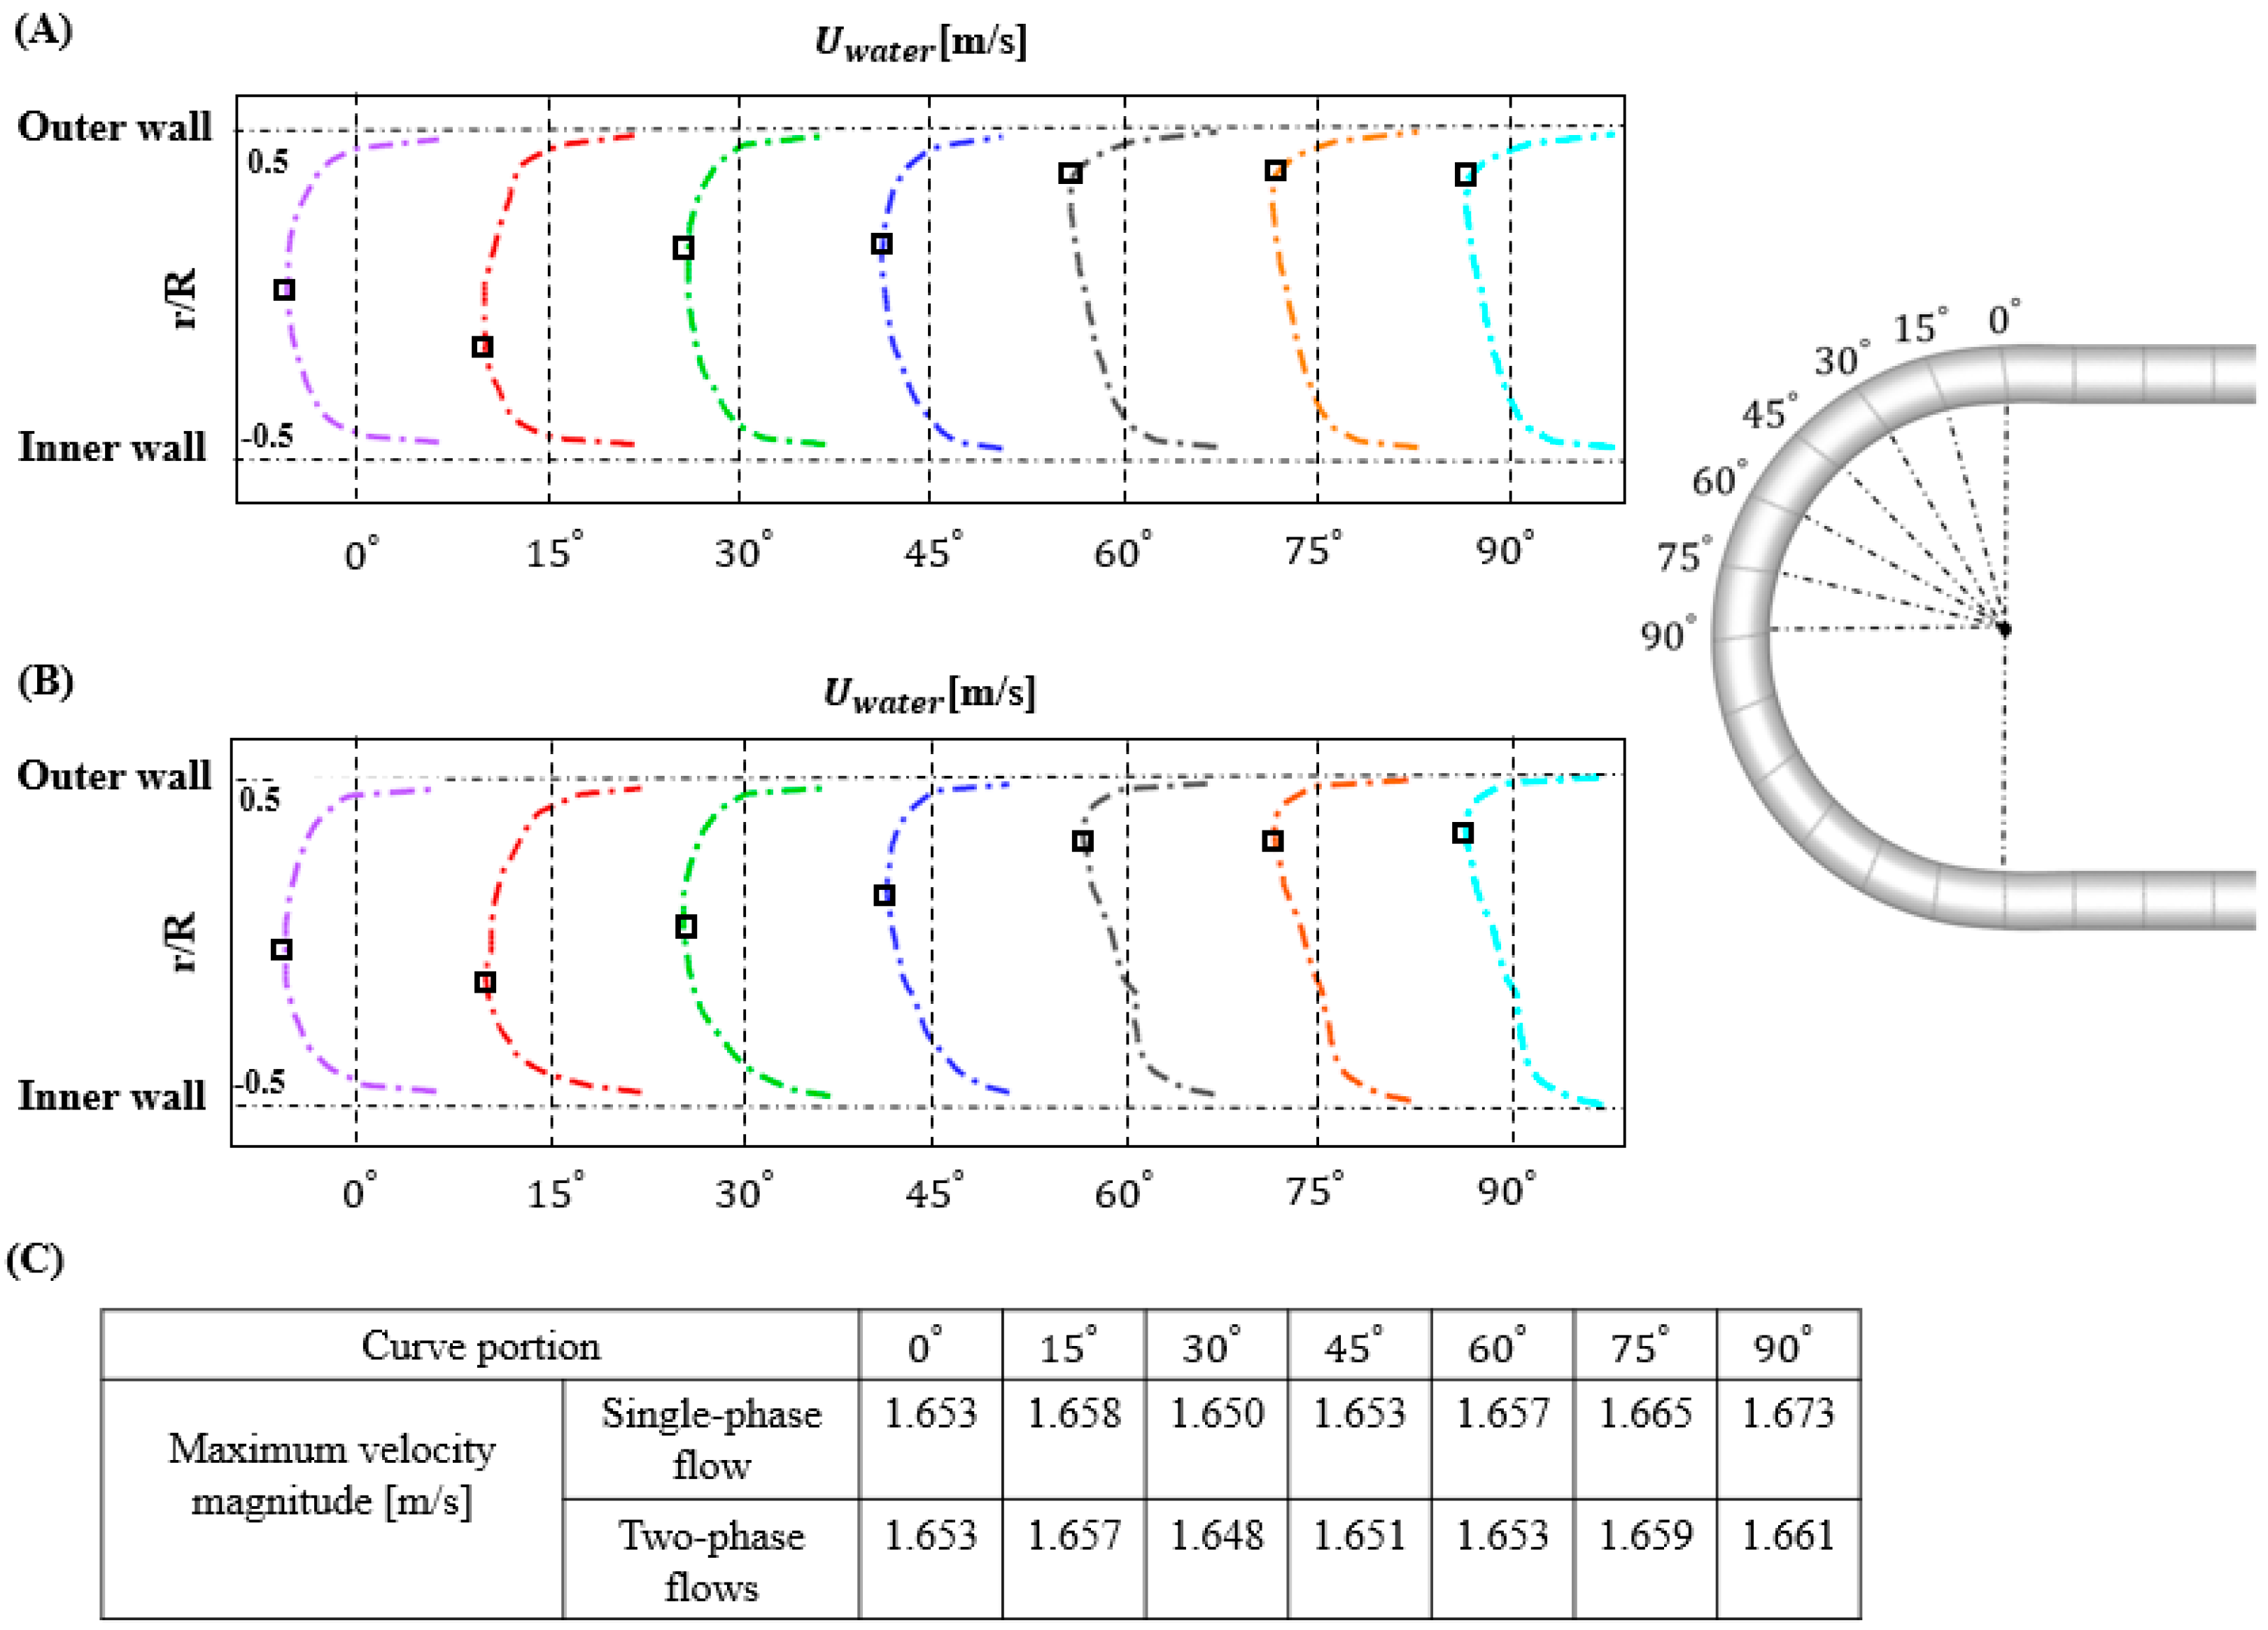
We focused on Case 1 (C-shaped pipe with an upward injection) to understand the flow physics in the curve pipe. Hereafter, the α a i r   =   0.94 % was used for the simulation. Note that r/R is scaled to the range of −0.5 and 0.5, and thus −0.5 means the inner wall and 0.5 means the outer wall. Figure 16 demonstrates the axial water velocity profiles when the fluid flowed through the curve pipe for different curvature ratios of the (a) two- and (b) single-phase flows, respectively. Their maximum velocity magnitudes were also shown in Figure 16C.
At the entrance of the curve inlet (0°), the fluid was accelerated near the inner wall before 15° in both single- and two-phase flows by the pressure gradient for the curve region caused by a centripetal force. A greater velocity could be observed near the outer wall in both cases after 15° of the curve region (see Figure 16C), implying that the water tended to move in the outer wall instead of following the inner wall curve portion. The characteristics were much clearer in the curved part between 45° and 60°. The shifted value of the maximum velocity magnitude from the curve portion of 30° was mainly caused by the influence of the inertia force. After the fluid passed the curve portion of 60°, the maximum velocity magnitude tended to keep its radial position until it reached the curve outlet. The maximum axial velocity was considered to have fully developed around 60°, regardless of the type of flow.
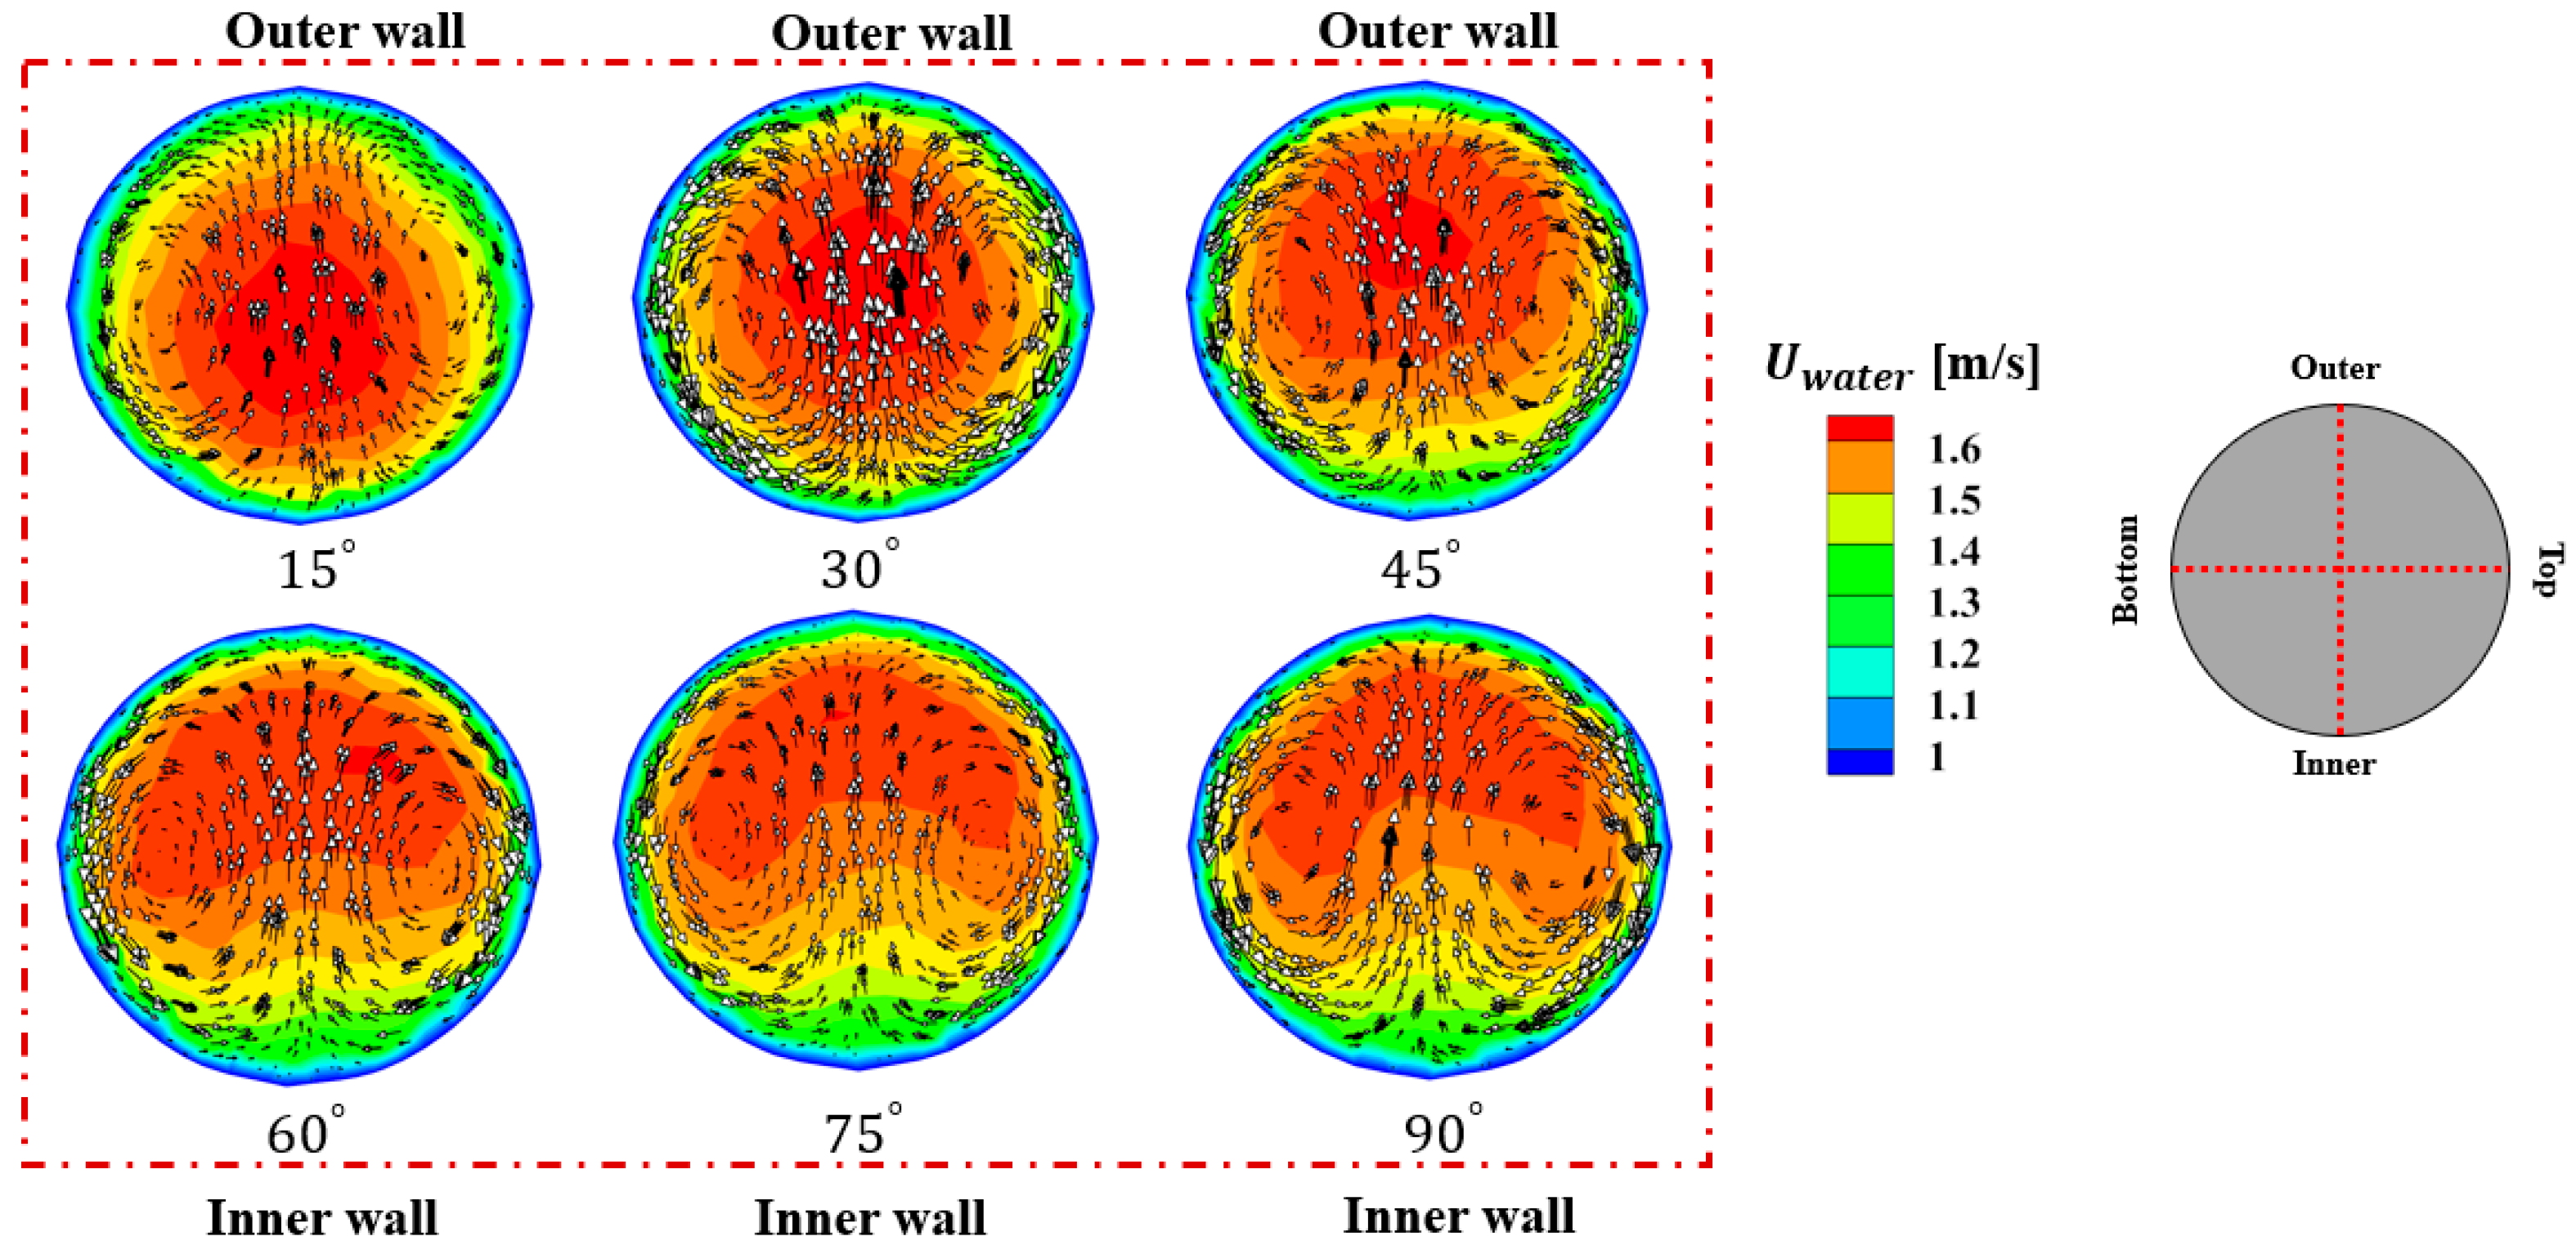
Figure 17 illustrates the Dean flow [20] in a curve pipe at six different bend angles (i.e., 15°, 30°, 45°, 60°, 75°, and 90°). The transverse Dean flows that arose as a result of the inertia force experienced by water moving along the curve portion offered an enhanced mixing in a 2D section by introducing a curvature to the flow path. The effect was generally characterized herein by a dimensionless number, called the Dean number, computed as follows:
D e a n   =   1 2 ( i n e r t i a   f o r c e ) ( c e n t r i p e t a l   f o r c e ) v i s c o u s   f o r c e s = R e D 2 R c ,  
where Rc is the curvature–radius of the curve pipe. In our simulation cases, the Dean number was computed as 13,000, implying that inertia and centripetal forces were dominant over the viscous force. Note that the critical Dean number is 956 [21].
The inertial effects induced a secondary flow field characterized by the presence of two counter-rotating vortices (Figure 17) according to the curvature. In our case, the secondary flow was the strongest at the 30° bend angle and became weaker after the angle. The effect of the secondary flow became weaker when the water passed after the 60° bend angle (Figure 16). This is regionally consistent with the fully developed maximum velocity position (Figure 16). In the two-phase flow at the curve inlet, water was positioned lower than air because of the buoyancy force that changed its position from the inner wall to the outer wall (around 30° bend angle) (Figure 18). This was possibly caused by the effect of the flow inertial force over the buoyancy force because of the large density of water.

3.4.2. Turbulent Effect in the C-Shaped Pipe

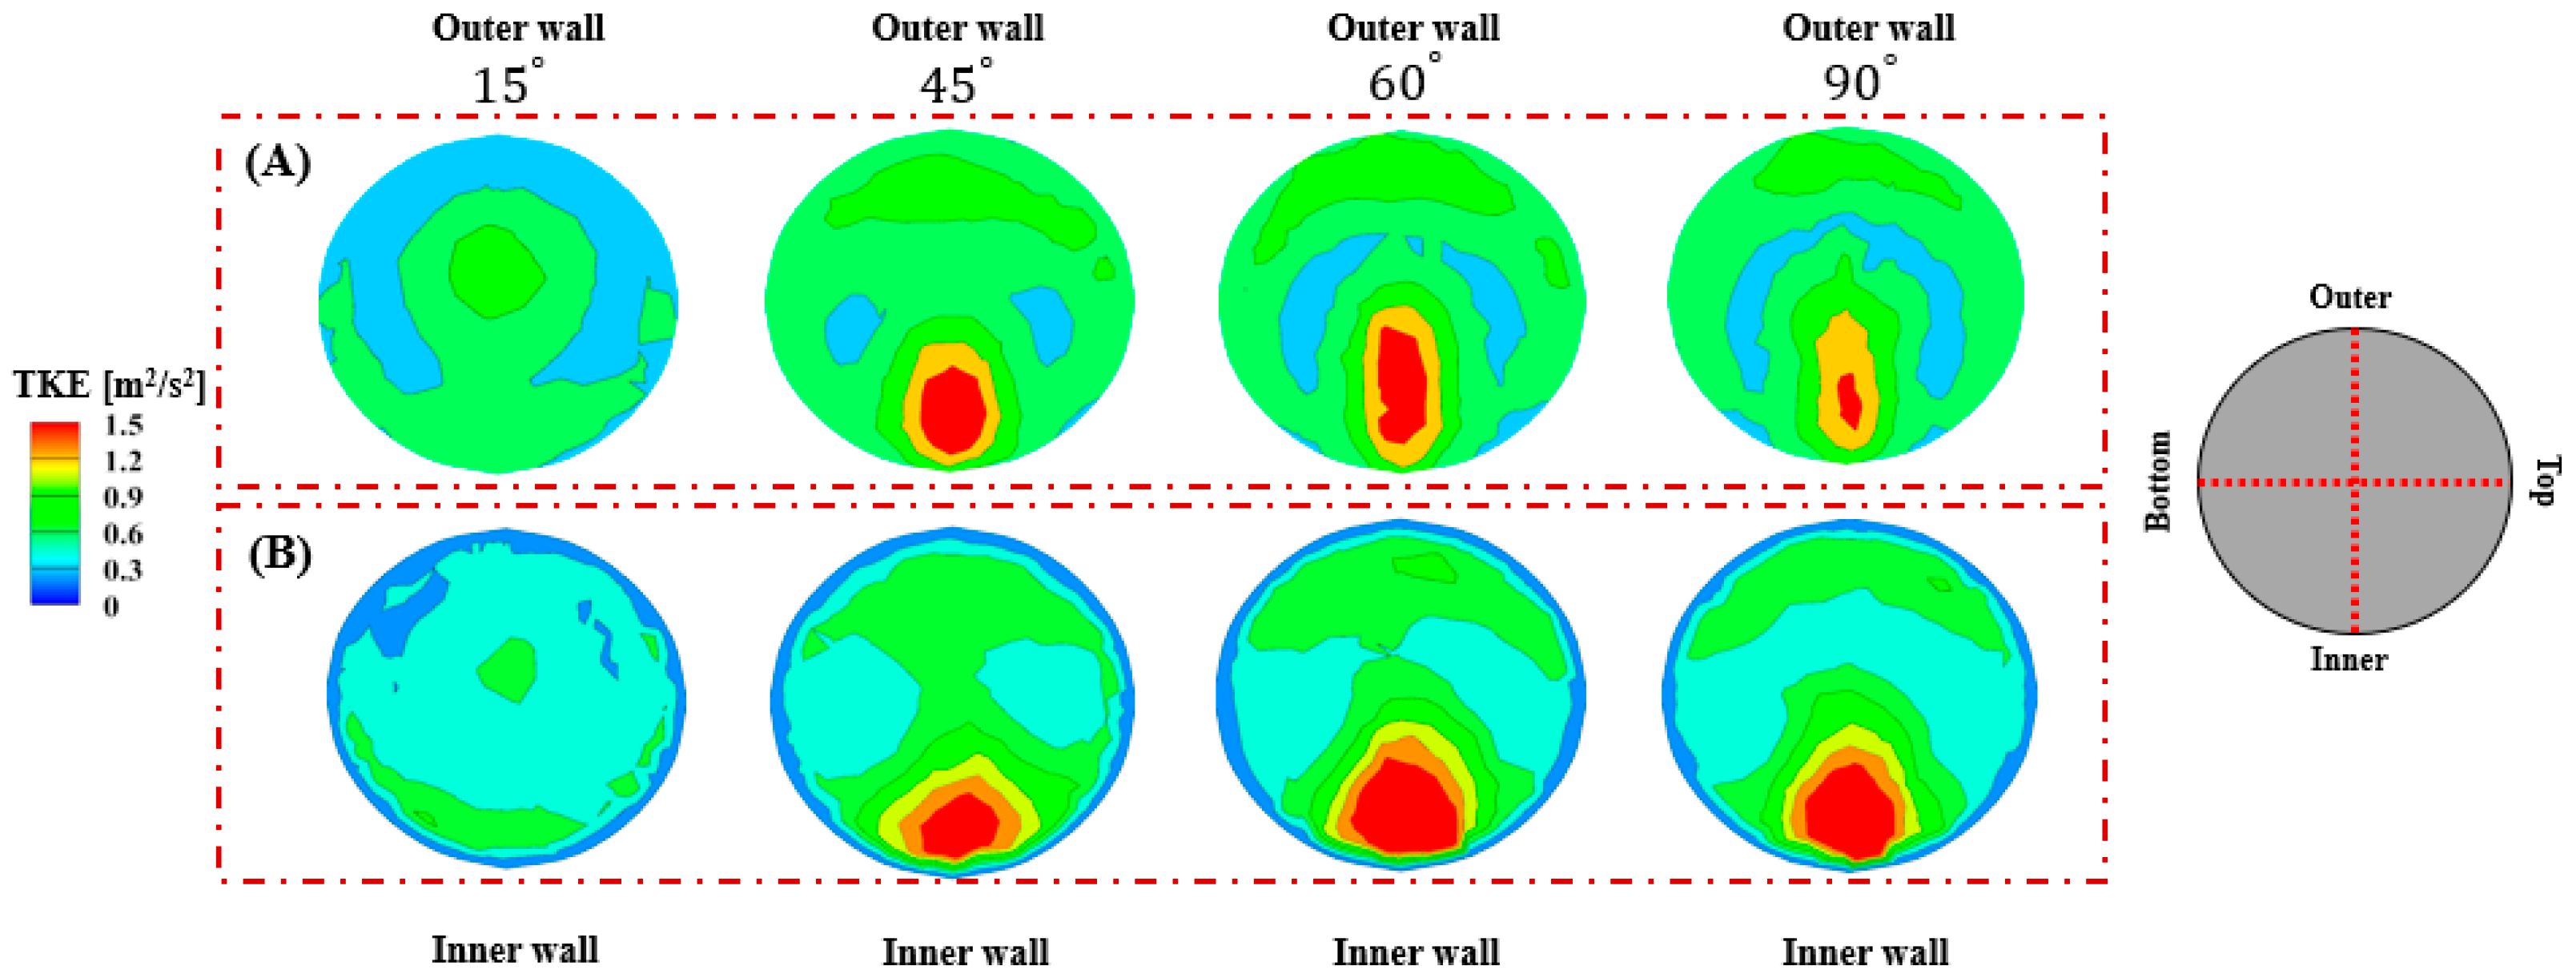
We calculated the turbulent kinetic energy (TKE) distributions of water at four specific curve portions as follows:
T K E = 1 2 ( u ¯ 2 + v ¯ 2 + w ¯ 2 )   ,
where u ¯ , v ¯ , and w ¯ are the mean fluctuation x-velocity, mean fluctuation y-velocity, and mean fluctuation z-velocity, respectively. The TKE of the single- and two-phase flows is further demonstrated in a 2D slice in Figure 19A,B with the same tendency. Overall, they followed the same trend observed, that is, a strong TKE near the inner wall. Similar to the two-phase case, the TKE in the single-phase flow became stronger after the portion of 15° and became the strongest at the curve portion of 60°. Subsequently, it became weaker in the portion of 90°, but still had the same characteristic in the case of the two-phase flows. Hence, the turbulence behavior of the two-phase flows was stronger than that in the single-phase flow. These characteristics could be caused by the addition of the air phase that allowed for an unstable flow, which is different from that in the single-phase flows containing 100% water.
Figure 20 shows a visualization of the TKE distribution of the water phase, the first fluctuating proper orthogonal decomposition (POD)-derived coherent vortical structure, and the pressure contour in the 2D slice. Figure 20A,B demonstrate that the TKE was stronger near the inner walls around the bend angle of 20°. The region, where a strong turbulence was observed, was consistent with the location of the high λ 2 , indicating the vortical structure computed by POD analysis. λ 2 denotes the eigenvalue associated with the POD-extracted spatial eigenmode 2. The pressure gradient along the radial direction, which was caused by the centripetal force and allowed for a smaller pressure near the inner wall regions, was observed in Figure 20C. Thus, the low total pressure region was consistent with the place where a strong TKE was observed, indicating a flow instability near the inner wall regions. The onset of the strong TKE was also consistent with the beginning of the strong secondary motion (~30°) (Figure 17). This result suggests that stronger secondary motions on the curve pipe have possibly affected the TKE increase (Figure 20A). The trends of the turbulence, secondary flow, and vortical structure were qualitatively observed in the same manner, even in the single-phase flows not included here.

4. Conclusions

We employed herein an automated grid generation algorithm to observe the flow and pressure patterns at four different gravitational directions for the single- vs. two-phase flows in C- and U-shaped pipes. Both single- and two-phase flows followed the same trends with regards to static and hydrostatic pressures. In contrast, dynamic pressures have quite different distributions in the two-phase flows compared to the single-phase flows. In particular, the dynamic pressure is strongly affected by the direction of the buoyancy force. If the buoyancy force is aligned with the flow direction, the air phase velocity will increase and the water phase velocity will decrease for mass conservation. In addition, Dean flows are observed on the transverse plane of the curve regions in both C-shaped and U-shaped pipes as a result of the inertia force experienced by water moving along the curve portion offered an enhanced mixing in a 2D section by introducing a curvature to the flow path. Additionally, due to the influence of the inertia force, the water and air phases will switch positions when they pass the curve inlet. The inertia force also causes the secondary motion of the flow structure, becoming the strongest at around 30° of the curve bend. Furthermore, the strong TKE appeared near the inner walls of the similar region, where a strong secondary motion was captured. We further found that the TKE was greater in the two-phase flows than in the single-phase flows, implying that two-phase flows are more unstable. These following results could be often observed at various industrial sites. For instances, the complex interphase interaction caused by the secondary flow and volume fraction inside the C- and U-shaped pipes may lead to a dangerous situation at the nuclear energy field, such as the water hammer effect.
In our study, the Reynolds number was fixed for all simulations, because we focused on two-phase flow physics rather than turbulent flow physics. Thus, the physics of turbulence in curved pipes with various Reynolds numbers should be examined in future research. In addition, we only validated water velocity because air velocity has not been reported in the benchmark case. Thus, a prospective study for both computation and experiment is required to measure air/water velocity and static pressure. More future studies may be recommended to consider the phase change phenomenon (e.g., water hammer) and to apply machine learning techniques [22,23,24].

Author Contributions

Conceptualization: T.Q.D.P., J.J., and S.C.; methodology, T.Q.D.P. and J.J.; software: T.Q.D.P., formal analysis: T.Q.D.P.; writing—original draft preparation: T.Q.D.P.; writing—review and editing: Daeseong Jo, S.C.; supervision: S.C. All authors have read and agreed to the published version of the manuscript.

Funding

This work was supported by Korea Electric Power Corporation (KEPCO) with the grant number of R18XA06-67.

Data Availability Statement

Not applicable.

Conflicts of Interest

The authors declare no conflict of interest.

Abbreviations

CFDComputational fluid dynamics
HVACHeating, ventilation, and air conditioning
gGravity (m2/s)
LESLarge eddy simulation
MMomentum transfer
PODProper orthogonal decomposition
PPressure (Pa)
ReReynolds number
UAverage velocity magnitude (m/s)
uVelocity vector (m/s)
u ¯ Mean fluctuation velocity (m/s)
TKETurbulent kinetic energy
Greek
α Volume fraction
ρ Fluid density
τ Viscous stress tensor
Subscripts
DragDrag force
DPDynamic Pressure (Pa)
HPHydrostatic Pressure (Pa)
LiftLift force
STStatic Pressure (Pa)
TOTTotal Pressure (Pa)
VMVirtual mass force

References

  1. Ohnuki, A.; Akimoto, H. Experimental study on transition of flow pattern and phase distribution in upward air–water two-phase flow along a large vertical pipe. Int. J. Multiph. Flow 2000, 26, 367–386. [Google Scholar] [CrossRef]
  2. Lucas, D.; Krepper, E.; Prasser, H.-M. Prediction of radial gas profiles in vertical pipe flow on the basis of bubble size distribution. Int. J. Therm. Sci. 2001, 40, 217–225. [Google Scholar] [CrossRef]
  3. Lucas, D.; Prasser, H.-M. Steam bubble condensation in sub-cooled water in case of co-current vertical pipe flow. Nucl. Eng. Des. 2007, 237, 497–508. [Google Scholar] [CrossRef]
  4. Shen, X.; Mishima, K.; Nakamura, H. Two-phase phase distribution in a vertical large diameter pipe. Int. J. Heat Mass Transf. 2005, 48, 211–225. [Google Scholar] [CrossRef]
  5. Yoneda, K.; Yasuo, A.; Okawa, T. Flow structure and bubble characteristics of steam–water two-phase flow in a large-diameter pipe. Nucl. Eng. Des. 2002, 217, 267–281. [Google Scholar] [CrossRef]
  6. Abdulkadir, M. Experimental and computational fluid dynamics (CFD) studies of gas-liquid flow in bends. PhD. Thesis, University of Nottingham, Nottingham, UK, 2011. [Google Scholar]
  7. Andrade, T.; Crivelaro, K.; Neto, S.; Lima, A. Isothermal and non-isothermal water and oil two-phase flow (core-flow) in curved pipes. Int. J. Multiphys 2016, 7. [Google Scholar] [CrossRef] [Green Version]
  8. Saffari, H.; Moosavi, R.; Gholami, E.; Nouri, N.M. The effect of bubble on pressure drop reduction in helical coil. Exp. Therm. Fluid Sci. 2013, 51, 251–256. [Google Scholar] [CrossRef]
  9. da Mota, F.R.; Pagano, D.J. Simulation and experimental study of phase segregation in helical pipes: A new method for flow conditioning. Flow Meas Instrum 2014, 35, 99–108. [Google Scholar] [CrossRef]
  10. Lee, G. A Numerical Study for Upward Two-Phase Flow inside the Curved Pipe. In Proceedings of the Transactions of the Society of Air-Conditioning and Refrigerator Engineers of Korea Summer Meeting, Gyeongju, Korea, June 16; pp. 1051–1054.
  11. Pruvost, J.; Legrand, J.; Legentilhomme, P. Numerical investigation of bend and torus flows, part I: Effect of swirl motion on flow structure in U-bend. Chem. Eng. Sci. 2004, 59, 3345–3357. [Google Scholar] [CrossRef]
  12. Rachman, F.F.; Sukarno, R.; Putra, N. Experimental and feasibility study of the utilization of u-shaped heat pipes for reducing air humidity in HVAC systems. Int. J. Adv. Sci 2020, 29, 3402–3410. [Google Scholar]
  13. Ong, K.-S.; Goh, G.; Tshai, K.; Chin, W. Performance of an R410a Filled C-Shape Heat Pipe. Front. Heat Pipes 2016, 7, 2–7. [Google Scholar] [CrossRef] [Green Version]
  14. Takemura, T.; Roko, K.; Shiraha, M.; Midoriyama, S. Dryout characteristics and flow behavior of gas-water two-phase flow through U-shaped and inverted U-shaped bends. Nucl. Eng. Des 1986, 95, 365–373. [Google Scholar] [CrossRef]
  15. Pham, T.Q.D.; Jeon, J.; Choi, S. Quantitative comparison between volume-of-fluid and two-fluid models for two-phase flow simulation using OpenFOAM. J. Mech. Sci. Technol 2020, 34, 1–10. [Google Scholar] [CrossRef]
  16. Liang, L.; Michaelides, E.E. The magnitude of Basset forces in unsteady multiphase flow computations. J. Fluids Eng. 1992, 14, 417–419. [Google Scholar] [CrossRef]
  17. Miyawaki, S.; Hoffman, E.A.; Lin, C.-L. Numerical simulations of aerosol delivery to the human lung with an idealized laryngeal model, image-based airway model, and automatic meshing algorithm. Comput Fluids 2017, 148, 1–9. [Google Scholar] [CrossRef] [Green Version]
  18. Geuzaine, C.; Remacle, J.F.; Gmsh, A. 3D finite element mesh generator with built in pre and post processing facilities. Int. J. Numer. Methods Fluids 2009, 79, 1309–1331. [Google Scholar] [CrossRef]
  19. Takamasa, T.; Kondo, K. Measurement of interfacial configurations on bubbly flow in 180deg-bent tube using image-processing method. J. Nippon Kikai Gakkai Ronbunshu B Hen 1995, 61, 2372–2378. [Google Scholar]
  20. Dean, W.R. XVI. Note on the motion of fluid in a curved pipe. Mathematika 1927, 4, 208–223. [Google Scholar]
  21. Dennis, S.C.R.; Ng, M. Dual Solutions for Steady Laminar Flow Through A Curved Tube. Q. J. Mech. Appl. Math. 1982, 35, 305–324. [Google Scholar] [CrossRef]
  22. Band, S.S.; Al-Shourbaji, I.; Karami, H.; Karimi, S.; Esfandiari, J.; Mosavi, A. Combination of Group Method of Data Handling (GMDH) and Computational Fluid Dynamics (CFD) for Prediction of Velocity in Channel Intake. Appl. Sci. 2020, 10, 7521. [Google Scholar] [CrossRef]
  23. Zhang, Y.; Zheng, X.; Xue, Q. A Deep Neural Network Based Glottal Flow Model for Predicting Fluid-Structure Interactions during Voice Production. Appl. Sci. 2020, 10, 705. [Google Scholar] [CrossRef] [Green Version]
  24. Pham, T.Q.D.; Choi, S. Numerical Analysis of Direct Contact Condensation-Induced Water Hammering Effect Using OpenFOAM in Realistic Steam Pipes. Int. J. Heat Mass Transfer. 2020. [Google Scholar] [CrossRef]
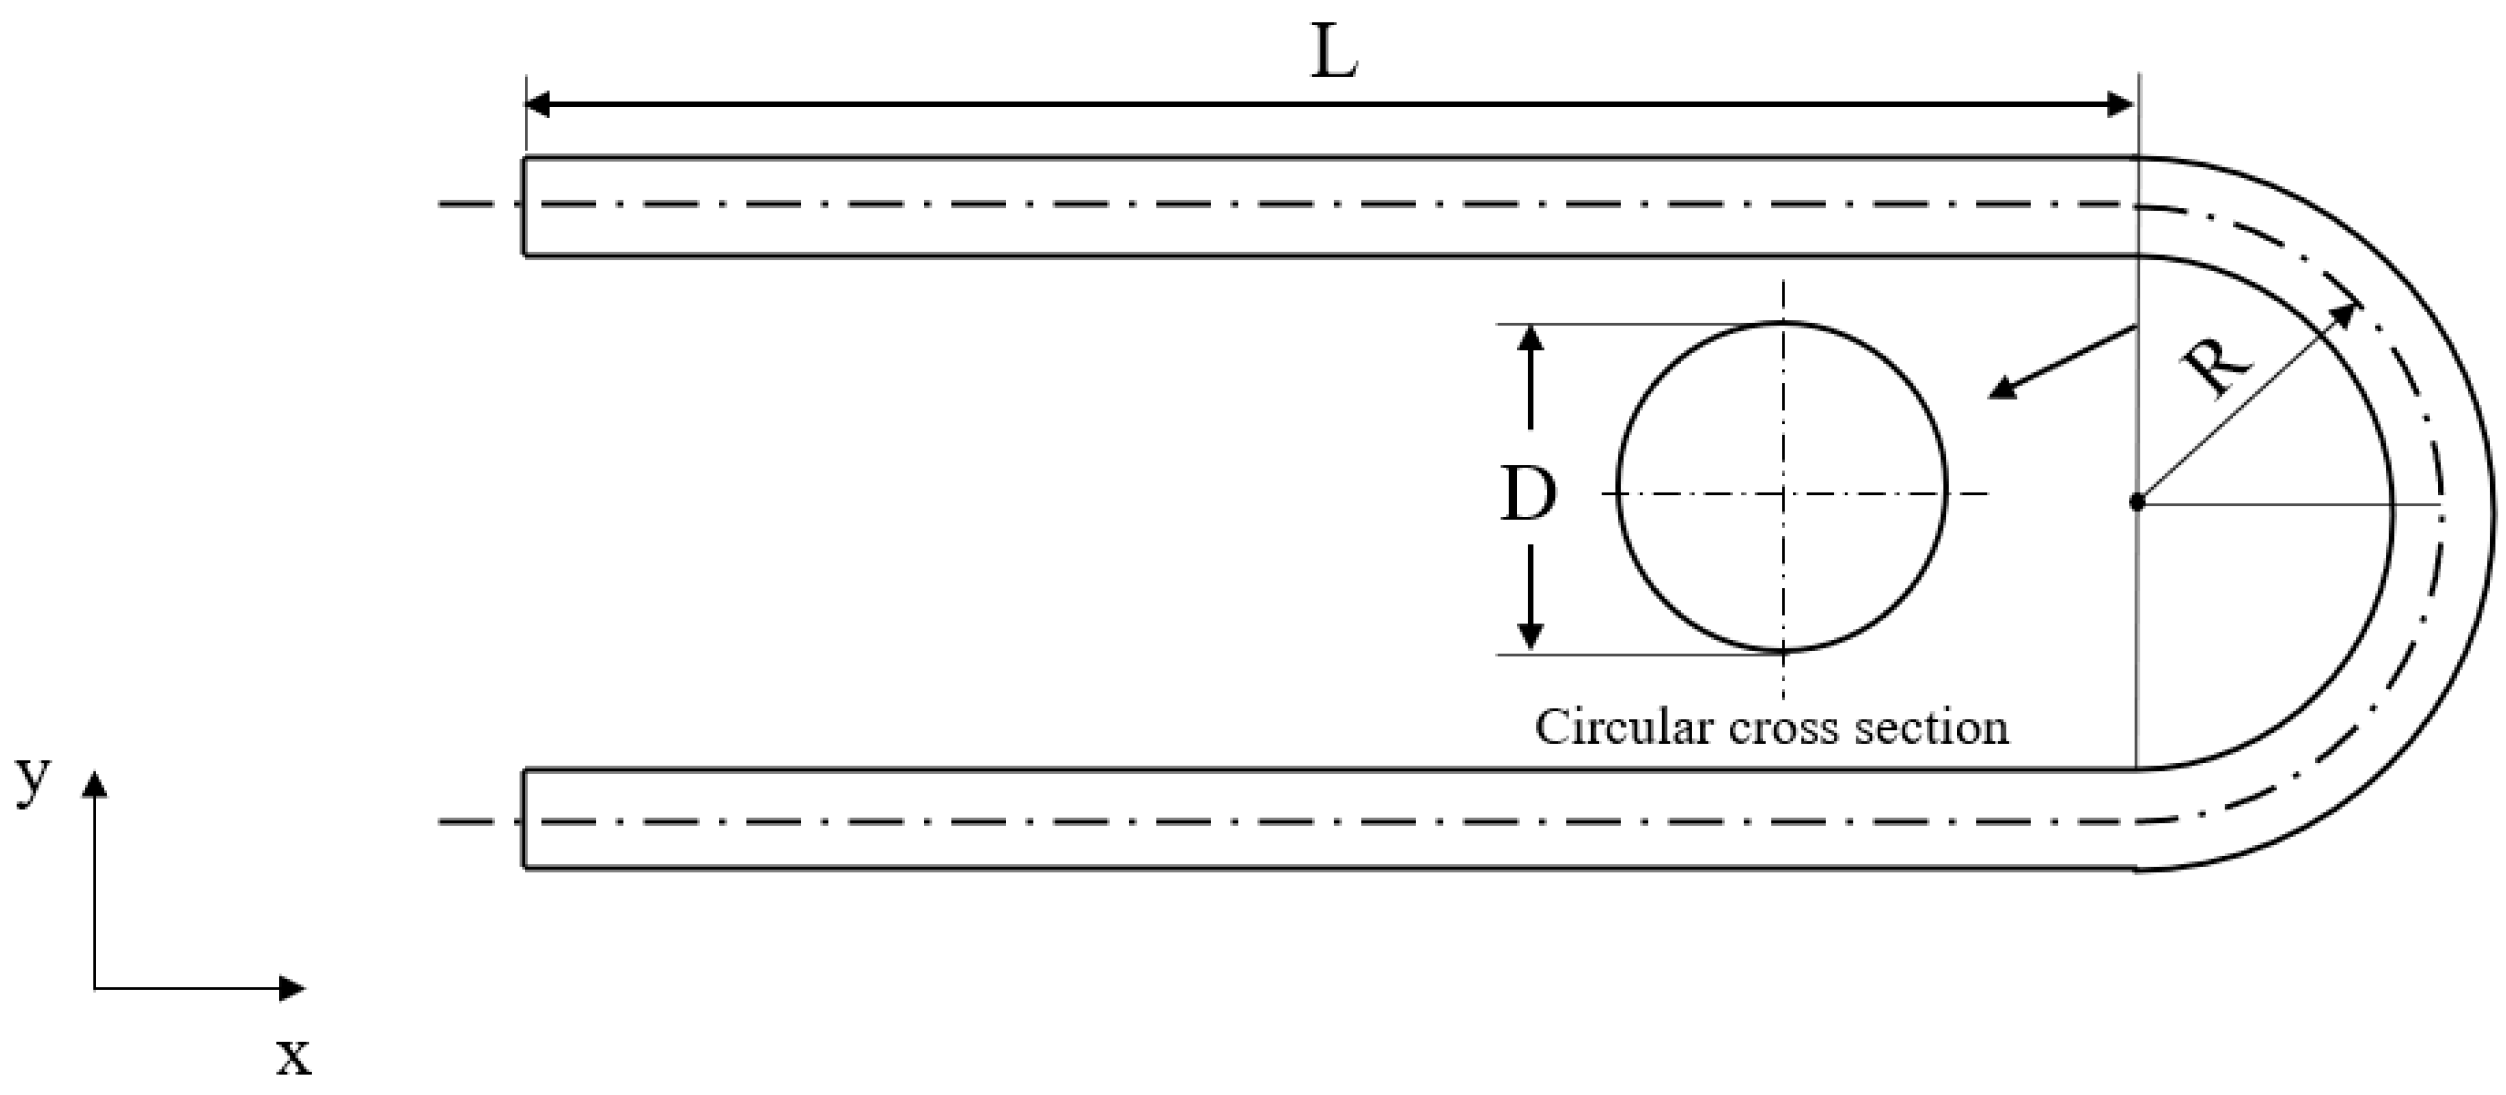
Figure 1. Schematic of the C-pipe geometry.
Applsci 11 02020 g001
Figure 2. Schematic of the C-shape pipe mesh construction: (A) centerline from FreeCAD; (B) divided centerline and element number; (C) intermediate cross-sectional zones of the C-shape pipe before the mesh generation; and (D) mesh with cross-sectional zones.
Applsci 11 02020 g002
Figure 3. Generation of (A) geometry, (B) uniform mesh, and (C) non-uniform mesh.
Applsci 11 02020 g003
Figure 4. Gravitational conditions for cases (A) 1, (B) 2, (C) 3, and (D) 4.
Applsci 11 02020 g004
Figure 5. Three cross-sectional zones for the quantitative validation.
Applsci 11 02020 g005
Figure 6. Streamwise water velocity at the three cross lines at the (A) curve inlet, (B) curve center, and (C) curve outlet for validating the existing experimental data [19] with α a i r   =   0.94 % .
Applsci 11 02020 g006
Figure 7. Iso-surface of the velocity magnitude of water (cyan) = 1.43 m/s and the velocity vectors at three cross-sections in Case 1 with α a i r   =   0.94 % .
Applsci 11 02020 g007
Figure 8. Grid convergence test of the axial water velocity at the curve inlet with α a i r   =   0.94 % .
Applsci 11 02020 g008
Figure 9. Streamwise water velocity at the curve inlet of LES, k- ω , and k- ε turbulence models with α a i r   =   0.94 % .
Applsci 11 02020 g009
Figure 10. Contours of the water velocity magnitude and tangential velocity vectors at the curve inlet, center, and outlet for cases (A) 1, (B) 2, (C) 3, and (D) 4 with α a i r   =   0.94 % .
Applsci 11 02020 g010
Figure 11. Tangential water velocity vectors at the curve inlet, center, and outlet for cases (A) 1, (B) 2, (C) 3, and (D) 4 with α a i r   =   0.94 % .
Applsci 11 02020 g011
Figure 12. Air velocity magnitude contour of four curve pipe cases with α a i r   =   0.94 % .
Applsci 11 02020 g012
Figure 13. (A) Static, (B) hydrostatic, (C) dynamic pressure of the air phase, (D,E) dynamic pressure of the water phase, and (F) total dynamic pressure at each surface zone of all eight cases, where S and T denote the single- and two-phase flows, respectively, with α a i r   =   0.94 % .
Applsci 11 02020 g013
Figure 14. Total pressure change along the axial length of the (A) single- and (B) two-phase flows with α a i r   =   0.94 % .
Applsci 11 02020 g014
Figure 15. Dynamic pressure of (A) air and (B) water phases for three different volume fractions in the case 1: C-shaped upward injection.
Applsci 11 02020 g015
Figure 16. Axial water velociy of the (A) single- and (B) two-phase flows, respectively, at seven curve portions of 0°, 15°, 30°, 45°, 60°, 75°, and 90°. The black square denotes the position of the maximum axial velocity; (C) the maximum velocity magnitude of both single- and two-phase flows.
Applsci 11 02020 g016
Figure 17. Visualization of the Dean flow [20] at six different bend angles of the curve portion.
Applsci 11 02020 g017
Figure 18. Water and air volume fraction behavior in a C shape with an upward injection pipe.
Applsci 11 02020 g018
Figure 19. Schematic of the turbulent kinetic energy (TKE) distribution of the (A) single- and (B) two-phase flows.
Applsci 11 02020 g019
Figure 20. Schematic of the (A) turbulent kinetic energy distribution in the 2D slice. (B) First fluctuating eigenmode (POD-derived coherent vortical structure) with an isosurface of λ 2 = −0.01. (C) Total pressure contour in the 2D slice.
Applsci 11 02020 g020
Table 1. Numerical setting and boundary conditions of the computational simulations.
Settings
Numerical solver in OpenFOAMTwoPhaseEulerFoam
Two-phase flow modelTwo-fluid
Time-step1 × 10−5 s
Max Courant-Friedrichs-Lewy (CFL)0.5
Total time5 s
Air volume fraction0.94%
Initial conditionsWater was filled in the pipe initially
Bubble diameter 4 × 10 4 mm
Surface tension0.072 N/m
Boundary conditionsInletUniform velocity
OutletZero-gradient velocity
WallNo-slip velocity
Table 2. Number of nodes and cells for coarse, medium, dense uniform, and non-uniform grids.
CoarseMediumDense
UniformNode--847,095
Cell--4,855,391
Non-uniformNode139,436664,278905,524
Cell709,2213,686,3095,021,251
Table 3. Total pressure drops (pressure gradient, Δ p L ) in the straight and curve pipes in all eight cases.
CasesInlet-to-Curve Inlet [N/m3]Curve Inlet-to-Curve Outlet [N/m3]Curve Outlet-to-Outlet [N/m3]Total [Pa]
S1210 (375)233 (599)252 (450)696 (464)
S2233 (417)233 (599)252 (450)720 (480)
S3213 (381)233 (598)252 (451)700 (466)
S4213 (381)233 (598)252 (450)699 (466)
T1233 (416)243 (624)250 (447)727 (485)
T2238 (426)258 (663)276 (493)773 (515)
T3279 (499)289 (741)292 (521)860 (573)
T4269 (481)287 (736)284 (507)840 (560)
Publisher’s Note: MDPI stays neutral with regard to jurisdictional claims in published maps and institutional affiliations.