Article

Numerical Investigation of the Effect of Air Leaking into the Working Fluid on the Performance of a Steam Ejector

School of Mechanical Engineering and Automation, Northeastern University, Shenyang 110819, China
*
Author to whom correspondence should be addressed.
Appl. Sci. 2021, 11(13), 6111; https://doi.org/10.3390/app11136111
Submission received: 19 April 2021 / Revised: 18 June 2021 / Accepted: 23 June 2021 / Published: 30 June 2021
(This article belongs to the Special Issue Computational Fluid Mechanics and Heat Transfer)

Abstract

:
This paper investigated the effect of air leaking into the working fluid on the performance of a steam ejector. A simulation of the mixing of air into the primary and secondary fluids was performed using CFD. The effects of air with a 0, 0.1, 0.3 and 0.5 mass fraction on the entrainment ratio and internal flow structure of the steam ejector were studied, and the coefficient distortion rates for the entrainment ratios under these air mass fractions were calculated. The results demonstrated that the air modified the physical parameters of the working fluid, which is the main reason for changes in the entrainment ratio and internal flow structure. The calculation of the coefficient distortion rate of the entrainment ratio illustrated that the air in the primary fluid has a more significant impact on the change in the entrainment ratio than that in the secondary fluid under the same air mass fraction. Therefore, the air mass fraction in the working fluid must be minimized to acquire a precise entrainment ratio. Furthermore, this paper provided a method of inspecting air leakage in the experimental steam ejector refrigeration system.

1. Introduction

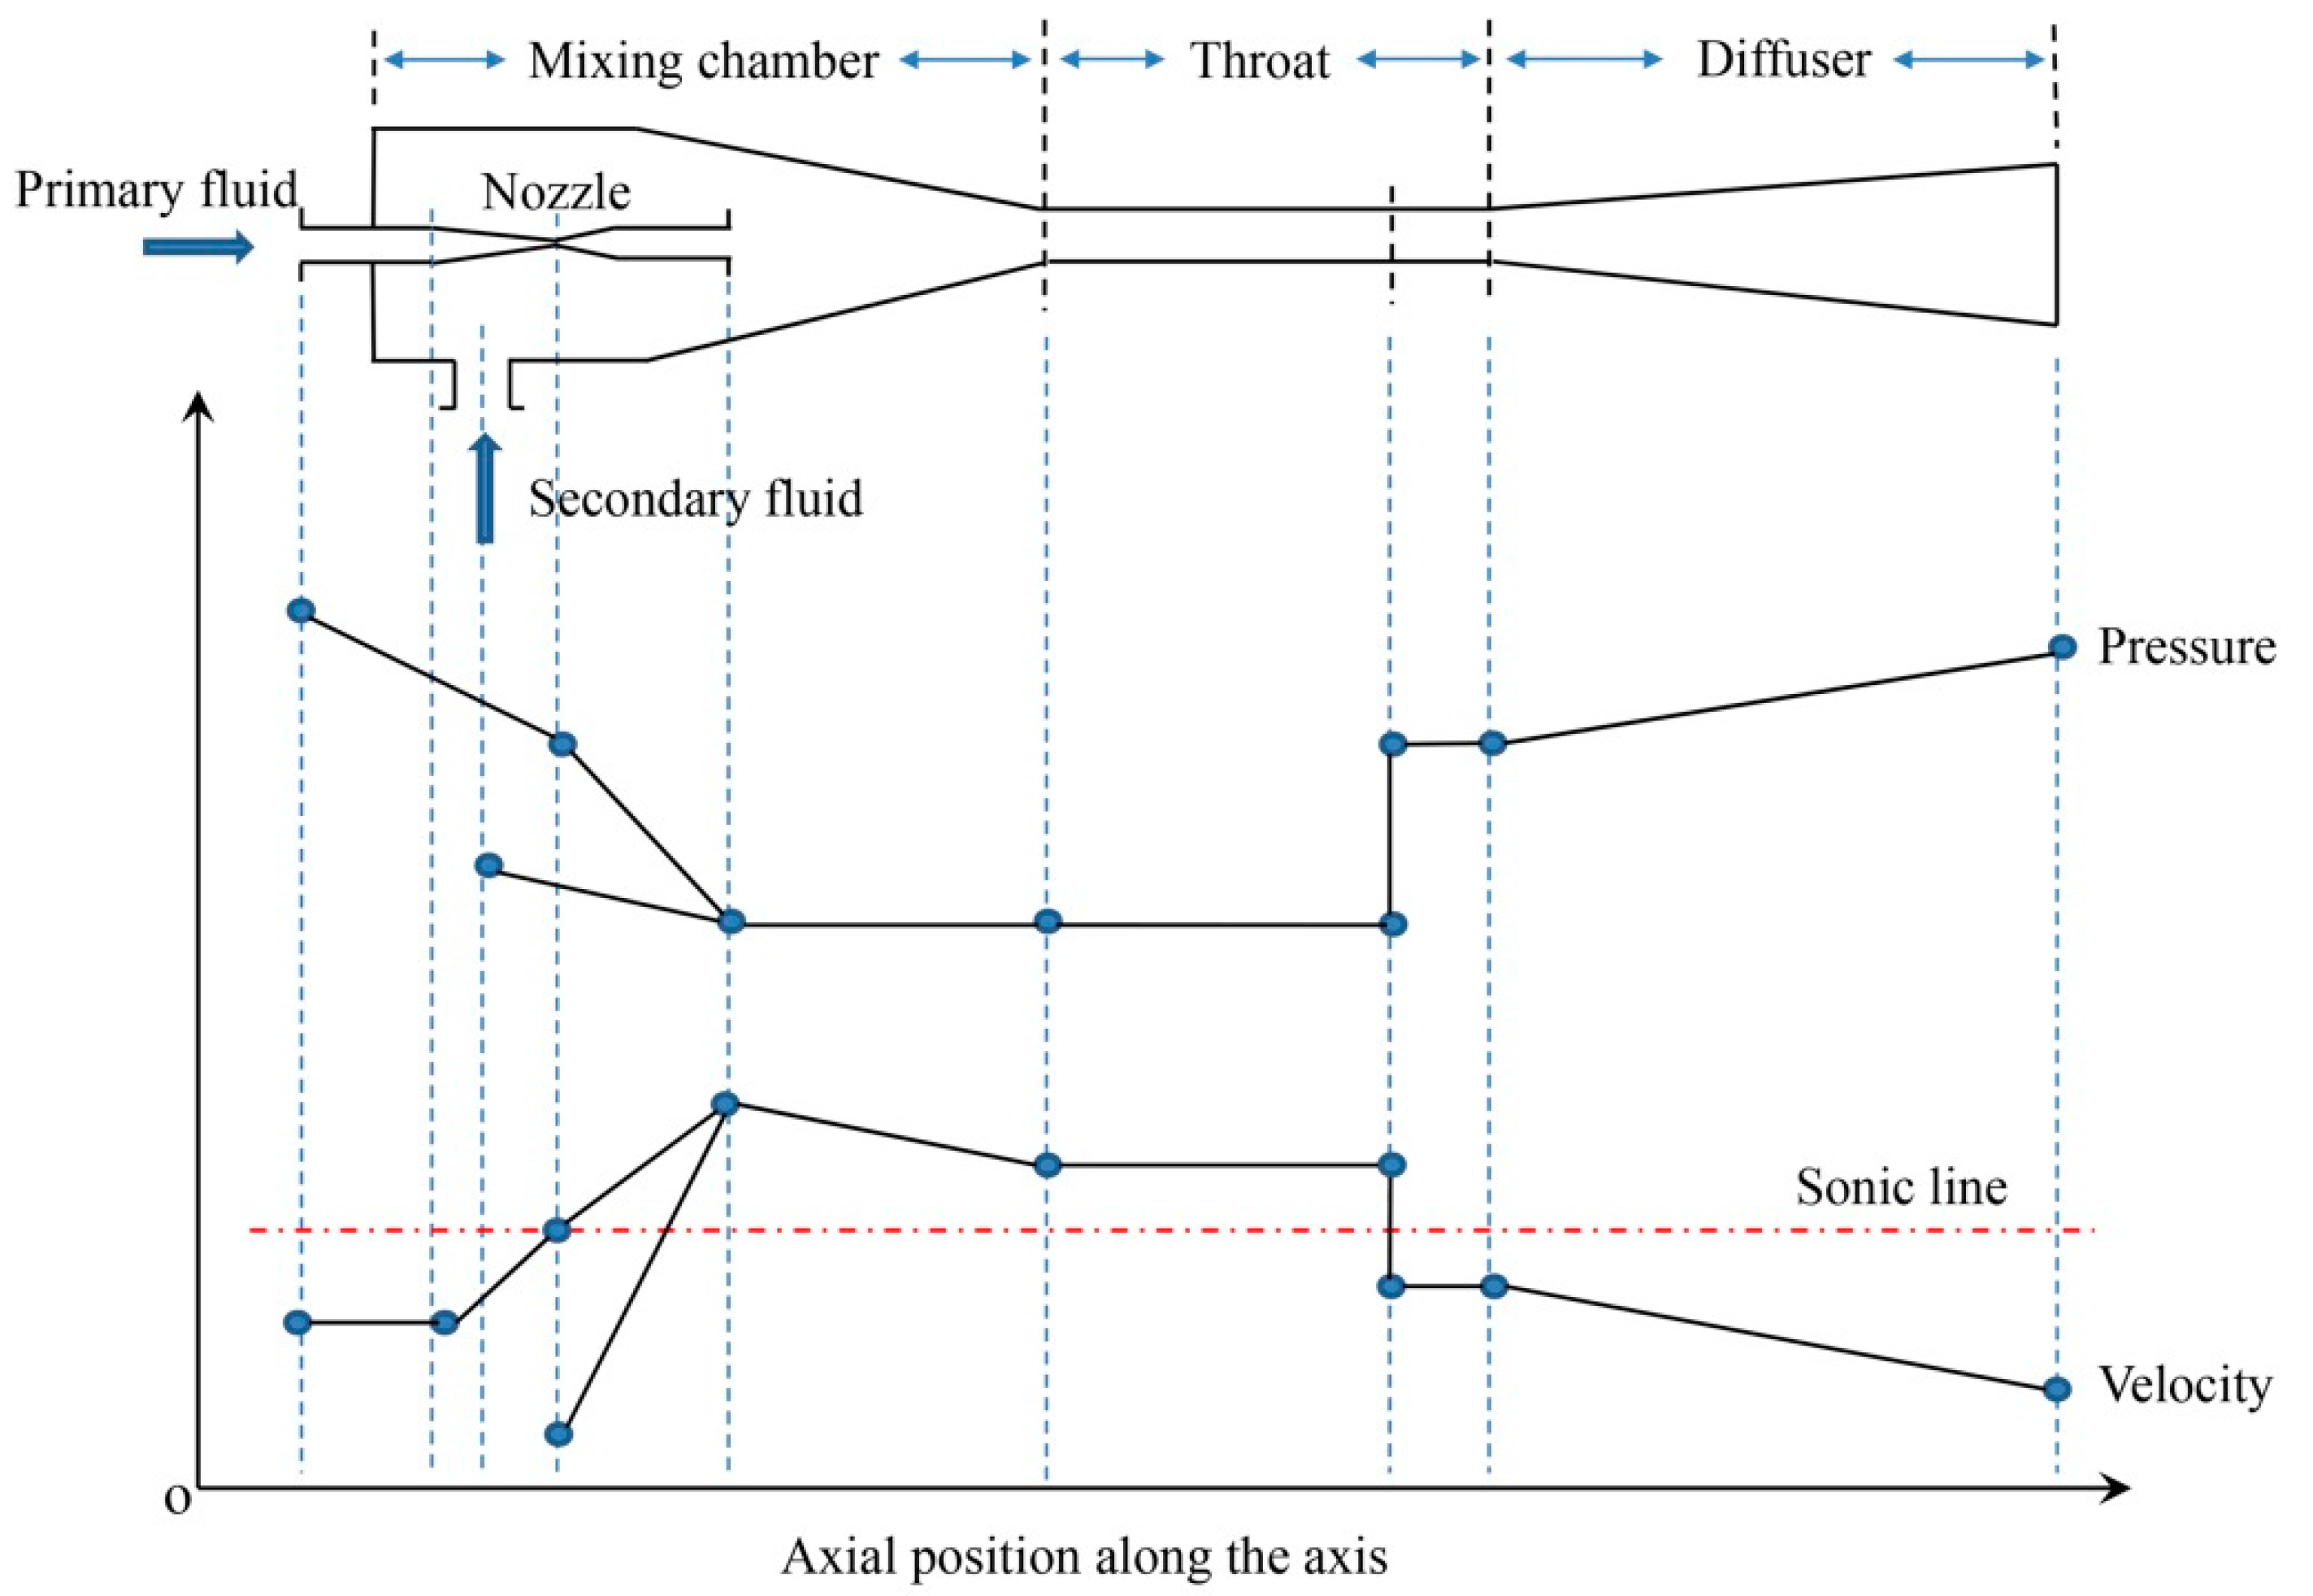
As the global energy problem is worsening, devices that can use industrial waste heat, solar energy, and other accessible heat sources have become very important for humankind. The steam ejector can, not only use industrial waste heat generated by heating and power plants, but also has the advantages of a simple structure, convenient operation, easy maintenance, and environmental friendliness. Therefore, it is widely used in vacuuming, refrigeration, heat recovery, and desalination of seawater and has received considerable research attention. The steam ejector is a simple device but the resolution of the internal supersonic flow process using numerical methods is complicated. The structural schematic and internal flow characteristics for the steam ejector are shown in Figure 1 (adapted from [1]). The nozzle accelerates the working fluid (steam) from stagnation to supersonic speed, which creates a low pressure in the mixing chamber (vacuum). The secondary fluid is drawn into the mixing chamber under the pressure difference and exchanges energy and momentum with the high-speed primary fluid. Finally, the two fluids are decelerated (to subsonic speed), pressurized by the diffuser, and then discharged into the atmosphere or pumped by the fore-line pump. The whole flow process is transonic and accompanied by a shock wave and other complex flow behaviors.
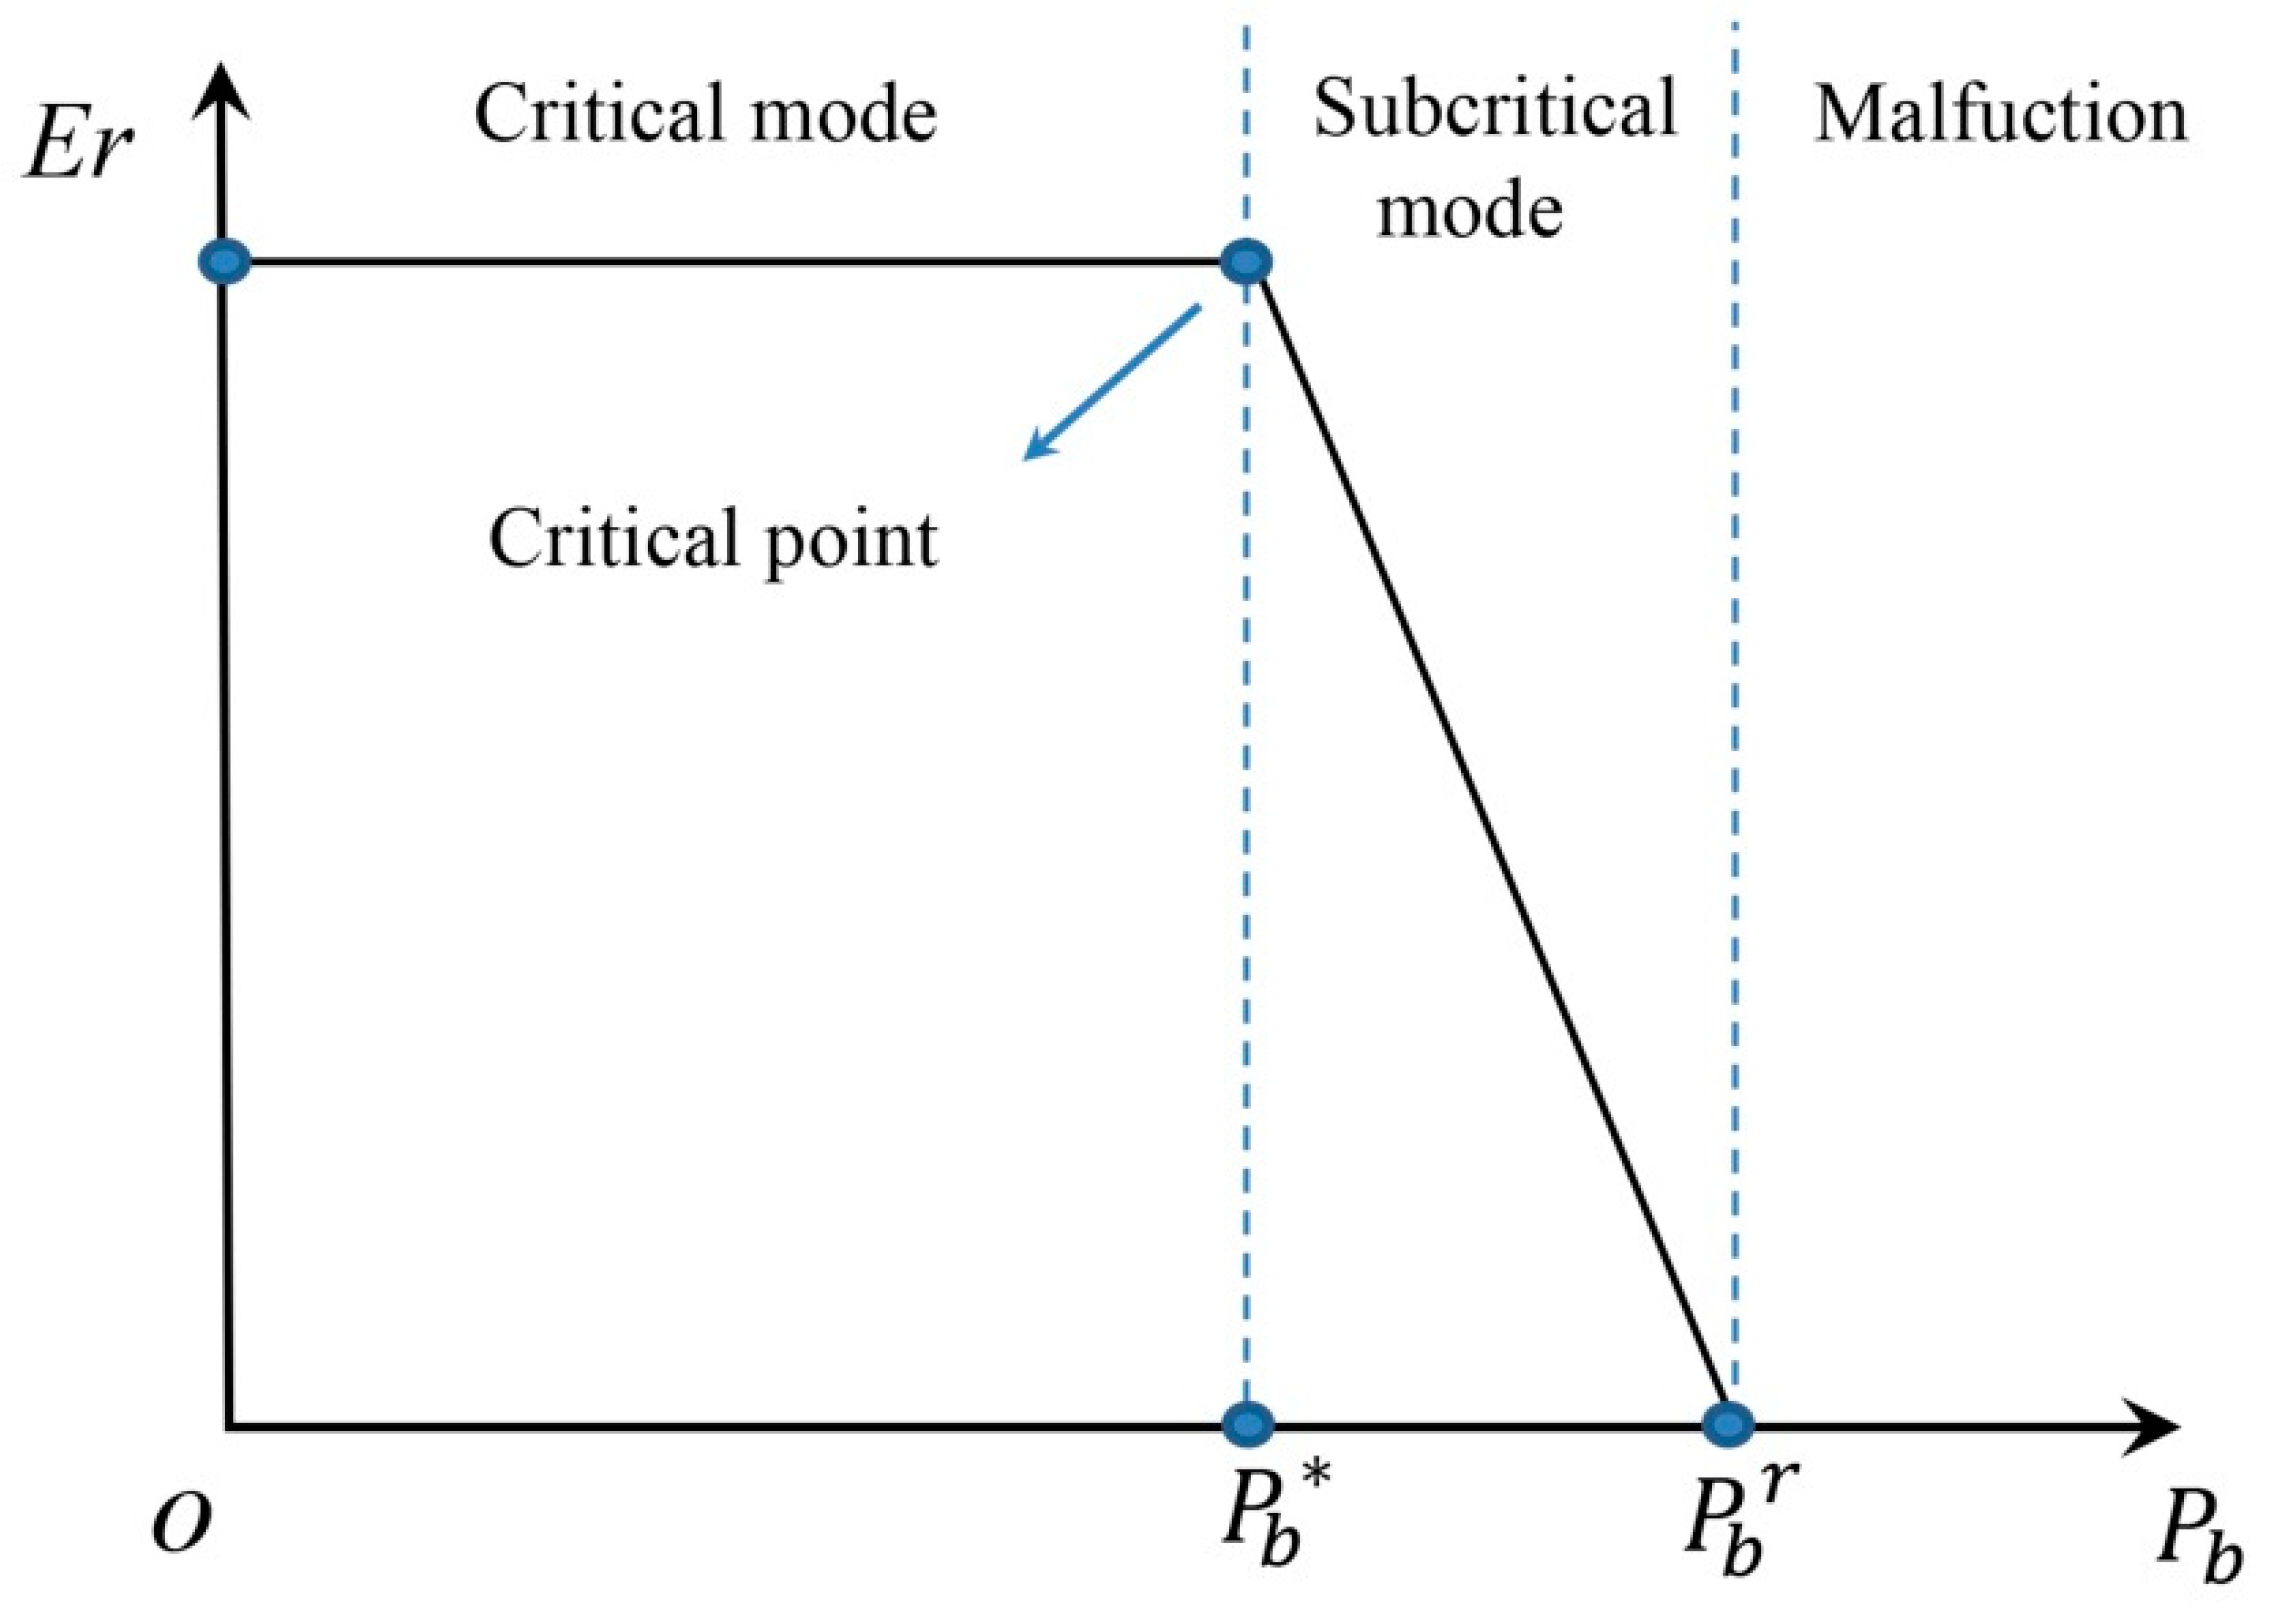
The typical performance curve of a steam ejector is shown in Figure 2. There are two critical parameters: the entrainment ratio (Er), which describes the ejector performance and is defined as the mass flow rate ratio of the second inlet to the primary inlet, and the critical parameter Pb*, which it is the critical point to determine whether the ejector operates under standard working conditions. The typical performance curve includes three modes: critical, subcritical, and malfunction. In the critical mode, the back pressure is less than the critical back pressure and Er remains constant. In subcritical mode, Er gradually decreases until it reaches zero as Pb exceeds Pb*, which indicates that the ejector gradually losing its pumping function until failure. To prevent the pumping performance from degrading or even malfunctioning, Pb must be controlled to less than Pb*.
Many studies have investigated the steam ejector. Munday [2] proposed that the secondary steam can effectively choke at some ejector cross-sections when it reaches sonic velocity. Huang et al. [3] developed a 1D analysis mode with proposed empirical coefficients to accurately predict ejector performance. Zhu et al. [4] formulated a simple shock circle model that can more accurately predict ejector performance in critical mode operation than other 1D analysis methods. Bonanos [5] also presented a physical model of the ejector for multi-effect distillation units.
Chunnanond and Aphornratana [6] constructed a 3 kW steam ejector refrigerator to explore the internal flow and mixing progress of the ejector. Sriveerakul et al. [1] and Ruangtrakoon et al. [7] investigated the performance of a steam ejector under different operating conditions and geometries using an experimental steam jet refrigerator. Varga et al. [8] built a 5 kW capacity steam ejector refrigerator with variable primary nozzle geometry and compared experimental data with CFD results.
Many scholars have conducted extensive and in-depth research on the steam ejector operation condition, geometric structures, internal flow states, and numerical algorithms using CFD. Ji et al. [9] researched the effect of the converging duct angle on the flow structure and performance of a steam ejector using a CFD approach and found that an ejector with a converging duct angle of 1° has the best performance. Wu et al. [10] employed a CFD method to investigate the influence of mixing chamber geometries on the performance of the steam ejector used for the multi-effect distillation system. Wang et al. [11] studied the primary flow jet core patterns in the steam ejector using numerical simulations and focused on the relationship between the primary pseudo-shock pattern and ejector performance. The section shape and position of the nozzle exit were all-important geometric parameters that played a critical role in improving the ejector performance, which was verified in [12,13,14,15]. Chen et al. [16] numerically simulated a novel ejector with a bypass installed in the low-pressure district to enhance the ejector entrainment ratio. Wang et al. [17] designed an adaptive nozzle exit position (ANXP) ejector that automatically adjusts the nozzle position as the variation of operating conditions and regulated the performance of the MED-TVC desalination system. For maximum efficiency of the MED-TVC desalination system and to reduce energy consumption, Kouhikamali et al. [18] changed the ejector suction location from the last to the middle effect using the CFD method. Many scholars employed the “single-fluid” approach, also called the wet steam model [19,20,21], to numerically simulate steam ejector spontaneous condensation phenomenon; the “two-fluid” approach has also been applied by developing commercial codes [22] or in-house solvers [23,24].
In the studies mentioned above on the experiment or numerical simulation aspects, all scholars assumed that the working fluid is pure steam and ignored the presence of air. However, in producing and transmitting steam, air is mixed into the steam more or less because the experiment equipment cannot guarantee absolute sealing effectiveness for a long time.
Kumar et al. [25] experimentally researched a two-phase ejector for a desalination system with water as the primary fluid and air as the secondary fluid. Yuan et al. [26] experimentally and numerically investigated the hydrodynamic characteristics of a two- phase ejector with water as the primary fluid and a mixture of air and water as the entrained flow. Aliabadi et al. [27] used a mixture of water and steam by injecting water nano-droplets into the primary fluid inlet of a steam ejector in order to numerically investigate the effects of water droplets on the two-phase parameters, shock wave intensity and entrainment ratio. Chen et al. [28] also injected water into the secondary flow (air) to experimentally and numerically study the performance of a two phase flow air ejector.
However, there is a lack of research on the sensitivity of the performance of a steam ejector when different mass fractions of air are leaked into the primary and secondary fluids. To fill this scientific gap, we numerically used the mixture model to make steam and air with different mass fractions for the working fluid. The present study was to determine the effect of air leaking into the working fluid on the steam ejector performance, determine the cause of the change in steam ejector performance, and provided a valuable reference for air leakage inspection for experimental steam ejector refrigeration systems (RES).

2. Mathematical Model Description

2.1. Governing Equations

The internal flow of a steam ejector is governed by the compressible steady-state axisymmetric conservation equations of fluid flow. The Navier–Stokes equations are more suitable for variable-density flows. The total energy equation, including viscous dissipation, was considered and coupled with the ideal gas law. The governing continuity equation, momentum equation, and energy equation can be written as follows:
continuity equation:
ρ t + x i ( ρ u i ) = 0
momentum equation:
t ( ρ u i ) + x j ( ρ u i u j ) = P x i + τ i j x j
energy equation:
t ( ρ E ) + x i ( u i ( ρ E + P ) ) = · ( α e f f T x i ) + · ( u j ( τ i j ) )
where
τ i j = μ e f f ( u i x j + u j x i ) 2 3 μ e f f u k x k δ i j
In addition, gas state equation:
ρ = P R T
conservation equations for the working fluid:
i = 1 n Y i = 1
Y i = m i m t o t a l
where ui, uj, and uk are components of velocity, τij is the stress tensor of the fluid, E is the fluid energy, αeff is the effective thermal conductivity, μeff is the effective viscosity of the fluid, δij is the unit tensor, n is the total number of gases, Yi is the mass fraction of i-th species in the mixture, and mi is the mass of each species. In this study, air and steam were treated as non-reactive species in the flow field, so the species transport equations could be written as follows:
t ( ρ Y i ) + ( ρ v Y i ) = J i + S i
J i = ( ρ D i , m + μ t S c t ) Y i D T , i T T
where Si is the rate of creation by addition from the dispersed phase, Ji is the diffusion flux of species i. Di,m is the mass diffusion coefficient for species i in the mixture, DT,i is the turbulent diffusivity for species i in the mixture, μt is the turbulent viscosity, and Sct is the thermal diffusion coefficient.

2.2. Fluid Properties

The ideal gas model was applied for the working fluid, and the properties (thermal conductivity, specific heat capacity, and viscosity) of steam and air were used. Although the use of the ideal gas model ignored the phase change of the steam in the nozzle, some studies pointed out that the simulation results acquired by the ideal gas model are similar to those obtained by some real gas models under low operating pressure, such as Aphornratana et al. [29], Valle et al. [30], Besagni et al. [31,32], and Han et al. [33]. Therefore, the ideal gas model was considered suitable for this numerical simulation, especially for the low-pressure boundary conditions: the primary fluid, 198 kPa; the secondary fluid, 270 kPa; and back pressure, 2 kPa.

2.3. Turbulence Modeling

Mazzelli et al. [34] compared experimental results with the numerical simulation data for four turbulence models. The k-ω SST model showed better performance under global and local flow phenomena predictions. Croquer et al. [35] performed numerical simulations of a single-phase R134a supersonic ejector. They pointed out that the k-ω SST model can accurately predict ejector performance and capture the shock wave structure. Besagni et al. [36,37] and Varga et al. [38] also found that the k-ω SST model had the best agreement with experimental data when simulating the steam ejector with CFD. Therefore, the k-ω SST model was selected in this study. It can be described as follows:
x i ( ρ k u i ) = x j [ Γ k k x j ] + G k Y k + S k
x j ( ρ ω u j ) = x j [ Γ ω ω x j ] + G ω Y ω + D ω + S ω
where k is the turbulent kinetic energy and ω is the specific dissipation rate. Definitions of terms G, Y, S, and D can be found in [39].

3. Numerical Simulation and Its Verification

3.1. Numerical Simulation Settings

The ejector geometric parameters and experimental data were based on Sriveeraul et al. [1]. The structure parameters are summarized in Table 1. The model was established using ICEM and solved using FLUENT 15.0. The implicit density-based solver was selected to compute flow-governing equations. A 2D axisymmetric geometry was used to save time and computing costs. The pressure-inlet boundary condition was applied to the primary and secondary inlets. Turbulence intensity I was 5% for the primary fluid and 2% for the secondary fluid [32]. The pressure-outlet boundary condition was applied to the outlet of the ejector. The inner wall was set as adiabatic and no-slip. The near-wall treatment did not need to be set because it was already implemented in the mathematical structure of the k-ω SST turbulence model [37]. All the initial boundary conditions are listed in Table 2. The second-order upwind scheme was used for all e convection terms, and central difference discretization was applied for diffusion terms. Discrete systems were solved using the Gauss–Seidel method. All the calculated residuals were less than 10e-6 for the continuity equation, energy equation, momentum equation, and turbulent kinetic energy. Moreover, the flow mass difference between the inlet and outlet boundaries must be less than 10 × 10−7.

3.2. Grid Generation and Independency

The fluid computational domain was divided into structured quadrilateral elements using ICEM. Three grid quality levels, coarse (15,664), medium (62,199), and fine (127,093) were used to identify the grid dependency by simulating the Mach number along the steam ejector central axis. The results of grid independence are shown in Figure 3.
The Mach number of the medium mesh was similar to that of the fine grid, but there was a large difference between medium grid and the coarse grid. Finally, the medium grid was selected to balance the calculation time and accuracy. In addition, mesh self-adapting technology based on the velocity gradient was implemented to capture more detailed internal flow characteristics and is illustrated in Figure 4. After the mesh self-adaptation, the total grid number was 104,327.

3.3. CFD Model Validation

Table 3 shows the CFD simulation data compared with the experimental data [1] under the same working conditions. The performance curves and wall pressure distributions of tests 1, 2, and 3 are shown in Figure 5 and Figure 6. The numerical simulation data were close to the experimental data, except for test 3. The errors between the experimental and simulation data could be attributed to the following aspects: The computational simulation domain was 2D planar, whereas the actual experimental configurations were 3D structures. Errors occurred in the measurement process of static pressure or temperature, a self-error occurred in ideal gas model algorithm, and there was a possibility of air leaking into the working fluid.
Table 4 illustrates that there was a good consistency between CFD results in this study and those in [1].

4. Results and Discussion

To investigate the effect of air on the ejector performance, we used four air mass fractions (0, 0.1, 0.3, and 0.5), and marked Y1 as the air mass fraction leaking into the primary fluid and Y2 as that leaking into the secondary fluid. We also set the primary fluid, secondary fluid, and back pressures as 270, 1.2, and 3 kPa, respectively. In actual operation, it was impossible for air with mass fractions of 0.3 and 0.5 to leak into the steam ejector RES, but these mass fractions were more suitable for obtaining results with a pronounced trend.

4.1. The Effect of Air Leaking into the Primary Fluid on the Ejector Performance

The ejector performance curves with different air mass fractions were obtained through numerical simulations and are shown in Figure 7. The entrainment rate of the ejector decreased as Y1 increased. The larger value of Y1 was, the smaller the entrainment rate. Therefore, the air leaking into the primary fluid impaired the steam ejector performance under specific operating conditions. The entrainment ratio under Y1 = 0.5 decreased by 10% compared with Y1 = 0; in addition, Y1 = 0 had a higher critical pressure than the others. Many factors affect the ejector performance, as mentioned in the Introduction. Among these factors, the physical parameters of the working fluid and the internal flow structure of the ejector were the focus of the following discussion, and the relationship between their changes and the performance of the ejector is established.

4.1.1. The Effect of Air Leaking into the Primary Fluid on the Working Fluid Physical Parameters

We assumed the cross-section of the nozzle outlet as the initial mixing position of the primary and secondary fluids and obtained these parameters by taking the average value on this cross-section from the simulation results; these physical parameters are listed in Table 5.
As indicated in Table 5, the velocity and sound speed of the primary fluid at the initial mixing position decreased as Y1 increased from 0.1 to 0.5, while the density increased. Except for the increase in velocity, the other physical parameters of the secondary fluid remained unchanged. Therefore, there was an essential connection between the change in these parameters and the decrease in the entrainment ratio. To more intuitively show the relationship between the entrainment ratio and the air mass fraction, we incorporated the mass flux per unit cross-sectional area (density multiplied by the velocity) into the FLUENT user-defined function (UDF) and it is shown in Figure 8. The value of the secondary fluid mass flux lying in the same position gradually reduced with an increase in Y1. The value of the primary fluid mass flux in the red region of Figure 8 was slightly elevated when Y1 increased from 0 to 0.5. Therefore, air leaking into the primary fluid reduces the entrainment ratio of the ejector.

4.1.2. The Effect of Air Leaking into the Primary Fluid on the Internal Flow Structure

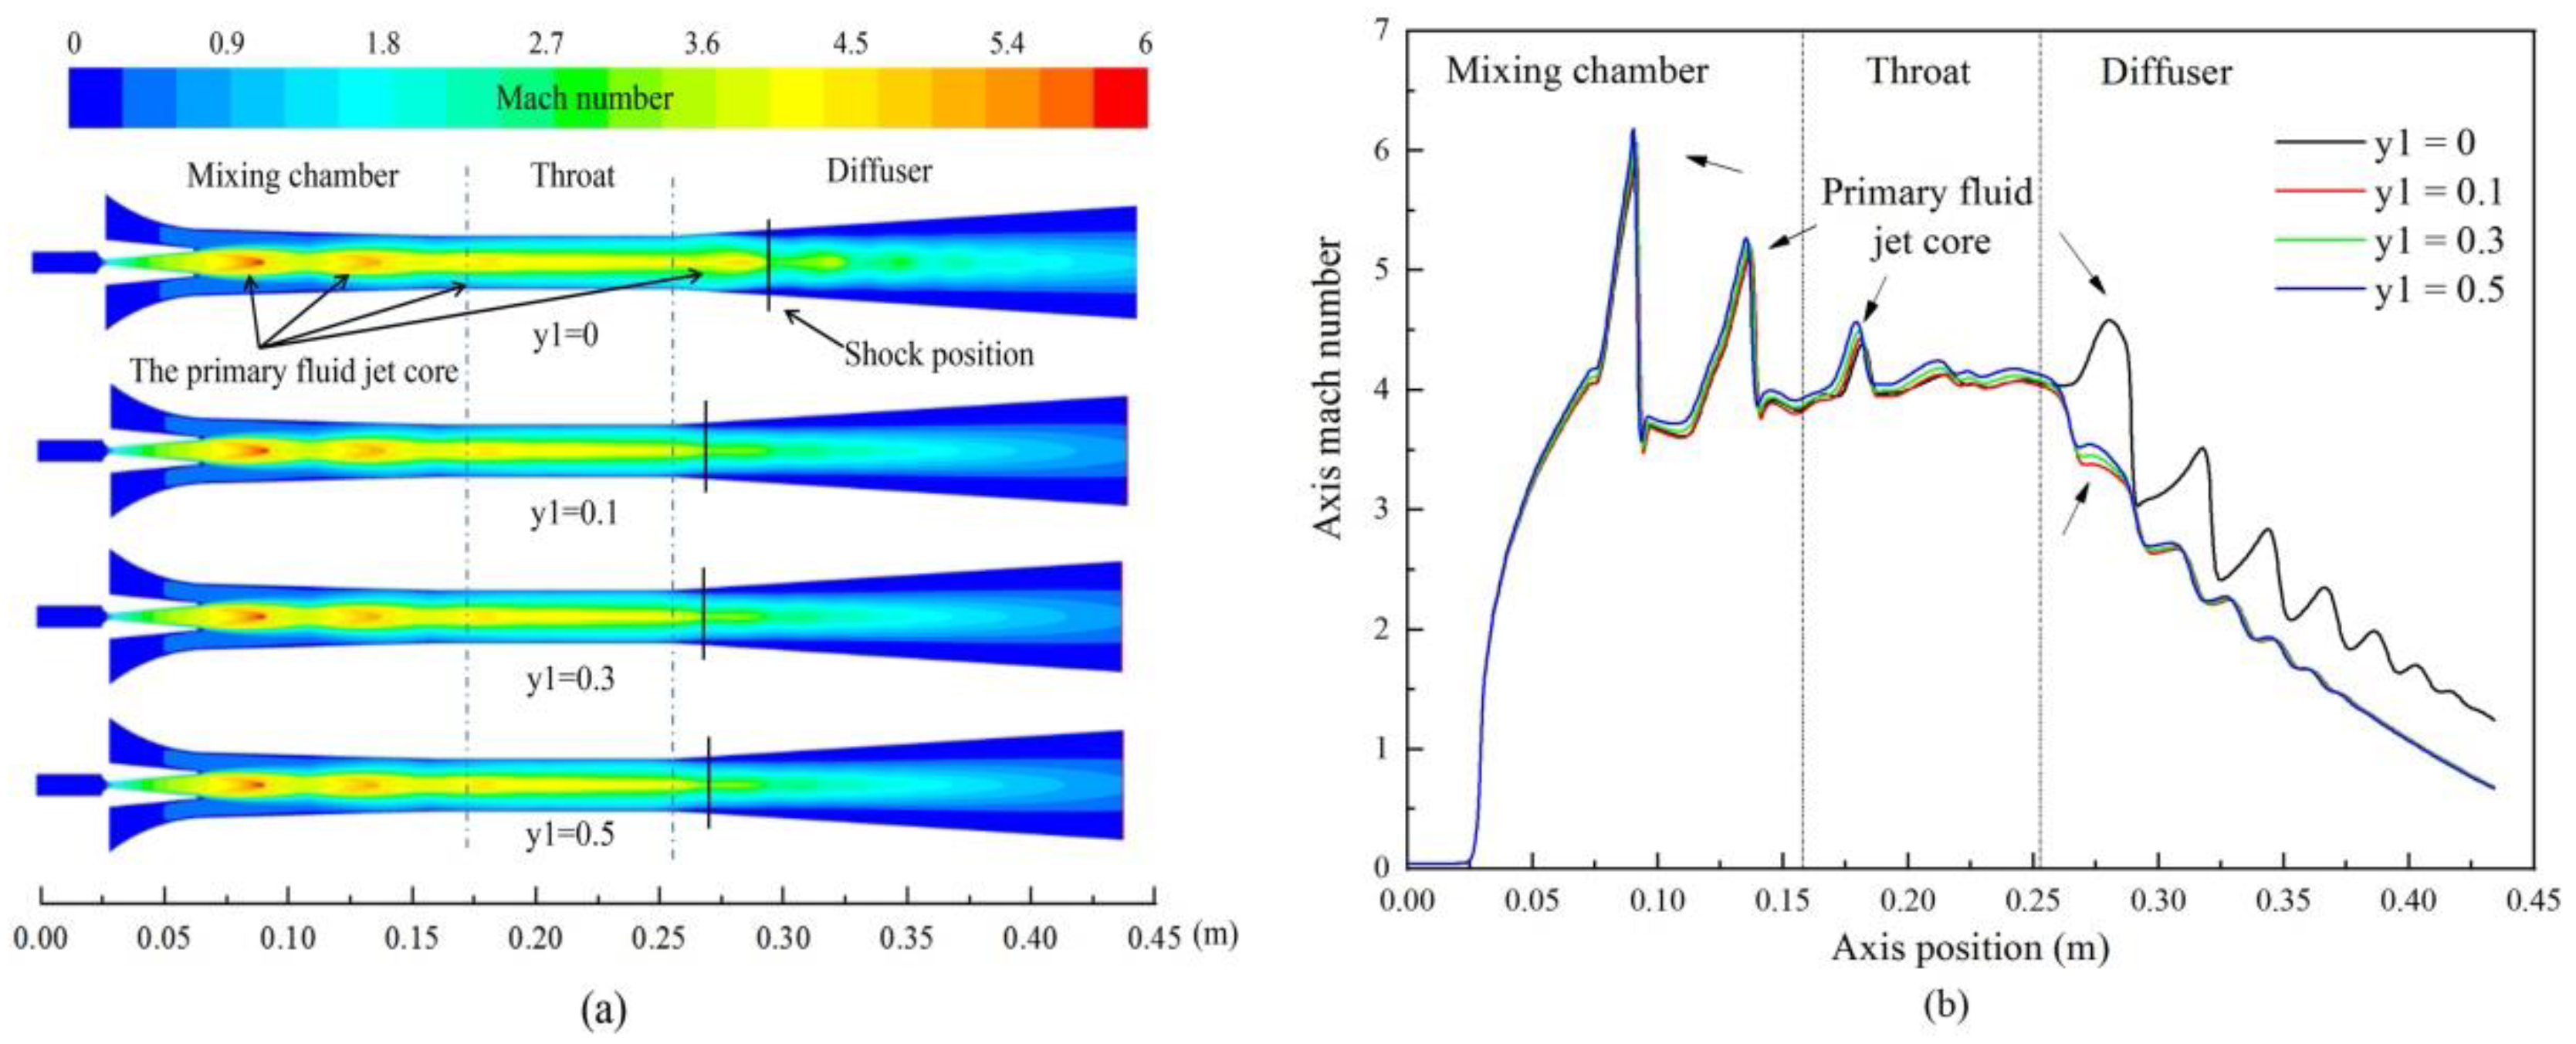
Figure 9a illustrates the ejector internal flow structure at different air mass fractions. The primary fluid shock pattern of other air mass fractions was the same as that of Y1 = 0 in the mixing chamber and throat. The positions of the three primary fluid jet cores in the mixing chamber and throat closely resembled each other with the four air mass fractions, as shown in Figure 9b. The primary fluid jet cores with the other air mass fractions in the diffuser were smaller than their respective primary fluid jet cores in the throat, except for Y1 = 0. This demonstrated that air leaking into the primary fluid reduces the velocity of the primary fluid jet core in the diffuser, which led to the mixture of steam and air having no solid momentum to resist the backpressure. It is not difficult to imagine that the shock position of Y1 = 0 is farther downstream than the others. Moreover, the discussion also explains why Y1 = 0 has a higher critical pressure than the others, as illustrated in Figure 7.

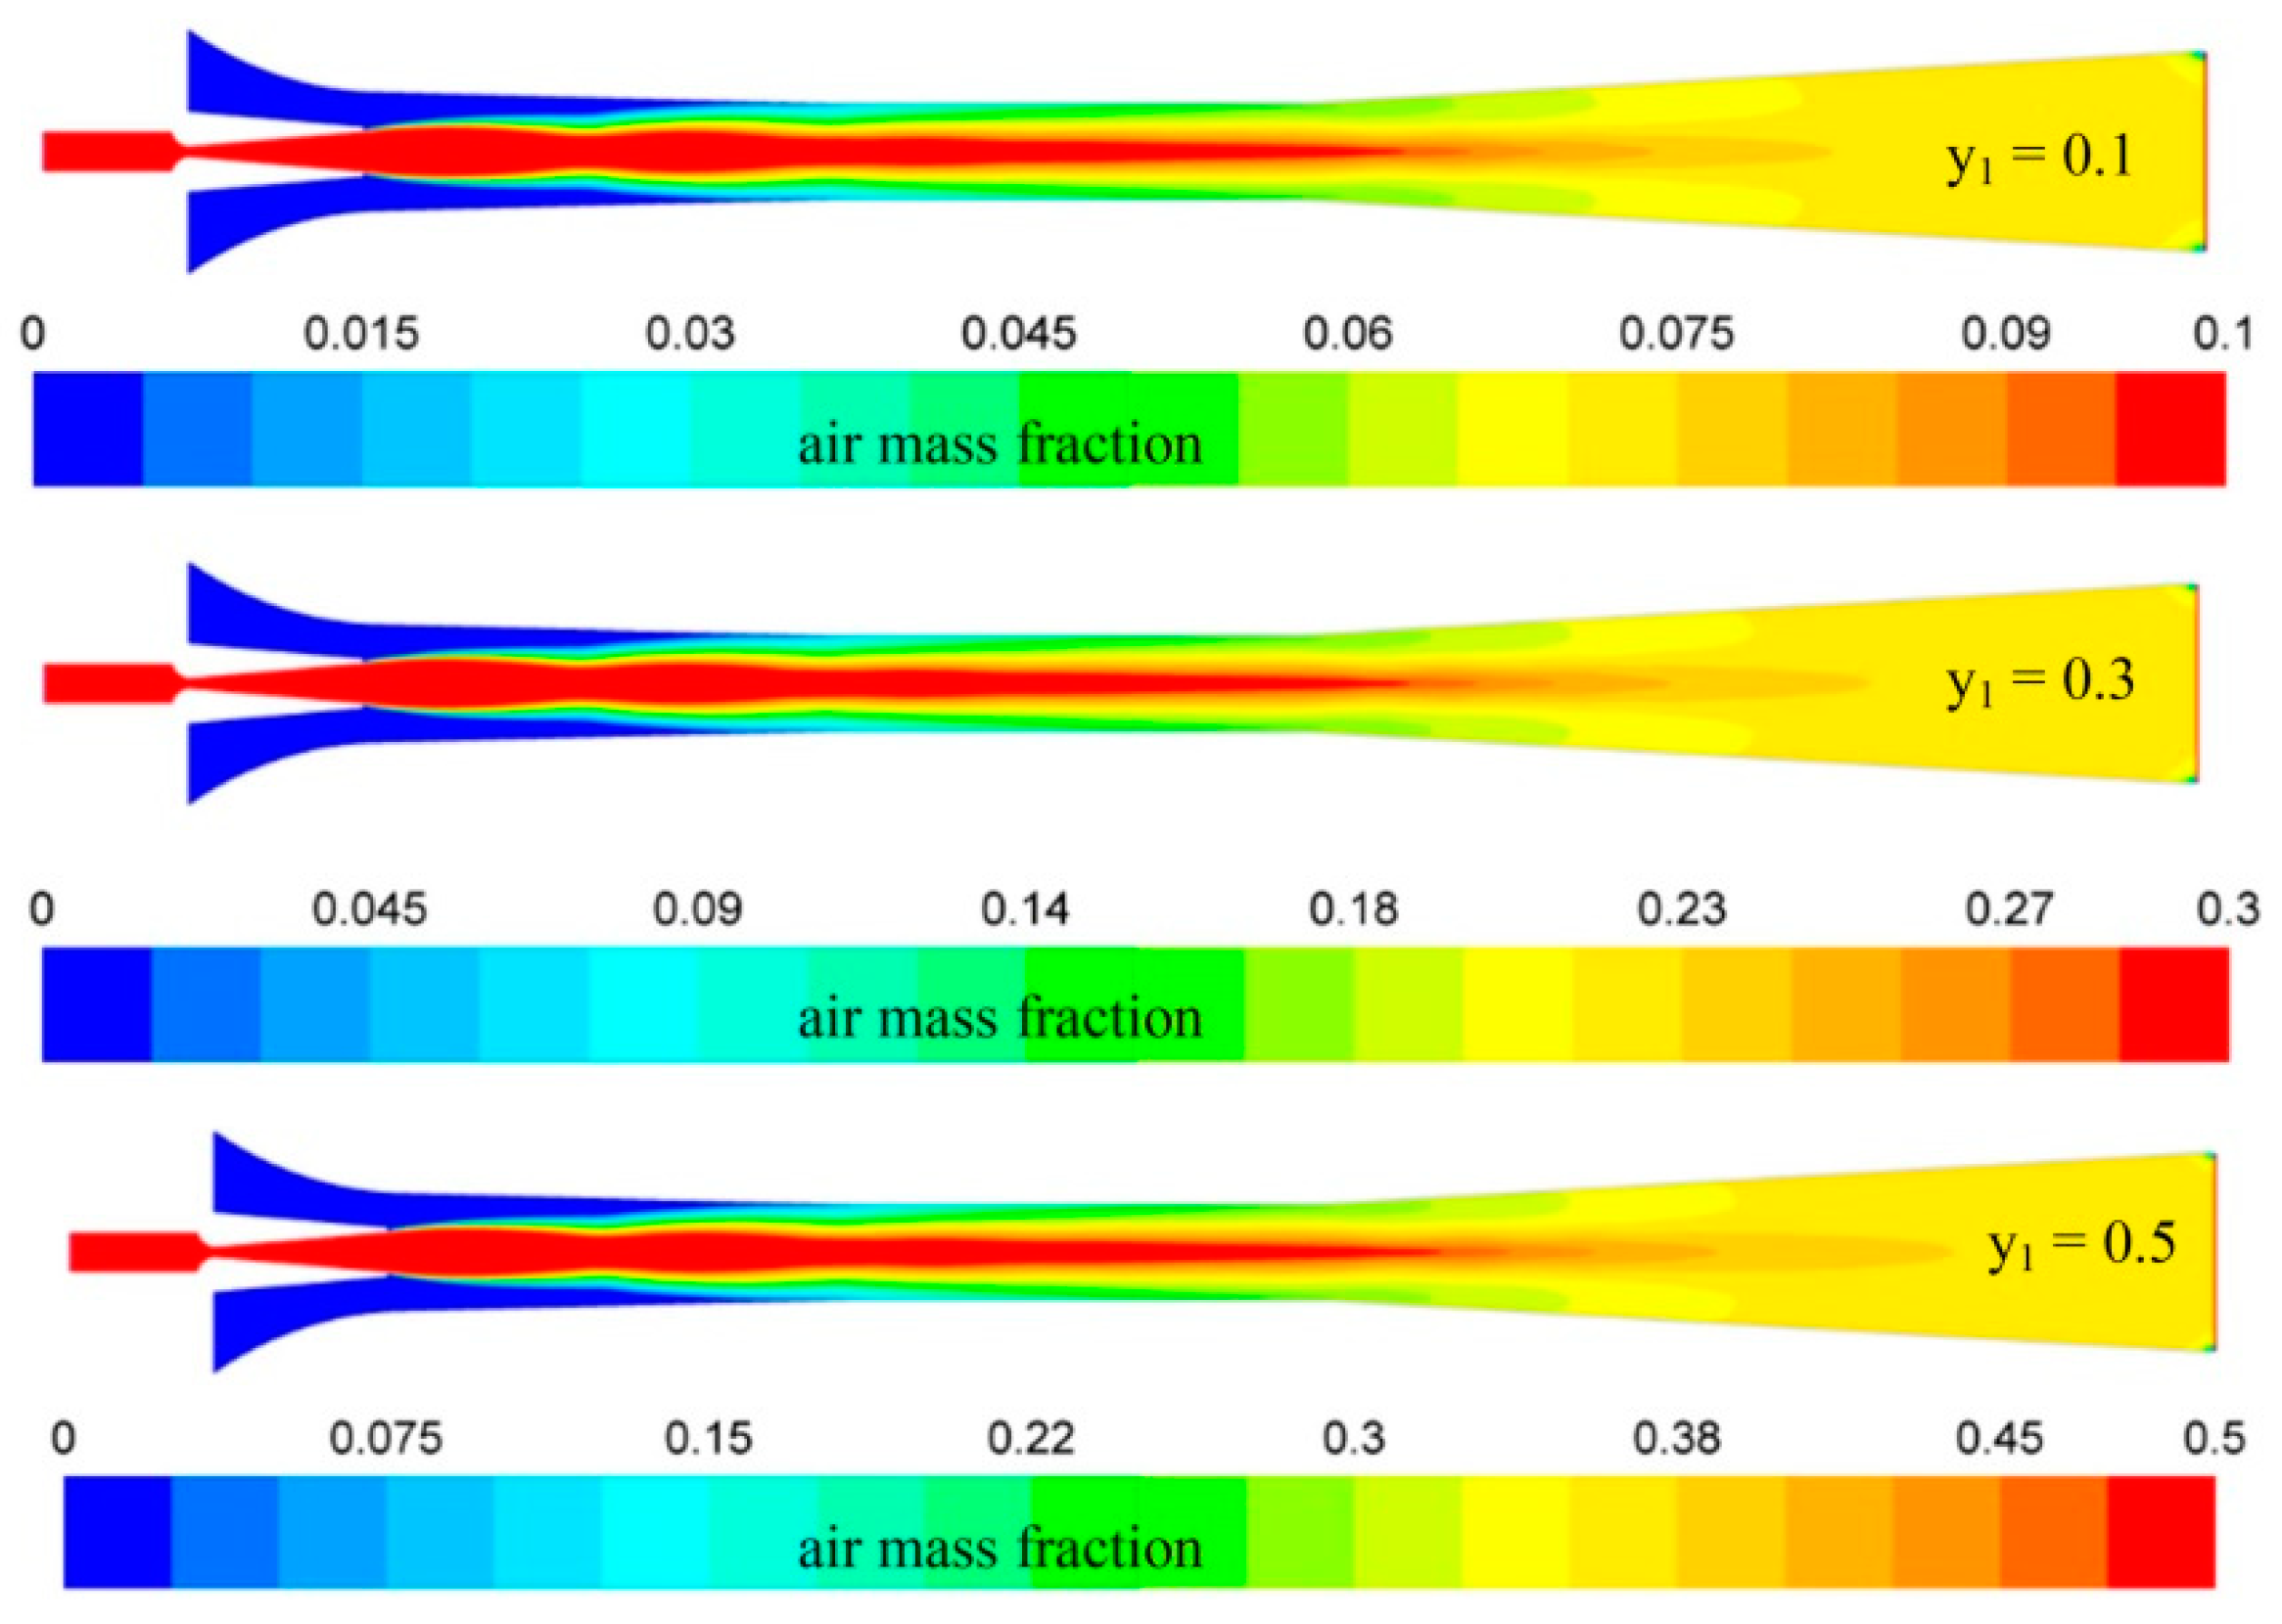
4.1.3. Distribution of the Species Component with Air Leaking into the Primary Fluid

The species component distribution of the ejector at different air mass fractions is depicted in Figure 10. The red region represents the primary fluid, composed of steam and air, and the blue region is the secondary fluid of pure steam. The two green strips between the blue and red regions form the mixing zone of the two fluids. The air mass fraction of the mixing zone increased along the axis of the ejector. A shock train pattern of the primary fluid emerged along the ejector axis and subsequently decomposed until it disappeared into the surrounding fluid in the diffuser. Eventually, a fully mixed zone with the same air mass fraction was formed at the rear of the diffuser. We found the commonality of these component distribution diagrams: the air mass fraction of the mixing zone gradually increased along the ejector axis. A comparison of Figure 9 and Figure 10 revealed that air significantly reduces the velocity of the mixing zone compared to no air in the diffuser. This further confirms that air leaking into the primary fluid decreases the momentum of the mixing zone to resist the back pressure. Therefore, air leaking into the primary fluid impairs the ability of the ejector to resist the backpressure.

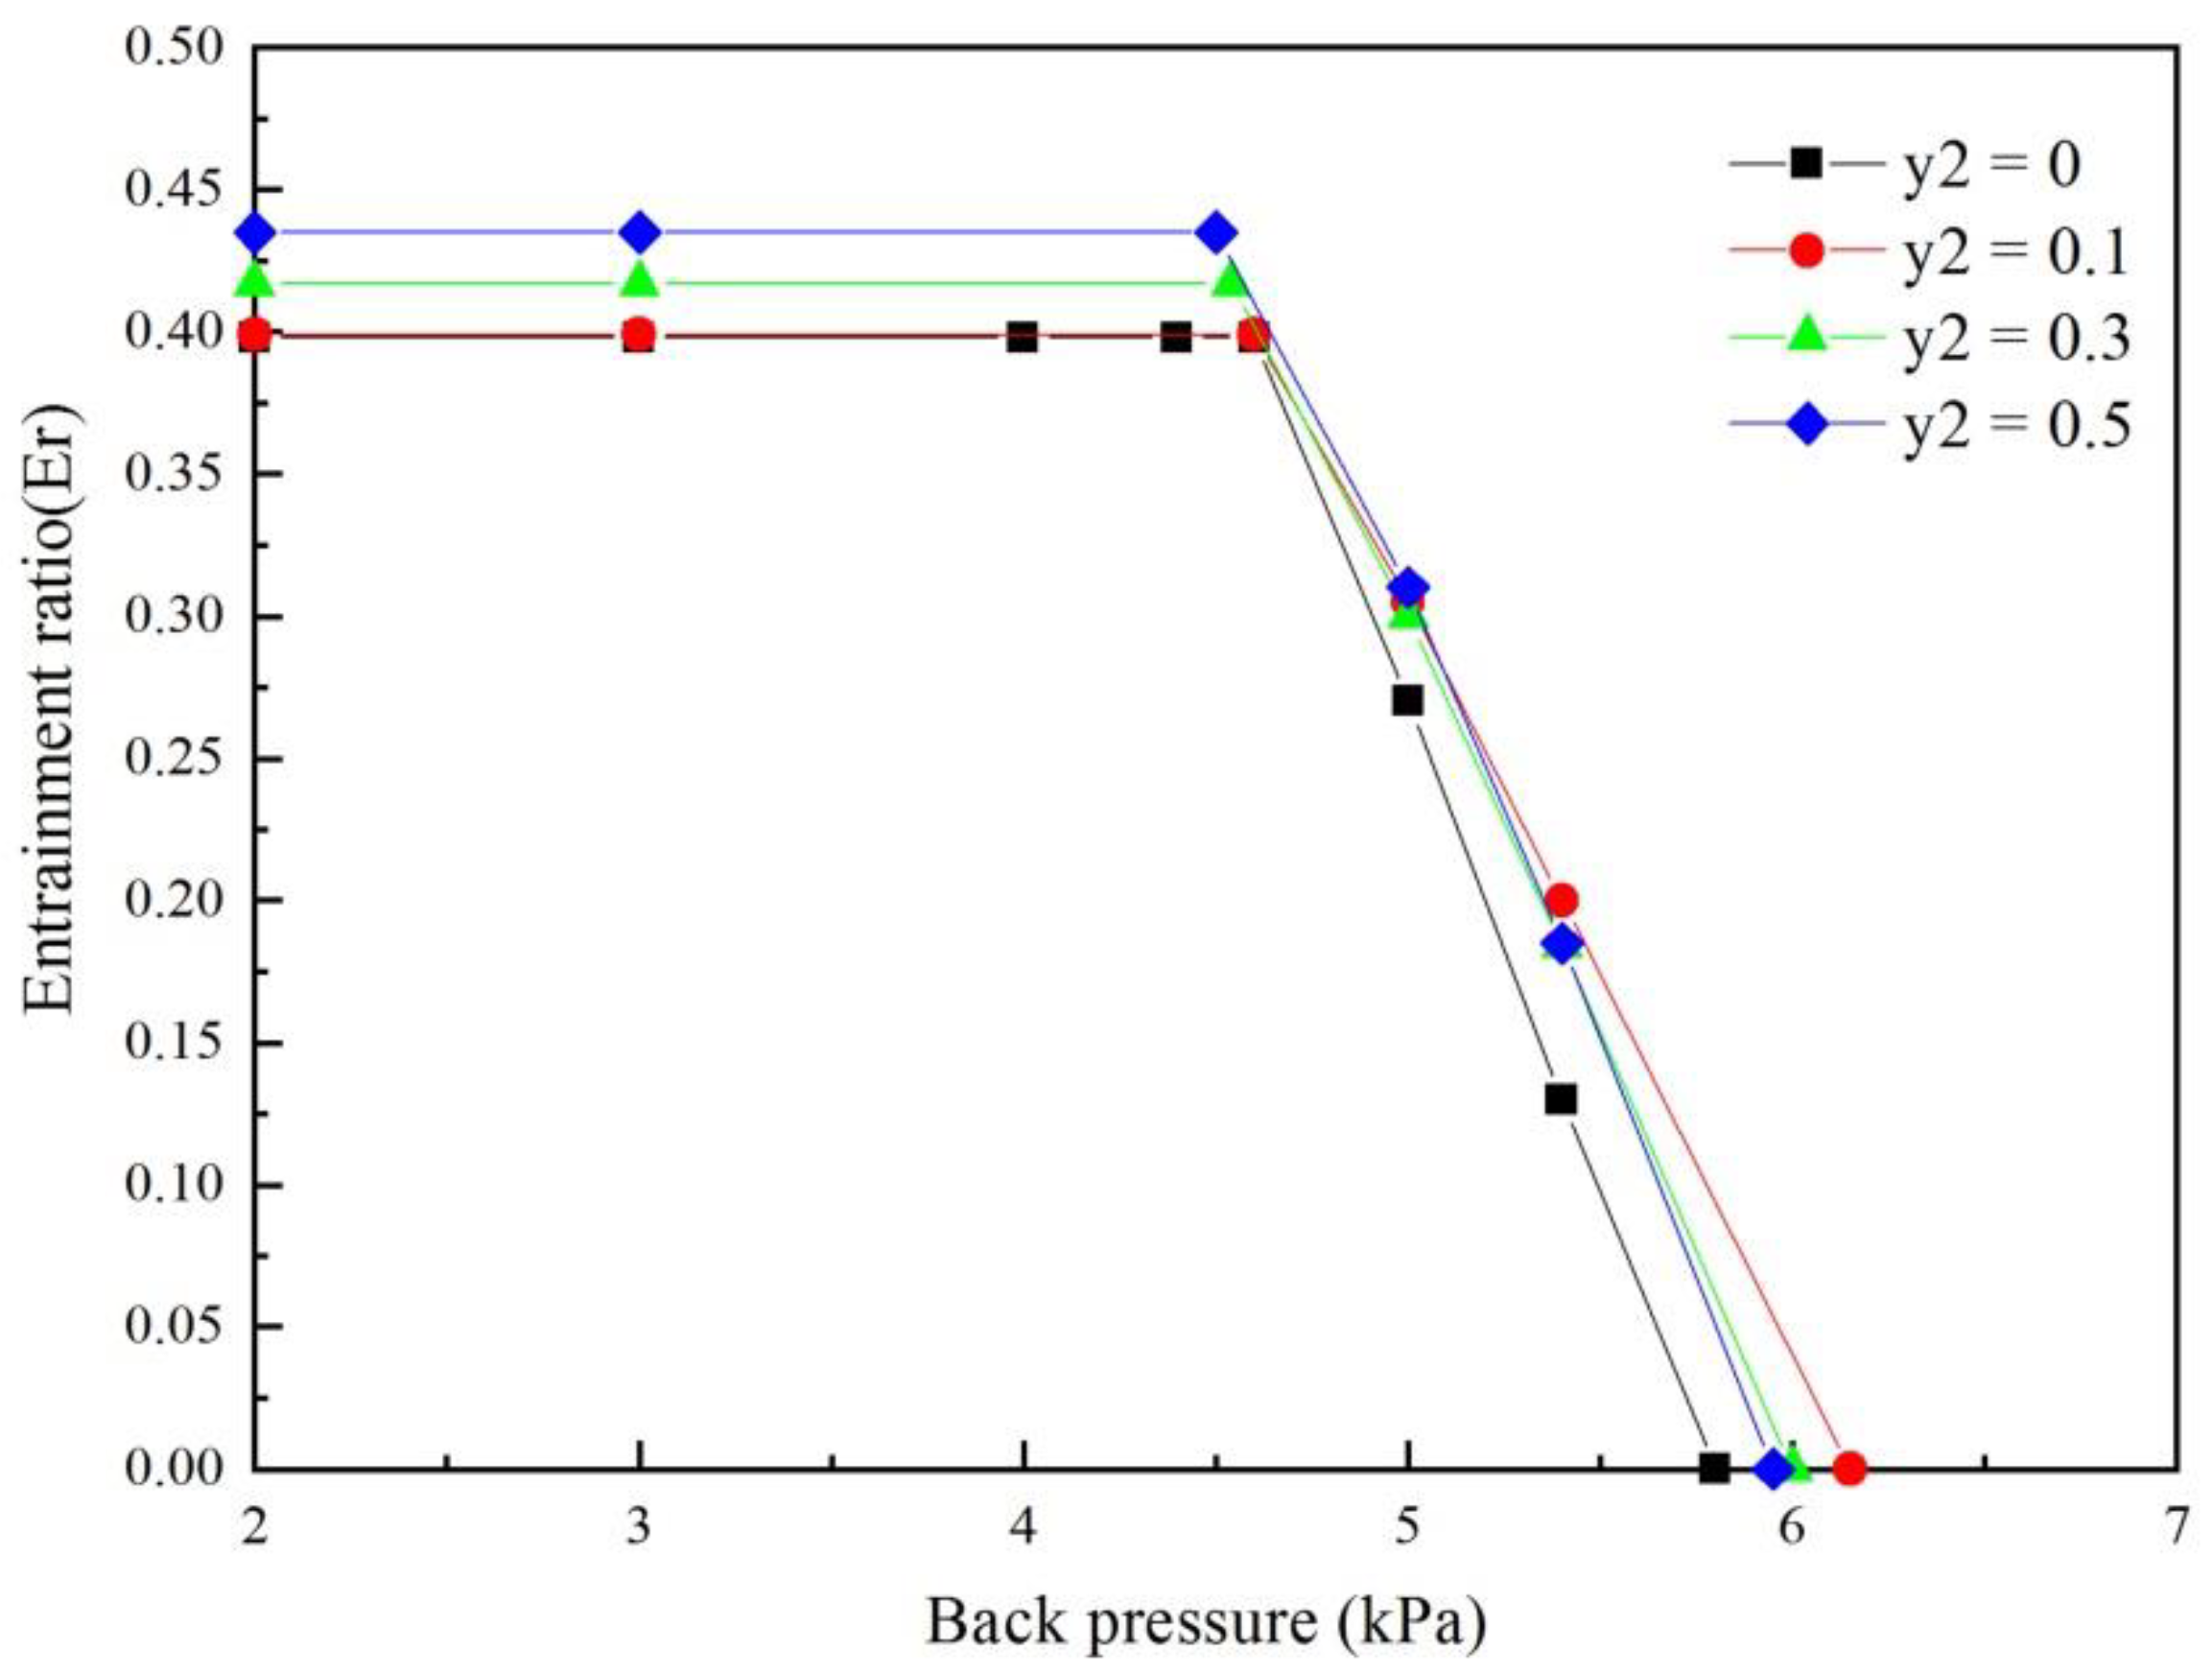
4.2. The Effect of the Air Leaked into the Secondary Fluid on the Ejector Performance

The performance curves under air mass fractions of 0, 0.1, 0.3, and 0.5 were generated, as shown in Figure 11. The entrainment ratio showed a dependency growth in air mass fraction with the increase in Y2. When the air mass fraction was 0.5, the entrainment rate increased to 0.435. However, the critical backpressure under the air that leaked into the secondary fluid was not higher than that under no air. In this section, we will discuss the effects of air leaking into the secondary fluid on the ejector performance from two aspects: working fluid physical parameters and the internal flow structure of the ejector.

4.2.1. The Effect of Air Leaking into the Secondary Fluid on the Working Fluid Physical Parameters

Table 6 illustrates that the velocity and sound speed of the secondary fluid at the initial mixing position decreased as Y2 increased from 0.1 to 0.5, but the density increased; all the physical parameters of the primary fluid maintained their original values. The larger the value of Y2 was, the greater the degree of parameter reduction for the secondary fluid. As discussed in Section 4.1, the changes in the working fluid physical parameters play a critical role in altering both the mass flux of the secondary fluid and the inner flow structure of the ejector. As shown in Figure 12, the secondary fluid mass flux increased in the mixing chamber inlet as Y2 increased from 0 to 0.5. In contrast, the mass flux of the primary fluid was identical at the four air mass fractions because of unchanged physical parameters in the initial mixing position (see Table 6). As a result, the entrainment ratio of the ejector was increased as Y2 increase.

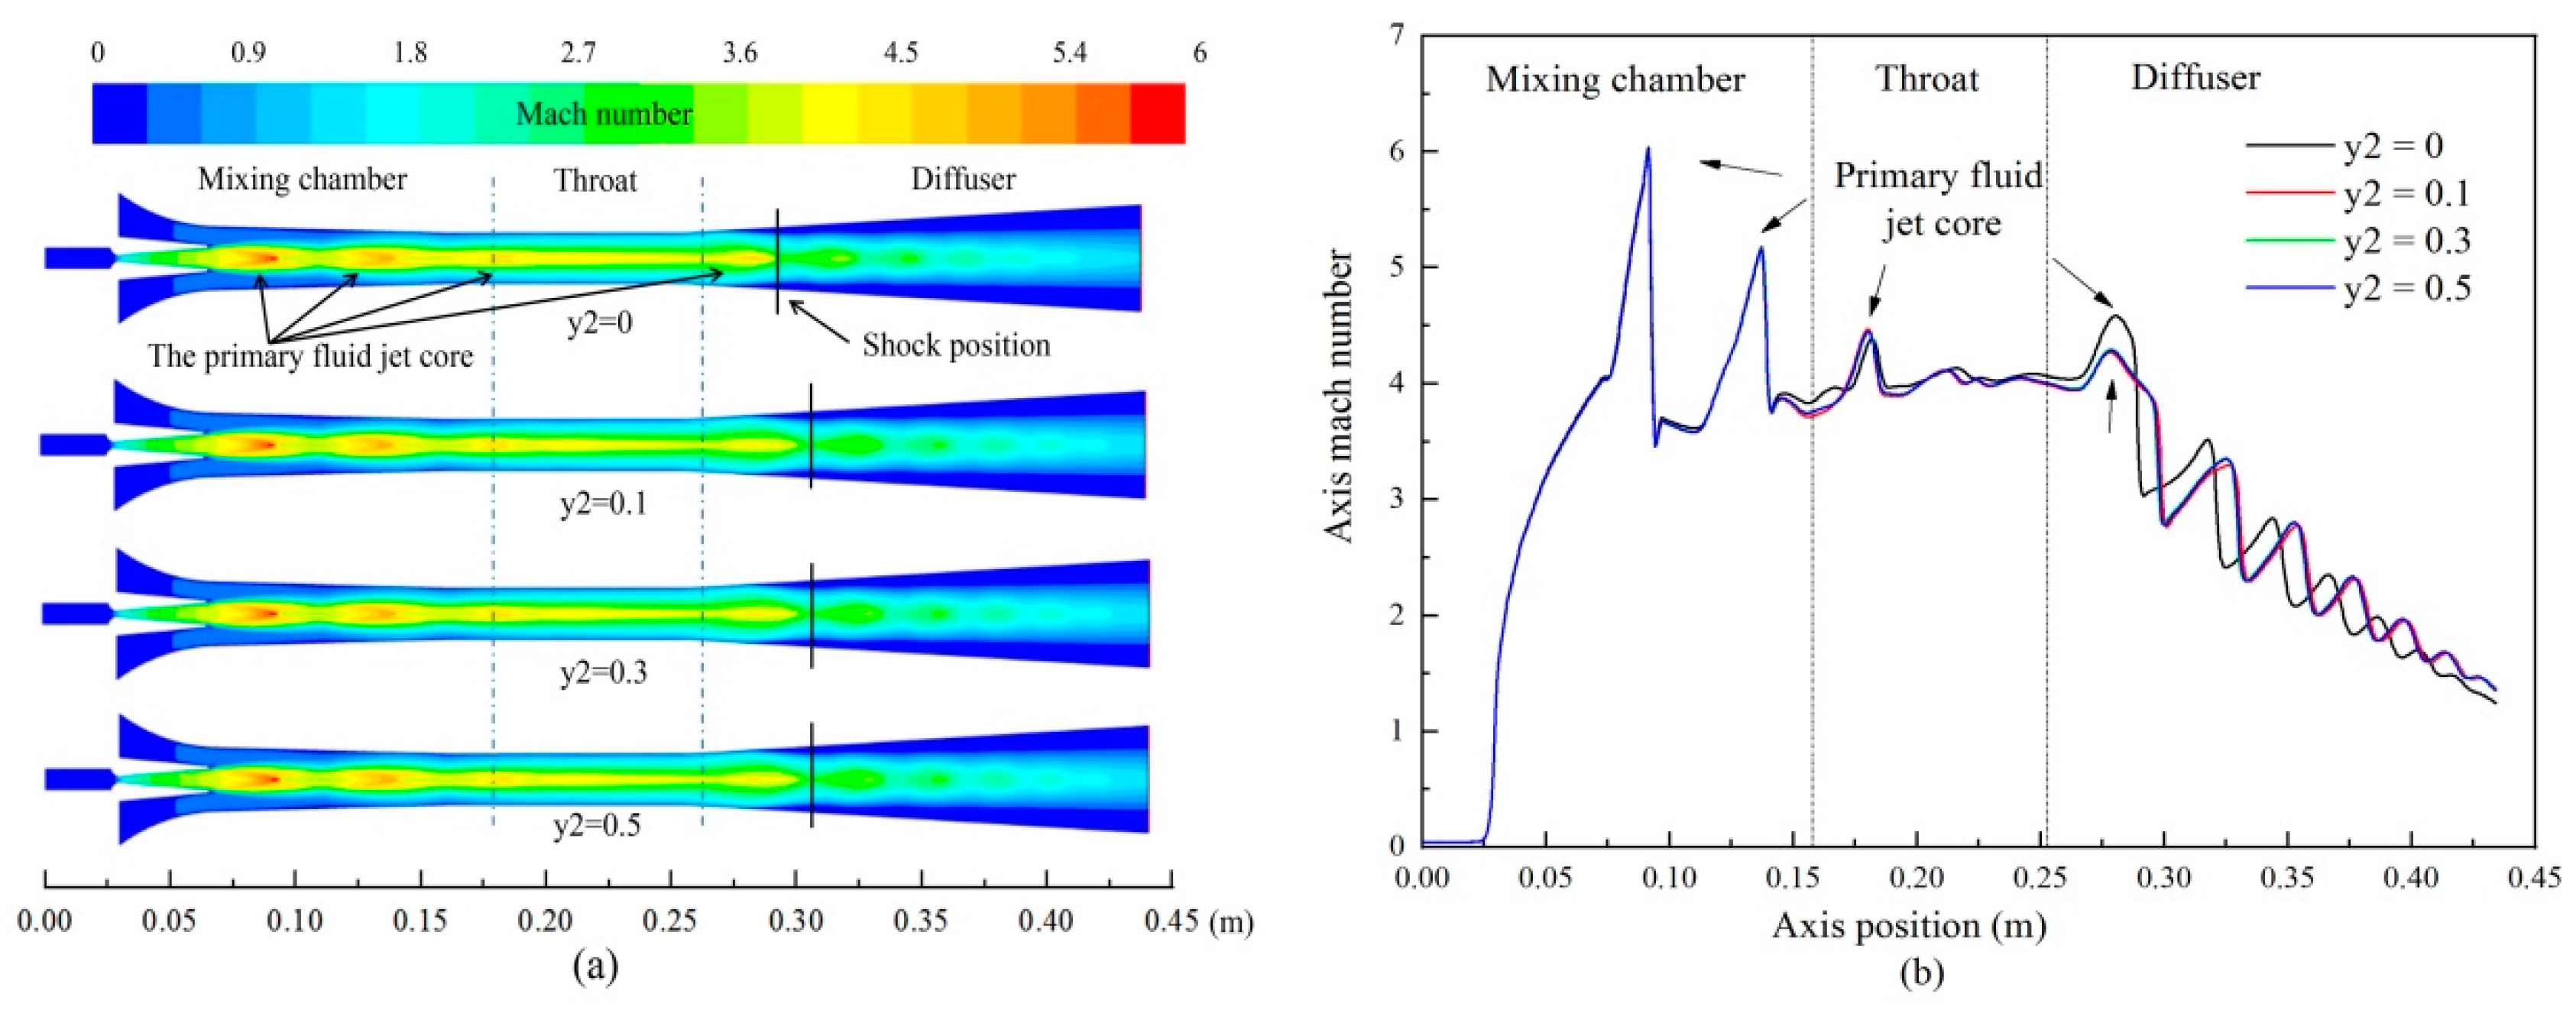
4.2.2. The Effect of Air Leaking into the Secondary Fluid on the Internal Flow Structure

There were no significant differences in the mixing chamber and the throat (Figure 13a), which indicated that air leaking into the secondary fluid does not change the shock structure and the size of the primary fluid jet core in these two parts. In the diffuser, the shock position with the air leaking into the secondary fluid was farther downstream than that without air. Nevertheless, being located downstream of the shock position does not always mean that the ability to resist back pressure had improved. In the diffuser, we compared the Mach number of the primary fluid jet core at different air mass fractions with that without air, and found that the jet core Mach number with air leaking into the secondary fluid is smaller than that without air, and the axis Mach number is also stretched, as shown in Figure 13b.

4.2.3. Distribution of the Species Component with Air Leaking into the Secondary Fluid

Figure 14 illustrates the species component distribution inside the ejector with air leaking into the secondary fluid. The red region with the large air mass fraction is the secondary fluid in the mixing chamber inlet. The blue region with a tiny air mass fraction is the shock train of the primary fluid and was distributed along the ejector axis and disappeared in the diffuser. The green region in the mixing chamber and throat is the mixing zone of the primary and secondary fluids, and it was also considered the mixing layer of the two fluids. In addition, the air mass fraction in the mixing layer gradually decreased along the ejector axis. Meanwhile, a fully mixing zone with the same air mass fraction was formed near the outlet of the ejector.
As discussed in Section 4.1.2, the larger the Mach number of the primary fluid jet core in the diffuser is, the further downstream the shock position formed by this jet core. However, this conclusion is contradicted by the result of Figure 13; in the diffuser, we clearly observed that the shock position of the primary fluid jet core at Y2 = 0 was further upstream in the diffuser than at other Y2 values (see Figure 13a), but its Mach number was smaller than others, as illustrated in Figure 13b. This phenomenon could be attributed to two points: The air in the secondary fluid would downgrade the energy required to entrain the secondary fluid, while the kinetic energy of the primary fluid flowing from the nozzle remained the same; and the air in the secondary fluid enhanced the mixing effect (this conclusion is confirmed in Section 4.3) As shown in Figure 14, the most intense mixing effect usually occurred in the full mixing zone in the diffuser; the more intense the mixing effect, the more kinetic energy of the primary fluid to transform into the mixing energy. Based on the analysis of the above two points, the Mach number of the primary fluid jet core with air leaking into the secondary fluid was smaller than that without air in the diffuser. In addition, the shock position farther downstream could also be attributed to the intense mixing effect in the diffuser. The detailed structure and effect of the mixing layer and the relationship between the mixing layer effect and the entrainment ratio is discussed in Section 4.3.

4.3. The Mixing Layer Effect with Air Leaking into the Working Fluid

Ariafar et al. [38] first investigated the mixing layer effect between primary and the secondary fluids using the CFD method and pointed out that the mixing layer strongly influences the entrainment ratio.
The mixing layer forming process under the operating conditions of test 2 (see Table 3) is shown in Figure 15 (adapted from [38]). The primary fluid with a larger velocity meets the secondary fluid with a smaller velocity at the nozzle outlet. This forms a mixing layer with varying thickness δ. The difference in velocity between the primary and secondary fluids leads to a change in the mixing layer thickness. The mixing layer growth rate δ , defined as d δ / d x , is an important parameter that indicates that the larger the mixing layer growth rate, the more secondary fluid is drawn into the mixing layer. Therefore, the entrainment ratio also varies with the change in the mixing layer growth rate.
Many scholarly studies have investigated the mixing layer effect and summarized some empirical correlations for the mixing layer growth rate. The following formulas can calculate the mixing layer growth rate. The growth rate of an incompressible mixing layer, δ 0 , can be calculated by this correlation proposed by Dimotayis [39]:
δ 0 = C δ ( 1 ϕ ) ( 1 + Ω 1 / 2 ) 2 ( 1 + Ω 1 / 2 ϕ ) { 1 ( 1 Ω 1 / 2 ) / ( 1 + Ω 1 / 2 ) 1 + 2.9 ( 1 + ϕ ) / ( 1 ϕ ) }
where the Ω = ρ 2 / ρ 1 , and ϕ = u 2 / u 1 and C δ = 0.35 is a constant.
As we adopted the ideal gas model in this study, we could not ignore the effect of turbulent compressibility on the mixing shear layer. The following expression suggested by Slessor et al. [40] can calculate the growth rate of a compressible mixing layer:
δ = ( 1 + α 0 Π c 2 ) β 0 δ 0
where α 0 = 4 and β 0 = 0.5 are approximate values.
Π c = max [ γ i 1 a i ] Δ u
is a parameter of correlating the compressibility effect. γ is the ratio of specific heats (γ = 1.3 in this study), a is the sound speed in the working fluid, and i is either side of the primary or secondary fluid. Once mixed into the primary or secondary fluid, the air with different mass fractions changed the density, velocity, and sound speed of both fluids, as indicated in Table 4 and Table 5, leading to a change in the mixing layer growth rate.
Based on the physical parameters of the primary and secondary fluids in Table 4 and Table 5, the mixing layer growth rate is calculated by the above formulas and listed in Table 7. The results showed a positive correlation between the mixing layer growth rate and the entrainment rate. The mixing layer growth rate and entrainment ratio gradually reduced as of Y1 increased, while they increased as Y2 increased. The air leaking into the primary fluid inhibited the mixing effect between the primary and secondary fluids; the larger the air mass fraction in the primary fluid was, the lower the mixing layer growth rate and the entrainment ratio were. However, the opposite results were obtained when air with a larger mass fraction leaked into the secondary fluid. The above findings confirmed by the mixing layer effect were consistent with those acquired by the mass flux. The coefficient distortion (Cd) rate was regarded as the degree of deviation for the measured data from their standard value. The Cd rate of Er values listed in Table 6 indicate that Y1 has a more significant effect on the entrainment ratio than Y2 at the same air mass fraction.

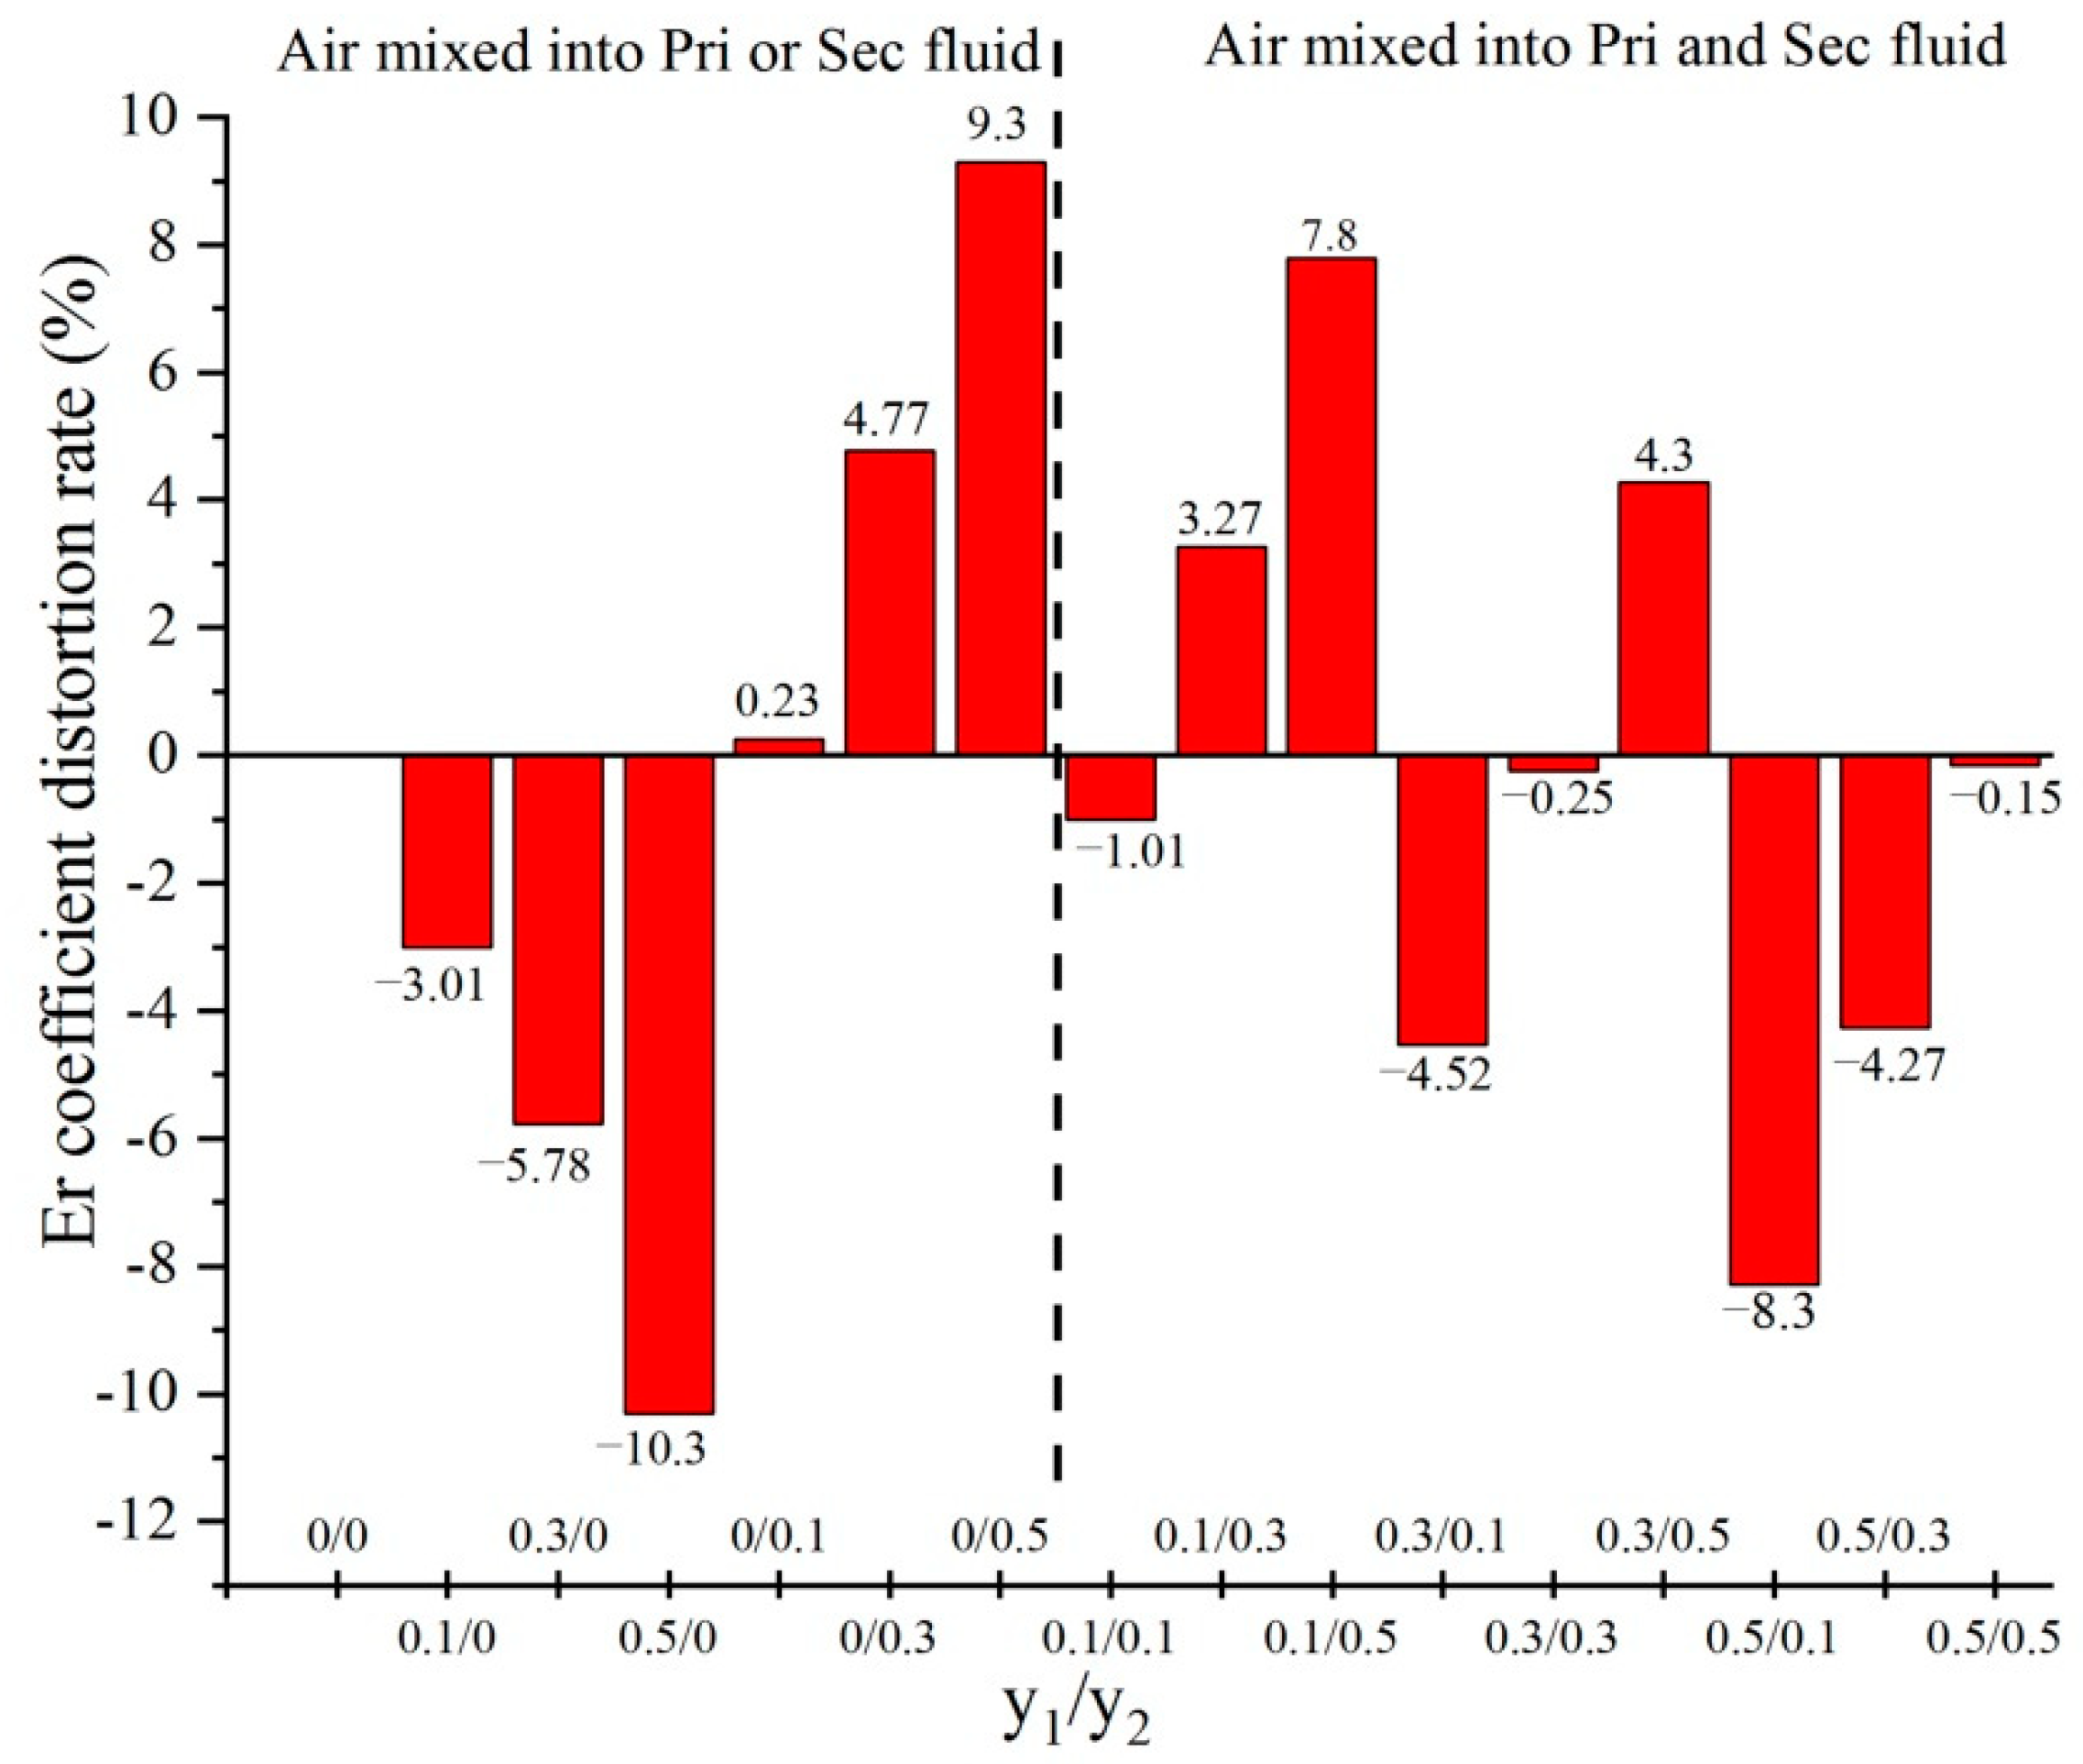
4.4. The Calculation of the Coefficient Distortion Rate for the Entrainment Ratio

Figure 16 demonstrates the Cd rate for 16 cases: the Cd rate with air leaking into the primary or secondary fluid is shown on the left half, and that with air leaking into the primary and secondary fluids simultaneously is shown on the right. The abscissa represents the case type of the air mass fraction and is marked as Y1/Y2. The drawing in the left half of Figure 16 was based on the results in Table 6; the right was obtained by numerically calculating the case that the air was leaked into the primary and secondary fluids simultaneously.
By observing the left half of Figure 16, we found that Y1 generates a negative Cd rate, while Y2 generates a positive Cd rate. The coefficient distortion degree increased with an increase in the air mass fraction. Using this numerical simulation result of Figure 16 and performing reverse reasoning, we predicted whether the air leaked into the steam ejector ERS, into which fluid the air leaked, and the size of the leaked air mass fraction. For example, given a steam ejector ERS working in the critical mode, only observing the experimentally measured Er value, the air leaked into the primary fluid when Er was higher than its standard experimental value. When Er was lower than its standard experiment value, the air leaked into the secondary fluid. Calculating the coefficient of distortion of the experimentally measured Er showed that the larger degree of the coefficient of distortion, the larger the amount of air leaked into the working fluid.
When the air leaked into the primary and secondary fluids simultaneously, the Cd rate was negative when Y1 was larger than Y2. If the Er was less than its standard experimental value, the mass fraction of the air in the primary fluid was larger than that in the secondary fluid. Furthermore, the negative Cd rate also implied that the air mass fraction in the primary fluid was equal to that in the secondary fluid only in the case of a small distortion degree, as shown in the right half of Figure 16. If Er was higher than its standard experimental value, the amount of air leaking into the primary fluid was less than that leaking into the secondary fluid.
In summary, a positive Er coefficient of distortion rate shows that, the air merely leaks into the secondary fluid or the air mass fraction in the secondary fluid is larger than that in the primary fluid. A negative Er coefficient of distortion rate show that the air only leaks into the primary fluid or the air mass fraction in the secondary fluid is less than in the primary fluid. Particularly noteworthy is that fact that a negative Er coefficient of distortion rate with a small degree indicates that the air mass fraction is identical in both primary and secondary fluids. Of course, these conclusions were only drawn under the assumption that air leaked into the steam ejector refrigeration experimental system.

5. Conclusions

In this paper, the effect of air leaking into the working fluid on the steam ejector performance was investigated using numerical simulations. The effects of air on the internal flow structure and working fluid physical parameters was studied. The cause of the change in the steam ejector performance was also analyzed. Furthermore, the species component distribution of air and steam was drawn. The conclusions are summarized as follows:
  • The air leaking into the primary fluid (Y1) increases the entrainment ratio but decreases the critical back pressure. On the contrary, the entrainment ratio reduces due to air leaking into the secondary fluid (Y2). Moreover, Y1 has a more significant effect on the entrainment ratio than Y2 at the same air mass fraction.
  • By calculating the mass flux and mixing layer growth rate, we found that the main reason for the entrainment ratio variation is a change in the working fluid physical parameters caused by the leaked air.
  • In experimental operations or industrial production, the air mass fraction leaking into the working fluid must be minimized to obtain a real entrainment ratio of the steam ejector.
  • Where possible, using a mixture of the steam and air as the secondary fluid could be an effective way to improve the steam ejector performance.
  • By comparing the experimentally measured Er with its standard experimental value and calculating the Er coefficient of distortion rate, we determined whether air leaked into the steam ejector refrigeration experimental system, into which fluid the air leaked, and the amount of leaked air.
In this study, the perfect gas model was adopted, and the steam phase change inside the nozzle was neglected. Therefore, future research should focus on the effect of air leaking into the working fluid on the ejector performance in the two-phase flow state.

Author Contributions

Conceptualization, H.L. and X.W.; methodology, H.L. and J.N.; software, H.L.; validation, J.N., P.Z. and H.H.; formal analysis, H.L. and H.H.; investigation, J.N.; resources, X.W.; data curation, H.L. and P.Z.; writing—original draft preparation, H.L.; writing—review and editing, J.N. and H.H.; visualization, H.H.; supervision, X.W.; project administration, X.W.; funding acquisition, X.W. All authors have read and agreed to the published version of the manuscript.

Funding

This research was funded by the National Natural Science Foundation of China, (grant no. 51775098).

Institutional Review Board Statement

Not applicable.

Informed Consent Statement

Not applicable.

Data Availability Statement

Not applicable.

Conflicts of Interest

The authors declare no conflict of interest.

References

  1. Sriveerakul, T.; Aphornratana, S.; Chunnanond, K. Performance prediction of steam ejector using computational fluid dynamics: Part 1. Validation of the CFD results. Int. J. Therm. Sci. 2007, 46, 812–822. [Google Scholar] [CrossRef]
  2. Munday, J.T.; Bagster, D.F. A new ejector theory applied to steam jet refrigeration. Ind. Eng. Chem. Process Des. Dev. 1977, 16, 442–449. [Google Scholar] [CrossRef]
  3. Huang, B.J.; Chang, J.M.; Wang, C.P.; Petrenko, V.A. A 1-D analysis of ejector performance. Int. J. Refrig. 1999, 22, 354–364. [Google Scholar] [CrossRef]
  4. Zhu, Y.H.; Cai, W.J.; Wen, C.Y.; Li, Y.Z. Shock circle model for ejector performance evaluation. Energy Convers. Manag. 2007, 48, 2533–2541. [Google Scholar] [CrossRef]
  5. Bonanos, A.M. Physical modeling of thermo-compressor for desalination applications. Desalination 2017, 412, 13–19. [Google Scholar] [CrossRef]
  6. Chunnanond, K.; Aphornratana, S. An experimental investigation of a steam ejector refrigerator: The analysis of the pressure profile along the ejector. Appl. Therm. Eng. 2004, 24, 311–322. [Google Scholar] [CrossRef]
  7. Ruangtrakoon, N.; Aphornratana, S.; Sriveerakul, T. Experimental studies of a steam jet refrigeration cycle: Effect of the primary nozzle geometries to system performance. Exp. Therm. Fluid Sci. 2011, 35, 676–683. [Google Scholar] [CrossRef]
  8. Varga, S.; Oliveira, A.C.; Ma, X.L.; Omer, S.A.; Zhang, W.; Riffat, S.B. Experimental and numerical analysis of a variable area ratio steam ejector. Int. J. Refrig. 2011, 34, 1668–1675. [Google Scholar] [CrossRef]
  9. Ji, M.; Utomo, T.; Woo, J.; Lee, Y.; Jeong, H.; Chung, H. CFD investigation on the flow structure inside thermo vapor compressor. Energy 2010, 35, 2694–2702. [Google Scholar] [CrossRef]
  10. Wu, H.Q.; Liu, Z.L.; Han, B.; Li, Y.X. Numerical investigation of the influences of mixing chamber geometries on steam ejector performance. Desalination 2014, 353, 15–20. [Google Scholar] [CrossRef]
  11. Wang, X.D.; Dong, J.L.; Zhang, G.L.; Fu, Q.; Li, H.; Han, Y.; Tu, J.Y. The primary pseudo-shock pattern of steam ejector and its influence on pumping efficiency based on CFD approach. Energy 2019, 167, 224–234. [Google Scholar] [CrossRef]
  12. Zhu, Y.H.; Cai, W.J.; Wen, C.Y.; Li, Y.Z. Numerical investigation of geometry parameters for design of high performance ejectors. Appl. Therm. Eng. 2009, 29, 898–905. [Google Scholar] [CrossRef]
  13. Varga, S.; Oliveira, A.C.; Diaconu, B. Influence of geometrical factors on steam ejector performance—A numerical assessment. Int. J. Refrig. 2009, 32, 1694–1701. [Google Scholar] [CrossRef]
  14. Zhang, K.; Zhu, X.J.; Ren, X.T.; Qiu, Q.G.; Shen, S.Q. Numerical investigation on the effect of nozzle position for design of high performance ejector. Appl. Therm. Eng. 2017, 126, 594–601. [Google Scholar] [CrossRef]
  15. Ramesh, A.S.; Sekhar, S.J. Experimental and numerical investigations on the effect of suction chamber angle and nozzle exit position of a steam-jet ejector. Energy 2018, 164, 1097–1113. [Google Scholar] [CrossRef]
  16. Chen, W.X.; Chen, H.Q.; Shi, C.Y.; Xue, K.K.; Chong, D.T.; Yan, J.J. A novel ejector with a bypass to enhance the performance. Appl. Therm. Eng. 2016, 93, 939–946. [Google Scholar] [CrossRef]
  17. Wang, C.; Wang, L.; Wang, X.L.; Zhao, H.X. Design and numerical investigation of an adaptive nozzle exit position ejector in multi-effect distillation desalination system. Energy 2017, 140, 673–681. [Google Scholar] [CrossRef]
  18. Kouhikamali, R.; Sanaei, M.; Mehdizadeh, M. Process investigation of different locations of thermo-compressor suction in MED-TVC plants. Desalination 2011, 280, 134–138. [Google Scholar] [CrossRef]
  19. Wang, X.D.; Lei, H.J.; Dong, J.L.; Tu, J.Y. The spontaneously condensing phenomena in a steam-jet pump and its influence on the numerical simulation accuracy. Int. J. Heat Mass Transf. 2012, 55, 4682–4687. [Google Scholar] [CrossRef]
  20. Sharifi, N.; Boroomand, M.; Sharifi, M. Numerical assessment of steam nucleation on thermodynamic performance of steam ejectors. Appl. Therm. Eng. 2013, 52, 449–459. [Google Scholar] [CrossRef]
  21. Ariafar, K.; Buttsworth, D.; Al-Doori, G.; Malpress, R. Effect of mixing on the performance of wet steam ejectors. Energy 2015, 93, 2030–2041. [Google Scholar] [CrossRef]
  22. Mazzelli, F.; Giacomelli, F.; Milazzo, A. CFD modeling of condensing steam ejectors: Comparison with an experimental test-case. Int. J. Therm. Sci. 2018, 127, 7–18. [Google Scholar] [CrossRef]
  23. Abadi, S.M.A.N.R.; Kouhikamali, R.; Atashkari, K. Non-equilibrium condensation of wet steam flow within high-pressure thermo-compressor. Appl. Therm. Eng. 2015, 81, 74–82. [Google Scholar] [CrossRef]
  24. Wroblewski, W.; Dykas, S. Two-fluid model with droplet size distribution for condensing steam flows. Energy 2016, 106, 112–120. [Google Scholar] [CrossRef]
  25. Senthil Kumar, R.; Kumaraswamy, S.; Mani, A. Experimental investigations on a two-phase jet pump used in desalination systems. Desalination 2007, 204, 437–447. [Google Scholar] [CrossRef]
  26. Yuan, G.; Zhang, L.; Zhang, H.; Wang, Z. Numerical and experimental investigation of performance of the liquid–gas and liquid jet pumps in desalination systems. Desalination 2011, 276, 89–95. [Google Scholar] [CrossRef]
  27. Faghih Aliabadi, M.A.; Bahiraei, M. Effect of water nano-droplet injection on steam ejector performance based on non-equilibrium spontaneous condensation: A droplet number study. Appl. Therm. Eng. 2021, 184, 116236. [Google Scholar] [CrossRef]
  28. Chen, W.; Huang, C.; Bai, Y.; Chong, D.; Yan, J.; Liu, J. Experimental and numerical investigation of two phase ejector performance with the water injected into the induced flow. Int. J. Adv. Nucl. React. Des. Technol. 2020, 2, 15–24. [Google Scholar] [CrossRef]
  29. Aphornratana, S. Theoretical and Experimental Investigation of a Combine Ejector-Absorption Refrigerator. Ph.D. Thesis, University of Sheffield, Sheffield, UK, 1994. [Google Scholar]
  30. Valle del, J.G.; Jabardo, J.M.S.; Ruiz, F.C.; Alonso, J.S.J. A one dimensional model for the determination of an ejector entrainment ratio. Int. J. Refrig. 2012, 35, 772–784. [Google Scholar] [CrossRef]
  31. Besagni, G.; Mereu, R.; Chiesa, P.; Inzoli, F. An Integrated Lumped Parameter-CFD approach for off-design ejector performance evaluation. Energy Convers. Manag. 2015, 105, 697–715. [Google Scholar] [CrossRef]
  32. Besagni, G.; Inzoli, F. Computational fluid-dynamics modeling of supersonic ejectors: Screening of turbulence modeling approaches. Appl. Therm. Eng. 2017, 117, 122–144. [Google Scholar] [CrossRef]
  33. Han, Y.; Wang, X.D.; Sun, H.; Zhang, G.L.; Guo, L.X.; Tu, J.Y. CFD simulation on the boundary layer separation in the steam ejector and its influence on the pumping performance. Energy 2019, 167, 469–483. [Google Scholar] [CrossRef]
  34. Mazzelli, F.; Little, A.B.; Garimella, S.; Bartosiewicz, Y. Computational and experimental analysis of supersonic air ejector: Turbulence modeling and assessment of 3D effects. Int. J. Heat Fluid Flow 2015, 56, 305–316. [Google Scholar] [CrossRef]
  35. Croquer, S.; Poncet, S.; Aidoun, Z. Turbulence modeling of a single-phase R134a supersonic ejector. Part 1: Numerical benchmark. Int. J. Refrig. 2016, 61, 140–152. [Google Scholar] [CrossRef]
  36. Varga, S.; Soares, J.; Lima, R.; Oliveira, A.C. On the selection of a turbulence model for the simulation of steam ejectors using CFD. Int. J. Low-Carbon Technol. 2017, 12, 233–243. [Google Scholar] [CrossRef]
  37. Ansys, I. Ansys-Fluent 15.0 User’s Guide; ANSYS, Inc.: Canonsburg, PA, USA, 2013. [Google Scholar]
  38. Ariafar, K.; Buttsworth, D.; Al-Doori, G.; Sharifi, N. Mixing layer effects on the entrainment ratio in steam ejectors through ideal gas computational simulations. Energy 2016, 95, 380–392. [Google Scholar] [CrossRef]
  39. Dimotakis, P.E. Two-dimensional shear-layer entrainment. AIAA J. 1986, 24, 1791–1796. [Google Scholar] [CrossRef]
  40. Slessor, M.D.; Zhuang, M.; Dimotakis, P.E. Turbulent shear-layer mixing: Growth-rate compressibility scaling. J. Fluid Mech. 2000, 414, 35–45. [Google Scholar] [CrossRef] [Green Version]
Figure 1. Steam ejector structure and internal flow characteristics, adapted from [1].
Applsci 11 06111 g001
Figure 2. Typical performance curve for a steam ejector.
Applsci 11 06111 g002
Figure 3. Comparison of Mach numbers.
Applsci 11 06111 g003
Figure 4. Structural mesh results of the computational domain.
Applsci 11 06111 g004
Figure 5. Comparison of entrainment ratio.
Applsci 11 06111 g005
Figure 6. Distribution of wall static pressure.
Applsci 11 06111 g006
Figure 7. Entrainment ratio of the ejector with different Y1 values.
Applsci 11 06111 g007
Figure 8. Isolines of the secondary flow mass flux with different Y1 values.
Applsci 11 06111 g008
Figure 9. Primary fluid flow state with different Y1 values: (a) shock pattern and (b) Mach number.
Applsci 11 06111 g009
Figure 10. Air mass fraction distribution with different Y1 values.
Applsci 11 06111 g010
Figure 11. The entrainment ratio of the ejector under different values of Y2.
Applsci 11 06111 g011
Figure 12. Isolines of the secondary flow mass flux with different Y2 values.
Applsci 11 06111 g012
Figure 13. Primary fluid flow state with different Y2 values: (a) shock pattern and (b) Mach number.
Applsci 11 06111 g013
Figure 14. Air mass fraction distribution with different Y2 values.
Applsci 11 06111 g014
Figure 15. Velocity vector schematic of mixing layer formation adapted from [38].
Applsci 11 06111 g015
Figure 16. Er coefficient of distortion rate in the different cases.
Applsci 11 06111 g016
Table 1. Geometrical parameters of the steam ejector.
Geometrical ParametersValue (mm)
Diameter of nozzle inlet section7.75
Diameter of nozzle outlet section8
Diameter of nozzle throat2
Nozzle exit position35
Diameter of mixing chamber inlet section24
Diameter of throat19
Length of mixing chamber130
Length of throat95
Length of diffuser180
Table 2. Initial values of steam pressure and temperature.
SteamTemperature (°C)Pressure (kPa)Air Mass Fraction
Primary120/130198/2700/0.1/0.3/0.5
Secondary5/101.20/0.1/0.3/0.5
Discharge-2.0/6.5-
Table 3. Comparison between experimental and CFD data on Er and critical pressure.
TestOperating Condition (kPa)Entrainment RatioError (%)Critical Back Pressure (kPa)Error (%)
Primary/Secondary FluidExperiment/CFDExperiment/CFD
1198/1.200.53/0.545−33.7/3.55.4
2270/1.200.40/0.39815.0/4.68
3270/0.80.31/0.2601.64.8/4.48.3
4270/1.230.53/0.556−55.3/4.97.5
5361/1.230.28/0.283−16.5/5.712.3
Relative error = [Value (Exp) − Value (CFD)]/Value (Exp).
Table 4. Comparisons between [1] and CFD results in this study.
TestOperating Condition (kPa)Entrainment RatioError (%)Critical Back Pressure (kPa)Error (%)
Primary/Secondary FluidRef. [6]/CFDRef. [6]/CFD
1198/1.200.52/0.545−4.83.5/3.50
2270/1.200.39/0.398−24.6/4.60
3270/0.870.27/0.2603.74.5/4.42.2
4270/1.230.54/0.5562.94.6/4.96.5
5361/1.230.29/0.2832.46.0/5.75
Relative error = [Value (Ref. [1]) − Value (CFD)]/Value (Ref. [1]).
Table 5. Physical parameters with different Y1 values.
Y1SteamVelocityDensitySound SpeedEr
U (m/s)P (kg/m3)a (m/s)
0.0Pri1048.50.0318279.200.398
Sec185.370.0085405.49
0.1Pri1026.100.0339272.030.386
Sec187.170.00847405.37
0.3Pri979.610.0373256.960.37
Sec188.930.00845405.25
0.5Pri930.400.0414240.770.357
Sec190.550.0084405.13
Table 6. Physical parameters of different Y2 values.
Y2SteamVelocityDensitySound SpeedEr
U (m/s)Ρ (kg/m3)ɑ (m/s)
Pri1048.50.0318279.200.398
0.0Sec185.370.0085405.49
Pri1048.50.0318279.200.399
0.1Sec181.520.0088398.45
Pri1048.50.0318279.200.417
0.3Sec173.860.0096384.07
Pri1048.50.0318279.200.435
0.5Sec165.300.0105369.32
Table 7. Parameters of mixed layer.
Y1 δ 0 δ ErCd (%)Y2 δ 0 δ ErCd (%)
0.00.1880.05320.3980.00.00.1880.05320.3980.0
0.10.1840.05200.386−3.0150.10.1900.05360.3990.251
0.30.1780.04960.375−5.7790.30.1950.05470.4174.774
0.50.1720.04690.357−10.300.50.2000.05580.4359.296
Coefficient distortion (Cd) = (Er case value − Er standard value)/Er standard value, Er standard value = 0.398.
Publisher’s Note: MDPI stays neutral with regard to jurisdictional claims in published maps and institutional affiliations.

