1. Introduction
This work shows the potential opportunities for energy saving in a large industry in its installations of industrial refrigeration, through combining the use of speed regulation of the compressors with the slide control in big refrigerators’ compressors. For this purpose, refrigeration production has been studied, considering a large factory in the meat industry situated in the Valencian Community (Spain) [
1], analysing electric energy consumption, suggesting the actions to be carried out and executing the necessary measures to achieve maximum efficiency in the production of industrial refrigeration.
The energy consumption is considerable for this type of consumer, and the meat industry has been identified as one of the most suitable segments for the implementation of actions to improve energy demand [
2,
3]. Heat, ventilation, and refrigeration are among the largest amounts of energy consumed in processes in the meat industry [
4]. Electricity consumption is mainly used for cooling and ventilation, while fossil fuels such as natural gas or diesel are generally used for process heating. In the meat industry, refrigeration production and distribution constitute between 45% and 55% of the total final electricity consumption on weekdays [
4], making this process more energy intensive for most consumers in this segment. In the meat industries, the energy demand to produce industrial refrigeration can represent a very important percentage of the energy consumption, generally higher than 50%. There are studies that have been carried out [
5,
6,
7] to evaluate the response of the demand of different sectors (mainly for commercial and industrial sectors), where flexibility has traditionally been related to the capacity of a system to adapt itself to production changes [
8,
9] or it can absorb these changes depending on any of the system entities or the external environment [
10]. Optimizing and improving energy demand in refrigeration can be an important point to achieve in this type of industry.
Improving the energy efficiency of industrial refrigeration systems in the meat industry has been analysed from different aspects [
11,
12,
13,
14,
15]. In this work, the results of the improvement of a large industrial refrigeration system will be seen, describing a practical case where measures have been implemented for the energy improvement of this system by regulating the speed of electric motors in combination with the variation of the volumetric compression ratio by the physical regulation of the mechanical slide integrated in the compressors, allowing one to evaluate the effectiveness of this technique in such a promising sector as the meat industry.
This article analyses the study of a real case in a first level meat industry located in Spain, where energy consumption in industrial refrigeration is 44.1% of the total. The work is organized as follows:
Section 2 describes the main characteristics of the company’s industrial refrigeration system. Later (
Section 3) the measurements, carried out to establish the improvement process by combining the speed regulation with the mechanical slide regulation of the compressors to adapt the system capacity, are exposed. Once the capacity of the different refrigeration lines has been analysed,
Section 4 shows the measures adopted and the results obtained, which show significant energy savings in the refrigeration plant, close to 400 MWh per year.
2. Improve of Regulation Capacity in Refrigeration Compressors. Case Study
The company studied is a large industry located in the Valencian Community in Spain, where it has a complex consisting of a beef processing centre surrounded by the attached facilities necessary for the proper functioning of the main activity. In this factory, two work shifts of 8 hours each are executed daily, plus a third cleaning shift.
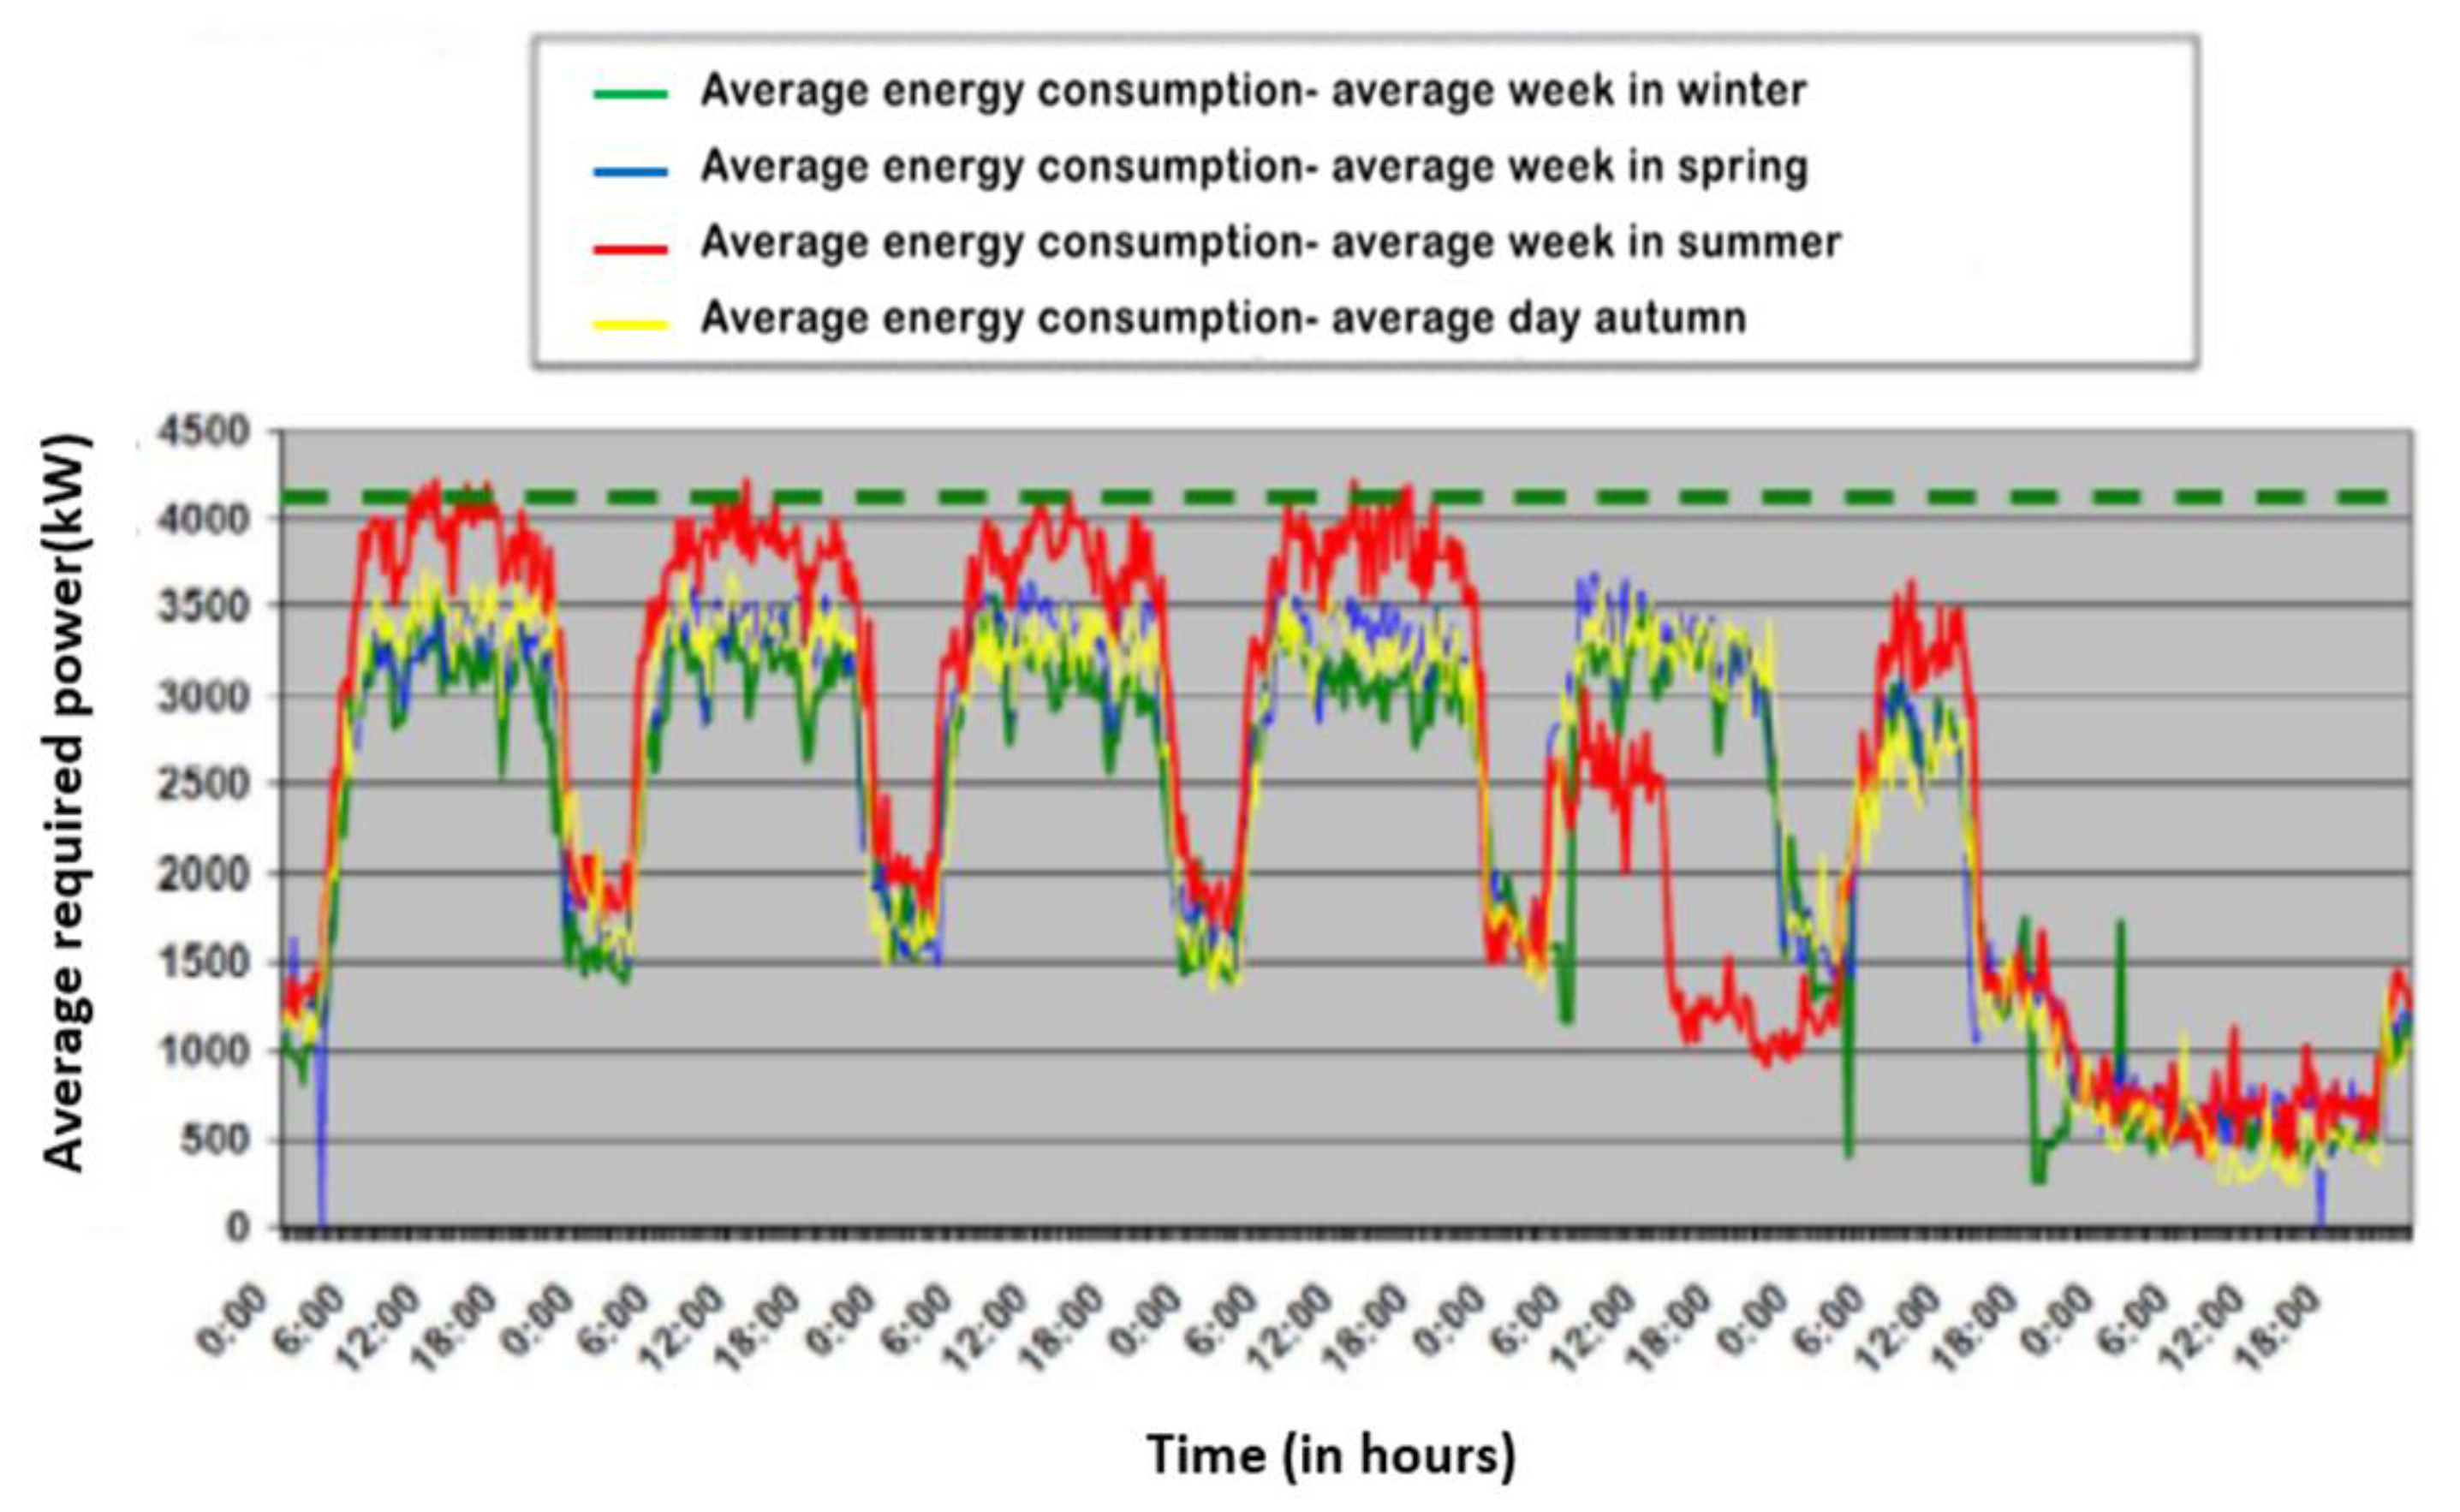
This factory was designed to operate with the greatest respect for the environment, as well as to achieve the highest efficiency ratios in operation, having obtained important national and international awards. Electric energy consumption can be seen in the graphs in
Figure 1 and
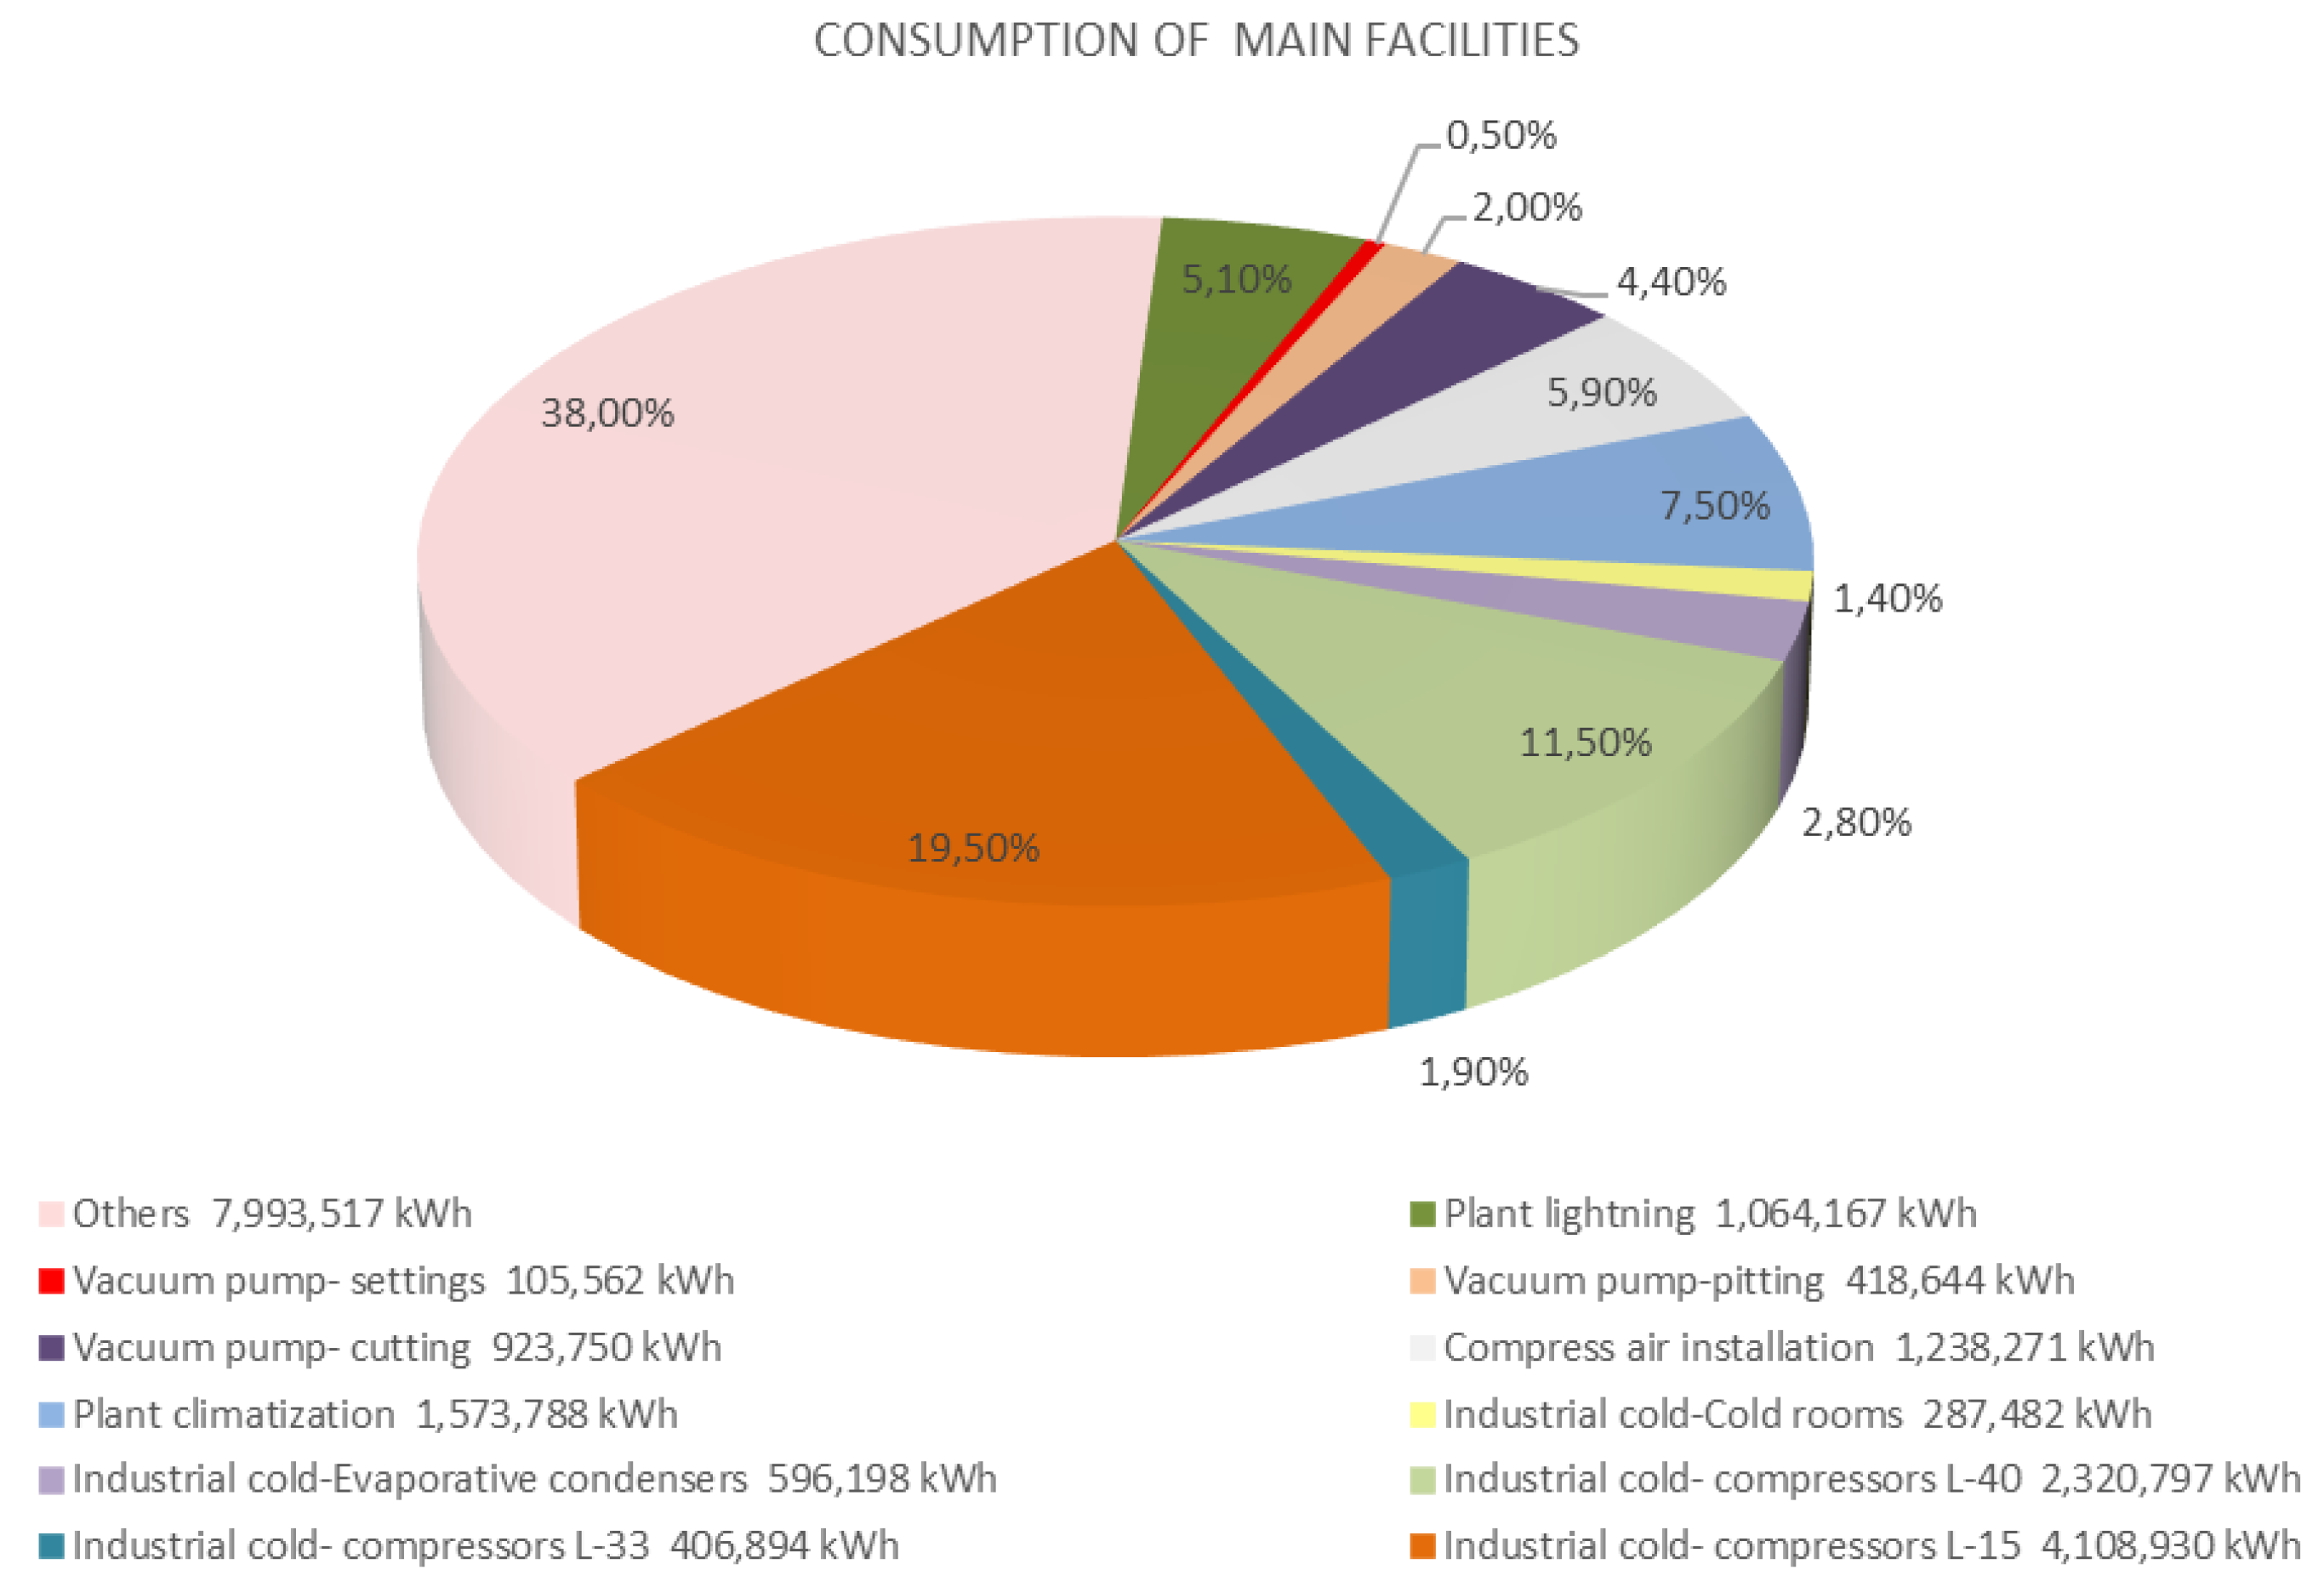
Figure 2, where the electricity consumption profile for different times of the year is observed. Within the electrical energy consumption of the factory, the refrigeration systems account for a percentage of 44.1% of the total (
Figure 3).
The factory’s refrigeration plant (
Figure 4 and
Figure 5) is made up of nine screw-type refrigeration compressors that use ammonia (NH
3) as a refrigerant, which is distributed through three main lines (
Figure 4). Line N°1 at −40 °C of evaporation is associated with the freezing tunnels, line N°2 at −33 °C of evaporation is for the meat treatment processes and freezing chambers, and Line N°3 at −15 °C of evaporation is for chambers and the heated meat processing areas (
Figure 4 and
Figure 5). The compressors used in the industrial refrigeration system have the technical characteristics of the equipment for the specific operating data of the different operating refrigeration circuits, as described in
Table 1.
The automatic regulation of the capacity of the refrigeration compressors is carried out by means of an integrated PID (proportional, integral, derivative) function that modifies the location of the mechanical slide integrated in the compressor to adapt the volumetric compression ratio (Vi) to the existing working conditions (thermal load), that are determined from the variation of the suction pressure (evaporation pressure) of the compressors.
With the variation of the slide, the quantity of refrigerant gas driven is directly affected by the recirculating part of the refrigerant sucked in before being compressed, thereby significantly reducing the associated energy consumption.
With the installation of variable speed drives to the compressor motors, the necessary frequency is delivered based on the suction pressure of the refrigeration system; if it rises, the frequency and speed of rotation will rise, increasing the capacity of the compressor until it reaches the pressure corresponding to the required evaporation temperature.
The voltage and power factor values have been extracted from the measurements made during the data collection phase. The cooling capacity values have been obtained from the compressor manufacturer’s computer application for the average operating pressure values of the different refrigeration circuits (
Table 2):
3. Measurements
In
Table 1, it can be seen how the work between the different compressors of the same circuit is quite distributed. This fact, together with the number of annual working hours that is limited since the facility works two shifts and not three, conditions the return on investment for a general speed variation solution.
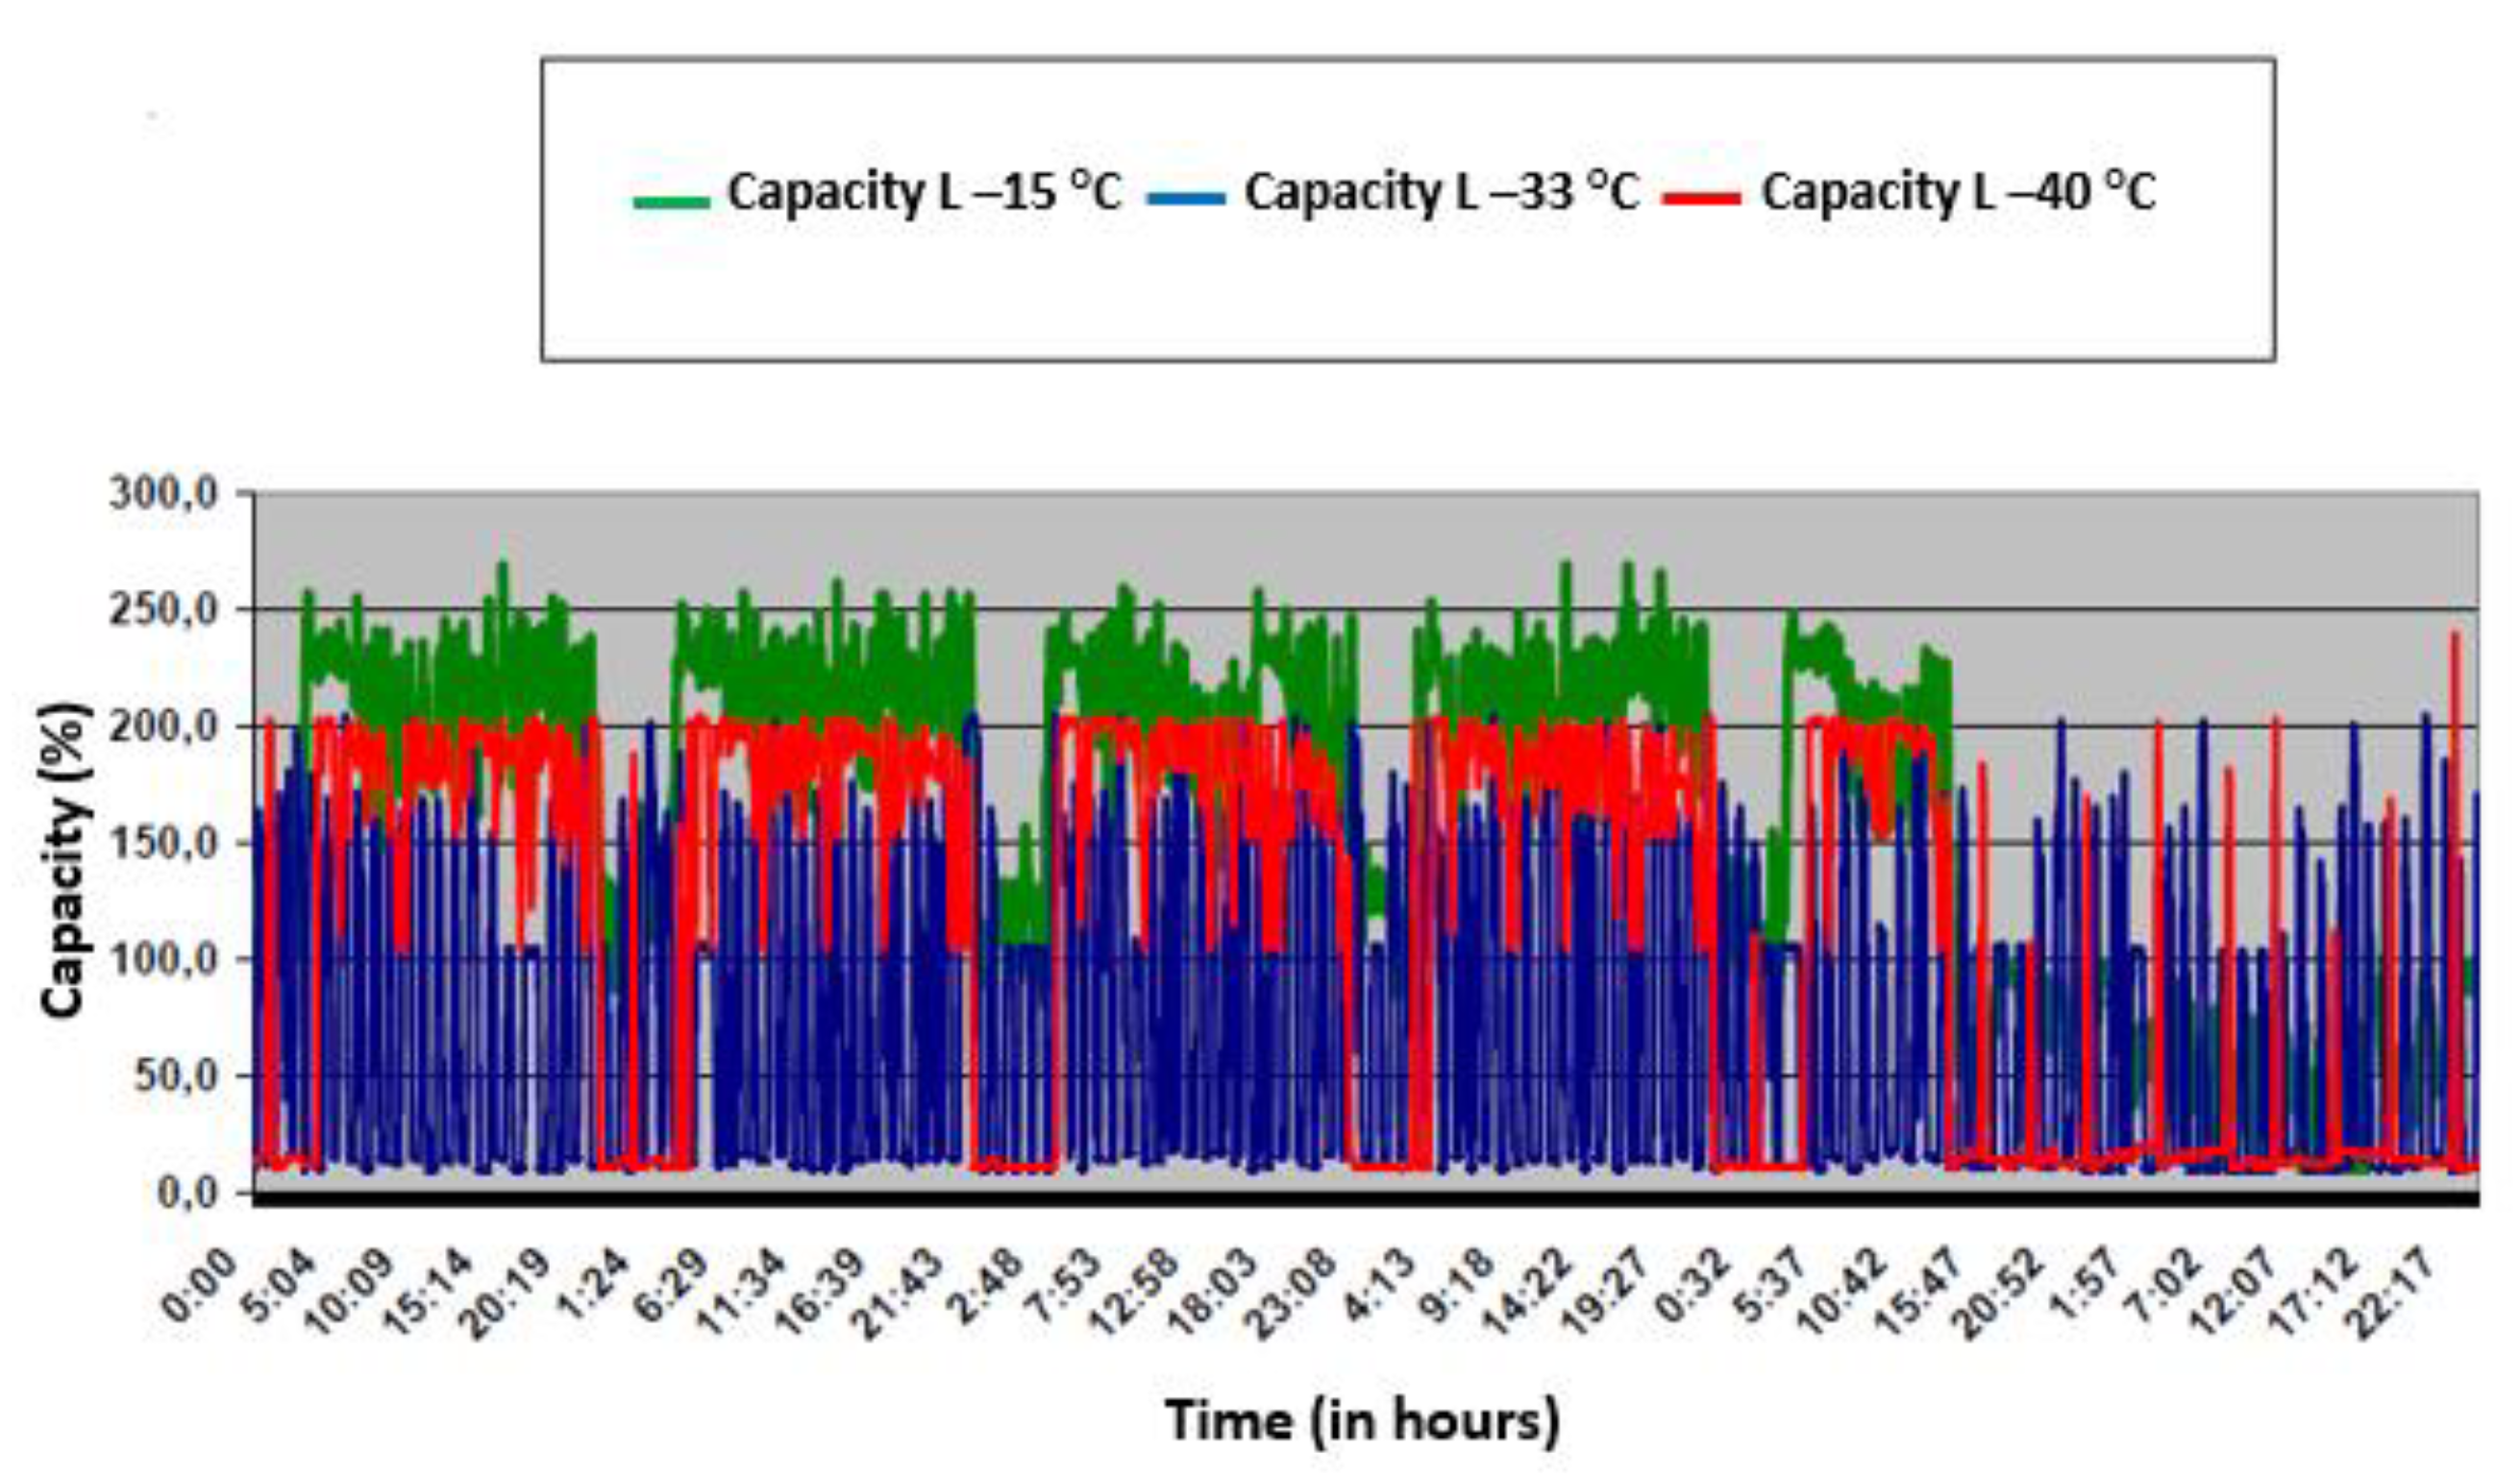
Figure 6 graphically shows the operating profile obtained from the different groups of compressors in a typical summer week, during a few days of the first week of July. In the same way, more detailed measurements were made for a typical winter day during the month of February (
Figure 7).
The data in
Figure 6 and
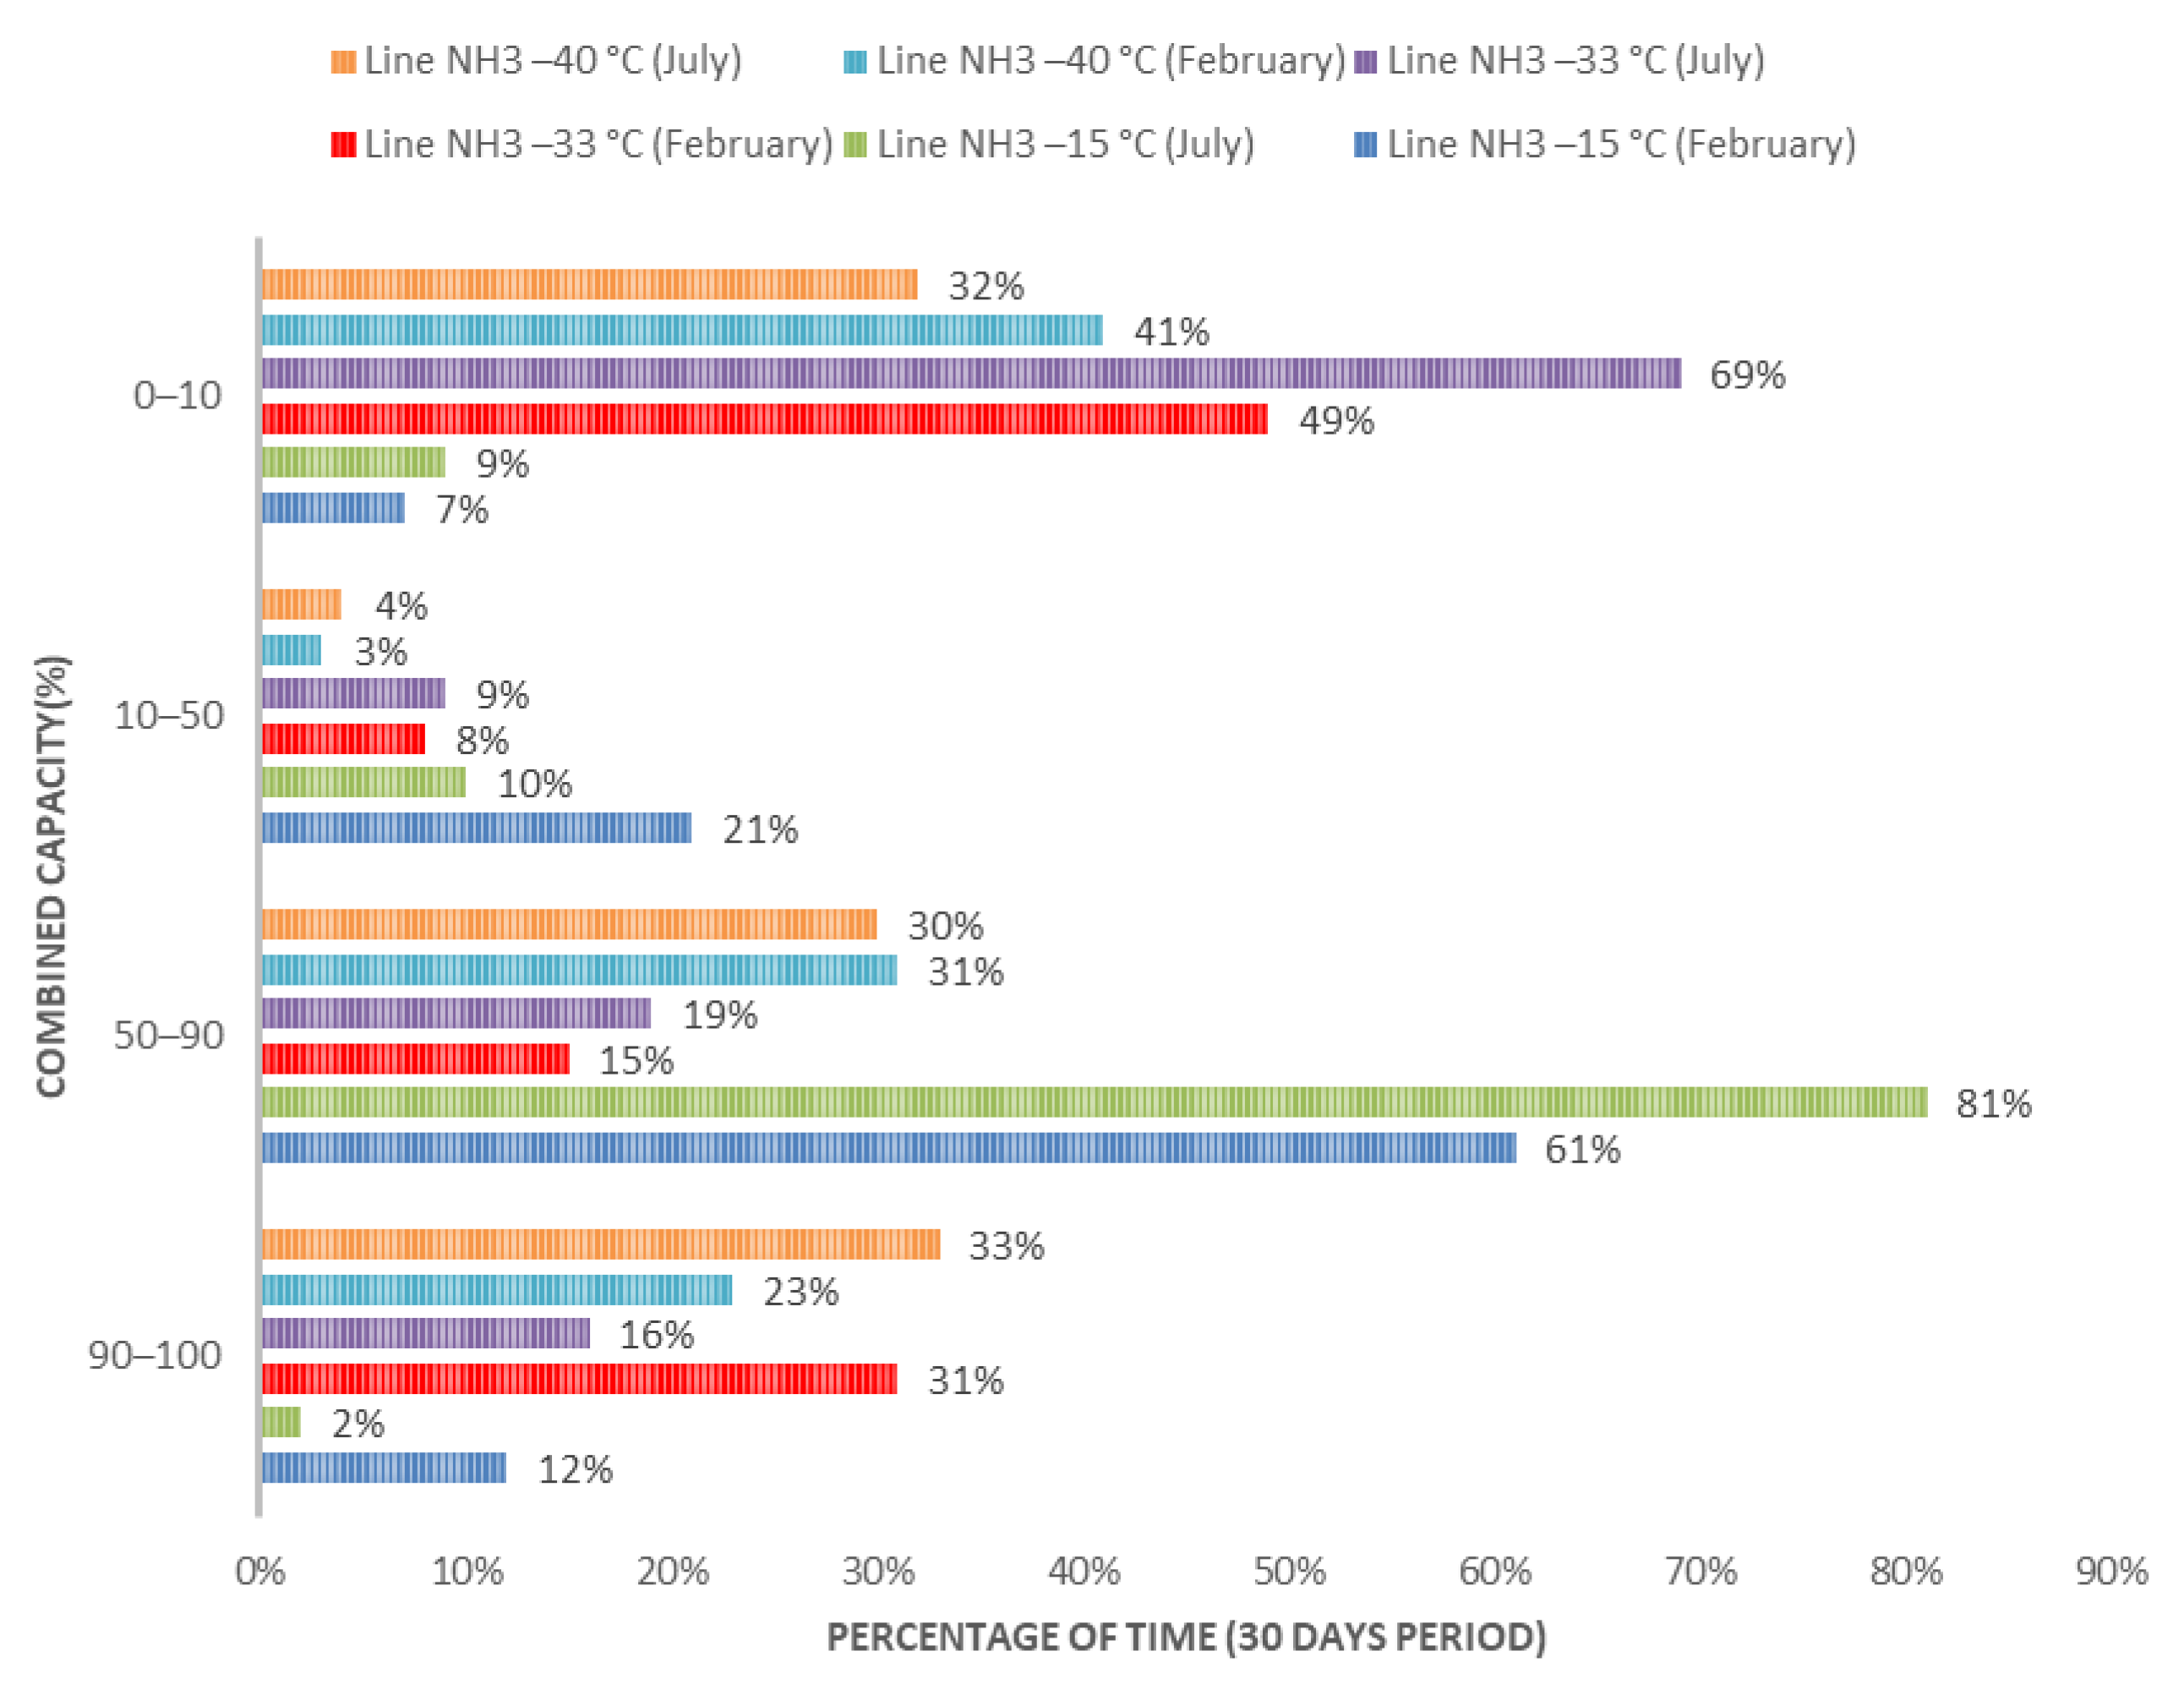
Figure 7 obtained from the operation measurements of the factory facilities control system help to visualize the operation mode and the average capacity level of the facility. With the capacity analysis, it was possible to measure the percentage of time (in a period of 30 days) for a certain level of capacity for each of the three refrigeration circuits (
Figure 8).
A greater detail of the independent capacity analysis for each of the lines shows the results for each of the lines: the line for the −40 °C circuit formed by three compressors (A1, A2 and A9) (
Figure 9); the line for the −33 °C circuit formed by two compressors (A3 and A4) (
Figure 10); the line for the −15 °C circuit formed by four compressors (A5, A6, A7 and A8) (
Figure 11).
In
Figure 9, the red columns indicate the percentage of time it is at a certain percentage (of capacity) over the nominal revolutions of the compressor, unlike the rest of the columns that the joint capacity axis indicates the average position in which the slide is located and therefore the average load percentage of the compressor.
Based on the results obtained, it is easy to see how only compressor A9 presents an opportunity in terms of capacity regulation through speed variation (VSD), since the rest of compressors, including compressor A1 which already has VSDs, are practically above 90% all the time or stopped, which greatly limits the return on the investment of a solution of this type from the energy point of view.
It should be noted that during the analysis, it is seen that the capacity regulation in compressor A1 is carried out mainly by slide. As can be seen in
Figure 9, the capacity regulation by speed variation (red column) occurs in very punctually and in short periods of time, with the result being that 95% of the time, the compressor is stopped or above 90% of the nominal revolutions of the compressor.
In the capacity analysis of the circuit at −33 °C (
Figure 10) formed by two compressors (A3 and A4), more than 20% of the time, the compressors in this circuit are at partial load, which means that almost 60% of the time they are unemployed, which is why the capacity regulation solution by speed variation is not economically viable from the point of view of strictly energy saving. Despite this, there may be other technical reasons and reliability that do justify it.
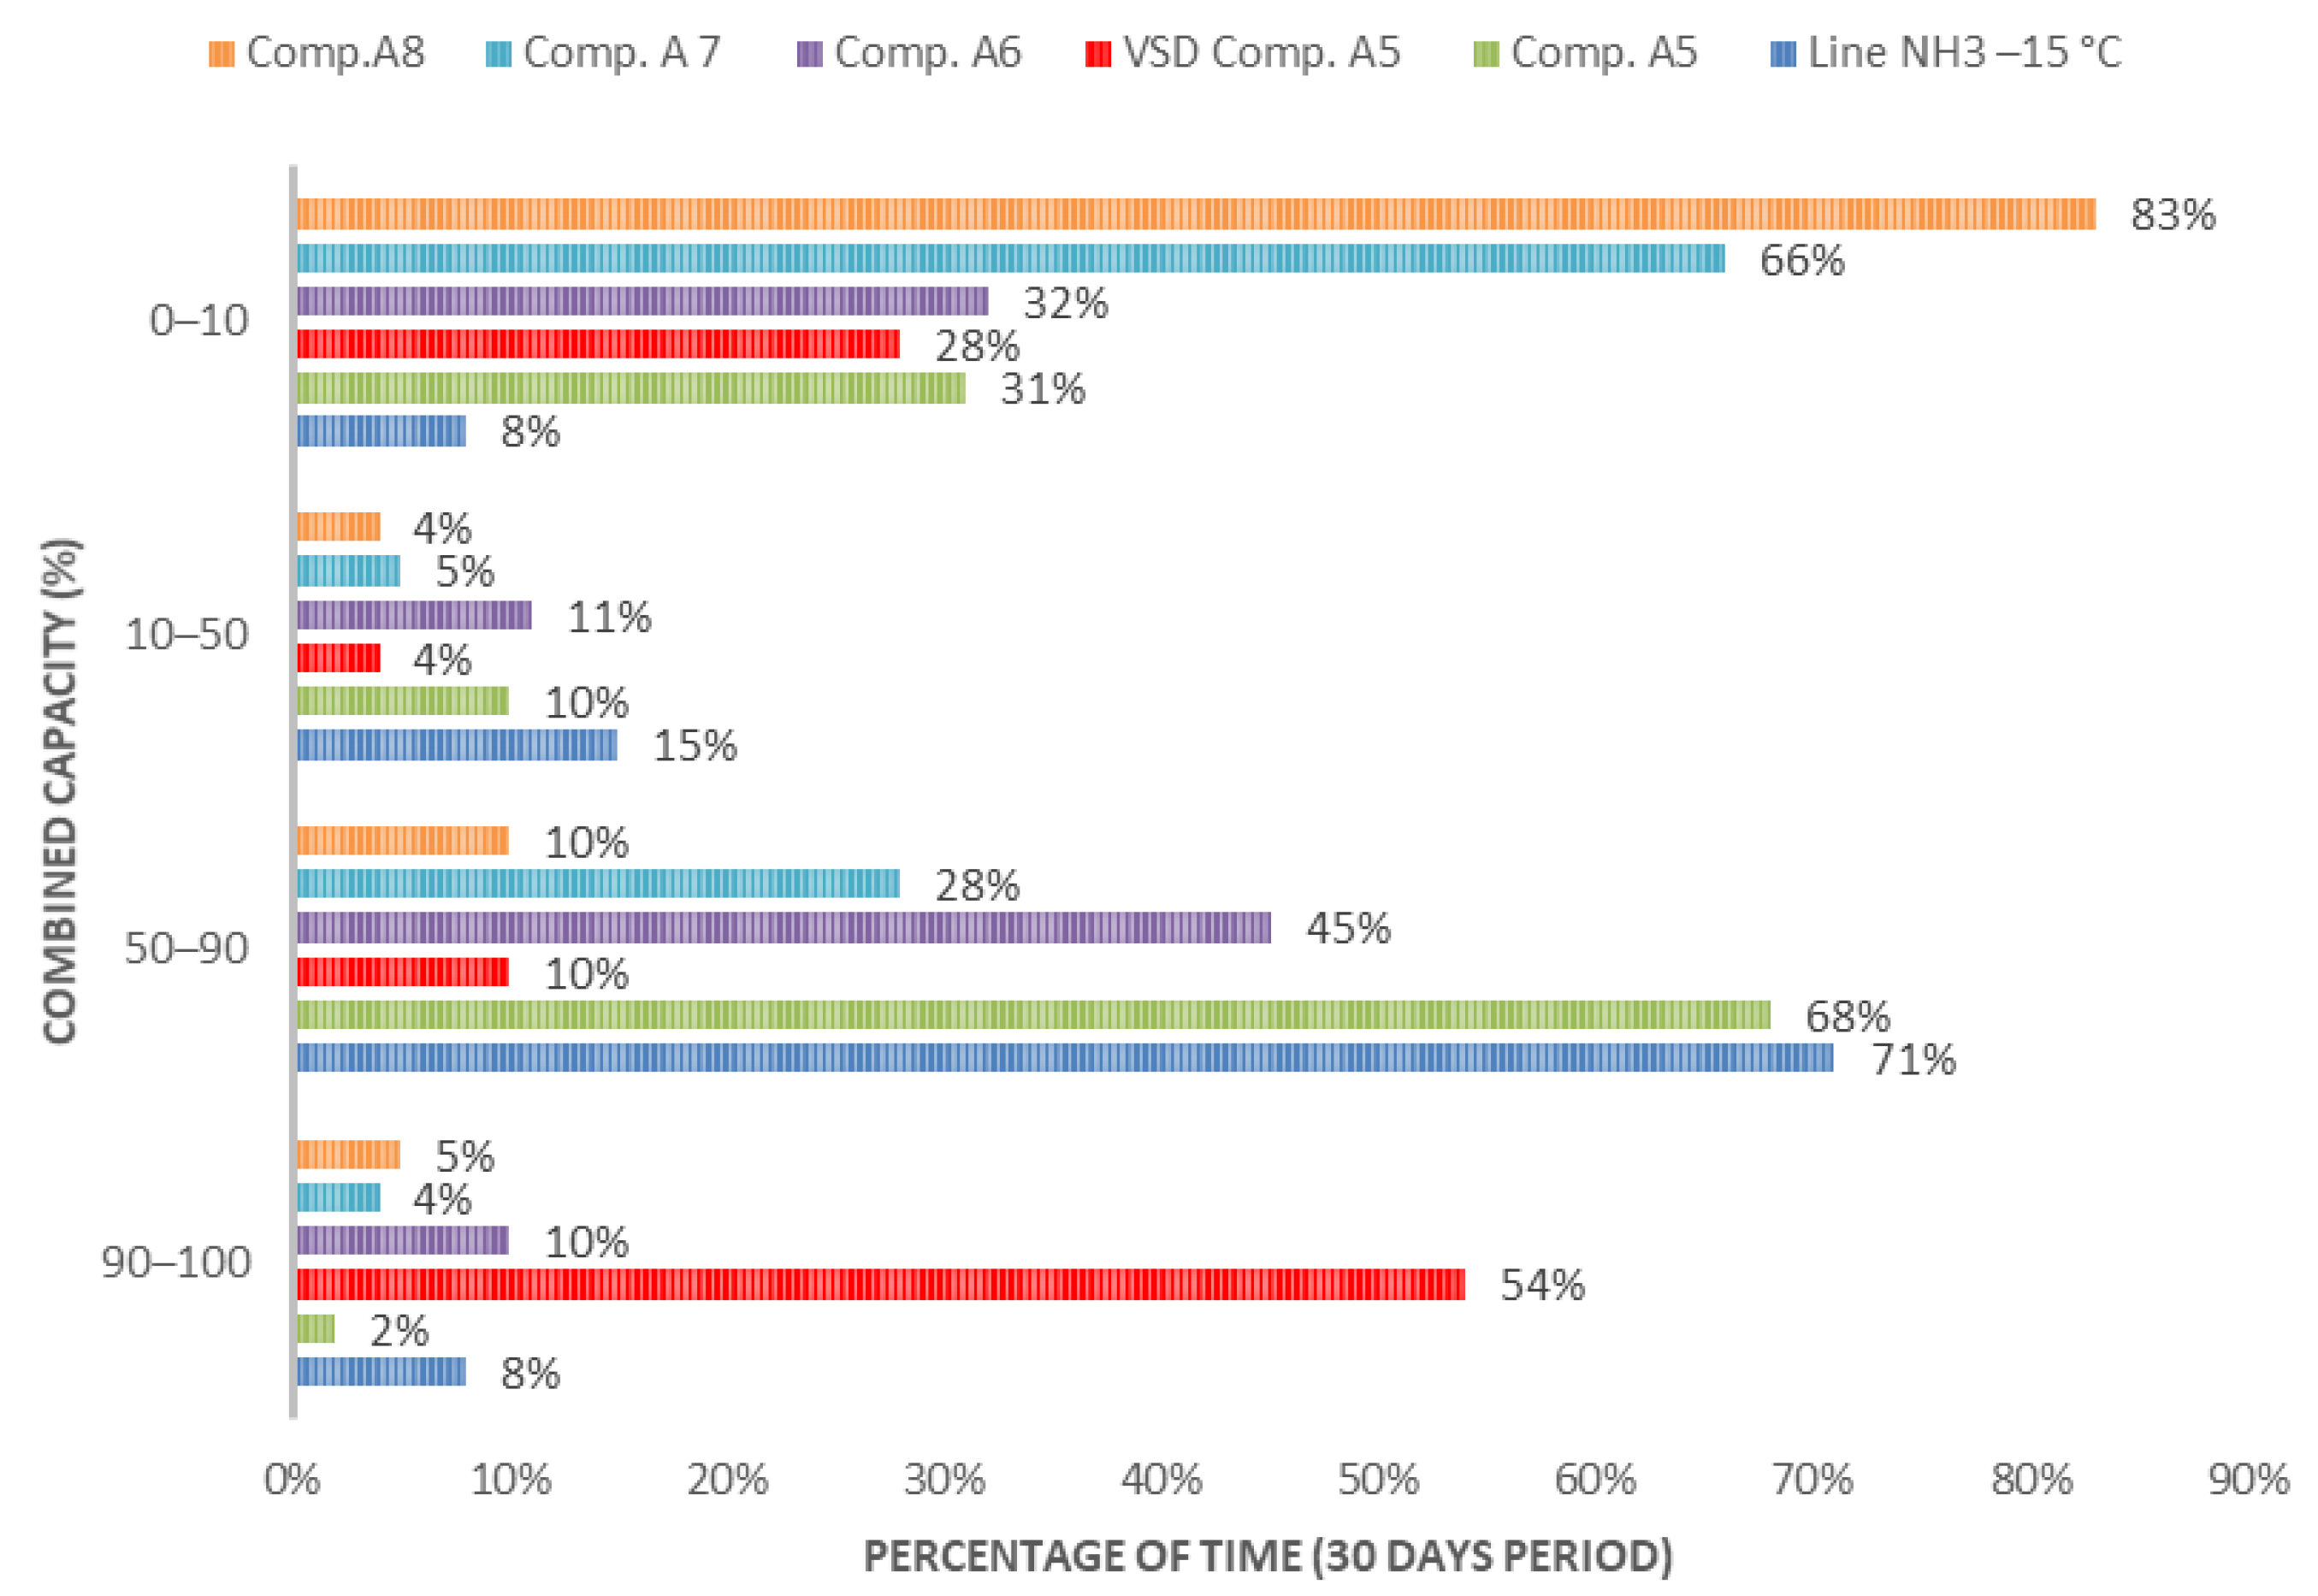
For the circuit at −15 °C, the capacity analysis for the four compressors gives the results reflected in
Figure 11.
As in the case of the compressor A1 of the −40 °C circuit, the compressor A5 is stopped for more than 85% of the time or operating above 90% (red columns) of the nominal speed of the compressor (3000 rpm). Despite this, in the same percentage of time, it is between 50% and 90% the of capacity (brown columns), which indicates that the regulation is carried out by the slider practically all the time, with the speed variation operating in a timely manner. This last point indicates that probably, the variable speed drives in both the A1 and A5 cases seem to be programmed mainly for starts, and not to regulate capacity according to energy efficiency criteria.
The data to highlight are that the set of compressors is at an average of 70% of the time between 50% and 90% of capacity, a fact that points to a clear opportunity for energy saving for the proposed energy saving solution.
From this capacity analysis, energy efficiency measures can be established by means of two speed regulation actions in compressors A6 and A9, in combination with capacity regulation by the slide.
4. Improvement of Energy Efficiency by Speed Regulation in Compressors A6 and A9. Results Obtained
To calculate energy savings for the speed variation solution in compressor number 6, the histogram in
Figure 11 is considered to determine the number of hours it operates at a certain degree of capacity as well as the COP values (Coefficient of Performance), for the same percentages of capacity, obtained from the manufacturer’s data, the result of which can be seen in
Table 3. The percentage of time is based on the maximum hours that can be worked per year (8760 h).
The energy saving result for this compressor is 72,440 kWh (sum of all the savings obtained for each percentage of capacity). To estimate the total savings, we have obtained the savings by adding the savings of the rest of the compressors in the circuit, since it is assumed that the compressor with speed variation would remain in the queue, regulating the capacity of the circuit and the rest could be kept at 100% capacity levels, maximizing the COP of all compressors. In the same way, the savings analysis carried out for the rest of the −15 °C line compressors is as follows: compressor A5: 62,865 kWh; compressor A6: 72,440 kWh; compressor A7: 45,804 kWh; compressor A8: 25,663 kWh.
The total annual energy saving with the measurements carried out in the A6 compressor, regulating the capacity of the −15 °C circuit, is 206,772 kWh.
Although, as previously mentioned, the number of operating hours is a limiting factor, it is possible to keep a compressor operating for several hours to maximize energy savings.
Based on the capacity analysis carried out, it was proposed to optimize the capacity management of the A6 compressor of the ammonia circuit at −15 °C, integrating a speed variator and managing the slide regulation in conjunction with the speed variation as a function of the suction pressure (evaporation) so that the system can operate according to the graph in
Figure 12 extracted from the characteristics provided by the manufacturer of the refrigeration compressors.
As can be seen in the data in
Figure 12, throughout the regulation range (100% to 44%), limits imposed by the working conditions of the motor/compressor (lubrication and ventilation) established by the manufacturer regarding the spin speed (2950 rpm to 1475 rpm), savings of up to 31% can be achieved. It is also worth noting that for the upper regulation range (100% to 80%), the capacity control by means of the slide acts in a similar way to the speed variation conditions, with the consequent reduction in energy saving opportunities.
Another aspect to note is that with the speed variation option, the working range can be extended to reach the maximum rotation speed allowed by the manufacturer (mechanical considerations) of 3540 rpm, and in this way the compressors could expand their theoretical cooling capacity to 120% of the nominal. This possibility cannot be realized by means of mechanical slide control.
The variable speed drives will be those appropriate to the power of the compressor motor. It will involve integrating input/output signals to regulate the electronics of the compressors, PLC (Programmable Logic Controller) programming integrating the control ramp, as well as a new electrical installation to integrate cabinets with variable speed drives and new electrical wiring with the required technical condition for this type of facility.
In the case of the −40 °C line, for the savings calculation for the speed variation solution in compressor number 9, the histogram of
Figure 9 is considered to determine the number of hours it operates at a determined degree of capacity, as well as the COP values for the same capacity percentages obtained from the manufacturer’s computer application, the result is shown in
Table 4. The percentage of time is based on the maximum hours that can be worked per year (8760 h).
The energy saving result for this compressor is 184,522 kWh (sum of all the savings obtained for each percentage of capacity). The total energy savings, considering the savings obtained by adding the savings of the rest of the compressors in the circuit with the measurements made in the A9 compressor regulating the capacity of the −40 °C circuit, is 201,707 kWh.
In the same way as with the A6 compressor of the −15 °C circuit, and according to the capacity analysis carried out, it was proposed to optimize the capacity management of the compressor A9 of the ammonia circuit at −40 °C, integrating a speed variator and managing the slide regulation in together with the speed variation as a function of the suction pressure (evaporation), so that the system can operate according to the graph in
Figure 12.
5. Discussion
In view of the study to improve the energy efficiency of the industrial refrigeration system for a meat processing factory, it has been observed that the combination of measures by means of capacity variation by mechanical slide of the refrigeration compressors together with speed variation actions produces better results that translate into a substantial improvement in combined energy efficiency.
The analysis should consider the whole of the entire refrigeration production system considering the total number of operating hours; this makes the best decision to be made, since it is not necessary to install speed regulation in all the electric motors of the compressors, but rather in those that make the regulation of the industrial refrigeration system more optimal to the joint capacity. This measure reduces the investment costs to be made for the total improve of the system.
These combined measures improved on energy saving close to 400 MWh per year, which entails an equivalent reduction of CO2 emissions of 147.9 tons.
Likewise, it has been found that after a period of application of the measures, there are other advantages in addition to energy savings, such as improved maintainability due to a better distribution of capacity and preventing components from operating excessive hours and others few. In the same way, the reliability of the system has increased due to the reduction of failures due to the more efficient operation of the motors and the reduction of starts.
These collateral results are important in the operation and maintenance of this type of industrial plant [
1,
16], being one of the areas of concern to achieve efficient industries with respect to the environment [
17,
18,
19,
20]. With all this, the importance of combining different regulation systems in industrial refrigeration compressors is shown in order to improve energy efficiency, so that it can be understood by professionals in the sector and introduce new lines of research to improve the efficiency of these systems.
6. Conclusions
In large industrial refrigeration systems with capacity regulation by a mechanical slide, it was interesting to carry out the study in combination with speed regulation to optimize joint efficiency.
Obviously, given the complexity of the refrigeration facilities, the implementation of energy improvements does not always result in significant savings, and in some cases, they can have a direct impact on the reliability of the facilities, so carrying out technical and economic viability studies is essential.
It is important to note that, in addition to the economic savings and the use of variable speed drives that will entail as capacity control in screw compressors, there are other considerations that must be considered, such as the improvement in maintenance or the increase in the reliability of the system.
The reduction in capacity due to speed variation will reduce wear and damage to the compressor slide valves.
The stability of the suction pressures will be further optimized since the capacity control is direct.
Operating at reduced speed, if the load profile so requires, will reduce wear on the mechanical elements of the compressor.
At an electrical level, the operation of the installation and the motors will improve, since with the variable speed drives, the power factor will be constant closely to 1, so the reactive energy and power of the installation will be reduced.
The combined measures improved the refrigeration system with an energy saving close to 400 MWh per year.
The use of variable speed drives in standard motors should be studied in detail, since the speed reduction implies a linear reduction in power (constant torque), so at low rotor speeds, the level of cooling may not be adequate to extract the heat generated, causing overheating problems. This situation is easily solved with the inclusion of a forced ventilation accessory, control of the winding temperature (thermal probes) or control of motor overloads (drive control module).


