Article

Review on Quality Control Methods in Metal Additive Manufacturing

1
Department of Industrial Engineering, Sungkyunkwan University, Suwon 16419, Korea
2
Department of Smart Drone Convergence Engineering, Korea Aerospace University, Goyang-si 10540, Korea
3
Department of Mechanical Engineering, Hanyang University, Seoul 04763, Korea
4
Department of Industrial Engineering, Hanyang University, Seoul 04763, Korea
*
Author to whom correspondence should be addressed.
Appl. Sci. 2021, 11(4), 1966; https://doi.org/10.3390/app11041966
Submission received: 28 January 2021 / Revised: 18 February 2021 / Accepted: 19 February 2021 / Published: 23 February 2021
(This article belongs to the Special Issue Additive Manufacturing and System: From Methods to Applications)

Abstract

:
Metal additive manufacturing (AM) has several similarities to conventional metal manufacturing, such as welding and cladding. During the manufacturing process, both metal AM and welding experience repeated partial melting and cooling, referred to as deposition. Owing to deposition, metal AM and welded products often share common product quality issues, such as layer misalignment, dimensional errors, and residual stress generation. This paper comprehensively reviews the similarities in quality monitoring methods between metal AM and conventional metal manufacturing. It was observed that a number of quality monitoring methods applied to metal AM and welding are interrelated; therefore, they can be used complementarily with each other.

1. Introduction

Metal additive manufacturing (metal AM) produces three-dimensional metal objects by repeatedly adding and solidifying metal materials layer by layer. Metal AM has four standard categories: powder bed fusion (PBF), direct energy deposition (DED), binder jetting, and sheet lamination [1]. PBF and DED produce 3D-shaped metal products directly from metal materials through deposition. During the deposition process, powder or wire-type metal materials are melted by concentrated energy sources, such as plasma arc, laser, or electron beam. The molten metals are positioned on a substrate or an existing material and cooled for solidification.
PBF and DED often experience common quality issues, such as layer misalignment, dimensional errors, and residual stress generation, owing to repeated melting and cooling. Such quality issues can also be found in welding, one of the conventional metal manufacturing processes that utilize deposition. For example, Varela et al. [2] analyzed the plasma spectrum during welding to quantify the elemental composition of the welded area, and Lednev et al. [3] used it to identify the elemental composition of DED products. They showed that using the plasma spectrum, which can be observed during deposition, is feasible for identifying the elemental composition of the product in real time during DED, as well as welding. This example suggests that quality monitoring methods between metal AM and other metal manufacturing, especially for DED and welding, can be interrelated and adopted with each other.
This paper provides a comprehensive review of quality monitoring methods for metal AM and welding and recommendations for possible directions in developing quality monitoring methods for metal AM. Section 2 introduces metal AM and welding and highlights their similarities. Section 3 and Section 4 present a summary and discussion of quality monitoring studies for metal AM and welding from numerical and experimental points of view, respectively. Section 5 provides the conclusions and recommendations.

2. Metal AM and Welding
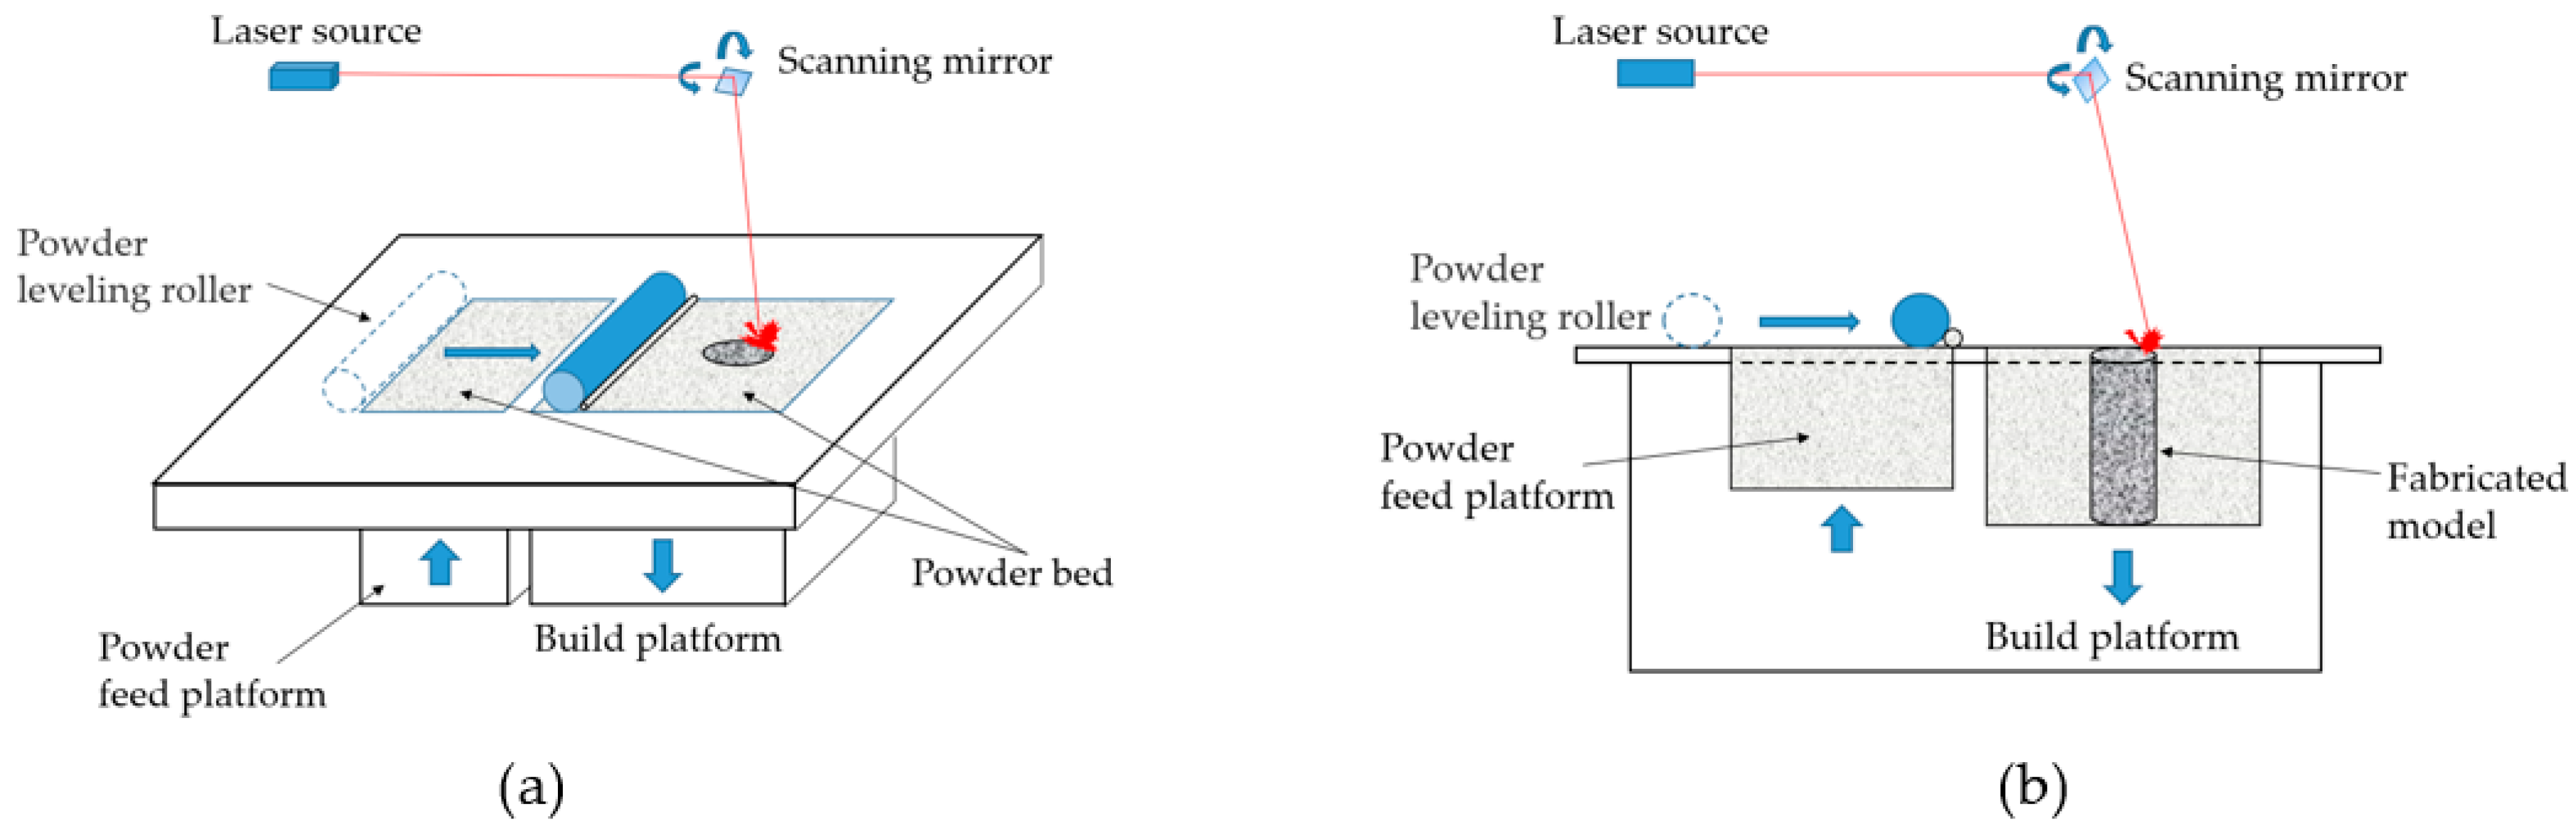
This section introduces metal AM and welding processes to explain their principles and their similarities.

2.1. Metal AM

Metal AM is popular in the aerospace and biomedical industries, which require final products of complex shapes [4]. Two types of metal AM processes are commonly used, depending on the deposition method: PBF and DED [5]. The PBF process spreads metal powder as a thin layer, typically under 100 µm, and then selectively deposits the powders as a 2D cross-sectional shape on a single layer. Metal powders are repeatedly spread and deposited on top of the existing layers, and the deposited 2D cross-sections are also embedded within each other to form a final 3D shape. The DED process works on a similar depositing principle but directly melts and positions the powder or wire-type metal material layer by layer using nozzles, instead of spreading metal powders in a layer [6].
Figure 1 shows a schematic diagram of a typical PBF process, which consists of the following steps: a 3D digital model is introduced into the PBF software, and the process parameters are determined in advance, for example, the layer thickness to separate the 3D digital model into layers, with each layer being a 2D cross-section of the model; when the process starts, a powder-leveling roller uniformly spreads metal powders onto the build platform; the scanning mirror controls the laser or electron beam to selectively deposit the spread powders following the 2D cross-sections of the digital model for each layer; when the deposition for one layer is completed, the build platform is lowered and the feed platform is elevated; the powder-leveling roller spreads the next powder layer upon the deposited layer, and the deposition and spreading of powders for each layer are repeated until the entire process is completed. During the process, the deposited 2D cross-sections of the top layers are also partially remelted and solidified together with new layers, eventually forming a 3D shape.
Figure 2 presents a schematic of a typical DED process. The materials are supplied by a coaxial or individual nozzle. The materials used for the DED process are in the form of a metal powder or wire to be melted quickly [7]. The DED process proceeds as follows. A 3D digital model of the product is introduced into the DED software, and the process parameters such as energy source power, nozzle speed, material feeding rate, and nozzle path settings are determined before starting. The nozzle moves through multiaxis motions, following the deposition path settings, and deposits the layers until the process is completed. During the process, the top of the predeposited part is remelted and solidified together with the newly fed molten metal, eventually forming a 3D shape.

2.2. Welding

Welding is used for joining or repairing metal parts using controlled equipment. There are two welding joint methods: melting the base metal and depositing foreign material on top of the base metals. In the first case, the base metals are partially melted for joining or repairing. For welding with deposition, the foreign materials are supplied to the base metals to be joined or repaired, and then beam-type energy sources are used to melt the foreign materials by concentrating the heat in a small area. Similar to the DED process, the material is supplied by a coaxial or individual nozzle in the form of a powder or wire. Figure 2 shows a schematic of the welding process with deposition.

2.3. Similarities between Metal AM and Welding

Both metal AM and welding deposit metal, and the powder or wire-type metal materials are repeatedly melted and solidified. Because the manufacturing principles are similar, there are several studies reporting that the purpose of metal AM is similar to that of welding and vice versa [8,9,10]. For example, Wahab et al. [8] mentioned that both PBF and DED have the potential to repair and restore metal parts that have been damaged or are at their end-of-life. Oh et al. [9] repaired damaged stainless steel parts using the DED process, and Toyserkani et al. [10] reported that laser welding can be used to manufacture 3D metal products, such as with rapid prototyping. Several studies have also been conducted to develop hybrid metal manufacturing systems that can perform the roles of both metal AM and welding simultaneously [11,12].
Another similarity between metal AM and welding can be found in the product quality issue. During deposition, the metal experiences repetitive melting and cooling. Thus, anomalies [13,14,15,16] such as melt pools, plumes, spatters, and keyholes, and defects [17,18,19] such as pores, layer misalignment, dimensional errors, and residual stress generation, are commonly found during metal AM and welding processes. Such anomalies are affected by process parameters such as laser power, nozzle speed, cooling time, temperature, material feeding rate, and laser spot size. Anomalies are often unpredictable, thus, they are usually identified experimentally.
Figure 3 shows a conceptual representation of common anomalies and the defects in metal AM and welding. The melt pool is a small pool of metallic liquids that can be generated during deposition. A small melt pool can increase the process time, and a large melt pool can cause vaporization of the material and increase the porosity of the product [20]. A plume is a mixed fume of plasma and the vaporized metal. The spatters are small splashes of molten metal or metal powders. During deposition, metal materials are boiled by the high-energy input of the concentrated beam, and the boiled metal emits a plume and spatter during the process [21]. Undesirable plume and spatter infusing into the product often result in dimensional errors, undesirable surface quality, and a decrease in tensile properties. The keyholes are caused by vapor depression. A deep keyhole causes excessive porosity and thus degrades the fatigue life of a product. The pore is a void inside the product caused by the air trapped during deposition. Large and uneven pores inside a product are known to cause cracks [22]. It was found that the major process parameters affecting the anomaly occurrence are laser power, scan speed, cooling time, temperature, material feeding rate, and laser spot size.

3. Numerical Quality Monitoring Methods in Metal AM and Welding

This section reviews numerical quality monitoring methods related to metal AM and welding. The purpose of numerical quality monitoring is to analytically identify quality issues, such as dimensional errors and residual stress generation, using numerical models. Numerical models are used to simulate the thermal, mechanical, and metallurgical relationships of the process and product through a finite element analysis. Numerical models can be used to predict future product quality and derive a combination of process parameters to optimize process performance or product quality. The feasibility of numerical models is validated with a variety of experiments conducted under controlled conditions. Numerical quality monitoring methods have advantages over experimental methods in simulating more process parameters within a relatively short time [23,24], while the use of numerical methods may be limited by the complexity of the manufacturing process.

3.1. Numerical Quality Monitoring Methods in Metal AM

Several numerical quality monitoring methods in metal AM have focused on identifying the cladding track geometry to predict the dimensional errors of the final products. The cladding track is a trail of the deposited metal. Figure 4 shows a schematic of a single-cladding track. El Cheikh et al. [25] quantified the cross-section of a single-cladding track as a disk shape. Wang et al. [26] proposed a 3D powder-scale multiphysics model with the finite volume method (FVM) to identify the single-cladding track geometry in the DED process. The heat source, powder, and molten pool flow models were included as submodels. Computational fluid dynamics (CFD) was applied to simulate the thermal conditions of a real-scale laser cladding track. The influence of the laser power and DED nozzle speed on the height and width of a single track was numerically quantified using the model. In addition, the authors presented a Gaussian process regression model that can precisely predict the laser cladding track geometry based on the proposed model. Wits et al. [27] proposed a numerical model that considers energy densities to predict the shape of a single-cladding track. The authors observed that a low energy density input to the track caused a large porosity, and a high energy density input produced a wide track. Wirth and Wegener [28] proposed a numerical model to predict both the height and width of a cladding track in multiple overlapping situations. Abbes et al. [29] used a numerical model to simulate the multilayer stacking situation of cladding tracks. A finite pointset method (FPM), which has the advantage of less calculation time because the FPM does not generate mesh, was applied to simulate the situation. The model was based on mass, momentum, and energy conservation equations. The relationship between the cladding angle and the temperature distribution of the track was quantified. Additionally, the authors used the model to optimize the laser power to improve the track geometry. The accuracy of the proposed model was validated using a previous finite element method (FEM) model [30]. The authors suggested that the FPM would be a low-cost alternative in the numerical monitoring method for metal AM, compared to the FEM.
Various numerical studies have been conducted to identify the causes of residual stress during the metal AM process. Residual stress in a product may result in distortion, fatigue, creep, and corrosion [31]. Martínez et al. [32] investigated the major process parameters related to geometrical distortion of PBF products. The distortion and the misalignment of the PBF specimens produced with various parameter settings were evaluated by coordinate-measuring machine (CMM). The authors noted that high thermal gradients could cause thermal residual stress and distortion. Based on both experimental and numerical results, the authors reported that laser path and substrate thickness were the major process parameters for residual stress generation and geometrical distortion. By applying a 3D thermo-mechanical FE model, Lu et al. [33] reported that the complexity of the DED product geometry significantly affected the residual stress generation, and the spiral tool path generated less residual stress when a product had a complex shape. Additionally, the authors reported that the heat input had a significant effect on residual stress generation and distortion, while the powder feeding rate had less effect. Through numerical modeling, Roberts et al. [34] simulated the temperature histories of a metal AM product to identify the area under residual stress. The results showed that the deposited area under the stacked layer underwent rapid temperature cycles, which could cause residual stress. The residual stress in the metal AM product was numerically quantified in a study conducted by Roberts et al. [35], and it was observed that increasing the layer of track increased the average residual stress. Renken et al. [36] used a numerical model to identify the influence of heat flow on the residual stress in a DED product. Through the proposed model, the authors found that maintaining a constant laser power caused residual stress in the complex-shaped product. Denlinger et al. [37] proposed a numerical prediction model for the residual stress and distortion in multiple layers of cladding tracks, observing that the newly deposited layer experienced the greatest amount of tensile stress, while the layer below it was subjected to compressive stress.

3.2. Numerical Quality Monitoring Methods in Welding

Numerical quality monitoring methods in welding have focused on reducing the residual stress in welded areas. It was found that a higher welding speed [12,38,39,40,41], shorter cooling time [42], and substrate preheating at higher temperatures [43] can retard the residual stress generation in the welded area. Ma et al. [41] designed a polynomial model considering the laser beam power, scanning speed, and defocus parameters on dilution and residual stress using response surface methodology. It was found that the defocus parameter and scanning speed had a significant effect on dilution and residual stress. Additionally, the authors applied a multiobjective quantum-behaved particle swarm optimization algorithm to find parameters that minimize dilution and residual stress. Huang et al. [43] found that the residual stress along the weld direction was much greater than that perpendicular to the weld direction. Derakhshan et al. [42] used a numerical model to examine the residual stress and distortion in thin welded plates and observed that concentrating the energy could reduce the residual stress-generating area in thin plates. Nazemi et al. [44] developed a simulation model based on the thermal–metallurgical–mechanical relationship to simulate the microhardness and residual stress of cladded specimens. The effects of various process parameter sets were studied, and the proposed model was utilized to optimize the cladding process parameters to minimize the residual stress. Fang et al. [45] proposed a numerical model considering the effect of phase transformation on the residual stress during single-and multipass laser cladding processes.

3.3. Discussion on Numerical Quality Monitoring Studies in Metal AM and Welding

Table 1 summarizes the numerical quality monitoring methods for metal AM and welding. Based on the literature review, the numerical quality monitoring methods in metal AM focused on analyzing the formation of the cladding track and identifying the causes of residual stress. Multiple cladding tracks form a single 2D layer, and multiple 2D layers are stacked to produce the final 3D-shaped product. Thus, the dimensional errors of a single-cladding track may significantly affect the dimensions of the final product [46].
Numerical studies in welding have focused on identifying and further reducing the residual stress generation in welded areas. According to Table 1, the main purpose of conducting numerical studies in welding is to ensure the durability and reliability of the welded area, in that welding is generally used to join and repair metal parts.
It was found that the phenomenon of residual stress generation during the processes was actively studied in both metal AM and welding. Numerical studies of residual stresses in metal AM still focus on identifying the causes of residual stress generation due to the complex design of the products. Due to the nature of metal AM, which deposits a number of layers to realize complex 3D shapes, temperature profile during the process and residual stress generation are affected by various process parameters. Several studies reported that residual stress in metal AM products can be reduced through preheating the substrate, as well as determining proper process parameters [32,33,47,48,49]. Numerical studies aiming to find methods for reducing residual stress generation in welded areas are expected to be promising for improving product quality in metal AM.
In welding, it is necessary to examine more numerical studies on the formation of cladding tracks. Similar to the metal AM process, the dimensional error of cladding tracks in welding affects the dimensions of the welded area. This can interfere with the formation of smooth and precise welded surfaces, which are required in aerospace products to reduce weight and drag [50], thus, introducing numerical studies on cladding track formation in metal AM processes may be promising for welding.

4. Experimental Quality Monitoring Methods in Metal AM and Welding

This section reviews the experimental quality monitoring methods for metal AM and welding. Experimental quality monitoring methods have been used to identify anomalies during the process and to predict the final product quality [51]. Experimental quality monitoring can be conducted in a destructive or nondestructive way. For example, X-ray computed tomography (X-ray CT) has attracted attention as a nondestructive quality monitoring method for metal AM [52,53,54]. X-ray CT forms a 3D model of the product by capturing and reconstructing a number of X-ray images around the axis of rotation [55]. The 3D CT model can be used for the visualization, geometry or porosity measurement, and reverse engineering of metal AM products [56]. Recently, experimental quality monitoring has often been conducted using nondestructive means by implementing in situ monitoring. In situ monitoring allows the nondestructive identification of anomalies in advance and helps in decision making on interventions for quality issues in a short time. As a representative anomaly during deposition, melt pool behavior is related to both metal AM and welding. The melt pool behavior varied according to the process parameter settings. Melt pool monitoring allows the process engineer to adjust the values of the process parameters to control the melt pool behavior [57,58].

4.1. Experimental Quality Monitoring Methods in Metal AM

Image monitoring is a common experimental quality monitoring method for anomaly detection in metal AM. Optical [59,60,61], X-ray [62,63] and thermal [64,65,66,67,68] image sensors have been utilized to capture the images with anomalies. It was experimentally observed that anomalies, such as the melt pool [36,65,69,70,71], plume and spatter [59,60,71,72], and keyhole [62,63], can cause porosity, residual stress, and dimensional errors in both PBF and DED products. Yakout et al. [67] comprehensively monitored the shape, size, and number of spatters during the metal PBF process using a high-speed infrared camera. It was observed that the number and the size of the spatters are affected by the laser power and build rate. During deposition, the spatter particles scattered to the surface of each layer and agglomerated with each other on the surface, causing layer delamination. Especially, large spatter particles caused crack and separation at the edge of the product. Ye et al. [59] applied a high-speed near-infrared (NIR) camera to capture optical images of plume and spatter. The authors applied improved deep belief network (DBN) to recognize the captured images. Because the proposed DBN does not need a feature extraction stage, it has potential to implement in situ plume and spatter monitoring for PBF processes. It was observed that the proposed DBN showed 83.40% accuracy in recognizing plume and spatter images in real time. Liu et al. [60] quantified the plume and spatter sizes through optical images and found that the tensile properties of the product decreased when the plume and spatter were mixed into the product during the process. Lott et al. [61] integrated an additional illumination source for a high-speed complementary metal-oxide semiconductor (CMOS) camera to capture melt pool images at high sampling rates. Clijsters et al. [66] connected a high-speed infrared camera to a field-programmable gate array (FPGA) to implement a high-speed data acquisition system. Additionally, a feedback closed-loop system was designed to control process parameters such as laser power, scan speed, and single-cladding track height [73]. Cunningham et al. [62] applied high-speed X-ray image sensors to capture the keyhole phenomenon during a DED process and experimentally found that the laser power was dominant around the keyhole depth. Across the monitoring studies, it was found that melt pool, plume, spatter, and keyhole occur together during deposition. Other studies showed that applying image sensors is also feasible in identifying dimensional errors during metal AM [74,75,76]. By monitoring and characterizing the optical images of a single deposited layer in real time, Caltanissetta et al. [74] identified the dimensional errors of each layer during a PBF process and predicted the dimensional error of the final products.
Some experimental studies have reported that the plasma spectrum and acoustic signals can also be used for monitoring metal AM processes. The width of the cladding track [77] and elemental composition [3,78] of the product can be identified from the plasma spectrum. Zhang et al. [77] focused on using optical emission spectroscopy (OES) for single-cladding track monitoring during the DED process. The authors focused on the spectral intensity and electron density of the plasma spectrum, which can indicate the width of a single-cladding track. A spectrometer with a wavelength range of 200–950 nm was applied to the DED machine, off-axial to the arc torch, and the iterative discrete wavelet transform was selected to denoise the spectrum data of the arc [79]. It was observed that the plasma spectrum can be used for in situ geometry monitoring. Song et al. [78] applied laser-induced OES to predict the binary alloy composition during the DED process. Support vector regression (SVR) was used to recognize the pattern between the plasma spectrum and elemental composition in real time. The proposed method showed more accuracy and robustness over a wider concentration range than did previous methods. Shevchik [80] demonstrated the feasibility of using acoustic signals for porosity prediction. Taheri [81] also focused on acoustic signals for metal AM monitoring and suggested the possibility that acoustic signals can be used to recognize the thermal properties of the product, such as conductivity, heat capacity, and coefficient of thermal expansion. Based on these existing studies, Koester et al. [82] and Hossain and Taheri [83] noted the possibility of real-time monitoring systems using acoustic signatures for metal AM.
Other experimental studies have focused on the implementation of multisensor monitoring systems [64,67,68,84,85,86]. Renken et al. [64] proposed a multisensor monitoring concept with lower monitoring errors to identify the melt pool for real-time monitoring. The thermal image, laser wavelength, and melt pool depth were collected simultaneously. Stutzman et al. [86] proposed a multisensor monitoring system that includes optical emissions and image sensors to identify plume characteristics. The relationship between the plasma emission of the plume and the plume area was quantified using the proposed monitoring system. The relationship showed that strong plume plasma emissions resulted in an increased plume area. Additionally, the authors demonstrated that the plasma emission of the plume can be used to evaluate the buildup quality of the DED process. Tian et al. [68] used two distinctive thermal and image data of the melt pool to predict the internal porosity in a metal AM product with high accuracy. The authors noted that the infrared image of the melt pool can have some associations with porosity, and thus can be used for porosity prediction. The thermal data collected by pyrometer was trained using CNN and the images collected by infrared camera were trained using long-term recurrent convolutional networks. The authors fused two models, which showed better prediction accuracy than the individual models.

4.2. Experimental Quality Monitoring Methods in Welding

Several experimental studies have been conducted on welding to identify anomalies using image data. Similar to metal AM, the keyhole [87,88], melt pool [89,90], and distortion [87,91] were identified as welding anomalies by image monitoring. Heigel et al. [91] proposed a thermal image monitoring system to identify the distortion of the cladding track during the laser cladding process. The results show that the distortion of the cladding track is directly related to the clad heat. Calleja et al. [57] observed that the materials were excessively deposited to the corners of the product due to the nonuniform powder feed rate during the laser cladding process. As the geometry of the product became more complex, the excessive material deposition increased, which led to a geometrical error. Based on the monitoring result, the authors developed a real-time feed rate control algorithm to optimize the process. The manufacturing test result showed that the excessive material deposition was eliminated by applying the algorithm. Examples can also be found in monitoring common anomalies.
The plasma spectrum was also utilized to monitor anomalies during the welding process. Shevchik et al. [92] characterized keyholes using plasma emission monitoring. Three optical sensors covering different wavelength ranges were applied to increase the possibility of collecting keyhole features. The authors proposed another monitoring system in a subsequent study [93], which reduced the keyhole identification time for real-time spectral emission monitoring. Wang et al. [89] demonstrated that analyzing the plasma spectrum from the melt pool can be a potential method for monitoring the melt pool properties in laser welding.
There were experimental studies focused on utilizing acoustic signals to monitor the welding. Zhu et al. [94] characterized keyhole shapes using acoustic signals. Wu et al. [95] noted that acoustic signals from a keyhole contain dynamic change information of the keyhole to predict the keyhole geometry. Shelyagin et al. [96] predicted the welding temperature using an acoustic signal. Wasmer et al. [54] applied acoustic signals for keyhole and spatter monitoring. Zhang et al. [97] evaluated the changes in the weld size and localized discontinuities of the welded area through acoustic signals. He et al. [98] found that the use of acoustic signals for welding could identify deformation and cracks during welding.
Several experimental studies applying multisensors for laser welding have been reported. Liu et al. [88] applied multisensors in order to identify the interactions between the laser beam and the preheated filler wire in a laser hot-wire welding process. By applying a high-speed optical camera, the authors found that preheating the wire reduced the heat input during welding and laser beam power consumption and produced a deeper penetration. Additionally, by applying a spectrometer, the authors observed that the electron temperature of the plasma could be used for real-time monitoring of the variation of the welded area features and the formation of weld defects. Liu et al. [90] applied a multisensor monitoring system to investigate the influence of the process parameters on the melt pool behavior during laser powder welding. An infrared camera was used to study the temperature distribution, size, and cooling rate of the melt pool. Additionally, a pyrometer was used to measure the variation in the brightness temperature of the melt pool, observing that the laser power and carrier-gas flow rate were dominant in the melt pool behavior. Some studies focusing on the use of acoustic signals have also applied additional image sensors to ensure the accuracy and detectability of the monitoring system [54,94,95].

4.3. Discussion on Experimental Quality Monitoring Methods in Metal AM and Welding

Table 2 summarizes the classification of the experimental quality monitoring methods of metal AM and welding. Various data types have been used, such as images, plasma spectra, and acoustic signals for metal AM monitoring. Throughout the review, note that image data are commonly used for experimental quality monitoring in metal AM. Because the metal AM process involves the gradual addition of thin metal layers during manufacturing, the images of each layer or cladding track geometry provide intuitive information for quality monitoring. By collecting and analyzing images from the process, anomalies, such as melt pool, plume, spatter, and keyhole, can be identified, and quality-related features can be extracted from the anomalies. Plasma spectra are commonly used to quantify the elemental compositions during the metal AM process and sometimes to identify the cladding track formation in the DED process [86]. Acoustic signals have also been used for detecting anomalies, however, few cases have been reported in metal AM processes.
In welding, similar to metal AM, images, plasma spectra, and acoustic signals have been introduced for experimental quality monitoring. Anomalies such as melt pool, keyhole, and distortion were identified through the images. Plasma spectra were also used to quantify the elemental composition of the welded area and identify the keyhole occurrences. Unlike metal AM, it was noted that acoustic signals were actively utilized for monitoring the welding process. By utilizing acoustic signals for the welding process, researchers can identify anomalies, defects in the welded area, and process temperatures.
Several experimental quality monitoring methods for welding have the potential to be introduced to metal AM. For example, Hossain and Taheri [83] examined the possibility of using acoustic signals for both PBF and DED defect monitoring. The authors found that other types of metal manufacturing, such as machining and welding, have used acoustic signals for defect monitoring. Based on the review of these existing cases, the authors recommended that applying acoustic techniques for the real-time and nondestructive monitoring of metal AM can show promising results.
It was found that several quality monitoring methods in welding can be directly applied to the DED process with some adjustment [3,52,55,77,79]. For example, Lednev et al. [3] focused on the possibility of using the plasma spectrum for real-time monitoring in the DED process. The applicability of using the plasma spectrum to quantify the elemental composition of metal alloys has already been demonstrated in welding [2]. To apply real-time spectrum monitoring to the DED process, the authors concentrated mainly on developing a compact coaxial spectrum sensor that can be attached to the nozzle. The results showed that using a spectrum sensor is also feasible for identifying the elemental compositions of DED products in real time.
In general, existing experimental studies on both metal AM and welding have focused mainly on integrating multiple sensors to improve the detection accuracy. Anomalies and defects can be detected by various types of monitoring data, thus, integrating multiple sensors can lead to robust quality monitoring. Several studies on metal AM have reported monitoring systems that integrate spectrum sensors and image sensors, however, few cases of integrating acoustic sensors have been reported. Because acoustic signals have a better penetration capability than do optical or spectrum signals, they are appropriate for finding internal defects in the product [99]. Incorporating acoustic signals into an integrated monitoring system can be a promising experimental quality monitoring method for metal AM.

5. Conclusions

This paper comprehensively reviewed the similarities between metal AM and welding based on their principles, quality issues, and quality monitoring methods. Metal AM and welding are directly related in terms of their fabrication principles. Similar quality issues are found in both metal AM and welding owing to deposition. Additionally, both numerical and experimental quality monitoring methods of metal AM and welding processes were summarized and discussed to highlight the interrelationship between them. Several quality monitoring methods applied to welding, such as acoustic and spectrum monitoring, are currently being introduced to metal AM, and they can be applied complementarily to each other.
Several metal manufacturing processes can be interrelated to metal AM. For example, the path control of concentrated energy sources in both DED and PBF can be related to tool path control of CNC machining, as well as residual stress reduction [100]. Thus, the authors expect that continuous investigations of quality monitoring methods, which can be complementarily adopted between metal AM and conventional metal manufacturing, can lead to the simultaneous improvement of the process and product quality for both processes. To this end, in-depth and practical investigations, including data acquisition and process control, are required for each quality monitoring method between metal AM and other conventional metal manufacturing methods.

Author Contributions

J.L.: Conceptualization, methodology, investigation, writing—original draft preparation, visualization; H.J.P.: investigation, writing—original draft preparation; S.C.: investigation, writing—original draft preparation; G.R.K.: investigation, writing—original draft preparation; H.Y.: conceptualization, investigation; S.J.B.: writing—review and editing, funding acquisition; D.K.: conceptualization, writing—review and editing, supervision, project administration, funding acquisition. All authors have read and agreed to the published version of the manuscript.

Funding

This research was supported by a National Research Foundation of Korea (NRF) grant funded by the Korean government (MSIT) (NRF- 2020R1A4A407990411), supported by the KIAT (Korea Institute for Advancement of Technology) grant funded by the Korea Government (MOTIE : Ministry of Trade Industry and Energy). (No. N0002429) and supported by a grant from the Human Resources Development program (No. 20204010600090) of the Korea Institute of Energy Technology Evaluation and Planning (KETEP), funded by the Ministry of Trade, Industry, and Energy of the Korean Government.

Institutional Review Board Statement

Not applicable.

Informed Consent Statement

Not applicable.

Data Availability Statement

Data available in a publicly accessible repository.

Acknowledgments

This research was supported by a National Research Foundation of Korea (NRF) grant funded by the Korean government (MSIT) (NRF- 2020R1A4A407990411), supported by the KIAT (Korea Institute for Advancement of Technology) grant funded by the Korea Government (MOTIE : Ministry of Trade Industry and Energy). (No. N0002429) and supported by a grant from the Human Resources Development program (No. 20204010600090) of the Korea Institute of Energy Technology Evaluation and Planning (KETEP), funded by the Ministry of Trade, Industry, and Energy of the Korean Government.

Conflicts of Interest

The authors declare no conflict of interest.

References

  1. Frazier, W.E. Metal additive manufacturing: A review. J. Mater. Eng. Perform. 2014, 23, 1917–1928. [Google Scholar] [CrossRef]
  2. Varela, J.A.A.; Amado, J.; Tobar, M.; Mateo, M.; Yañez, A.; Nicolas, G. Characterization of hard coatings produced by laser cladding using laser-induced breakdown spectroscopy technique. Appl. Surf. Sci. 2015, 336, 396–400. [Google Scholar] [CrossRef]
  3. Lednev, V.; Tretyakov, R.; Sdvizhenskii, P.; Grishin, M.Y.; Asyutin, R.; Pershin, S. Laser induced breakdown spectroscopy for in-situ multielemental analysis during additive manufacturing process. In Proceedings of the SPIE-The International Society for Optical Engineering, Saint Petersburg, Russia, 17–19 September 2018; p. 110420R. [Google Scholar]
  4. Tapia, G.; Elwany, A. A review on process monitoring and control in metal-based additive manufacturing. J. Manuf. Sci. Eng. 2014, 136, 060801. [Google Scholar] [CrossRef]
  5. ASTM International. F2792-12a: Standard terminology for additive manufacturing technologies (ASTM International, West Conshohocken, PA, 2012). P. Jain Am. Kuthe Feasibility Study Manuf. Using Rapid Prototyp. FDM Approach Procedia Eng. 2013, 63, 4–11. [Google Scholar]
  6. Gibson, I.; Rosen, D.W.; Stucker, B. Additive Manufacturing Technologies; Springer: Berlin/Heidelberg, Germany, 2014; Volume 17. [Google Scholar]
  7. Katayama, S. Handbook of Laser Welding Technologies; Elsevier: Amsterdam, The Netherlands, 2013. [Google Scholar]
  8. Wahab, D.; Azman, A. Additive manufacturing for repair and restoration in remanufacturing: An overview from object design and systems perspectives. Processes 2019, 7, 802. [Google Scholar]
  9. Oh, W.J.; Lee, W.J.; Kim, M.S.; Jeon, J.B.; Shim, D.S. Repairing additive-manufactured 316L stainless steel using direct energy deposition. Opt. Laser Technol. 2019, 117, 6–17. [Google Scholar] [CrossRef]
  10. Toyserkani, E.; Khajepour, A.; Corbin, S.F. Laser Cladding; CRC Press: Boca Raton, FL, USA, 2004. [Google Scholar]
  11. Leino, M.; Pekkarinen, J.; Soukka, R. The role of laser additive manufacturing methods of metals in repair, refurbishment and remanufacturing–enabling circular economy. Phys. Procedia 2016, 83, 752–760. [Google Scholar] [CrossRef] [Green Version]
  12. Zhan, X.; Liu, Y.; Ou, W.; Gu, C.; Wei, Y. The numerical and experimental investigation of the multi-layer laser-MIG hybrid welding for Fe36Ni Invar alloy. J. Mater. Eng. Perform. 2015, 24, 4948–4957. [Google Scholar] [CrossRef]
  13. Fotovvati, B.; Wayne, S.F.; Lewis, G.; Asadi, E. A review on melt-pool characteristics in laser welding of metals. Adv. Mater. Sci. Eng. 2018, 2018, 1–18. [Google Scholar] [CrossRef] [Green Version]
  14. Fabbro, R. Melt pool and keyhole behaviour analysis for deep penetration laser welding. J. Phys. D Appl. Phys. 2010, 43, 445501. [Google Scholar] [CrossRef]
  15. Kim, J.-D.; Peng, Y. Melt pool shape and dilution of laser cladding with wire feeding. J. Mater. Process. Technol. 2000, 104, 284–293. [Google Scholar] [CrossRef]
  16. Yan, J.; Gao, M.; Zeng, X. Study on microstructure and mechanical properties of 304 stainless steel joints by TIG, laser and laser-TIG hybrid welding. Opt. Lasers Eng. 2010, 48, 512–517. [Google Scholar] [CrossRef]
  17. Matsunawa, A.; Mizutani, M.; Katayama, S.; Seto, N. Porosity formation mechanism and its prevention in laser welding. Weld. Int. 2003, 17, 431–437. [Google Scholar] [CrossRef]
  18. Zeng, C.; Tian, W.; Liao, W.H.; Hua, L. Microstructure and porosity evaluation in laser-cladding deposited Ni-based coatings. Surf. Coat. Technol. 2016, 294, 122–130. [Google Scholar] [CrossRef]
  19. Lewandowski, J.J.; Seifi, M. Metal additive manufacturing: A review of mechanical properties. Annu. Rev. Mater. Res. 2016, 46, 151–186. [Google Scholar] [CrossRef] [Green Version]
  20. Kamath, C. Data mining and statistical inference in selective laser melting. Int. J. Adv. Manuf. Technol. 2016, 86, 1659–1677. [Google Scholar] [CrossRef]
  21. Ye, D.; Zhu, K.; Fuh, J.Y.H.; Zhang, Y.; Soon, H.G. The investigation of plume and spatter signatures on melted states in selective laser melting. Opt. Laser Technol. 2019, 111, 395–406. [Google Scholar] [CrossRef]
  22. Montgomery, C.; Beuth, J.; Sheridan, L.; Klingbeil, N. Process mapping of Inconel 625 in laser powder bed additive manufacturing. In Proceedings of the Solid Freeform Fabrication Symposium, Austin, TX, USA, 10–12 August 2015; pp. 1195–1204. [Google Scholar]
  23. Ablat, M.A.; Qattawi, A. Numerical simulation of sheet metal forming: A review. Int. J. Adv. Manuf. Technol. 2017, 89, 1235–1250. [Google Scholar] [CrossRef]
  24. Bandyopadhyay, A.; Traxel, K.D. Invited review article: Metal-additive manufacturing—Modeling strategies for application-optimized designs. Addit. Manuf. 2018, 22, 758–774. [Google Scholar] [CrossRef] [PubMed]
  25. El Cheikh, H.; Courant, B.; Hascoët, J.-Y.; Guillén, R. Prediction and analytical description of the single laser track geometry in direct laser fabrication from process parameters and energy balance reasoning. J. Mater. Process. Technol. 2012, 212, 1832–1839. [Google Scholar] [CrossRef]
  26. Wang, S.; Zhu, L.; Fuh, J.Y.H.; Zhang, H.; Yan, W. Multi-physics modeling and Gaussian process regression analysis of cladding track geometry for direct energy deposition. Opt. Lasers Eng. 2020, 127, 105950. [Google Scholar] [CrossRef]
  27. Wits, W.W.; Bruins, R.; Terpstra, L.; Huls, R.A.; Geijselaers, H.J. Single scan vector prediction in selective laser melting. Addit. Manuf. 2016, 9, 1–6. [Google Scholar] [CrossRef]
  28. Wirth, F.; Wegener, K. A physical modeling and predictive simulation of the laser cladding process. Addit. Manuf. 2018, 22, 307–319. [Google Scholar] [CrossRef]
  29. Abbes, B.; Anedaf, T.; Abbes, F.; Li, Y. Direct energy deposition metamodeling using a meshless method. Eng. Comput. 2020. [Google Scholar] [CrossRef]
  30. Peyre, P.; Dal, M.; Pouzet, S.; Castelnau, O. Simplified numerical model for the laser metal deposition additive manufacturing process. J. Laser Appl. 2017, 29, 022304. [Google Scholar] [CrossRef]
  31. Li, C.; Liu, Z.; Fang, X.; Guo, Y. Residual stress in metal additive manufacturing. Procedia CIRP 2018, 71, 348–353. [Google Scholar] [CrossRef]
  32. Martínez, S.; Ortega, N.; Celentano, D.; Sánchez Egea, A.J.; Ukar, E.; Lamikiz, A. Analysis of the Part Distortions for Inconel 718 SLM: A Case Study on the NIST Test Artifact. Materials 2020, 13, 5087. [Google Scholar] [CrossRef] [PubMed]
  33. Lu, X.; Lin, X.; Chiumenti, M.; Cervera, M.; Hu, Y.; Ji, X.; Ma, L.; Yang, H.; Huang, W. Residual stress and distortion of rectangular and S-shaped Ti-6Al-4V parts by Directed Energy Deposition: Modelling and experimental calibration. Addit. Manuf. 2019, 26, 166–179. [Google Scholar] [CrossRef]
  34. Roberts, I.A.; Wang, C.; Esterlein, R.; Stanford, M.; Mynors, D. A three-dimensional finite element analysis of the temperature field during laser melting of metal powders in additive layer manufacturing. Int. J. Mach. Tools Manuf. 2009, 49, 916–923. [Google Scholar] [CrossRef]
  35. Roberts, I.A. Investigation of Residual Stresses in the Laser Melting of Metal Powders in Additive Layer Manufacturing; University of Wolverhampton: Wolverhampton, UK, 2012. [Google Scholar]
  36. Renken, V.; Lübbert, L.; Blom, H.; von Freyberg, A.; Fischer, A. Model assisted closed-loop control strategy for selective laser melting. Procedia CIRP 2018, 74, 659–663. [Google Scholar] [CrossRef]
  37. Denlinger, E.R.; Gouge, M.; Irwin, J.; Michaleris, P. Thermomechanical model development and in situ experimental validation of the Laser Powder-Bed Fusion process. Addit. Manuf. 2017, 16, 73–80. [Google Scholar] [CrossRef]
  38. Yu, H.; Zhan, X.; Kang, Y.; Xia, P.; Feng, X. Numerical simulation optimization for laser welding parameter of 5A90 Al-Li alloy and its experiment verification. J. Adhes. Sci. Technol. 2019, 33, 137–155. [Google Scholar] [CrossRef]
  39. Zhan, X.; Zhang, Q.; Zhu, Z.; Wei, Y. Numerical simulation of resistance welding of solar cell using a thermal-electrical-mechanical coupled model. J. Mech. Sci. Technol. 2018, 32, 269–276. [Google Scholar] [CrossRef]
  40. Zhan, X.; Meng, Y.; Zhou, J.; Qi, C.; Zhang, C.; Gu, D. Quantitative research on microstructure and thermal physical mechanism in laser melting deposition for Invar alloy. J. Manuf. Process. 2018, 31, 221–231. [Google Scholar] [CrossRef]
  41. Ma, M.; Xiong, W.; Lian, Y.; Han, D.; Zhao, C.; Zhang, J. Modeling and optimization for laser cladding via multi-objective quantum-behaved particle swarm optimization algorithm. Surf. Coat. Technol. 2020, 381, 125–129. [Google Scholar] [CrossRef]
  42. Derakhshan, E.D.; Yazdian, N.; Craft, B.; Smith, S.; Kovacevic, R. Numerical simulation and experimental validation of residual stress and welding distortion induced by laser-based welding processes of thin structural steel plates in butt joint configuration. Opt. Laser Technol. 2018, 104, 170–182. [Google Scholar] [CrossRef]
  43. Huang, W.; Lin, G.; Chen, Z.; Chen, W. Numerical simulation on residual stress in Y-slit type cracking test of Q690E. In Proceedings of the AIP Conference Proceedings, Zhuhai, China, 2–4 February 2018; pp. 2–40. [Google Scholar]
  44. Nazemi, N.; Urbanic, J.; Alam, M. Hardness and residual stress modeling of powder injection laser cladding of P420 coating on AISI 1018 substrate. Int. J. Adv. Manuf. Technol. 2017, 93, 3485–3503. [Google Scholar] [CrossRef]
  45. Fang, J.; Dong, S.; Wang, Y.; Xu, B.; Zhang, Z.; Xia, D.; He, P. The effects of solid-state phase transformation upon stress evolution in laser metal powder deposition. Mater. Des. 2015, 87, 807–814. [Google Scholar] [CrossRef]
  46. Demir, A.G. Micro laser metal wire deposition for additive manufacturing of thin-walled structures. Opt. Lasers Eng. 2018, 100, 9–17. [Google Scholar] [CrossRef]
  47. Shim, D.-S.; Baek, G.-Y.; Lee, E.-M. Effect of substrate preheating by induction heater on direct energy deposition of AISI M4 powder. Mater. Sci. Eng. A 2017, 682, 550–562. [Google Scholar] [CrossRef]
  48. Corbin, D.J.; Nassar, A.R.; Reutzel, E.W.; Beese, A.M.; Michaleris, P. Effect of Substrate thickness and preheating on the distortion of laser deposited Ti–6Al–4V. J. Manuf. Sci. Eng. 2018, 140, 061009. [Google Scholar] [CrossRef] [Green Version]
  49. Sadhu, A.; Choudhary, A.; Sarkar, S.; Nair, A.M.; Nayak, P.; Pawar, S.D.; Muvvala, G.; Pal, S.K.; Nath, A.K. A study on the influence of substrate pre-heating on mitigation of cracks in direct metal laser deposition of NiCrSiBC-60% WC ceramic coating on Inconel 718. Surf. Coat. Technol. 2020, 389, 125646. [Google Scholar] [CrossRef]
  50. Wen, P.; Yelkenci, D.; Chen, J.; Chang, B.; Du, D.; Shan, J. Numerical analysis of the effect of welding positions on formation quality during laser welding of TC4 titanium alloy parts in aerospace industry. J. Laser Appl. 2019, 31, 022401. [Google Scholar] [CrossRef]
  51. Everton, S.K.; Hirsch, M.; Stravroulakis, P.; Leach, R.K.; Clare, A.T. Review of in-situ process monitoring and in-situ metrology for metal additive manufacturing. Mater. Des. 2016, 95, 431–445. [Google Scholar] [CrossRef]
  52. Du Plessis, A.; Yadroitsev, I.; Yadroitsava, I.; Le Roux, S.G. X-ray microcomputed tomography in additive manufacturing: A review of the current technology and applications. 3D Print. Addit. Manuf. 2018, 5, 227–247. [Google Scholar] [CrossRef] [Green Version]
  53. Ziółkowski, G.; Chlebus, E.; Szymczyk, P.; Kurzac, J. Application of X-ray CT method for discontinuity and porosity detection in 316L stainless steel parts produced with SLM technology. Arch. Civ. Mech. Eng. 2014, 14, 608–614. [Google Scholar] [CrossRef]
  54. Wasmer, K.; Le-Quang, T.; Meylan, B.; Vakili-Farahani, F.; Olbinado, M.; Rack, A.; Shevchik, S. Laser processing quality monitoring by combining acoustic emission and machine learning: A high-speed X-ray imaging approach. Procedia CIRP 2018, 74, 654–658. [Google Scholar] [CrossRef]
  55. De Chiffre, L.; Carmignato, S.; Kruth, J.-P.; Schmitt, R.; Weckenmann, A. Industrial applications of computed tomography. CIRP Ann. 2014, 63, 655–677. [Google Scholar] [CrossRef]
  56. du Plessis, A.; Yadroitsava, I.; Yadroitsev, I. Effects of defects on mechanical properties in metal additive manufacturing: A review focusing on X-ray tomography insights. Mater. Des. 2020, 187, 108385. [Google Scholar] [CrossRef]
  57. Calleja, A.; Tabernero, I.; Ealo, J.A.; Campa, F.J.; Lamikiz, A.; de Lacalle, L.N.L. Feed rate calculation algorithm for the homogeneous material deposition of blisk blades by 5-axis laser cladding. Int. J. Adv. Manuf. Technol. 2014, 74, 1219–1228. [Google Scholar] [CrossRef]
  58. Colosimo, B.M.; Cavalli, S.; Grasso, M. A cost model for the economic evaluation of in-situ monitoring tools in metal additive manufacturing. Int. J. Prod. Econ. 2020, 223, 107532. [Google Scholar] [CrossRef]
  59. Ye, D.; Fuh, J.Y.H.; Zhang, Y.; Hong, G.S.; Zhu, K. In situ monitoring of selective laser melting using plume and spatter signatures by deep belief networks. Isa Trans. 2018, 81, 96–104. [Google Scholar] [CrossRef]
  60. Liu, Y.; Yang, Y.; Mai, S.; Wang, D.; Song, C. Investigation into spatter behavior during selective laser melting of AISI 316L stainless steel powder. Mater. Des. 2015, 87, 797–806. [Google Scholar] [CrossRef]
  61. Lott, P.; Schleifenbaum, H.; Meiners, W.; Wissenbach, K.; Hinke, C.; Bültmann, J. Design of an optical system for the in situ process monitoring of selective laser melting (SLM). Phys. Procedia 2011, 12, 683–690. [Google Scholar] [CrossRef]
  62. Cunningham, R.; Zhao, C.; Parab, N.; Kantzos, C.; Pauza, J.; Fezzaa, K.; Sun, T.; Rollett, A.D. Keyhole threshold and morphology in laser melting revealed by ultrahigh-speed X-ray imaging. Science 2019, 363, 849–852. [Google Scholar] [CrossRef] [PubMed]
  63. Zhao, C.; Fezzaa, K.; Cunningham, R.W.; Wen, H.; De Carlo, F.; Chen, L.; Rollett, A.D.; Sun, T. Real-time monitoring of laser powder bed fusion process using high-speed X-ray imaging and diffraction. Sci. Rep. 2017, 7, 1–11. [Google Scholar] [CrossRef]
  64. Renken, V.; Albinger, S.; Goch, G.; Neef, A.; Emmelmann, C. Development of an adaptive, self-learning control concept for an additive manufacturing process. Cirp J. Manuf. Sci. Technol. 2017, 19, 57–61. [Google Scholar] [CrossRef]
  65. Li, X.; Siahpour, S.; Lee, J.; Wang, Y.; Shi, J. Deep learning-based intelligent process monitoring of directed energy deposition in additive manufacturing with thermal images. Procedia Manuf. 2020, 48, 643–649. [Google Scholar] [CrossRef]
  66. Clijsters, S.; Craeghs, T.; Buls, S.; Kempen, K.; Kruth, J.-P. In situ quality control of the selective laser melting process using a high-speed, real-time melt pool monitoring system. Int. J. Adv. Manuf. Technol. 2014, 75, 1089–1101. [Google Scholar] [CrossRef]
  67. Yakout, M.; Phillips, I.; Elbestawi, M.; Fang, Q. In-situ monitoring and detection of spatter agglomeration and delamination during laser-based powder bed fusion of Invar 36. Opt. Laser Technol. 2021, 136, 106741. [Google Scholar] [CrossRef]
  68. Tian, Q.; Guo, S.; Melder, E.; Bian, L.; Guo, W. Deep Learning-Based Data Fusion Method for In Situ Porosity Detection in Laser-Based Additive Manufacturing. J. Manuf. Sci. Eng. 2021, 143, 041011. [Google Scholar] [CrossRef]
  69. Craeghs, T.; Clijsters, S.; Yasa, E.; Bechmann, F.; Berumen, S.; Kruth, J.-P. Determination of geometrical factors in Layerwise Laser Melting using optical process monitoring. Opt. Lasers Eng. 2011, 49, 1440–1446. [Google Scholar] [CrossRef]
  70. Kwon, O.; Kim, H.G.; Ham, M.J.; Kim, W.; Kim, G.-H.; Cho, J.-H.; Kim, N.I.; Kim, K. A deep neural network for classification of melt-pool images in metal additive manufacturing. J. Intell. Manuf. 2020, 31, 375–386. [Google Scholar] [CrossRef]
  71. Zhang, Y.; Fuh, J.Y.; Ye, D.; Hong, G.S. In-situ monitoring of laser-based PBF via off-axis vision and image processing approaches. Addit. Manuf. 2019, 25, 263–274. [Google Scholar] [CrossRef]
  72. Repossini, G.; Laguzza, V.; Grasso, M.; Colosimo, B.M. On the use of spatter signature for in-situ monitoring of Laser Powder Bed Fusion. Addit. Manuf. 2017, 16, 35–48. [Google Scholar] [CrossRef]
  73. Colodrón, P.; Fariña, J.; Rodríguez-Andina, J.J.; Vidal, F.; Mato, J.L.; Montealegre, M.Á. Performance improvement of a laser cladding system through FPGA-based control. In Proceedings of the IECON 2011-37th Annual Conference of the IEEE Industrial Electronics Society, Melbourne, VIC, Australia, 7–10 November 2011; pp. 2814–2819. [Google Scholar]
  74. Caltanissetta, F.; Grasso, M.; Petro, S.; Colosimo, B.M. Characterization of in-situ measurements based on layerwise imaging in laser powder bed fusion. Addit. Manuf. 2018, 24, 183–199. [Google Scholar] [CrossRef]
  75. Imani, F.; Gaikwad, A.; Montazeri, M.; Rao, P.; Yang, H.; Reutzel, E. Process mapping and in-process monitoring of porosity in laser powder bed fusion using layerwise optical imaging. J. Manuf. Sci. Eng. 2018, 140, 101009. [Google Scholar] [CrossRef]
  76. Imani, F.; Chen, R.; Diewald, E.; Reutzel, E.; Yang, H. Deep learning of variant geometry in layerwise imaging profiles for additive manufacturing quality control. J. Manuf. Sci. Eng. 2019, 141, 141. [Google Scholar] [CrossRef]
  77. Zhang, C.; Gao, M.; Chen, C.; Zeng, X. Spectral diagnosis of wire arc additive manufacturing of Al alloys. Addit. Manuf. 2019, 30, 100869. [Google Scholar] [CrossRef]
  78. Song, L.; Huang, W.; Han, X.; Mazumder, J. Real-time composition monitoring using support vector regression of laser-induced plasma for laser additive manufacturing. IEEE Trans. Ind. Electron. 2016, 64, 633–642. [Google Scholar] [CrossRef]
  79. Zou, X.; Guo, L.; Shen, M.; Li, X.; Hao, Z.; Zeng, Q.; Lu, Y.; Wang, Z.; Zeng, X. Accuracy improvement of quantitative analysis in laser-induced breakdown spectroscopy using modified wavelet transform. Opt. Express 2014, 22, 10233–10238. [Google Scholar] [CrossRef] [PubMed]
  80. Shevchik, S.A.; Kenel, C.; Leinenbach, C.; Wasmer, K. Acoustic emission for in situ quality monitoring in additive manufacturing using spectral convolutional neural networks. Addit. Manuf. 2018, 21, 598–604. [Google Scholar] [CrossRef]
  81. Taheri, H. Nondestructive evaluation and in-situ monitoring for metal additive manufacturing. Ph.D. Thesis, Iowa State University, Ames, IA, USA, 2018; p. 16675. [Google Scholar]
  82. Koester, L.W.; Taheri, H.; Bond, L.J.; Faierson, E.J. Acoustic monitoring of additive manufacturing for damage and process condition determination. In Proceedings of the AIP Conference Proceedings, Burlington, VT, USA, 5–19 July 2018; p. 020005. [Google Scholar]
  83. Hossain, M.S.; Taheri, H. In Situ Process Monitoring for Additive Manufacturing Through Acoustic Techniques. J. Mater. Eng. Perform. 2020, 29, 6249–6262. [Google Scholar] [CrossRef]
  84. Okaro, I.A.; Jayasinghe, S.; Sutcliffe, C.; Black, K.; Paoletti, P.; Green, P.L. Automatic fault detection for laser powder-bed fusion using semi-supervised machine learning. Addit. Manuf. 2019, 27, 42–53. [Google Scholar] [CrossRef]
  85. Xu, F.; Dhokia, V.; Colegrove, P.; McAndrew, A.; Williams, S.; Henstridge, A.; Newman, S.T. Realisation of a multi-sensor framework for process monitoring of the wire arc additive manufacturing in producing Ti-6Al-4V parts. Int. J. Comput. Integr. Manuf. 2018, 31, 785–798. [Google Scholar] [CrossRef]
  86. Stutzman, C.B.; Nassar, A.R.; Reutzel, E.W. Multi-sensor investigations of optical emissions and their relations to directed energy deposition processes and quality. Addit. Manuf. 2018, 21, 333–339. [Google Scholar] [CrossRef]
  87. Zhang, Z.; Li, B.; Zhang, W.; Lu, R.; Wada, S.; Zhang, Y. Real-time penetration state monitoring using convolutional neural network for laser welding of tailor rolled blanks. J. Manuf. Syst. 2020, 54, 348–360. [Google Scholar] [CrossRef]
  88. Liu, W.; Liu, S.; Ma, J.; Kovacevic, R. Real-time monitoring of the laser hot-wire welding process. Opt. Laser Technol. 2014, 57, 66–76. [Google Scholar] [CrossRef]
  89. Wang, S.; Wang, Y.; Liu, C.; Mazumder, J. In-situ Monitoring on Micro-hardness of Laser Molten Zone on AISI4140 Steel by Spectral Analysis. Sci. Rep. 2020, 10, 1–12. [Google Scholar] [CrossRef]
  90. Liu, S.; Farahmand, P.; Kovacevic, R. Optical monitoring of high power direct diode laser cladding. Opt. Laser Technol. 2014, 64, 363–376. [Google Scholar] [CrossRef]
  91. Heigel, J.; Michaleris, P.; Palmer, T. In situ monitoring and characterization of distortion during laser cladding of Inconel® 625. J. Mater. Process. Technol. 2015, 220, 135–145. [Google Scholar] [CrossRef]
  92. Shevchik, S.A.; Le-Quang, T.; Farahani, F.V.; Faivre, N.; Meylan, B.; Zanoli, S.; Wasmer, K. Laser welding quality monitoring via graph support vector machine with data adaptive kernel. IEEE Access 2019, 7, 93108–93122. [Google Scholar] [CrossRef]
  93. Shevchik, S.; Le-Quang, T.; Meylan, B.; Farahani, F.V.; Olbinado, M.P.; Rack, A.; Masinelli, G.; Leinenbach, C.; Wasmer, K. Supervised deep learning for real-time quality monitoring of laser welding with X-ray radiographic guidance. Sci. Rep. 2020, 10, 1–12. [Google Scholar]
  94. Zhu, T.; Shi, Y.; Cui, S.; Cui, Y. Recognition of weld penetration during K-TIG welding based on acoustic and visual sensing. Sens. Imaging 2019, 20, 3. [Google Scholar] [CrossRef]
  95. Wu, D.; Chen, H.; He, Y.; Song, S.; Lin, T.; Chen, S. A prediction model for keyhole geometry and acoustic signatures during variable polarity plasma arc welding based on extreme learning machine. Sens. Rev. 2016, 36, 257–266. [Google Scholar] [CrossRef]
  96. Shelyagin, V.; Zaitsev, I.; Bernatskyi, A.; Sydorets, V.; Dubko, A.; Bondarenko, O. Contactless monitoring of welding processes with computer processing of acoustic emission signals. In Proceedings of the 2018 14th International Conference on Advanced Trends in Radioelecrtronics, Telecommunications and Computer Engineering (TCSET), Lviv-Slavske, Ukraine, 20–24 February 2018; pp. 706–710. [Google Scholar]
  97. Zhang, L.; Basantes-Defaz, A.C.; Ozevin, D.; Indacochea, E. Real-time monitoring of welding process using air-coupled ultrasonics and acoustic emission. Int. J. Adv. Manuf. Technol. 2019, 101, 1623–1634. [Google Scholar] [CrossRef]
  98. He, K.; Xiao, S.; Li, X. Time-frequency characteristics of acoustic emission signal for monitoring of welding structural state using Stockwell transform. J. Acoust. Soc. Am. 2019, 145, 469–479. [Google Scholar] [CrossRef] [PubMed]
  99. Lu, Q.Y.; Wong, C.H. Additive manufacturing process monitoring and control by non-destructive testing techniques: Challenges and in-process monitoring. Virtual Phys. Prototyp. 2018, 13, 39–48. [Google Scholar] [CrossRef]
  100. Aurrekoetxea, M.; López de Lacalle, L.N.; Llanos, I. Machining stresses and initial geometry on bulk residual stresses characterization by on-machine layer removal. Materials 2020, 13, 1445. [Google Scholar] [CrossRef] [Green Version]
Figure 1. Schematic diagram of the PBF process; (a) a schematic model and (b) a schematic side view of PBF process.
Applsci 11 01966 g001
Figure 2. Schematic diagram of the DED and welding processes using (a) a coaxial nozzle and (b) a material feed nozzle.
Applsci 11 01966 g002
Figure 3. Conceptual representation of (a) common anomalies and (b) defects in both metal AM and welding.
Applsci 11 01966 g003
Figure 4. Schematic diagram of a single-cladding track: H is track height, D is track depth, W is track width, and α is cladding angle.
Applsci 11 01966 g004
Table 1. Summary of numerical quality control studies of metal AM and welding.
ProcessInput Process ParametersOutcomeReferences
Metal AM
-
Laser power
-
Nozzle speed
-
Energy density
-
Cladding temperature
-
Identified the cross-section, width, and height of a single-cladding track
-
Identified the width and height formation of multiple stacked cladding tracks
[25,26,27,28,29,39,40]
-
Thermal flow
-
Laser power
-
Number of track layers
-
Increasing the track layers can cause residual stress
-
Identified the residual stress generation under multilayer stacking situations
[32,33,34,35,36,37]
Welding
-
Welding speed
-
Cooling time
-
Welding direction
-
Identified the specific section of welded area experiencing maximum residual stress and deformation
-
Identified the magnitude difference between the longitudinal and transverse residual stresses
-
Identified the influence of welding speed on the residual stress generation
[12,38,39,40,41]
-
Welding speed
-
Cooling time
-
Substrate preheating temperature
-
Welding temperature
-
Laser spot size
-
Reduced residual stress by concentrating the energy beam and substrate preheating
-
Reduced residual stress with faster welding speeds
-
Optimized the welding power, welding speed, and martensitic transformation temperature to reduce residual stress
[12,38,39,40,41,42,43,44,45]
Table 2. Classification for experimental quality control studies of metal AM and welding by utilized data.
ProcessData TypesOutcomeReference
Metal AMImage
-
Identified the melt pool, plume, spatter, and keyhole
-
Extracted quality-related features from image data
-
Identified dimensional errors of each layer
[59,60,61,62,63,64,65,66,67,68,69,70,71,72,74,75,76,86]
Plasma spectrum
-
Quantified the elemental composition
-
Identified the width of cladding tracks
-
Developed spectrum data acquisition system with wider concentration range
[3,77,78,79,84,86]
Acoustic signal
-
Identified the thermal properties of the product
-
Predicted porosity
[80,81,82,83]
WeldingImage
-
Identified the melt pool and keyhole
-
Identified distortion of the cladding track
[54,87,88,89,90,91,94,95]
Plasma spectrum
-
Quantified the elemental composition
-
Identified the keyhole occurrence
[2,89,90,92,93]
Acoustic signal
-
Identified the keyhole and spatter
-
Monitored the process temperature
-
Identified deformation, crack, and discontinuities
[54,94,95,96,97,98]
Publisher’s Note: MDPI stays neutral with regard to jurisdictional claims in published maps and institutional affiliations.

