Featured Application
Merging physiological data with ecosystem services valuation provides valuable insights into the impact of climate change in coastal salt marsh systems.
Abstract
Salt marshes are valuable ecosystems, as they provide food, shelter, and important nursery areas for fish and macroinvertebrates, and a wide variety of ecosystem services for human populations. These ecosystem services heavily rely on the floristic composition of the salt marshes with different species conferring different service values and different adaptation and resilience capacities towards ecosystem stressors. Blue carbon, nitrogen, and phosphorous stocks are no exception to this, and rely on the interspecific differences in the primary production metabolism and physiological traits. Furthermore, these intrinsic physiological characteristics also modulate the species response to any environmental stressor, such as the ones derived from ongoing global changes. This will heavily shape transitional ecosystem services, with significant changes of the ecosystem value of the salt marshes in terms of cultural, provisioning, regulating, and supporting ecosystem services, with a special emphasis on the possible alterations of the blue carbon, nitrogen, and phosphorous stocks retained in these key environments. Thus, the need to integrate plant physiological characteristics and feedbacks towards the expected climate change-driven stressors becomes evident to accurately estimate the ecosystem services of the salt marsh community, and transfer these fundamental services into economic assets, for a fluid communication of the ecosystems value to stakeholders, decision and policy makers, and environmental management entities.
1. Introduction
Estuarine and coastal transitional systems are key environments for ecosystem functions. While only occupying about 4% of total land area and 11% of oceans, they are some of the planet’s most productive ecosystems [1]. These systems have attracted human population due to their easy access to natural resources, water-promoted trade, commerce, and waste disposal [2]. This inevitably led to anthropogenic impacts in these sensitive ecosystems. Among the most significant anthropogenic impacts to these ecosystems are land reclamation, dredging, pollution (sediment discharges, hazardous substances, litter, oil spills, eutrophication), unsustainable exploitation of marine resources (sand extraction, oil and gas exploitation, fishing), unmanaged tourism, introduction of alien species, and climate change [3]. Salt marshes are some of the most important ecosystems located in these coastal areas. Worldwide, marine angiosperms such as salt marsh communities and seagrasses are of ecological value in coastal environments, forming extensive intertidal or shallow water habitats, providing food, shelter, and important nursery areas for fish and macroinvertebrates [4]. Due to these important ecological services provided by salt marsh ecosystems to coastal zones, these systems rank among the most productive and valuable ecosystems on Earth [5]. This interest in ecosystem services and its valuation in both the research and policy communities has grown rapidly [6,7]. A previous study pointed out a global value for ecosystem services of about 33 trillion USD per year (in 1995 USD), a significantly larger value than the global gross domestic product (GDP) at the time [5]. This value was later admitted to being largely underestimated and thus increased the attention on the topic [5]. From this, the total value calculated for the ecosystem services provided by coastal ecosystems of the world, including natural (terrestrial and aquatic) and human-transformed ecosystems added 25,782.53 × 109 USD per year [8], highlighting the important contribution of these ecosystems to the world budget. Salt marshes provide numerous ecosystem services, from coastal protection, flood and storm protection, water purification and flow regulation, air quality, maintenance of fisheries, seafood harvest, habitat/refugia, biological and pest control, carbon and nitrogen sequestration, and nutrient cycling, to recreational, educational, aesthetic, cultural activity, and ornamental setting values [9].
As noted, aside from pollution, eutrophication, and land claim [10], one of the major threats to salt marsh ecosystems is climate change-driven impacts, such as sea level rise, global warming, and atmospheric CO2 increase [11]. These impacts are not only stressor specific, but also have very different effects on the different halophyte species that compose salt marshes, e.g., [10,11,12,13,14]. Additionally, Atlantic and Mediterranean ecosystems present a highly variable floristic composition in terms of both species number and abundance [15], conferring even more diverse feedback to any stressor affecting these systems. Several past studies have focused on the physiological response of Atlantic and Mediterranean halophytes towards several climate change-driven stressors (such as osmotic stress to increased seawater intrusion and evaporation, warming stress, and increased atmospheric CO2), providing important insights on how each species will cope with the predicted and ongoing climatic changes, e.g., [12,16,17,18,19,20,21,22].
Similarly, salt marsh ecosystem services estimation will also depend on the species composition and diversity. Nevertheless, the majority of studies have focused on an area-based salt marsh valuation, disregarding the different services provided by different floristic inventories [9]. One of the most investigated ecosystem services provided by salt marshes is its carbon sequestration ability, commonly referred to as blue carbon sequestration [23,24,25,26]. Comparable to what happens with nutrient (nitrogen and phosphorous) sequestration, blue carbon storage is also highly dependent on the plant coverage, highlighting the need to evaluate the stock services of the ecosystem with species-specific values instead of average community values [24,27,28].
Considering these facts, the present work provides a salt marsh ecosystem valuation in the present conditions taking into account the floristic inventory of each transitional system, focusing on six Portuguese Atlantic and Mediterranean estuarine systems as case studies. Additionally, taking into account the different physiological characteristics of the halophytes and their feedback to predicted climate change stressors, the present work also aims to provide an estimate of the change in ecosystem service values under four climate change scenarios (sea level rise, increased atmospheric CO2 concentration, global warming, and increased salinization-driven osmotic stress). Although in realistic terms most of these scenarios can occur simultaneously and affect the halophytes with combined effect consequences, the present work predictions are based on physiological data available from previously published works, focusing on the physiological impacts of single stressor experiments targeting the most abundant halophyte species in the Portuguese coasts. Since literature is not available for all of the most abundant species facing combined climate change effects, the present work will focus on single exposure effects to estimate possible changes in the salt marsh vegetation coverage and ecosystem services as a tentative approach to evaluate the climate change impacts in these ecosystems. The ecosystem service values presented in these current and future scenarios intend to provide important data to be communicated to managers, stakeholders, and decision makers as tools for future management and mitigation programs focusing on salt marsh ecosystems.
2. Materials and Methods
2.1. Floristic Inventory Data
Data regarding the floristic inventory and coverage areas of the different salt marsh plant species of six Portuguese transitional systems were harvested from the Portuguese National Environmental Agency (https://apambiente.pt/) public database. These data refer to the salt marsh surveys within the scope of the Water Framework Directive (WFD) implementation in Portugal. The transitional ecosystems selected cover the Portuguese Atlantic and Mediterranean coasts (Figure 1) and a wide variety of system typologies, including different estuarine types and coastal lagoons. The characteristics of the transitional systems are displayed in Table 1. For the WFD surveys, the transitional systems were divided into water bodies according to their physicochemical characteristics. Because the objective of the present paper is to evaluate the different ecosystem services of each transitional system and its changes due to climate change, in the present work all of the areas of each species were combined by summing the coverage area of each species in each water body and thus analyzed by transitional system.
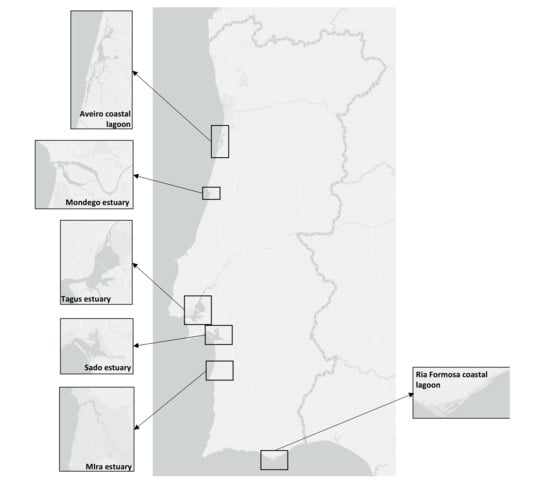
Figure 1.
Atlantic and Mediterranean estuarine systems along the Portuguese coast that were analyzed.

Table 1.
Geographical and morphodynamic characteristics of the transitional systems analyzed.
Multivariate canonical analysis of principal (CAP) components having the species coverage per waterbody as a basis was preformed using Primer 6 software [27].
2.2. Carbon, Nitrogen, and Phosphorous Retention Data
Data regarding the blue carbon, nitrogen, and phosphorous retention by halophyte species and its sediments were collected from the available bibliography, focusing on works in species also detected in the floristic data inventories. Due to the possible interpopulation differential responses to impacts of climate in the blue carbon, nitrogen, and phosphorous stocks, only studies from the Iberia bioclimatic area were considered. Species-specific values used for calculating the studied site blue stocks are given in Table 2 along with the respective bibliographic references. Data collected refer to the most abundant species detected in the floristic inventories representing coverage values above 70% in all estuarine systems.
Table 2.
Blue carbon, nitrogen, and phosphorous annual stock on a square meter basis (g m−2 y−1) for the most abundant species present in the Portuguese salt marshes [15], and respective bibliographic data sources (NA, nonavailable data).
Blue stocks for each species were calculated as:
For the calculation of each of the stocks, the average [C], [N] or [P] concentration in g m−2 y−1 was used (Table 3), multiplied by the transitional system total area of colonization (Areaspecies) of the species, in m2.
Table 3.
Salt marsh ecosystem service maximum, minimum, and average values (obtained from the maximum and minimum values) per ha per year, extracted from the referred bibliographic sources.
The value of each blue stock was calculated as:
where C, N, P Economic value is the monetary value on a mass basis, as given in Table 3.
2.3. Ecosystem Services Values
Ecosystem service values for regulating, cultural, and supporting ecosystems services was obtained from bibliographic research, as summarized in Table 3. These services are grouped into four main categories. Salt marshes are sites for cultural activities, including nonmaterial services, in the form of aesthetic values, inspiration for culture and art, spiritual experience, and cognitive development [32], due to their beauty and the pleasure they bring from the view they provide [33]. Provisioning ecosystem services result in material products that people use, and can thus vary along with geographical areas [34]. Regulating services are the source of many of the benefits from specific biogeochemical processes occurring in salt marshes, and reflect the buffer capacity of salt marshes for the transitional system where they are located [34]. Supporting services are the foundation for many of these ecosystem service categories that are necessary for the production of ecosystem services in both the provisioning and regulating categories, and do not always have a direct impact on humans [34].
Blue carbon, nitrogen, and phosphorous storage values were calculated according to bibliographic values of these stocks for the available and most abundant species, instead of using standard nonspecific values for the marsh. Data regarding the annual carbon, nitrogen, and phosphorous were harvested from the bibliography, as summarized in Table 2.
2.4. Climate Change-Induced Physiological Change Data
Four climate change scenarios were considered to calculate the future impacts of these stressors in the salt marshes floristic inventories: rising atmospheric CO2, prolonged submersion driven from sea level rise, atmospheric temperature rise driven from global warming, and osmotic stress driven from increased saltwater intrusion and soil evapotranspiration. Primary productivity-related physiological variables variation towards a control condition were extracted from the literature using WebPlotDigitizer [41] and summarized in Table 4.
Table 4.
Relative physiological impact of climate change-driven stress compared to control conditions for the most abundant species present in the Portuguese salt marshes [15], and respective bibliographic data sources (AN, net photosynthesis; α, photosynthetic efficiency; RGR, relative growth rate; PPmodel, modeled primary productivity).
The climate change stressor-driven impact on the salt marsh floristic inventory was calculated by applying the relative change percentage for a certain species in a specific scenario:
where Impacti are the values of relative change as described in Table 4. For species without available data in the literature, the average impact for a certain stressor was applied.
3. Results and Discussion
3.1. Actual Floristic Inventory of the Different Transitional Systems
Most of the surveyed systems are dominated by Halimione portulacoides, Spartina maritima, Juncus maritimus, Sarcocornia fruticosa, and Sarcocornia perennis (Figure 2). This is a common feature of several transitional systems in Portugal [15]. Nevertheless, Portuguese salt marshes present several plant species ranging from 10 to 15 of approximately 20 possible halophytic species. The high degree of combinations both in terms of the number of species but also of its relative coverage make the different surveyed transitional systems very different in terms of salt marsh communities (Figure 3). Three major transitional system clusters can be observed based on the species coverage data. This grouping pattern reflects the latitudinal differences in the communities along the Portuguese Atlantic coast. In fact, this was already observed in terms of primary productivity and physiology for some species along the Portuguese Atlantic coast [54]. The first cluster comprises the salt marsh communities from the Tagus and Sado estuaries, both located in the central part of the Atlantic coast at very similar latitudes. Both of these systems are dominated by H. portulacoides, S. perennis, and S. fruticosa, covering between 78–80% of the surveyed marshes. A second group can also be observed in the systems dominated by H. portulacoides, S. maritima, Scirpus maritimus, and J. maritimus, such as the salt marshes from Mondego and Mira estuaries and the Aveiro coastal lagoon. The last cluster is formed by the marsh communities from the Ria Formosa coastal lagoon (the only surveyed system located at the south coast of Portugal) that are dominated by a combination of S. maritima, S. fruticosa, and S. perennis, and with a lower expression of H. portulacoides coverage. These differences in coverage greatly influence not only the present-day value of the ecosystems, but also how these will change in the future due to the impacts of predicted climate change, as these are species-specific.
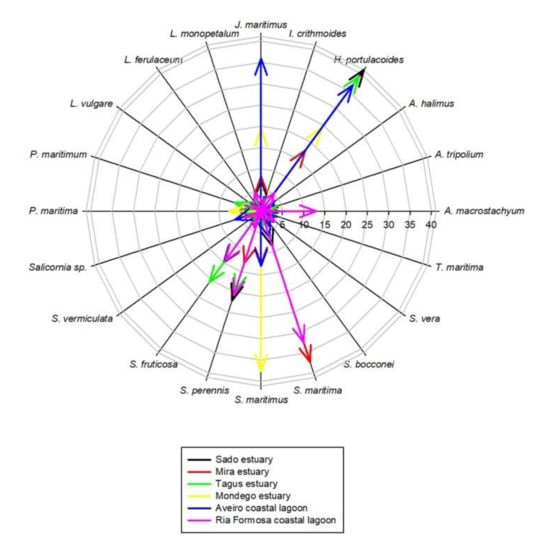
Figure 2.
Species relative abundance in the six transitional systems.
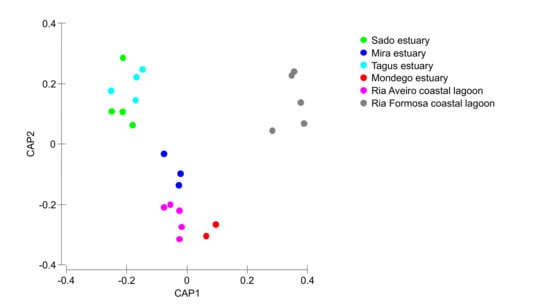
Figure 3.
Canonical analysis of principal components of the species relative coverage in the different salt marshes evaluated in the six transitional systems.
3.2. Present-Day Salt Marsh Ecosystem Services Economic Value
Considering the present-day ecosystem services value, there is also a high degree of fluctuation both in terms of system and service between systems. Supporting services (Figure 4a, Table S1) are the foundation for many ecosystem services, being essential for the production of provisioning and regulating ecosystem services. These supporting services are different from the remaining because they do not always have a direct impact on humans [1]. Ria Formosa coastal lagoon presents the higher value of the ecosystem service, followed by the Aveiro coastal lagoon and Tagus estuary due to their higher area in terms of salt marsh colonization, thus providing larger areas for species habitat, nesting, feeding areas, and refugia. These are of particular importance if we consider that these areas are essential for several migratory bird species that nest and feed in H. portulacoides and Sarcocornia sp. stands [55], but also for invertebrate species that inhabit the marsh and fish species that use these areas during high tide as feeding and shelter grounds [56]. As noted, supporting ecosystem services are intrinsically connected to provisioning services (Figure 4b, Table S1). These result in material products that people use [1], such as a wide variety of food products that come directly from these salt marsh habitats—home to a variety of wildlife that are taken both commercially and recreationally for consumption [34]. In this regard, the transitional systems evaluated have higher economic value in terms of fisheries maintenance accounting for several millions of euros per year in terms of fish capture that rely on these ecosystems. As for seafood harvest, this is also an important resource for the human economy that drives directly from salt marsh ecosystems, but in economic terms and due to the invertebrate biomass production and market value, accounts for a comparatively smaller part of the overall provisioning services. Regulating services (Figure 4c, Table S1) correspond to a higher diversity of services provided by salt marshes and account for the largest part of overall ecosystem services (approximately 78% of the overall annual budget). The most valuable ecosystem service in this category is related to the nutrient cycling capacity of the salt marshes, accounting for about 30% of the overall annual budget. In this regard, these ecosystems are key environments for recycling less bioavailable and organic nutrient forms into readily assimilated forms [57,58]. The second large part of the ecosystem services provided is composed by their ability to protect human structures against erosion (coastal protection) and severe flood and storm events, accounting for about 30% of the total annual budget of the transitional systems. These services are often evaluated through the equivalent costs to create living shorelines along coastal areas to determine a value for shoreline stabilization, rather than hard armoring [34]. Among the top-ranked regulating ecosystem services is the water purification capacity of these ecosystems (approximately 9% of the overall annual budget). Salt marshes are known to act as kidneys of the transitional ecosystems [59], being able to retain pollutants [60,61]. Values for pollution buffering were assessed on an entire salt marsh basis, as there are very few data available for filtering rates specific to habitat types or specific pollutants [34]. Thus, the values used are based in the economic annual value on an areal basis, based in the benefit transfer and avoided cost methodologies when compared to the use of wastewater facilities or other remediation methodologies [34]. Considering the blue carbon, nitrogen, and phosphorous values of the ecosystems considered, and although these are not by far the most valuable ones in economic terms, these acquire a reinforced role when considering the stocks themselves. The blue stock values of the ecosystems considered account for about 8–12% of the overall ecosystems service value. Due to the different phenological characteristics, life forms, and metabolisms of the different halophytes for the calculation of the carbon, nitrogen, and phosphorous stock and economic values, in the present work, instead of applying a common monetary value on an area basis, a value based in the carbon, nitrogen, and phosphorous value per unit of plant mass was applied, thus allowing incorporation of the different stocking abilities of the different species (considering the most abundant species to which data were available). Blue stocks storage in the different ecosystems surveyed relies to a large extent with the species composition and abundance (Figure 5). Plants with C4 photosynthetic metabolism (such as S. maritma) tend to accumulate higher amounts of carbon in their tissues and sediments [30], but are less abundant in the estuarine systems surveyed and the overall Portuguese transitional systems [15]. Thus, blue carbon storage in the surveyed ecosystems depends more on the species composition rather than on its extent, although, of course, the marsh dimensions also play a role in the blue stocks storage of the systems. This is visible when comparing the tendency in the majority of the ecosystem services with the tendencies observed in the blue stock, for example, between the Tagus estuary and Aveiro coastal lagoon. Although the Tagus estuary has a smaller salt marsh area than the Aveiro coastal lagoon, it presents a higher productivity in terms of blue stocks (Figure 5). When considering the remaining ecosystem services, which are calculated on an area basis disregarding the species composition, Aveiro coastal lagoon presents higher economic value for its ecosystem services. Thus, systems with higher percent coverage of C4 species such as S. maritima, are inevitably more productive as it is possible to observe for the Ria Formosa coastal lagoon. Moreover, nonwoody succulent and grass-type plants such as S. perennis and S. maritima have higher carbon storage capacities and thus its coverage influence greatly the overall blue stock value (Figure 5). The values obtained here are higher but comparable to previous work where not all the different carbon storage capacities of the different species are considered [24]. On average, using a per-acre value of carbon disregarding the species composition and different carbon storage abilities induces about 10% overestimation on the blue carbon, nitrogen, and phosphorous stocks (data not shown), which can be translated into several tons per year. Although blue phosphorous stocks in terms stored mass are reduced when compared to the blue carbon and nitrogen stocks, due to the high economical costs of technological phosphorous removal, this constitutes a large economic contribution to the overall ecosystem services [40]. Comparably, blue carbon stocks are valued through the European Emission Trading System (ETS), having as base the carbon emission reduction (CER) price, a reduced value when compared to the P or N removal costs [38]. Other regulating ecosystem services also represent an added value to these ecosystems, although in a smaller extent, such as improving the air quality, water flow regulation, and biological pest control, and account for less than 1% for the overall ecosystem services annual budget. Lastly, salt marshes also provide important cultural ecosystem services in the form of aesthetic values, inspiration for culture and art, spiritual experience, and cognitive development [32], accounting for approximately 4.5% of the ecosystem value of the transitional systems surveyed. Within this category, the highest contribution comes from the marsh aesthetic value. Aesthetic value is often obtained from the improvements or degradations of a natural area and how individuals perceive those changes [62]. These aesthetic services account for approximately 50% of the overall cultural services provided by the surveyed salt marshes (Figure 4d, Table S1). Another significant amount of monetary income can be withdrawn from salt marshes due to the recreational services provided by these areas that represent approximately 44% of the overall cultural services provided by the surveyed salt marshes. These services include outdoor recreation, nature observation, and ecotourism, all of them relying on a healthy and functioning salt marsh habitat necessary for enjoyment [34]. A last but still comparably significant part of the cultural ecosystem services provided are the ornamental services (representing 4.3% of the annual ecosystem service budget; Figure 4d, Table S1). Ornamental resources are related to the flora/fauna within a certain natural ecosystem that has the potential to provide ornamental use, such as shells, driftwood, or flowers that can serve a variety of purposes (sold as souvenirs, made into jewelry, crafted into clothing) [32,34].
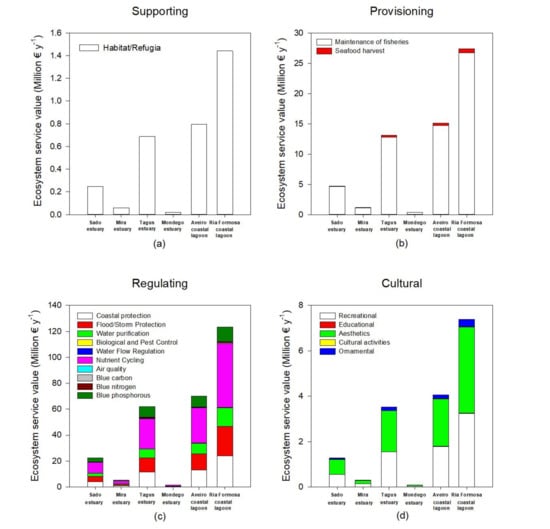
Figure 4.
Present-day values for supporting (a), provisioning (b), regulating (c), and cultural (d) ecosystem services in the six transitional systems.
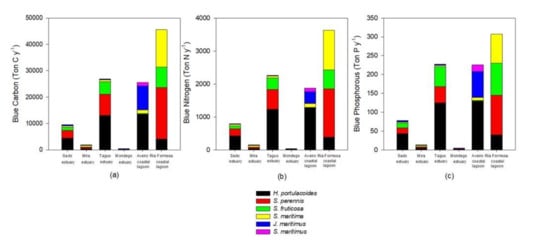
Figure 5.
Blue carbon (a), nitrogen (b), and phosphorous (c) annual sequestration by the most abundant species in the salt marshes of the six transitional systems.
3.3. Climate Change Impact on Salt Marsh Composition and Ecosystem Services
Considering the data available in the literature regarding the impacts of climate change on the primary production, and thus biomass and coverage area, it becomes evident that different climate change scenarios will have different impacts on the different salt marshes depending on the species abundance (Figure 6, Table 5). Halimione portulacoides appears as the species more affected by the climate change scenarios considered, with an average reduction of 37% of its primary productivity. Thus, systems with a lower presence of this species (such as the Ria Formosa coastal lagoon), will be less impacted in the future by the climate change scenarios considered. As most of the system is dominated by plant species with a C3 photosynthetic metabolism, there is an apparent increase in salt marsh coverage under a CO2 rise scenario. Underlying this fact is the physiological characteristics of C3 metabolism, which under present-day atmospheric CO2 concentration is not completely saturated and can thus still be improved under higher atmospheric CO2 concentrations [14,16]. On the other hand, systems dominated by C4 halophytes (such as S. maritima) will have a minor increase in its coverage, as C4 photosynthesis evolved to be at its maximum saturation rates under present-day atmospheric CO2 conditions and thus no primary production improvement will result from rising atmospheric CO2 and, in fact, can result in a stress condition for these C4 halophytes [14,16]. This is observed in the Ria Formosa coastal lagoon salt marsh abundance (Table 5) and species coverage change (Figure 6). Nevertheless, it is important to notice that all of the scenarios considered were applied individually and, e.g., the expected atmospheric CO2 rise is known to be accompanied by an increase in atmospheric temperature, which might balance this apparent increase in salt marsh area due to increased atmospheric CO2. On the other hand, salt marshes dominated by low marsh species, such as S. maritima and S. perennis, are expected to have lower impacts from prolonged submersion driven from the expected sea level rise. This is the case of the Sado estuary and Ria Formosa coastal lagoon (Table 5, Figure 6), due to the natural adaptation of these low marsh species to tidal submersion and its physiological mechanisms to overcome this potentially stressful condition [12,53]. Regarding thermal stress driven from increased global warming, it is expected to have similar effects in all systems as the species more affected by this condition (A. tripolium and Salicornia sp.), although among the most abundant species in the Portuguese estuarine systems, have a comparatively reduced coverage when compared to the remaining high-coverage species (Figure 6). Osmotic stress resulting from increased saltwater intrusion, soil salinization, and increased evapotranspiration due to global warming has a more pronounced effect in the middle and upper marsh species [49,52]. Thus, except for the Ria Formosa coastal lagoon, the majority of the transitional systems evaluated are dominated by woody succulent chenopods (Figure 6) that naturally inhabit the upper areas of the marsh that are less prone to submersion, but more affected by sediment evapotranspiration. These floristic inventories make these systems more prone to reductions of the primary productivity driven from increased osmotic stress driven from salinization and reduced water availability [48,51].
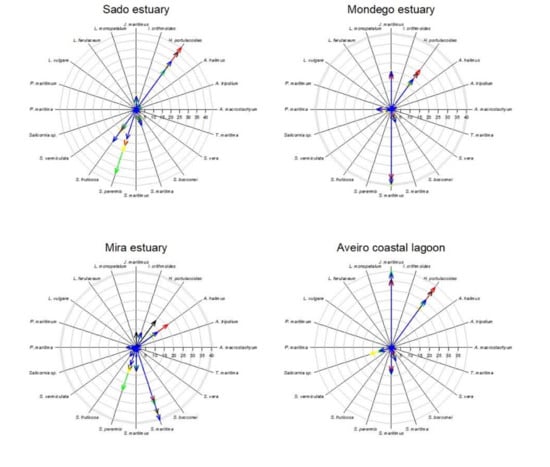
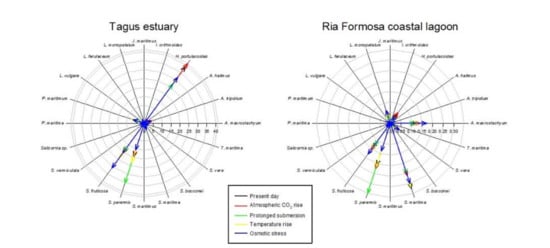
Figure 6.
Species relative abundance (%) in the salt marshes of the transitional systems analyzed under present-day conditions and in the five climate change scenarios considered.
Table 5.
Relative salt marsh coverage area changes in the different transitional systems, compared to the present-day conditions.
As noted, the climate change scenarios evaluated have differential impacts on the halophyte species according to their physiological characteristics, and thus inevitably differential impacts on the ecosystem services, depending on the transitional system floristic inventory. Being directly connected to the species primary productivity, the blue carbon, nitrogen, and phosphorous stocks will be one of the most affected ecosystem services due to climate change (Figure 7). As noted, for most cases, atmospheric CO2 rise results in higher primary productivity for the majority of species, increasing species ability to allocate carbon, nitrogen, and phosphorous in its biomass and sediments. This is in agreement with the physiological data available for C3 halophyte species, where increased atmospheric CO2 results in an increase in the biomass carbon content [14,16]. Except for the Ria Formosa coastal lagoon, all the blue carbon stocks will be affected negatively under the remaining climate change scenarios that are considered (Figure 7). The higher percentage of species highly adapted to submersion and underwater photosynthesis [12,20,53] allows the Ria Formosa system to have a high blue carbon stock under a prolonged submersion (due to sea level rise) scenario. The same could be observed for blue nitrogen and phosphorous stocks, driven from this strong ability to maintain high primary production rates, even under prolonged submersion periods (Figure 7). Regarding the different stressor effects on the blue stocks, it can be observed that as previously mentioned for the species coverage, osmotic stress will have the most profound impact in the salt marsh stocks.
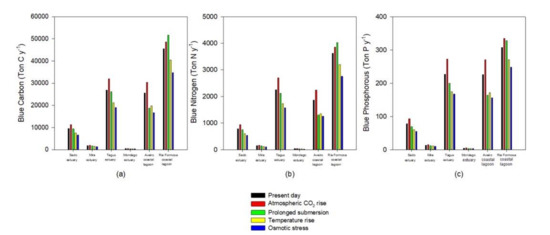
Figure 7.
Blue carbon (a), nitrogen (b), and phosphorous (c) annual sequestration by the most abundant species in the salt marshes of the six transitional systems under present-day conditions and in the five climate change scenarios considered.
If the whole ecosystem service value is considered, a similar tendency can be observed (Figure 8). Since most of the ecosystem services are evaluated having as a basis a cost per unit of salt marsh area, the value of the transitional systems tends to increase under rising atmospheric CO2, driven from a higher salt marsh coverage (Figure 8). This was also reported by previous studies [63] using modeling approaches, suggesting that the net impact of climate change will be to increase carbon burial rates in the first half of the twenty-first century. Nevertheless, if the value of the ecosystem services is calculated having as a basis a value per square meter of salt marsh, the negative effects of climate change in the salt marsh ecosystem services are exacerbated. The average value per square meter tends to decrease either by a reduction of the colonization area through a reduction of the primary productivity of the species or due to an increased area due to higher productivity of a certain species (e.g., under rising atmospheric CO2) and a consequent dilution of the ecosystem value into a larger area, that does not all benefit from the enhancing stressor. This valuation can be taken into account not only for ecological economics purposes but also to assess the system resilience or susceptibility to climate change. At this level, the Sado estuary (Figure 8a) seems to be the system that will be more negatively impacted by the climate change scenarios considered, presenting the highest losses in terms of ecosystem services value, followed by the Aveiro coastal lagoon and the Mira and Mondego estuaries (Figure 8d,b,c, respectively). As previously noted, this is inherent to the marsh’s floristic inventories and abundance and how the most abundant species in these ecosystems will cope with climate change. On the other hand, the Ria Formosa coastal lagoon appears to have an overall reduction of the system value (Figure 8f, ecosystem annual value). Nevertheless, if the ecosystem services value on a square meter basis (Figure 8f) is considered, it appears that this system has a high resilience towards climate change. Again, this derives from the dominance of low marsh species observed in this transitional system, more resilient to many climate change-induced stressors [12,53].
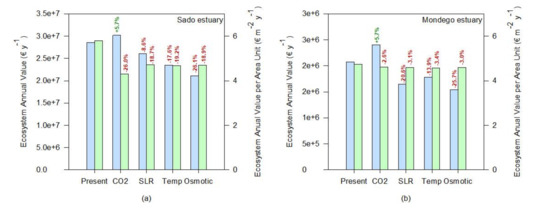
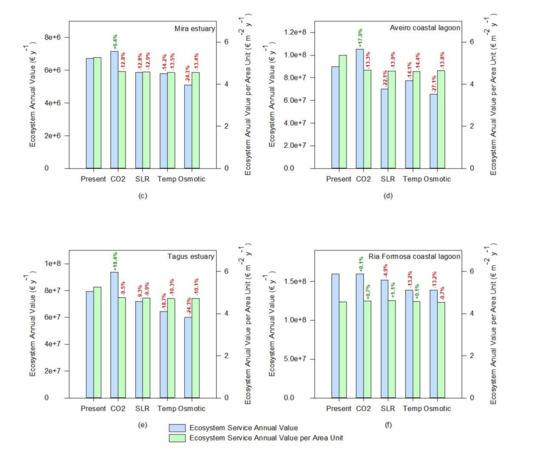
Figure 8.
Ecosystem annual values and relative change toward the present conditions under expectable climate change scenarios (CO2—rising atmospheric CO2; SLR—prolonged submersion; Temp—temperature rise; Osmotic—osmotic stress) of the salt marshes of the six transitional systems considered: (a)—Sado estuary, (b)—Mondego estuary, (c)—Mira estuary, (d)—Aveiro coastal lagoon, (e)—Tagus estuary, (f)—Ria Formosa coastal lagoon).
4. Conclusions
Salt marsh ecosystem services heavily rely on the floristic inventory of the transitional system where they are located, conferring different ecosystem service values to the different transitional systems located along the Portuguese coasts. Blue carbon, nitrogen, and phosphorous stocks are no exception to this and depend on the species primary production metabolism and physiological traits, and the transitional system species coverage. Because of the differential effects of the different climate change scenarios expected and according to the species physiological feedbacks, this multitude of specificities will inevitably shape the future of salt marsh ecosystem services. Therefore, the need is evident to integrate plant physiological traits and feedbacks toward a considered and expected stressor to properly evaluate the ecosystem services of the salt marsh community, and translate these essential services into economic value, for proper communication of these ecosystems value to stakeholders, decision and policy makers, and environmental management entities.
Supplementary Materials
The following are available online at https://www.mdpi.com/2076-3417/11/4/1969/s1, Table S1: Ecosystem service values in each of the transitional systems surveyed and total ecosystem annual value, and on an area basis considering the total salt marsh area of each ecosystem.
Author Contributions
Conceptualization, B.D. and I.C.; methodology, B.D.; formal analysis, B.D.; data curation, B.D.; writing—original draft preparation, B.D.; writing—review and editing, I.C. and J.C.; project administration, B.D.; funding acquisition, B.D. All authors have read and agreed to the published version of the manuscript.
Funding
This study had the support of Fundação para a Ciência e a Tecnologia (FCT) via UIDB/04292/2020 and by the Mar2020 Program through the Projects RESTAURA2020 (contract 16-01-04-FMP-0014) and ReSEt (contract 16-01-04-FMP-0026). BD was funded by FCT researcher contract (CEECIND/00511/2017).
Institutional Review Board Statement
Not applicable.
Informed Consent Statement
Not applicable.
Data Availability Statement
Species coverage base data is available in the Portuguese National Environmental Agency (https://apambiente.pt/) public database.
Conflicts of Interest
The authors declare no conflict of interest.
References
- UNEP. Marine and Coastal Ecosystems and Human Well-Being: A Synthesis Report Based on the Findings of the Millennium Ecosystem Assessment; UNEP: Nairobi, Kenya, 2006. [Google Scholar]
- Borja, A.; Dauer, D.M. Assessing the environmental quality status in estuarine and coastal systems: Comparing methodologies and indices. Ecol. Indic. 2008, 8, 331–337. [Google Scholar] [CrossRef]
- Borja, A.; Bricker, S.B.; Dauer, D.M.; Demetriades, N.T.; Ferreira, J.G.; Forbes, A.T.; Hutchings, P.; Jia, X.; Kenchington, R.; Marques, J.C.; et al. Overview of integrative tools and methods in assessing ecological integrity in estuarine and coastal systems worldwide. Mar. Pollut. Bull. 2008, 56, 1519–1537. [Google Scholar] [CrossRef]
- Hemminga, M.A.; Duarte, C.M. Seagrass Ecology; Cambridge University Press: Cambridge, UK, 2000; ISBN 978-0-52166-184-3. [Google Scholar]
- Costanza, R.; De Groot, R.; Sutton, P.; van der Ploeg, S.; Anderson, S.J.; Kubiszewski, I.; Farber, S.; Turner, R.K. Changes in the global value of ecosystem services. Glob. Environ. Change 2014, 26, 152–158. [Google Scholar] [CrossRef]
- Braat, L.C.; De Groot, R. The ecosystem services agenda:bridging the worlds of natural science and economics, conservation and development, and public and private policy. Ecosyst. Serv. 2012, 1, 4–15. [Google Scholar] [CrossRef]
- Costanza, R.; Kubiszewski, I. The authorship structure of “ecosystem services” as a transdisciplinary field of scholarship. Ecosyst. Serv. 2012, 1, 16–25. [Google Scholar] [CrossRef]
- Martínez, M.L.; Intralawan, A.; Vázquez, G.; Pérez-Maqueo, O.; Sutton, P.; Landgrave, R. The coasts of our world: Ecological, economic and social importance. Ecol. Econ. 2007, 63, 254–272. [Google Scholar] [CrossRef]
- Barbier, E.B.; Hacker, S.D.; Kennedy, C.; Koch, E.W.; Stier, A.C.; Silliman, B.R. The value of estuarine and coastal ecosystem services. Ecol. Monogr. 2011, 81, 169–193. [Google Scholar] [CrossRef]
- Duarte, B.; Neto, J.M.; Marques, J.C.; Adams, J.B.; Caçador, I. Marine angiosperm indices used to assess ecological status within the Water Framework Directive and South African National Water Act: Learning from differences and common issues. Ecol. Indic. 2017, 83, 192–200. [Google Scholar] [CrossRef]
- Caçador, I.; Duarte, B.; Marques, J.C. Climate Change Impacts on Salt Marsh Vegetation Ecophysiology. In Sabkha Ecosystems: Volume VI: Asia/Pacific; Gul, B., Böer, B., Khan, M.A., Clüsener-Godt, M., Hameed, A., Eds.; Springer International Publishing: Cham, Switzerland, 2019; pp. 189–206. ISBN 978-3-030-04417-6. [Google Scholar]
- Duarte, B.; Santos, D.; Marques, J.C.; Caçador, I. Biophysical probing of Spartina maritima photo-system II changes during prolonged tidal submersion periods. Plant Physiol. Biochem. 2014, 77, 122–132. [Google Scholar] [CrossRef] [PubMed]
- Duarte, B.; Marques, J.C.C.; Caçador, I. Ecophysiological response of native and invasive Spartina species to extreme temperature events in Mediterranean marshes. Biol. Invasions 2016, 18, 2189–2205. [Google Scholar] [CrossRef]
- Duarte, B.; Santos, D.; Silva, H.; Marques, J.C.C.; Caçador, I. Photochemical and biophysical feedbacks of C₃ and C₄ Mediterranean halophytes to atmospheric CO₂ enrichment confirmed by their stable isotope signatures. Plant Physiol. Biochem. PPB 2014, 80, 10–22. [Google Scholar] [CrossRef]
- Caçador, I.; Neto, J.M.; Duarte, B.; Barroso, D.V.; Pinto, M.; Marques, J.C. Development of an Angiosperm Quality Assessment Index (AQuA-Index) for ecological quality evaluation of Portuguese water bodies—A multi-metric approach. Ecol. Indic. 2013, 25, 141–148. [Google Scholar] [CrossRef]
- Pérez-Romero, J.A.; Idaszkin, Y.L.; Duarte, B.; Baeta, A.; Marques, J.C.; Redondo-Gómez, S.; Caçador, I.; Mateos-Naranjo, E. Atmospheric CO 2 enrichment effect on the Cu-tolerance of the C 4 cordgrass Spartina densiflora. J. Plant Physiol. 2018, 220, 155–166. [Google Scholar] [CrossRef]
- Pérez-Romero, J.A.; Duarte, B.; Barcia-Piedras, J.-M.; Matos, A.R.; Redondo-Gómez, S.; Caçador, I.; Mateos-Naranjo, E. Investigating the physiological mechanisms underlying Salicornia ramosissima response to atmospheric CO2 enrichment under coexistence of prolonged soil flooding and saline excess. Plant Physiol. Biochem. 2019, 135, 149–159. [Google Scholar] [CrossRef] [PubMed]
- Pérez-Romero, J.A.; Idaszkin, Y.L.; Barcia-Piedras, J.-M.; Duarte, B.; Redondo-Gómez, S.; Caçador, I.; Mateos-Naranjo, E. Disentangling the effect of atmospheric CO2 enrichment on the halophyte Salicornia ramosissima J. Woods physiological performance under optimal and suboptimal saline conditions. Plant Physiol. Biochem. 2018, 127, 617–629. [Google Scholar] [CrossRef]
- Couto, T.; Martins, I.; Duarte, B.; Caçador, I.; Marques, J.C. Modelling the effects of global temperature increase on the growth of salt marsh plants. Appl. Ecol. Environ. Res. 2014, 12, 753–764. [Google Scholar] [CrossRef]
- Duarte, B.; Santos, D.; Silva, H.; Marques, J.C.; Caçador, I.; Sleimi, N. Light–dark O2 dynamics in submerged leaves of C3 and C4 halophytes under increased dissolved CO2: Clues for saltmarsh response to climate change. AoB Plants 2014, 6, 1–15. [Google Scholar] [CrossRef] [PubMed]
- Duarte, B.; Santos, D.; Marques, J.C.; Caçador, I. Impact of heat and cold events on the energetic metabolism of the C3 halophyte Halimione portulacoides. Estuar. Coast. Shelf Sci. 2015, 167, 166–177. [Google Scholar] [CrossRef]
- Duarte, B.; Matos, A.R.; Caçador, I. Photobiological and lipidic responses reveal the drought tolerance of Aster tripolium cultivated under severe and moderate drought: Perspectives for arid agriculture in the mediterranean. Plant Physiol. Biochem. 2020, 154, 304–315. [Google Scholar] [CrossRef] [PubMed]
- Himes-Cornell, A.; Pendleton, L.; Atiyah, P. Valuing ecosystem services from blue forests: A systematic review of the valuation of salt marshes, sea grass beds and mangrove forests. Ecosyst. Serv. 2018, 30, 36–48. [Google Scholar] [CrossRef]
- Sousa, A.I.; Santos, D.B.; Da Silva, E.F.; Sousa, L.P.; Cleary, D.F.R.; Soares, A.M.V.M.; Lillebø, A.I. “Blue Carbon” and Nutrient Stocks of Salt Marshes at a Temperate Coastal Lagoon (Ria de Aveiro, Portugal). Sci. Rep. 2017, 7, 1–11. [Google Scholar] [CrossRef] [PubMed]
- Luisetti, T.; Jackson, E.L.; Turner, R.K. Valuing the European “coastal blue carbon” storage benefit. Mar. Pollut. Bull. 2013, 71, 101–106. [Google Scholar] [CrossRef] [PubMed]
- McLeod, E.; Chmura, G.L.; Bouillon, S.; Salm, R.; Björk, M.; Duarte, C.M.; Lovelock, C.E.; Schlesinger, W.H.; Silliman, B.R. A blueprint for blue carbon: Toward an improved understanding of the role of vegetated coastal habitats in sequestering CO2. Front. Ecol. Environ. 2011, 9, 552–560. [Google Scholar] [CrossRef]
- Clarke, K.R.; Gorley, R.N. PRIMER v6: User Manual/Tutorial; PRIMER: Plymouth, UK, 2006; 192p. [Google Scholar]
- Sousa, A.I.; Lillebø, A.I.; Pardal, M.A.; Caçador, I. Productivity and nutrient cycling in salt marshes: Contribution to ecosystem health. Estuar. Coast. Shelf Sci. 2010, 87, 640–646. [Google Scholar] [CrossRef]
- Caçador, I.; Costa, A.L.A.L.; Vale, C. Carbon storage in tagus salt marsh sediments. Water Air Soil Pollut. Focus 2004, 4, 701–714. [Google Scholar]
- Couto, T.; Duarte, B.; Caçador, I.; Baeta, A.; Marques, J.C. Salt marsh plants carbon storage in a temperate Atlantic estuary illustrated by a stable isotopic analysis based approach. Ecol. Indic. 2013, 32, 305–311. [Google Scholar] [CrossRef]
- Curado, G.; Rubio-Casal, A.E.; Figueroa, E.; Grewell, B.J.; Castillo, J.M. Native plant restoration combats environmental change: Development of carbon and nitrogen sequestration capacity using small cordgrass in European salt marshes. Environ. Monit. Assess. 2013, 185, 8439–8449. [Google Scholar] [CrossRef]
- De Groot, R.; Brander, L.; van der Ploeg, S.; Costanza, R.; Bernard, F.; Braat, L.; Christie, M.; Crossman, N.; Ghermandi, A.; Hein, L.; et al. Global estimates of the value of ecosystems and their services in monetary units. Ecosyst. Serv. 2012, 1, 50–61. [Google Scholar] [CrossRef]
- De Groot, R.; Stuip, M.; Finlayson, M.; Davidson, N. Valuing Wetlands: Guidance for Valuing the Benefits Derived from Wetland Ecosystem Services; International Water Management Institute: Montreal, QC, Canada, 2006. [Google Scholar]
- Ballard, J.; Pezda, J. Devin Spencer an Economic Valuation of Southern California Coastal Wetlands; Bren School of Environmental Science and Management: Santa Barbara, CA, USA, 2017. [Google Scholar]
- Saleh, Z.; Menassa, J.; Abbas, O.; Atweh, S.; Arayssi, T. Cranial nerve VI palsy as a rare initial presentation of systemic lupus erythematosus: Case report and review of the literature. Lupus 2010, 19, 201–205. [Google Scholar] [CrossRef] [PubMed]
- De Groot, R.S.; Wilson, M.A.; Boumans, R.M.J. A typology for the classification, description and valuation of ecosystem functions, goods and services. Ecol. Econ. 2002, 41, 393–408. [Google Scholar] [CrossRef]
- Purcell, A.D.; Khanal, P.; Straka, T.; Willis, D.B. Valuing Ecosystem Services of Coastal Marshes and Wetlands; Clemson Cooperative Extension, Land-Grant Press by Clemson Extension: Clemson, SC, USA, 2020. [Google Scholar]
- Chmura, G.L.; Anisfeld, S.C.; Cahoon, D.R.; Lynch, J.C. Global carbon sequestration in tidal, saline wetland soils. Glob. Biogeochem. Cycles 2003, 17. [Google Scholar] [CrossRef]
- Brady, M.V.; Hristov, J.; Wilhelmsson, F.; Hedlund, K. Roadmap for Valuing Soil Ecosystem Services to Inform Multi-Level Decision-Making in Agriculture. Sustainability 2019, 11, 5285. [Google Scholar] [CrossRef]
- Van der Schatte Olivier, A.; Jones, L.; Le Vay, L.; Christie, M.; Wilson, J.; Malham, S.K. A global review of the ecosystem services provided by bivalve aquaculture. Rev. Aquac. 2020, 12, 3–25. [Google Scholar] [CrossRef]
- Rohatgi, A. WebPlotDigitizer 2015. Available online: http://arohatgi.info/WebPlotDigitizer/ (accessed on 22 February 2021).
- Geissler, N.; Hussin, S.; Koyro, H.W. Interactive effects of NaCl salinity and elevated atmospheric CO2 concentration on growth, photosynthesis, water relations and chemical composition of the potential cash crop halophyte Aster tripolium L. Environ. Exp. Bot. 2009, 65, 220–231. [Google Scholar] [CrossRef]
- Neto, D.; Carvalho, L.M.; Cruz, C.; Martins-Loução, M.A. How do Mycorrhizas Affect C and N Relationships in Flooded Aster tripolium Plants? Plant Soil 2006, 279, 51–63. [Google Scholar] [CrossRef]
- Cott, G.M.; Reidy, D.T.; Chapman, D.V.; Jansen, M.A.K. Waterlogging affects the distribution of the saltmarsh plant Atriplex portulacoides (L.) Aellen. Flora Morphol. Distrib. Funct. Ecol. Plants 2013, 208, 336–342. [Google Scholar] [CrossRef]
- Duarte, B.; Goessling, J.W.; Marques, J.C.; Caçador, I. Ecophysiological constraints of Aster tripolium under extreme thermal events impacts: Merging biophysical, biochemical and genetic insights. Plant Physiol. Biochem. 2015, 97, 217–228. [Google Scholar] [CrossRef] [PubMed]
- Pérez-Romero, J.A.; Barcia-Piedras, J.-M.; Redondo-Gómez, S.; Mateos-Naranjo, E. Impact of short-term extreme temperature events on physiological performance of Salicornia ramosissima J. Woods under optimal and sub-optimal saline conditions. Sci. Rep. 2019, 9, 659. [Google Scholar] [CrossRef] [PubMed]
- Duarte, B.; Cabrita, M.T.; Gameiro, C.; Matos, A.R.A.R.; Godinho, R.; Marques, J.C.; Caçador, I. Disentangling the photochemical salinity tolerance in Aster tripolium L.: Connecting biophysical traits with changes in fatty acid composition. Plant Biol. 2017, 19, 239–248. [Google Scholar] [CrossRef]
- Redondo-Gomez, S.; Mateos-Naranjo, E.; Davy, A.J.; Fernandez-Munoz, F.; Castellanos, E.M.; Luque, T.; Figueroa, M.E. Growth and Photosynthetic Responses to Salinity of the Salt-marsh Shrub Atriplex portulacoides. Ann. Bot. 2007, 100, 555–563. [Google Scholar] [CrossRef]
- Duarte, B.; Santos, D.; Marques, J.C.; Caçador, I. Ecophysiological adaptations of two halophytes to salt stress: Photosynthesis, PS II photochemistry and anti-oxidant feedback–Implications for resilience in climate change. Plant Physiol. Biochem. 2013, 67, 178–188. [Google Scholar] [CrossRef] [PubMed]
- Redondo-Gómez, S.; Wharmby, C.; Castillo, J.M.; Mateos-Naranjo, E.; Luque, C.J.; de Cires, A.; Luque, T.; Davy, A.J.; Enrique Figueroa, M. Growth and photosynthetic responses to salinity in an extreme halophyte, Sarcocornia fruticosa. Physiol. Plant. 2006, 128, 116–124. [Google Scholar] [CrossRef]
- Mateos-Naranjo, E.; Redondo-Gómez, S.; Andrades-Moreno, L.; Davy, A.J. Growth and photosynthetic responses of the cordgrass Spartina maritima to CO2 enrichment and salinity. Chemosphere 2010, 81, 725–731. [Google Scholar] [CrossRef] [PubMed]
- Redondo-Gomez, S.; Mateos-Naranjo, E.; Figueroa, M.E.; Davy, A.J. Salt stimulation of growth and photosynthesis in an extreme halophyte, Arthrocnemum macrostachyum. Plant Biol. 2010, 12, 79–87. [Google Scholar] [CrossRef] [PubMed]
- Adams, J.B.; Bate, G.C. The effect of salinity and inundation on the estuarine macrophyte Sarcocornia perennis (Mill.) A.J. Scott. Aquat. Bot. 1994, 47, 341–348. [Google Scholar] [CrossRef]
- Duarte, B.; Couto, T.; Freitas, J.; Valentim, J.; Silva, H.; Marques, J.C.; Dias, J.M.; Caçador, I. Abiotic modulation of Spartina maritima photobiology in different latitudinal populations. Estuar. Coast. Shelf Sci. 2013, 130, 127–137. [Google Scholar] [CrossRef]
- Teixeira, A.; Duarte, B.; Caçador, I. Sabkha Ecosystems: Volume IV: Cash Crop Halophyte and Biodiversity Conservation. In Tasks for Vegetation Science; Khan, M.A., Böer, B., Böztürk, M., Al Abdessalaam, T.Z., Clüsener-Godt, M., Gul, B., Eds.; Springer: Dordrecht, The Netherlands, 2014; Volume 47, ISBN 978-94-007-7410-0. [Google Scholar]
- França, S.; Vinagre, C.; Caçador, I.; Cabral, H.N. Heavy metal concentrations in sediment, benthic invertebrates and fish in three salt marsh areas subjected to different pollution loads in the Tagus Estuary (Portugal). Mar. Pollut. Bull. 2005, 50, 998–1003. [Google Scholar] [CrossRef]
- Freitas, J.; Duarte, B.; Caçador, I. Biogeochemical drivers of phosphatase activity in salt marsh sediments. J. Sea Res. 2014, 93, 57–62. [Google Scholar] [CrossRef]
- Sousa, A.I.; Lillebø, A.I.; Risgaard-Petersen, N.; Pardal, M.A.; Caçador, I. Denitrification: An ecosystem service provided by salt marshes. Mar. Ecol. Prog. Ser. 2012, 448, 79–92. [Google Scholar] [CrossRef]
- Mitsch, W.J.; Gosselink, J.G. Wetlands, 5th ed.; John Wiley and Sons Inc: New York, NY, USA, 2015; ISBN 978-1118676820. [Google Scholar]
- Caçador, I.; Caetano, M.; Duarte, B.; Vale, C. Stock and losses of trace metals from salt marsh plants. Mar. Environ. Res. 2009, 67, 75–82. [Google Scholar] [CrossRef]
- Duarte, B.; Caetano, M.; Almeida, P.R.; Vale, C.; Caçador, I. Accumulation and biological cycling of heavy metal in four salt marsh species, from Tagus estuary (Portugal). Environ. Pollut. 2010, 158, 1661–1668. [Google Scholar] [CrossRef] [PubMed]
- Farber, S.; Costanza, R.; Childers, D.L.; Erickson, J.; Gross, K.; Grove, M.; Hopkinson, C.S.; Kahn, J.; Pincetl, S.; Troy, A.; et al. Linking ecology and economics for ecosystem management. Bioscience 2006, 56, 121–133. [Google Scholar] [CrossRef]
- Kirwan, M.L.; Mudd, S.M. Response of salt-marsh carbon accumulation to climate change. Nature 2012, 489, 550–553. [Google Scholar] [CrossRef]


Publisher’s Note: MDPI stays neutral with regard to jurisdictional claims in published maps and institutional affiliations. |
© 2021 by the authors. Licensee MDPI, Basel, Switzerland. This article is an open access article distributed under the terms and conditions of the Creative Commons Attribution (CC BY) license (http://creativecommons.org/licenses/by/4.0/).