Abstract
Wet joints are widely used in precast steel–concrete composite bridges to accelerate the construction of bridges, though a conventional wet joint usually has a poor ultimate shear capacity. To improve the shear capacity of the wet joint, a concave square frustum-shaped wet joint was proposed, and the failure modes and ultimate shear capacity were studied experimentally and numerically. Specimens with concave square frustum-shaped and conventional wet joints (labeled as S-SWJ and S-CWJ) were fabricated, and experiments were performed on them. The results showed that the ultimate shear capacity of S-SWJ was substantially enhanced compared to that of S-CWJ. To further explore the ultimate shear capacity of S-SWJ, the failure modes and the influences of concrete strength and shear key angle on the ultimate shear capacity were studied using a validated finite element (FE) model. Based on the FE analysis, the guidelines for obtaining a wet joint with desirable shear capacity are presented, which is useful for the design of wet joints with high ultimate shear capacity.
1. Introduction
In recent years, many bridges have been constructed for the convenience of travel and the alleviation of traffic jams, but the construction of bridges with conventional methods is time-consuming and costly [1]. There is, therefore, an urgent need for accelerated bridge construction techniques to reduce the cost and shorten the construction time. Precast bridge panels are often adopted to accelerate the construction of a bridge, and joints are required to connect the adjacent precast bridge panels. Therefore, the joints play a crucial role in ensuring the integrity of the connected bridge panels, and they should have adequate strength. However, in the process of operation, the bridge deck system faces the problem of poor durability of the bridge panels, pavement, and steel deck [2]. Especially, the joints of the bridge deck are prone to shear and durability damage due to the influence of vehicles; thus, more attention should be paid to them.
In order to improve the ultimate shear capacity and durability of wet joints, three approaches are mainly adopted: (1) grout the wet joints with suitable high performance materials, (2) change the overlapping form of reinforcement at the wet joint, and (3) set shear keys at wet joints. As a grouting material, ultra-high-performance concrete (UHPC) has discontinuous void structure, which can reduce the entry of water molecules. It has stronger durability than traditional concrete and is suitable for the wet joints of a steel–concrete composite bridge [3]. Due to its outstanding mechanical performance, ultra-high-performance fiber reinforced concrete (UHPFRC) is also used in wet joints to improve the integrity of adjacent bridge panels [4,5,6]. Changing the overlapping form of steel bars by using a headed bar can not only avoid welding but also improve the shear capacity and durability of the wet joint [7,8,9]. For example, the mechanical performance of wet joints can be improved by using U-loop bars [10,11]. In general, the joints for connecting precast bridge panels are categorized as wet joints and dry joints [12]. Dry joints such as shear keys are widely used in concrete segmental bridges and precast concrete box girder bridges, and they can improve the shear capacity [13,14,15,16,17,18,19,20]. Wet joints with shear pockets are also adopted to connect the concrete panels and girders to increase the shear capacity of the full-depth precast concrete bridge panels [21]. Since the wet joints of orthotropic bridge deck are prone to concrete cracking, Pan et al. [22] designed five types of new wet joints to improve the crack resistance of a precast composite deck system. Zhao et al. [23] and Qi et al. [10] also employed dovetail-shaped wet joints to improve the shear capacity and crack resistance of a steel–concrete composite bridge. Based on the comparative model test, Deng et al. [24] proved that the crack resistance of a T-shaped joint is better than that of an I-shaped joint in a steel–concrete composite bridge. The seismic performance of steel–concrete composite bridges should be considered in bridge operation, especially for multi-span precast steel–concrete composite bridges, which are very sensitive to earthquake loading [25]. Thus, it is very important to improve the seismic performance of bridges. This can be achieved by using a friction pendulum device (FPD) as an isolation system placed between the deck and the top of the pier, which is proven as an effective and economical seismic retrofit strategy [26,27,28].
Although UHPC can improve the mechanical properties of concrete at wet joints, the curing conditions of UHPC are too harsh. Changing the overlapping form of reinforcement at the wet joint will increase not only the steel consumption but also the construction time. Moreover, existing shear keys in wet joints are simple in configuration and cannot avoid stress concentration. Note that by properly choosing the shape of shear key in dry joints, high shear capacity can be achieved [12,29], and stress concentration can also be reduced [30]. Therefore, a shear key was also introduced in the wet joint in this study, and a concave square frustum-shaped wet joint was proposed to improve the shear capacity of wet joint, as well as reduce the stress concentration. The failure modes and ultimate shear capacity of specimens with the concave square frustum-shaped wet joint were explored through experiments and simulations. The remainder of this paper is organized as follows. In Section 2, details of the fabrication and tests of the specimens with the concave square frustum-shaped and conventional wet joints (labeled as S-SWJ and S-CWJ) are presented, and the test results are compared and analyzed. Section 3 presents the finite element modeling method and its validation. In Section 4, the failure modes and the influences of concrete strength and shear key angle on the ultimate shear capacity of S-SWJ are explored. The main conclusions are summarized in Section 5.
2. Experimental Program
2.1. Specimen Details
As illustrated in Figure 1, the specimen investigated in this study was part of the precast panel of the steel–concrete composite bridge at the wet joint (Figure 1a). The investigated specimen was composed of two precast bridge panels and one wet joint, as shown in Figure 1b. For the specimen with the conventional wet joint (labeled as S-CWJ), the conventional wet joint had a rectangular shape (Figure 1c), and the interface between the precast bridge panel and wet joint was a flat surface. The specimen with the concave square frustum-shaped wet joint (labeled as S-SWJ) was proposed to enhance the shear capacity of the joint interface. It can be seen from Figure 1b that the proposed wet joint had a concave square frustum shape, and the corresponding precast bridge panel had a convex square frustum-shaped shear key.
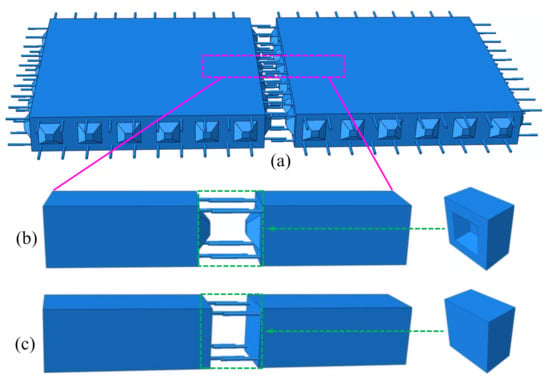
Figure 1.
Schematic diagrams of (a) bridge panel with convex-shaped shear keys, (b) specimen with the concave square frustum-shaped wet joint (S-SWJ) and (c) specimen with the conventional wet joint (S-CWJ).
A comparative study was conducted between S-SWJ and S-CWJ to validate the superiority of the concave square frustum-shaped wet joint. For comparison, S-SWJ and S-CWJ were fabricated, and their fabrication process is shown in Figure 2. During fabrication, the two precast bridge panels for each specimen were fabricated firstly, and then the concrete of the wet joint was poured. As shown in Figure 3a,b, all specimens had the same overall dimension. Both S-SWJ and S-CWJ were designed as cuboids with dimensions of 250 × 250 × 1350 mm, the dimensions of each bridge panel were 250 × 250 × 600 mm, and those of the wet joint were 250 × 250 × 150 mm. The detailed dimensions of the shear key in S-SWJ are illustrated in Figure 3b. All specimens were reinforced by steel bars with a diameter of 16 mm and length of 715 mm. A welding method was adopted to connect the two adjacent steel bars within the region of wet joint, and the welding length (i.e., the overlap length of two adjacent steel bars within the region of wet joint) was 80 mm.
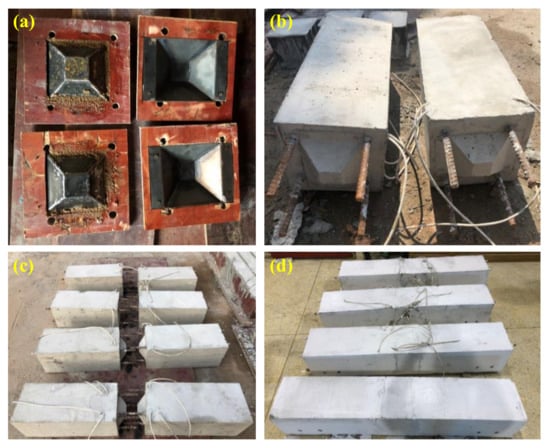
Figure 2.
Fabrication process of specimens: (a) formwork for shear key, (b) precast bridge panels for S-SWJ, (c) axially aligned bridge panels for S-SWJ and S-CWJ, and (d) final specimens.
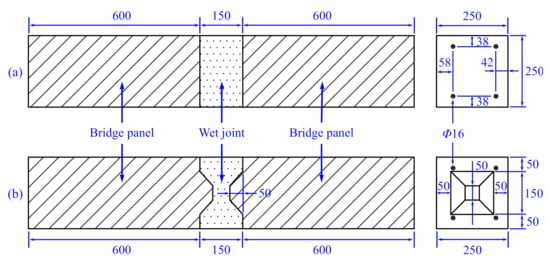
Figure 3.
Detailed dimensions (unit: mm) of (a) S-CWJ and (b) S-SWJ.
In addition, 12 concrete cubes were fabricated to obtain the basic mechanical properties of concrete. Among them, six concrete cubes were fabricated along with the fabrication of precast bridge panels, while the other six concrete cubes were fabricated along with the fabrication of wet joints. In this study, the two kinds of concrete cubes are called precast and cast-in-situ concrete cubes. The concrete consisted of ordinary Portland cement, gravel, and river sand, and the mix proportion is tabulated in Table 1. Note that the same mix proportion of concrete was adopted for the bridge panels, wet joints, and concrete cubes.

Table 1.
Mix proportion of concrete.
2.2. Compression and Splitting Tests of Concrete Cubes
The compression and splitting tests were conducted on concrete cubes according to the standard GB/T 50081-2019 [31] to obtain the mechanical properties of concrete. For both precast and cast-in-situ concrete cubes, three out of six concrete cubes were used to perform compression tests, and the other three were used for splitting tests. All tests were conducted on a universal testing machine, the force was recorded by the load cell of the machine, and the average value of the test data was employed as the result. According to the test data, the properties of precast and cast-in-situ concrete cubes are listed in Table 2 and Table 3, respectively.

Table 2.
Properties of precast concrete cubes.

Table 3.
Properties of cast-in-situ concrete cubes.
2.3. Tests of S-SWJ and S-CWJ
The tests on S-SWJ and S-CWJ were performed on a 1000 kN capacity servo-hydraulic universal testing machine. As illustrated in Figure 4, to divide the concentrated load into uniform loads, two steel bars with the dimensions of 10 × 10 × 250 mm were placed on the top of the wet joint. Each steel bar was 25 mm away from the adjacent joint interface. Two steel blocks were placed to support the specimen. The dimensions of each support were 130 × 200 × 250 mm, and the distance between the support and the joint interface was 20 mm. The loading rate was 500 N/s, and all specimens were loaded until failure. During testing, the force was recorded by the load cell of the testing machine. A displacement sensor was placed at the middle position of the bottom surface of the wet joint to record the displacement.
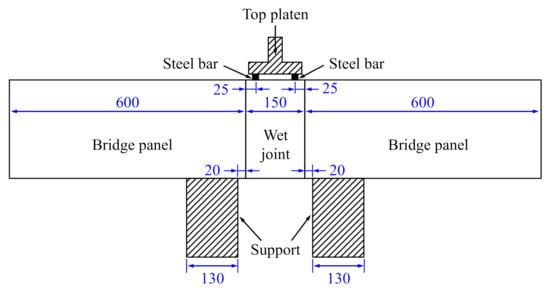
Figure 4.
Schematic diagram of the test setup (unit: mm).
Figure 5a,b present the final failure modes of S-CWJ and S-SWJ, respectively. Cracks and concrete spalling were observed for both S-SWJ and S-CWJ. It can be seen that the cracks mainly occurred on the surface and near surface of the wet joint. Similarly, the concrete spalling was concentrated at the concrete–concrete interfaces between the wet joint and bridge panels for both S-SWJ and S-CWJ, and a large area of concrete spalling can be clearly seen in the wet joint of S-CWJ. Moreover, the interface slip was also observed for both S-SWJ and S-CWJ.

Figure 5.
Failure modes of (a) S-CWJ and (b) S-SWJ.
Figure 6 shows the load–displacement curves of S-SWJ and S-CWJ. It can be seen that the curve of S-SWJ rose linearly before the load reached 350 kN, then followed by a nonlinear rise. When the load reached 520 kN, the curve began to decline nonlinearly, and the maximum load value at this turning point was defined as the ultimate shear capacity. The corresponding displacement was 0.22 mm. For S-CWJ, the curve initially displayed a linear rise before the load reached 220 kN, at which point the displacement was 0.04 mm. After that, the curve changed nonlinearly, and it rose and fell when the displacement was in the range of 0.04 to 0.2 mm. When the displacement exceeded 0.2 mm, the curve rose nonlinearly until the specimen failed, and the corresponding displacement was 0.25 mm. The ultimate shear capacity of S-CWJ was 300.2 kN, which was 73.2% lower than that of S-SWJ. This demonstrated that the ultimate shear capacity can be enhanced by using the concave square frustum-shaped wet joint.
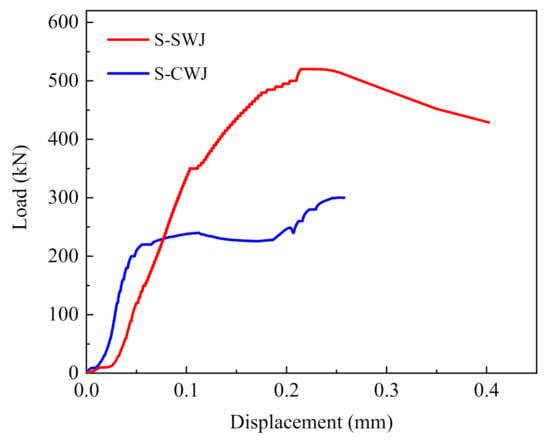
Figure 6.
Load–displacement curves of S-SWJ and S-CWJ.
3. Nonlinear FE Analysis
3.1. General Description
From Section 2.3, it can be seen that the concave square frustum-shaped wet joint has superior shear capacity compared with the conventional wet joint. The finite element (FE) software ABAQUS/Standard was employed to conduct the numerical simulation of S-SWJ to further explore the shear capacity of the concave square frustum-shaped wet joint. A 3D nonlinear FE model was adopted to accurately simulate the behavior of S-SWJ, and the established FE method was verified by the experimental data.
As shown in Figure 7, a 3D FE model of S-SWJ was established, and the geometric parameters of the FE model were kept the same as those in the test. The wet joint was sandwiched between two bridge panels, and the interaction between the wet joint and bridge panels is described in detail in the following subsection. The steel bars as reinforcement in specimen were embedded within the concrete using the embedded element technique available in ABAQUS. The bottom surface of the supports was coupled to a reference point, and the two supports were fixed by constraining all degrees of freedom of the reference point. To make the two steel bars on the top of S-SWJ move downward, the upper surface of the two steel bars was coupled with a reference point, and the load was applied on the reference point. The supports were connected to the bridge panels by a tie constraint, which was also defined between the two steel bars and the wet joint. Solid elements of type C3D8R were employed to model the concrete, and truss elements of type T3D2 were used to model the steel bars embedded in concrete. A mesh size of 25 mm was used for the concrete and the reinforced steel bars to achieve accurate results and high computational efficiency. The constitutive models for concrete and steel bars, and the concrete–concrete interface (Figure 7) behavior are also important to obtain accurate results, and the details are presented as follows.
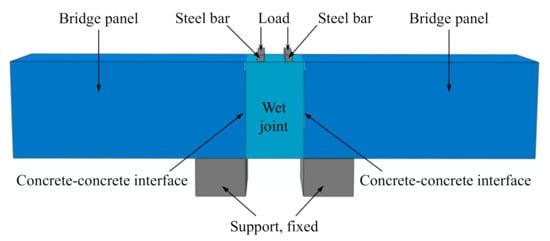
Figure 7.
Finite element (FE) model of S-SWJ.
3.2. Constitutive Model of Concrete
In this study, the mechanical behavior of concrete was modeled using the concrete damaged plasticity (CDP) constitutive model. This model is a continuum, plasticity-based, damage model for concrete, and it is commonly used and adopted in ABAQUS. The CDP model defines that the main two failure mechanisms of the concrete are tensile cracking and compressive crushing [32]. Five parameters must be defined to simulate the plastic behavior of concrete using the CDP model in ABAQUS: the dilation angle ψ, eccentricity ε, the ratio of initial equibiaxial compressive yield stress to initial uniaxial compressive yield stress , the ratio of the second stress invariant on the tensile meridian to that on the compressive meridian K, and viscosity parameter μ. The values of these parameters are listed in Table 4.

Table 4.
Parameters for the concrete damaged plasticity (CDP) model in ABAQUS.
The stress–strain relationships of concrete under uniaxial tension and compression are required to simulate the tensile and compressive behavior of concrete in the CDP model. In this study, the uniaxial tensile and compressive stress–strain relationships of concrete were employed according to the standard GB50010-2010 [33], and the details are presented in the following subsections.
3.2.1. Uniaxial Compressive Stress–Strain Curve
According to the standard GB50010-2010 [33], the stress–strain relationship of concrete under uniaxial compression can be expressed as follows:
where σ and ε are the stress and strain of concrete, respectively; is the Young’s modulus of concrete; and is the damage evolution parameter of concrete under uniaxial compression, and it can be calculated by:
where the parameters, , , and can be calculated as follows:
where is the standard value of concrete uniaxial compressive strength, is the peak compressive strain corresponding to , and is the design value of concrete uniaxial compressive strength.
3.2.2. Uniaxial Tensile Stress–Strain Curve
The uniaxial tensile stress–strain relationship of concrete can be expressed as [33]:
where is the damage evolution parameter of concrete under uniaxial tension, and it can be calculated by:
where the parameters , and can be calculated as follows:
where is the standard value of concrete uniaxial tensile strength, and is the peak tensile strain corresponding to .
3.3. Constitutive Model of Steel Bars
An elastic–perfectly plastic constitutive model was employed for the steel bars. The mechanical properties of steel bars are listed in Table 5.

Table 5.
Properties of steel bars.
3.4. Concrete–Concrete Interface Behavior
During fabrication, the concrete of the wet joint was poured after the precast bridge panel was placed. Therefore, the concrete of bridge panels and wet joint was not a whole, and the interface interaction between them should be considered in the FE model. In ABAQUS, there are two available ways to define the interface behavior. One method is to use cohesive elements, and the other is to use surface-based cohesive behavior. The interface thickness effect can be incorporated by using cohesive elements, while the surface-based cohesive behavior is mainly for the situation where the interface thickness is zero or negligibly small [32]. In this study, the thickness of the interface between the precast bridge panel and the wet joint is zero; thus, the surface-based cohesive behavior was employed to model the concrete–concrete interface behavior.
3.5. Validation of FE Model
In order to verify the developed FE model, the ultimate shear capacity obtained from simulations was compared with the experimental data in Section 2.3. As shown in Figure 8, the numerical and experimental ultimate shear capacity of S-SWJ was 519.3 and 520 kN, respectively, and the difference between them was less than 1%. In addition, a simulation of S-CWJ was also conducted by using the same FE modeling method. The numerical result shows that the ultimate shear capacity of S-CWJ was 270.7 kN, and the corresponding experimental result was 300.2 kN; thus, the difference is 9.8%. It can be seen that the ultimate shear capacity obtained from the simulations has a good agreement with experimental results. Therefore, the present FE modeling method was validated as accurate and effective, and the same modeling method was used in the rest of this study.
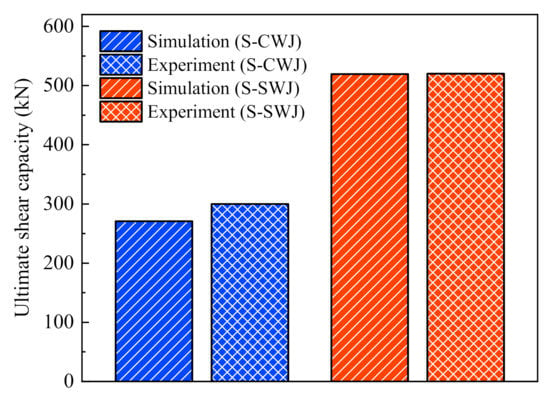
Figure 8.
Comparison between numerical and experimental results for both S-CWJ and S-SWJ.
4. Results and Discussion
According to the experimental results, the ultimate shear capacity of S-SWJ is significantly enhanced compared to that of S-CWJ. The failure modes were examined to further explore the ultimate shear capacity of S-SWJ, and the influences of concrete strength and shear key angle on the ultimate shear capacity of S-SWJ were investigated using the numerical method.
4.1. Failure Modes
In ABAQUS, the damage variable DAMAGET represents the degradation of the elastic tensile stiffness [32]. Its value can be changed from zero to one. The material is undamaged when the value of the damage variable equals zero, while the material undergoes a total loss of strength when the value equals one. Therefore, the damage variable DAMAGET is a quantity associated with the failure of the material, and the contour plot of this damage variable can be used to characterize the failure of S-SWJ.
Figure 9a,b, respectively, show the distribution of damage for S-SWJ and S-CWJ when the concrete–concrete interface debonds. It can be seen that only a little damage could be observed at this moment, and the damage was mainly concentrated near the concrete–concrete interface. This phenomenon is in accordance with the observation in tests. As the compression continued, more damage occurred and finally led to the failure of specimens, as shown in Figure 10. At this point, the load reached the maximum (corresponding to a shear failure in the connection area [34]), and the damage of S-SWJ (Figure 10a) was more serious than that of S-CWJ (Figure 10c). The more serious damage of S-SWJ is mainly due to the maximum load of S-SWJ being much larger than that of S-CWJ, as presented in Section 3.5. By examining the contour plots of the bridge panel end at the concrete–concrete interface, it can be seen that the bridge panel end of S-CWJ has a more concentrated damage distribution compared to the bridge panel end of S-SWJ, as shown in Figure 10b,d. This indicates that the stress concentration at the bridge panel end can be reduced by using concave square frustum-shaped wet joint.
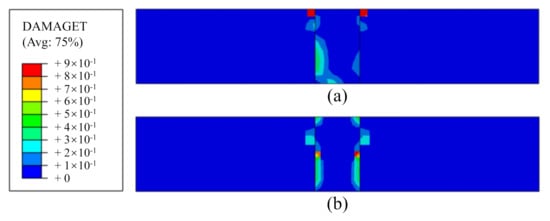
Figure 9.
Contour plots of damage for (a) S-SWJ and (b) S-CWJ when the concrete–concrete interface of the specimen debonds.
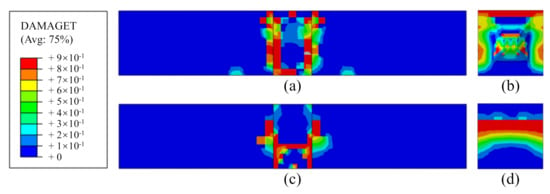
Figure 10.
Contour plots of damage for (a) S-SWJ and (b) its bridge panel end and (c) S-CWJ and (d) its bridge panel end when the specimen reaches the maximum load.
4.2. Influence of Concrete Strength
Numerical simulations of S-SWJ with different concrete strengths were performed to explore the influence of concrete strength on its shear capacity. In the simulations, the concrete strength ranged from 25 to 55 MPa, with an interval of 5 MPa. The other material properties and geometric parameters of S-SWJ were kept the same as those used in Section 3.
Figure 11 shows the load–displacement curves of S-SWJ with different concrete strengths. It can be seen that the curves show a linear rise, followed by a nonlinear rise, and the nonlinear rise tends to be faster and higher with the increase of concrete strength. Thus, for S-SWJ with higher concrete strength, the load in the nonlinear rise region is larger, leading to a higher ultimate shear capacity. Finally, the curves decline after reaching the peak load. The red circle in Figure 11 indicates the load corresponding to the concrete–concrete interface debonding of S-SWJ. According to the position of the circles in Figure 11, it can be seen that the debonding strength of S-SWJ increases with increasing concrete strength.
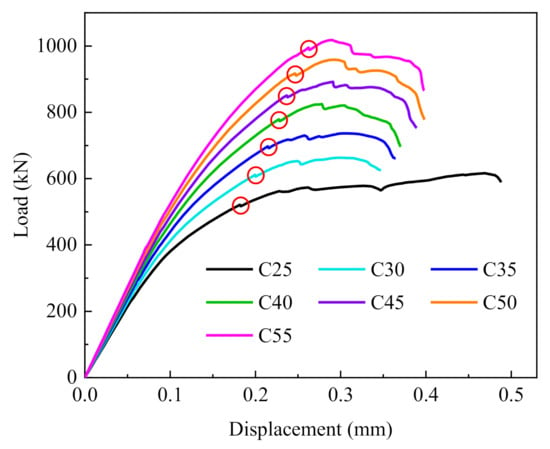
Figure 11.
Load–displacement curves of S-SWJ with different concrete strength.
From Figure 11, it can be seen that the ultimate shear capacity can be enhanced by increasing the concrete strength. The ultimate shear capacity of S-SWJ with different concrete strengths is summarized in Figure 12 for a more specific comparison. It can be seen that the ultimate shear capacity of S-SWJ increases almost linearly with increasing concrete strength. Specifically, the ultimate shear capacity of S-SWJ with concrete strength of 55 MPa is 65.3% higher than that of S-SWJ with concrete strength of 25 MPa. Figure 12 also shows the displacement corresponding to the ultimate shear capacity. As shown in Figure 12, for S-SWJ with concrete strength ranging from 30 to 55 MPa, the displacement fluctuates slightly, and the value is about 0.3 mm. However, S-SWJ with concrete strength of 25 MPa has a relatively larger displacement, the value of which is 0.47 mm.
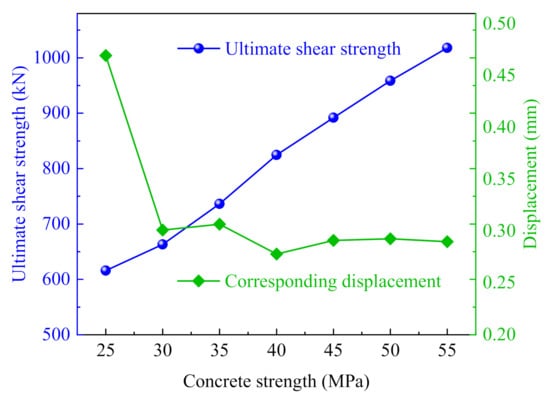
Figure 12.
Ultimate shear strength and the corresponding displacement of S-SWJ with different concrete strength.
4.3. Influence of Shear Key Angle
In order to study the influence of shear key angle on the shear capacity of S-SWJ, the shear key angle was changed from 40° to 60° with an interval of 5°, and the geometric parameters of bridge panels with different shear key angles are illustrated in Figure 13. The other geometric parameters and material properties of S-SWJ in simulations were kept the same as those used in Section 3.

Figure 13.
Bridge panels with different shear key angles (unit: mm).
Figure 14 shows the load–displacement curves of S-SWJ with different shear key angles. It can be seen that the curves show a linear rise, followed by a nonlinear rise, and finally the curves decline after reaching the peak load. The curves exhibit a similar change tendency to those of S-SWJ with different concrete strengths. The ultimate shear capacity of S-SWJ extracted from the curves is summarized in Figure 15. It can be seen from Figure 15 that the ultimate shear capacity first increases quickly and then decreases slowly with the increase of shear key angle. For example, increasing the shear key angle from 40° to 50° increases the ultimate shear capacity by 19.6%, while increasing the shear key angle from 50° to 60° decreases the ultimate shear capacity only by 4.1%. In the present study, S-SWJ with a shear key angle of 50° has the highest ultimate shear capacity. The larger the shear key angle, the more difficult to vibrate the concrete in the bottom of shear key. Therefore, to achieve a high ultimate shear capacity for S-SWJ, a shear key angle within the range of 45° to 55° is recommended.
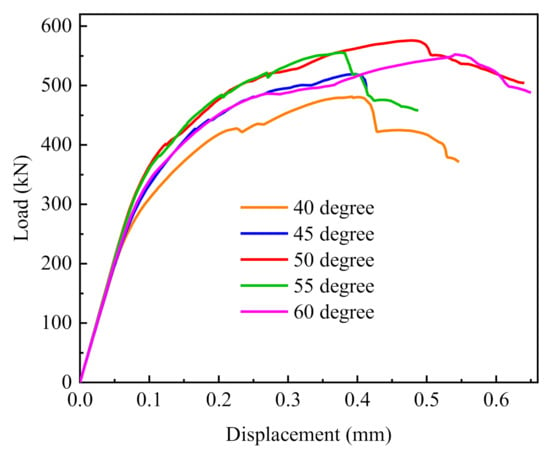
Figure 14.
Load–displacement curves of S-SWJ with different shear key angles.
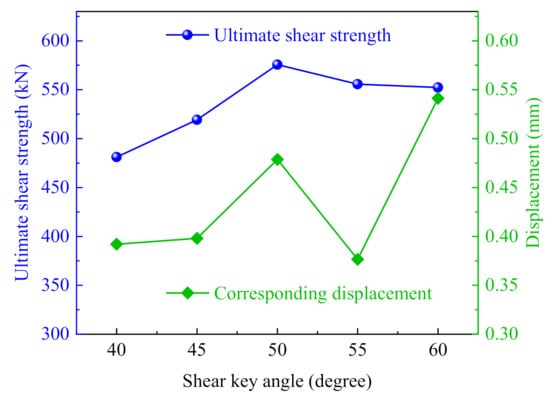
Figure 15.
Ultimate shear strength and the corresponding displacement of S-SWJ with different shear key angles.
From Figure 12 and Figure 15, it can be seen that the improvement of ultimate shear capacity by changing shear key angle is smaller than that by changing concrete strength. In addition, the displacement corresponding to the ultimate shear capacity for S-SWJ with different shear key angles is also presented in Figure 15. It can be seen that the displacement fluctuates up and down with the increase of shear key angle. It can also be seen that the displacement in Figure 15 is relatively larger than that (Figure 12) of S-SWJ with different concrete strengths.
5. Conclusions
In this study, the failure modes and ultimate shear capacity of a concave square frustum-shaped wet joint were studied using experimental and numerical methods. Firstly, inspired by the fact that high shear resistance can be achieved by properly choosing the shape of shear keys in dry joints, a concave square frustum-shaped wet joint was proposed to improve the shear capacity. Then, specimens with the concave square frustum-shaped and conventional wet joints (labeled as S-SWJ and S-CWJ) were fabricated and tested for comparison. Finally, a 3D FE model was established to further explore the ultimate shear capacity of S-SWJ. The main conclusions are summarized as follows:
- (1)
- It was found that the ultimate shear capacity of S-SWJ was 73.2% higher than that of S-CWJ, which was caused by changing the wet joint into a concave square frustum shape. This indicates that the shear resistance of wet joints can be significantly influenced by their shape.
- (2)
- The ultimate shear capacity of S-SWJ increases almost linearly with increasing concrete strength, while it first increases quickly and then decreases slowly with increasing shear key angle. The recommended shear key angle range is 45° to 55° because higher ultimate shear capacity can be achieved within this range.
- (3)
- In terms of improving the ultimate shear capacity of S-SWJ, increasing the concrete strength is more effective compared with changing the shear key angle, as the increase of concrete strength is associated with a significantly greater improvement in ultimate shear capacity.
In sum, this study provides a new possibility to design wet joints with enhanced ultimate shear capacity, and guidelines for obtaining a concave square frustum-shaped wet joint with desirable ultimate shear capacity are presented. This study demonstrates that the shape has a significant influence on the ultimate shear capacity of a wet joint, which means higher ultimate shear capacity can be achieved by properly choosing the shape of the wet joint. It should be mentioned that the obtained results may have certain limitations due to the specimen geometry and loading conditions that were adopted in this study. Therefore, in future study, we will perform investigations on wet joints with various geometric shapes. The performance of wet joints under different loading conditions (e.g., earthquake loading, fatigue loading) is also very important and needs to be further explored.
Author Contributions
Conceptualization, F.H. and W.W.; methodology, F.F., W.W. and P.G.; Validation, F.F. and W.W.; Formal analysis, F.F. and Y.T.; Writing—original draft preparation, F.F.; Writing—review and editing, F.F. and Y.T.; Supervision, F.H. and Y.T.; Project administration, F.H. and P.G.; Funding acquisition, W.W. All authors have read and agreed to the published version of the manuscript.
Funding
This research is substantially funded by the National Natural Science Foundation of China (No. 12072375).
Institutional Review Board Statement
Not applicable.
Informed Consent Statement
Not applicable.
Data Availability Statement
Not applicable.
Conflicts of Interest
The authors declare no conflict of interest.
References
- Wang, K.; Zhao, C.; Wu, B.; Deng, K.; Cui, B. Fully-scale test and analysis of fully dry-connected prefabricated steel-UHPC composite beam under hogging moments. Eng. Struct. 2019, 197, 9380. [Google Scholar] [CrossRef]
- Chen, B.; Shao, X.; Cao, J. Study of fatigue cracking for orthotropic steel bridge deck. Eng. Mech. 2012, 29, 170–174. [Google Scholar]
- Graybeal, B.A. Design and Construction of Field-Cast UHPC Connections; Federal Highway Administration: Washington, DC, USA, 2014. [Google Scholar] [CrossRef]
- Arafa, A.; Farghaly, A.S.; Ahmed, E.A.; Benmokrane, B. Laboratory testing of GFRP-RC panels with UHPFRC joints of the Nipigon River cable-stayed bridge in northwest Ontario, Canada. J. Bridge Eng. 2016, 21, 6006. [Google Scholar] [CrossRef]
- Leboeuf, V.S.; Charron, J.; Massicotte, B. Design and behavior of UHPFRC field-cast transverse connections between precast bridge deck elements. J. Bridge Eng. 2017, 22, 7031. [Google Scholar] [CrossRef]
- Youssef, M.H.; Ahmed, E.A.; Benmokrane, B. Structural behavior of GFRP-RC bridge deck slabs connected with UHPFRC joints under flexure and shear. J. Bridge Eng. 2019, 24, 9092. [Google Scholar] [CrossRef]
- Li, L.; Ma, Z.; Oesterle, R.G. Improved longitudinal joint details in decked bulb tees for accelerated bridge construction: Fatigue evaluation. J. Bridge Eng. 2010, 5, 511–522. [Google Scholar] [CrossRef]
- Li, L.; Ma, Z.; Griffey, M.E.; Oesterle, R.G. Improved longitudinal joint details in decked bulb tees for accelerated bridge construction: Concept development. J. Bridge Eng. 2010, 3, 327–336. [Google Scholar] [CrossRef]
- Li, L.; Jiang, Z. Flexural behavior and strut-and-tie model of joints with headed bar details connecting precast members. Perspect. Sci. 2016, 7, 253–260. [Google Scholar] [CrossRef]
- Qi, J.; Bao, Y.; Wang, J.; Li, L.; Li, W. Flexural behavior of an innovative dovetail UHPC joint in composite bridges under negative bending moment. Eng. Struct. 2019, 200, 9716. [Google Scholar] [CrossRef]
- Di, J.; Han, B.; Qin, F. Investigation of U-bar joints between precast bridge decks loaded in combined bending and shear. Struct. 2020, 27, 37–45. [Google Scholar] [CrossRef]
- Ibrahim, I.S.; Padil, K.H.; Bady, H.M.A.; Saim, A.A.; Sarbini, N.N. Ultimate shear capacity and failure of shear key connection in precast concrete construction. Malays. J. Civ. Eng. 2014, 26, 414–430. [Google Scholar]
- Zhou, X.; Mickleborough, N.; Li, Z. Shear strength of joints in precast concrete segmental bridges. ACI Struct. J. 2005, 1, 3–11. [Google Scholar]
- Issa, M.A.; Abdalla, H.A. Structural Behavior of Single Key Joints in Precast Concrete Segmental Bridges. J. Bridge Eng. 2007, 3, 315–324. [Google Scholar] [CrossRef]
- Li, G.; Yang, D.; Lei, Y. Combined shear and bending behavior of joints in precast concrete segmental beams with external tendons. J. Bridge Eng. 2013, 18, 1042–1052. [Google Scholar] [CrossRef]
- Voo, Y.L.; Foster, S.J.; Voo, C.C. Ultrahigh-performance concrete segmental bridge technology: Toward sustainable bridge construction. J. Bridge Eng. 2015, 20. [Google Scholar] [CrossRef]
- Hussein, H.H.; Walsh, K.K.; Sargand, S.M.; Al Rikabi, F.T.; Steinberg, E.P. Modeling the shear connection in adjacent box-beam bridges with ultrahigh-performance concrete joints. I: Model calibration and validation. J. Bridge Eng. 2017, 22, 7043. [Google Scholar] [CrossRef]
- Hussein, H.H.; Sargand, S.M.; Al Rikabi, F.T.; Steinberg, E.P. Laboratory evaluation of ultrahigh-performance concrete shear key for prestressed adjacent precast concrete box girder bridges. J. Bridge Eng. 2017, 22, 6113. [Google Scholar] [CrossRef]
- Hussein, H.H.; Sargand, S.M.; Khoury, I. Field investigation of ultra-high performance concrete shear key in an adjacent box-girder bridge. Struct. Infrastruct. Eng. 2019, 15, 663–678. [Google Scholar] [CrossRef]
- Hou, W.; Peng, M.; Jin, B.; Tao, Y.; Guo, W.; Zhou, L. Influencing factors and shear capacity formula of single-keyed dry joints in segmental precast bridges under direct shear loading. Appl. Sci. 2020, 10, 6304. [Google Scholar] [CrossRef]
- Noel, M.; Wahab, N.; Soudki, K. Experimental investigation of connection details for precast deck panels on concrete girders in composite deck construction. Eng. Struct. 2016, 106, 15–24. [Google Scholar] [CrossRef]
- Pan, W.; Fan, J.; Nie, J.; Hu, J.; Cui, J. Experimental study on tensile behavior of wet joints in a prefabricated composite deck system composed of orthotropic steel deck and ultrathin reactive-powder concrete layer. J. Bridge Eng. 2016, 21, 6064. [Google Scholar] [CrossRef]
- Zhao, C.; Wang, K.; Zhou, Q.; Deng, K.; Cui, B. Full-scale test and simulation on flexural behavior of dovetail-shaped reactive powder-concrete wet joint in a composite deck system. J. Bridge Eng. 2018, 8, 8051. [Google Scholar] [CrossRef]
- Deng, S.; Shao, X.; Yan, B.; Wang, Y.; Li, H. On flexural performance of girder-to-girder wet joint for lightweight steel-uhpc composite bridge. Appl. Sci. 2020, 10, 1335. [Google Scholar] [CrossRef]
- Tubaldi, E.; Barbato, M.; Dall’Asta, A. Transverse seismic response of continuous steel-concrete composite bridges exhibiting dual load path. Earthq. Struct. 2010, 1, 21–41. [Google Scholar] [CrossRef]
- Avossa, A.M.; Di Giacinto, D.; Malangone, P.; Rizzo, F.; Caliò, I. Seismic Retrofit of a Multispan Prestressed Concrete Girder Bridge with Friction Pendulum Devices. Shock Vib. 2018, 2018, 1–22. [Google Scholar] [CrossRef]
- Avossa, A.M.; Malangone, P. Seismic retrofit of a prestressed concrete road bridge. Ing. Sismica (Int. J. Earthq. Eng). 2012, 25, 1139–1156. [Google Scholar]
- Dicleli, M.; Mansour, M.Y. Seismic retrofitting of highway bridges in Illinois using friction pendulum seismic isolation bearings and modeling procedures. Eng. Struct. 2003, 25, 1139–1156. [Google Scholar] [CrossRef]
- Zhang, X.; Hao, H.; Zheng, J.; Hernandez, F. The mechanical performance of concrete shear key for prefabricated structures. Adv. Struct Eng. 2020, 24, 291–306. [Google Scholar] [CrossRef]
- Zhang, X.; Hao, H.; Li, C.; Do, T.V. Experimental study on the behavior of precast segmental column with domed shear key and unbonded Post-Tensioning tendon under impact loading. Eng. Struct. 2018, 2018, 589–605. [Google Scholar] [CrossRef]
- GB/T 50081-2019. Standard for Test Methods of Concrete Physical and Mechanical Properties; China Architecture & Building Press: Beijing, China, 2019. (In Chinese) [Google Scholar]
- Dassault Systèmes. Abaqus Analysis User’s Guide; Dassault Systèmes Simulia Corp.: Proidence, RI, USA, 2018. [Google Scholar]
- GB50010-2010. Code for Design of Concrete Structures; China Architecture & Building Press: Beijing, China, 2015. (In Chinese) [Google Scholar]
- Ding, T.; Xiao, J.; Khan, A. Behavior of concrete beam-column frame joints with DfD connections: A simulation study with interface modelling. Eng. Struct. 2019, 189, 347–358. [Google Scholar] [CrossRef]
Publisher’s Note: MDPI stays neutral with regard to jurisdictional claims in published maps and institutional affiliations. |
© 2021 by the authors. Licensee MDPI, Basel, Switzerland. This article is an open access article distributed under the terms and conditions of the Creative Commons Attribution (CC BY) license (http://creativecommons.org/licenses/by/4.0/).