
Development of a Panel Membrane Resonant Absorber


Abstract
1. Introduction
2. PMRA Development and Prototyping
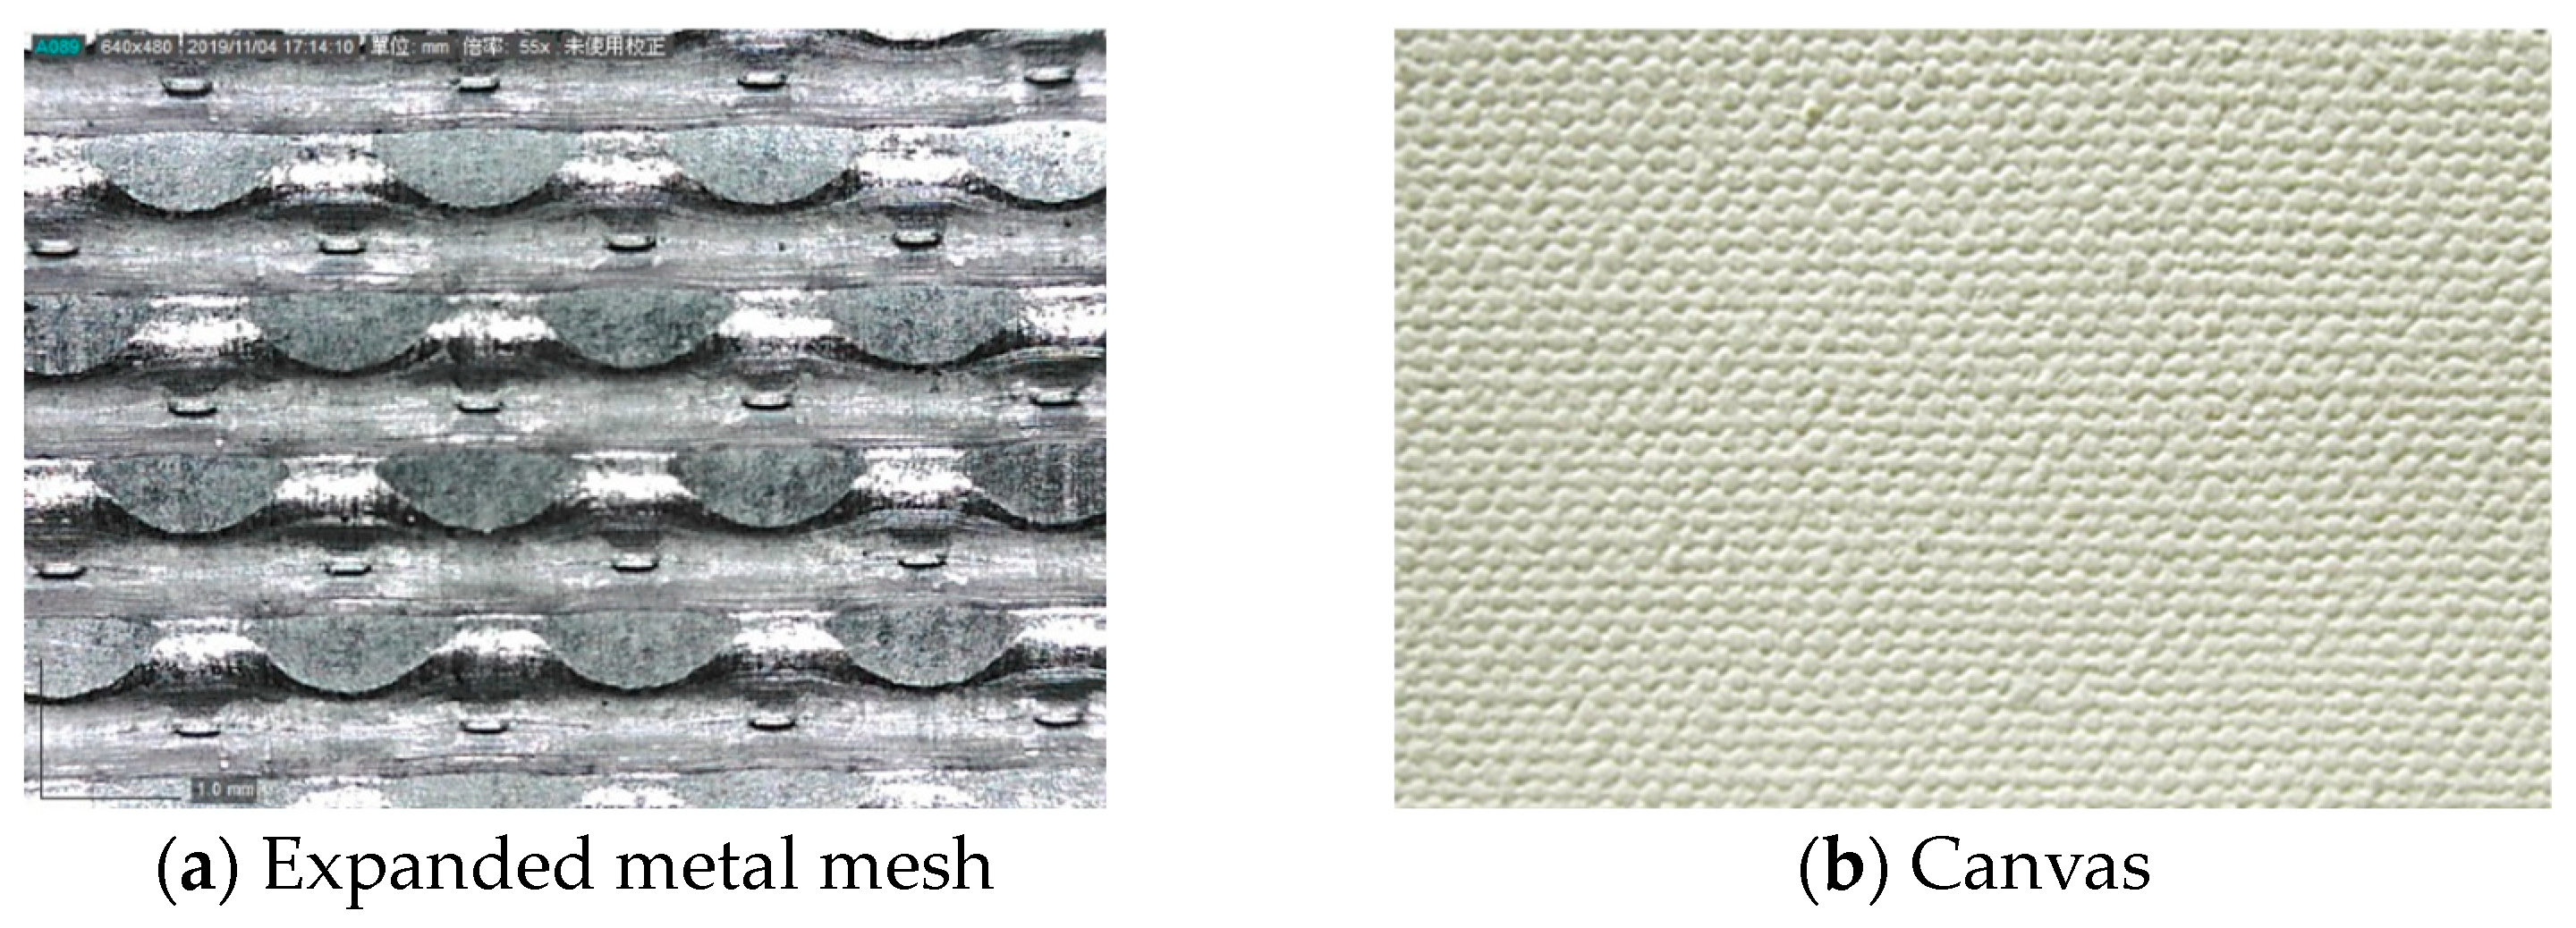
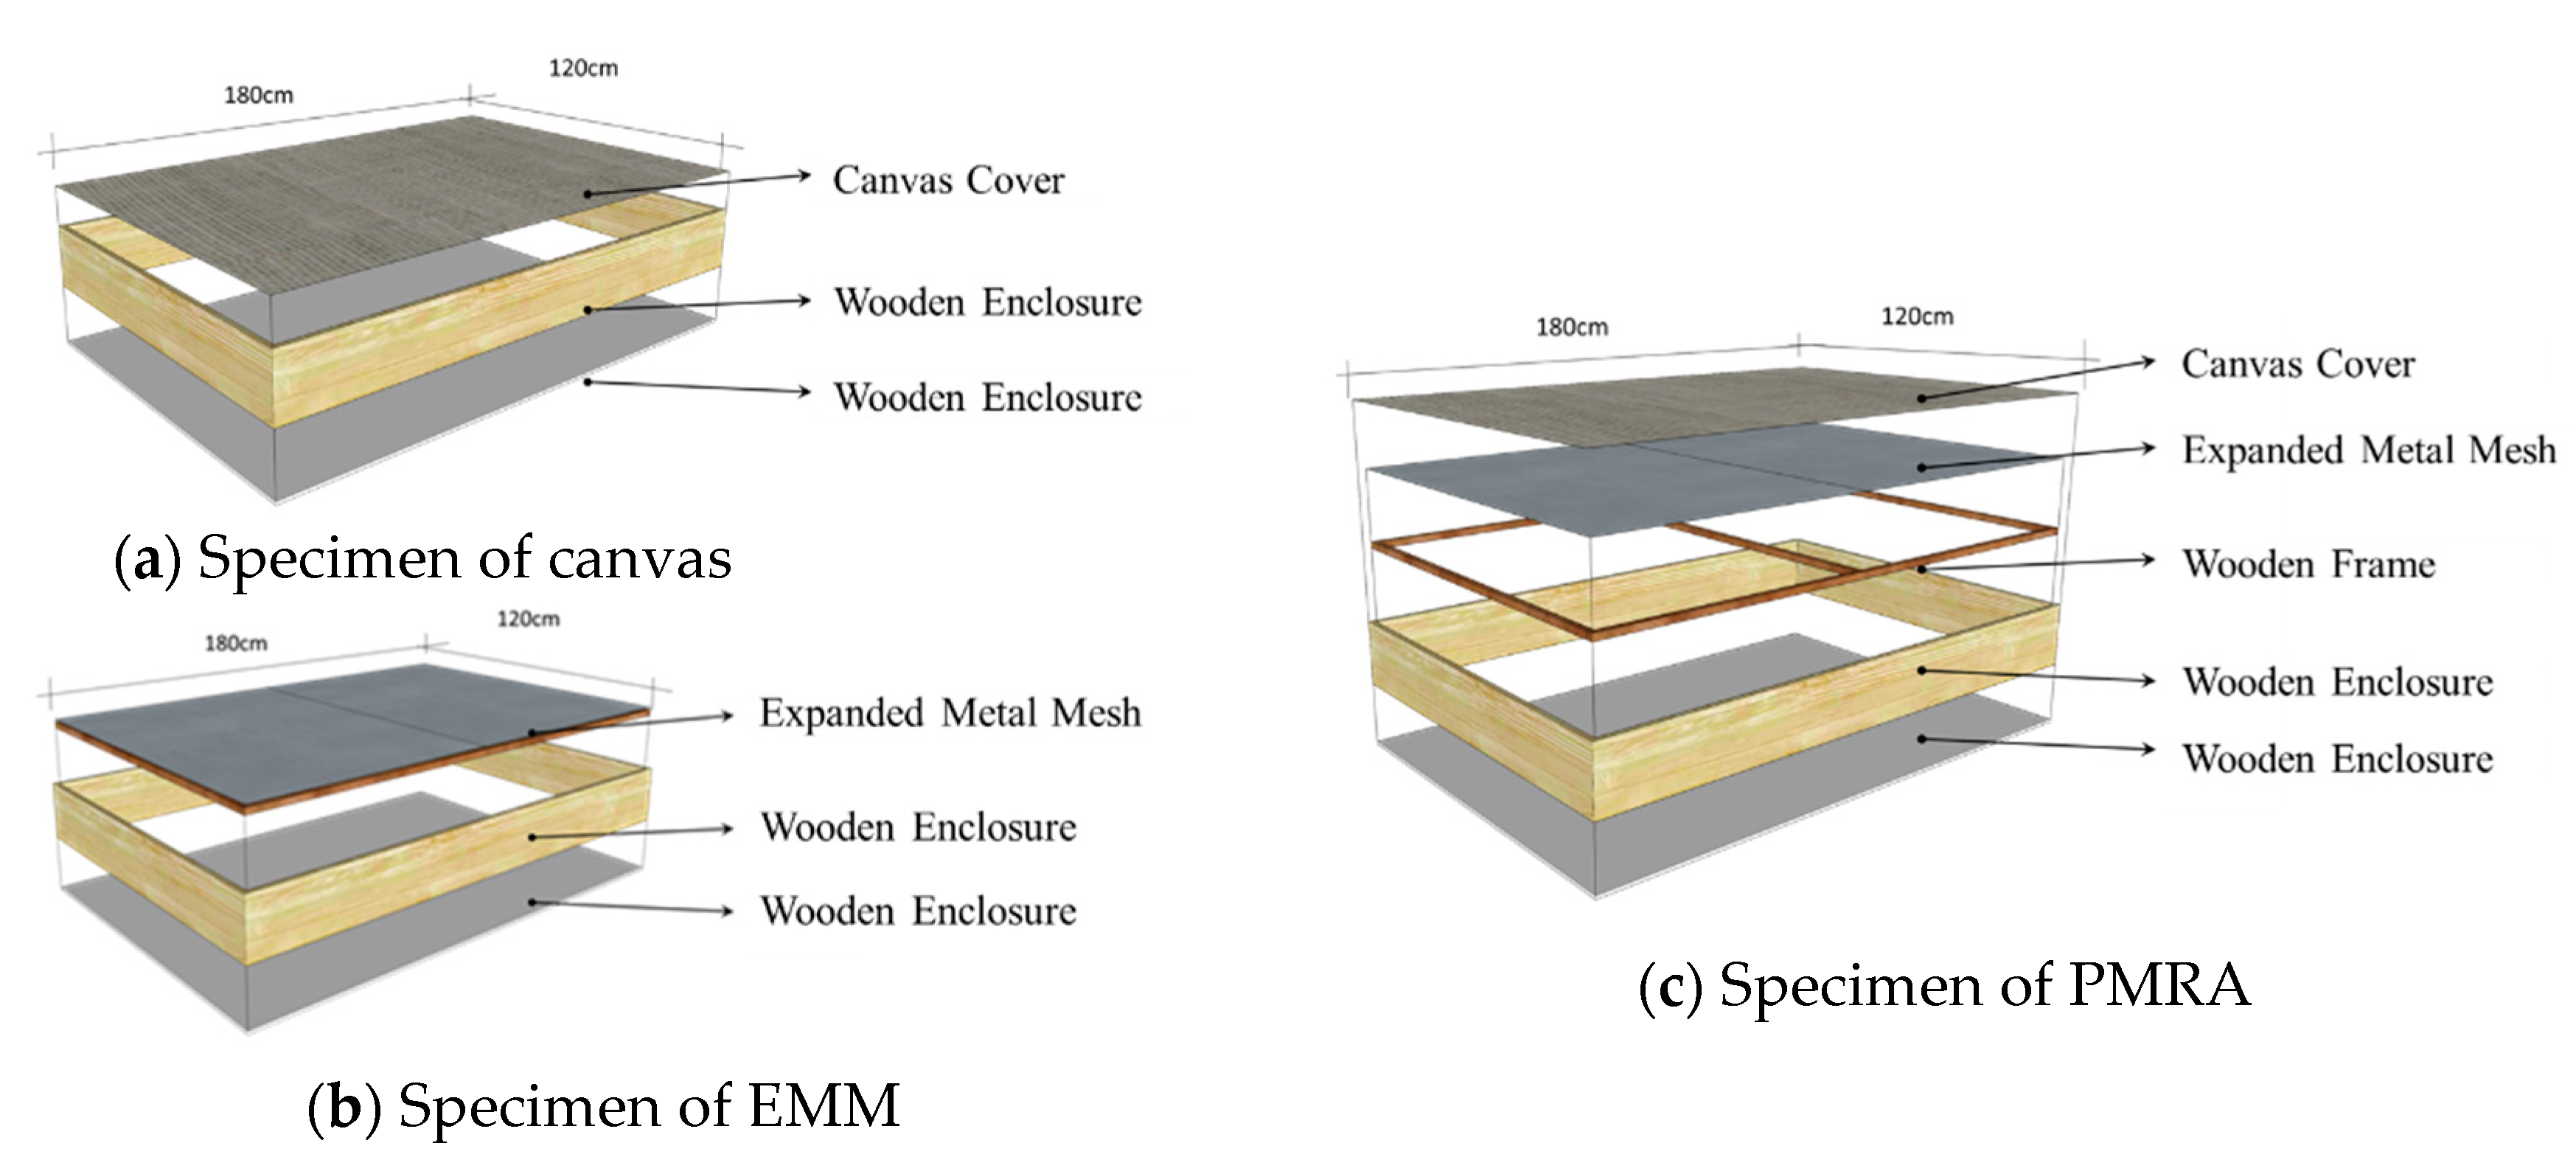
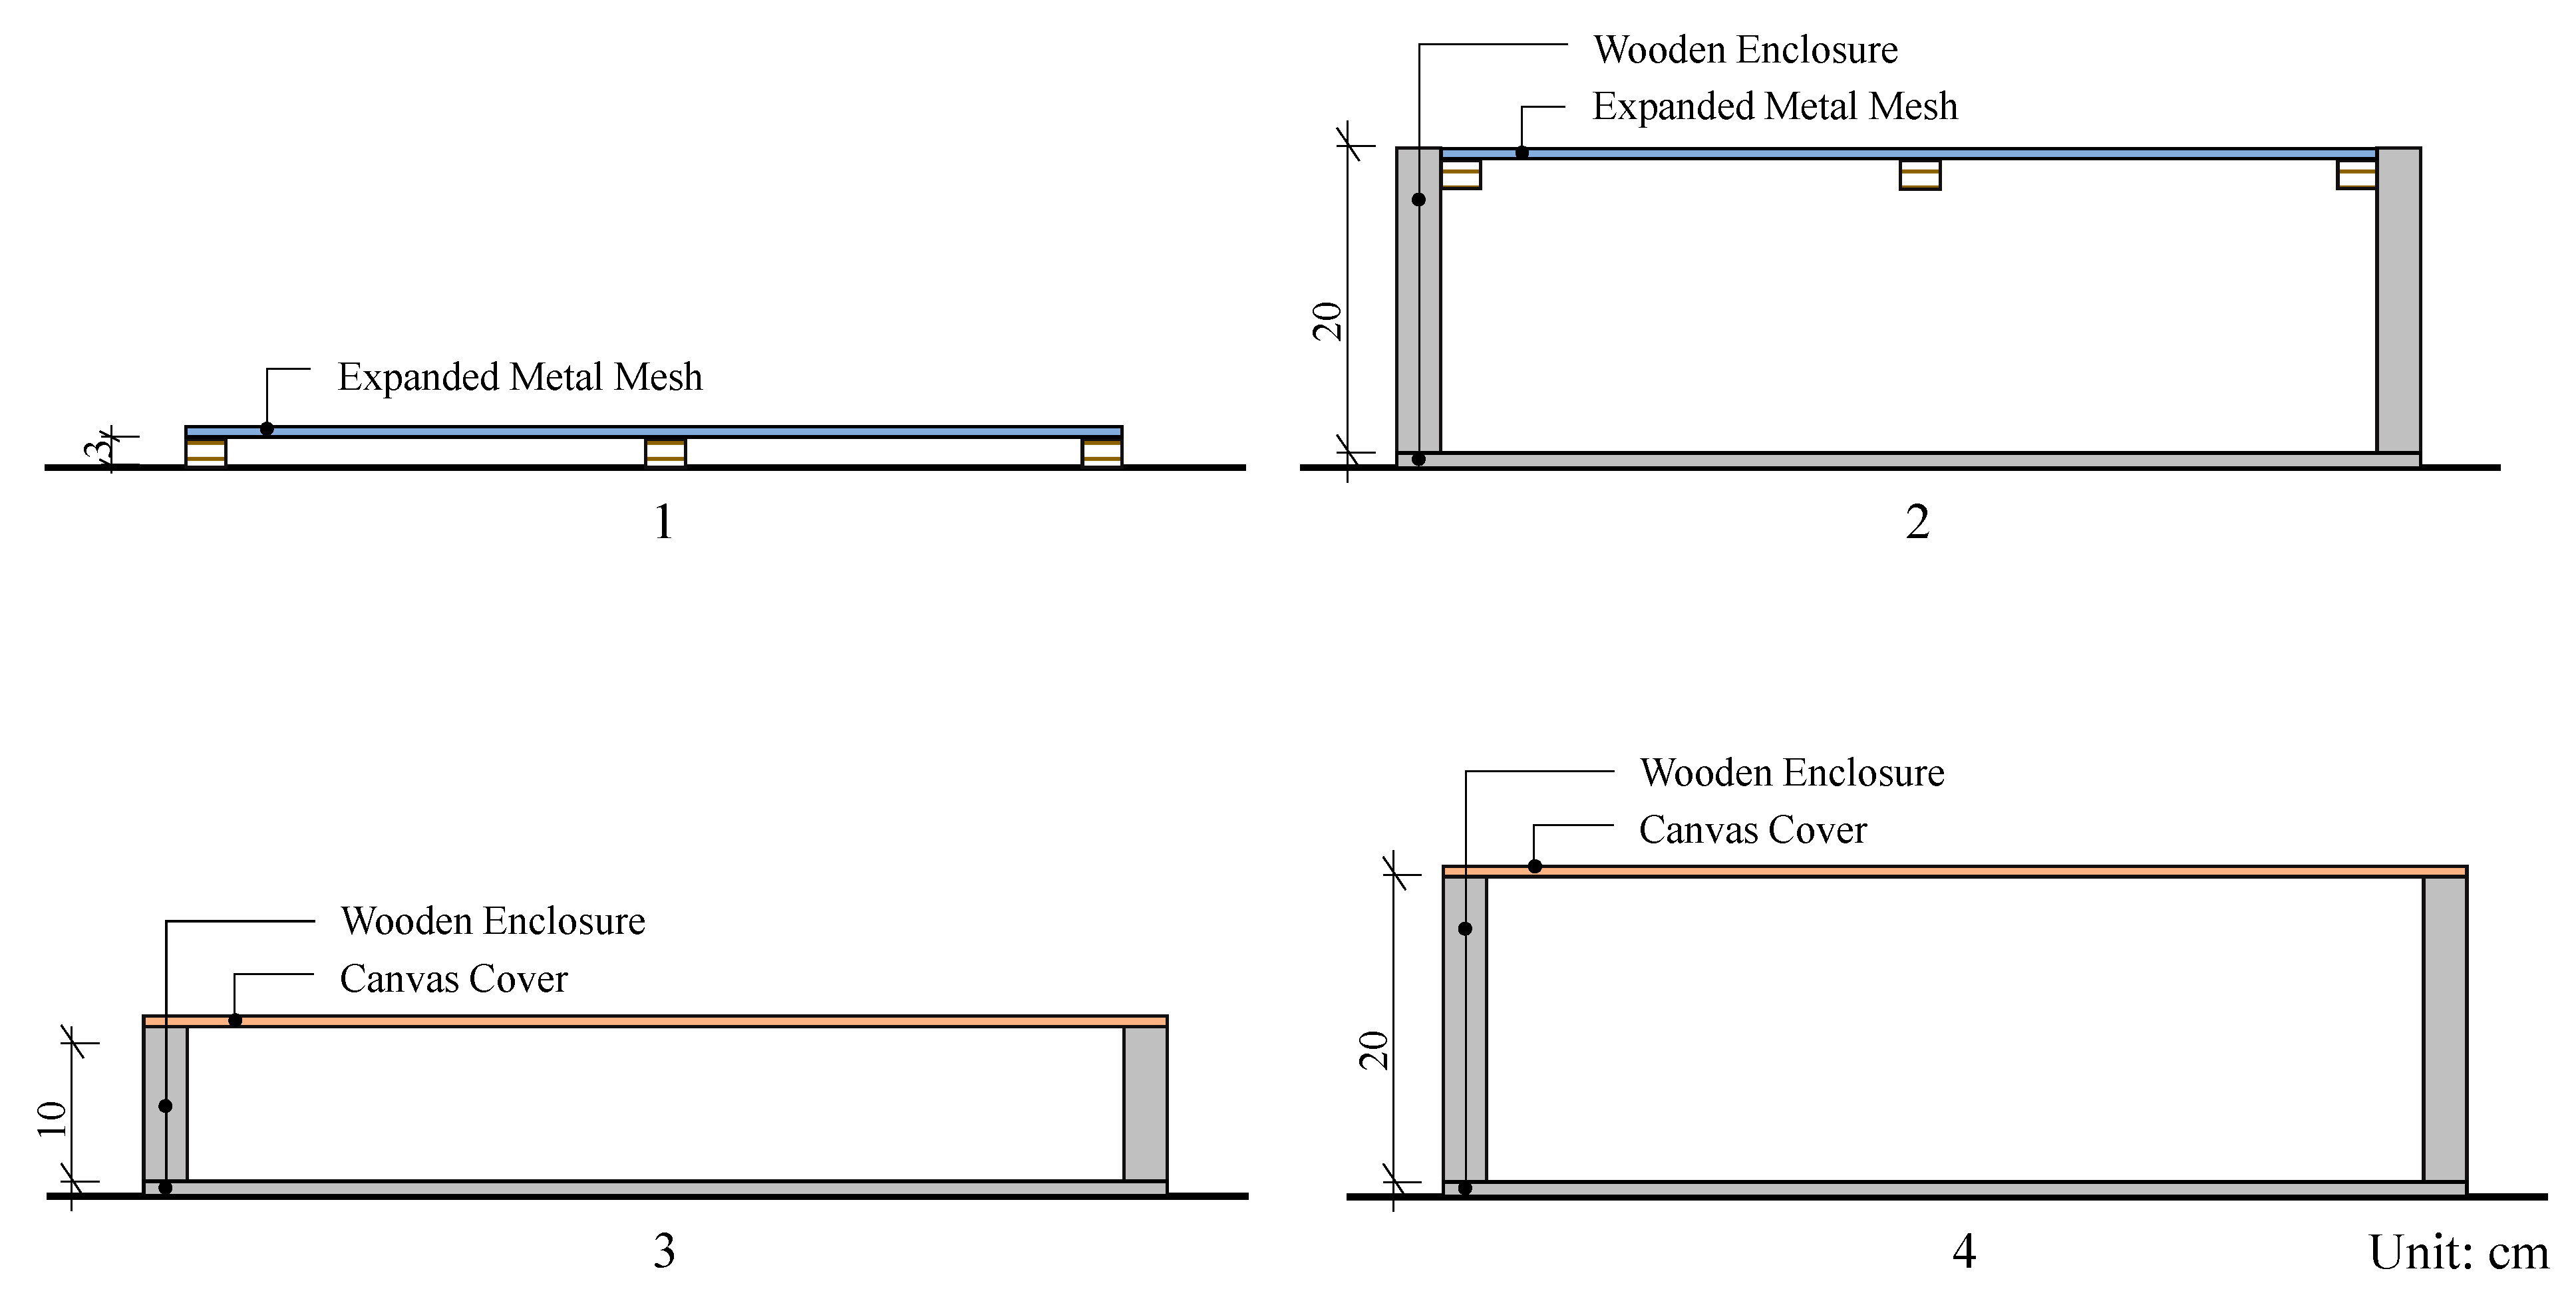
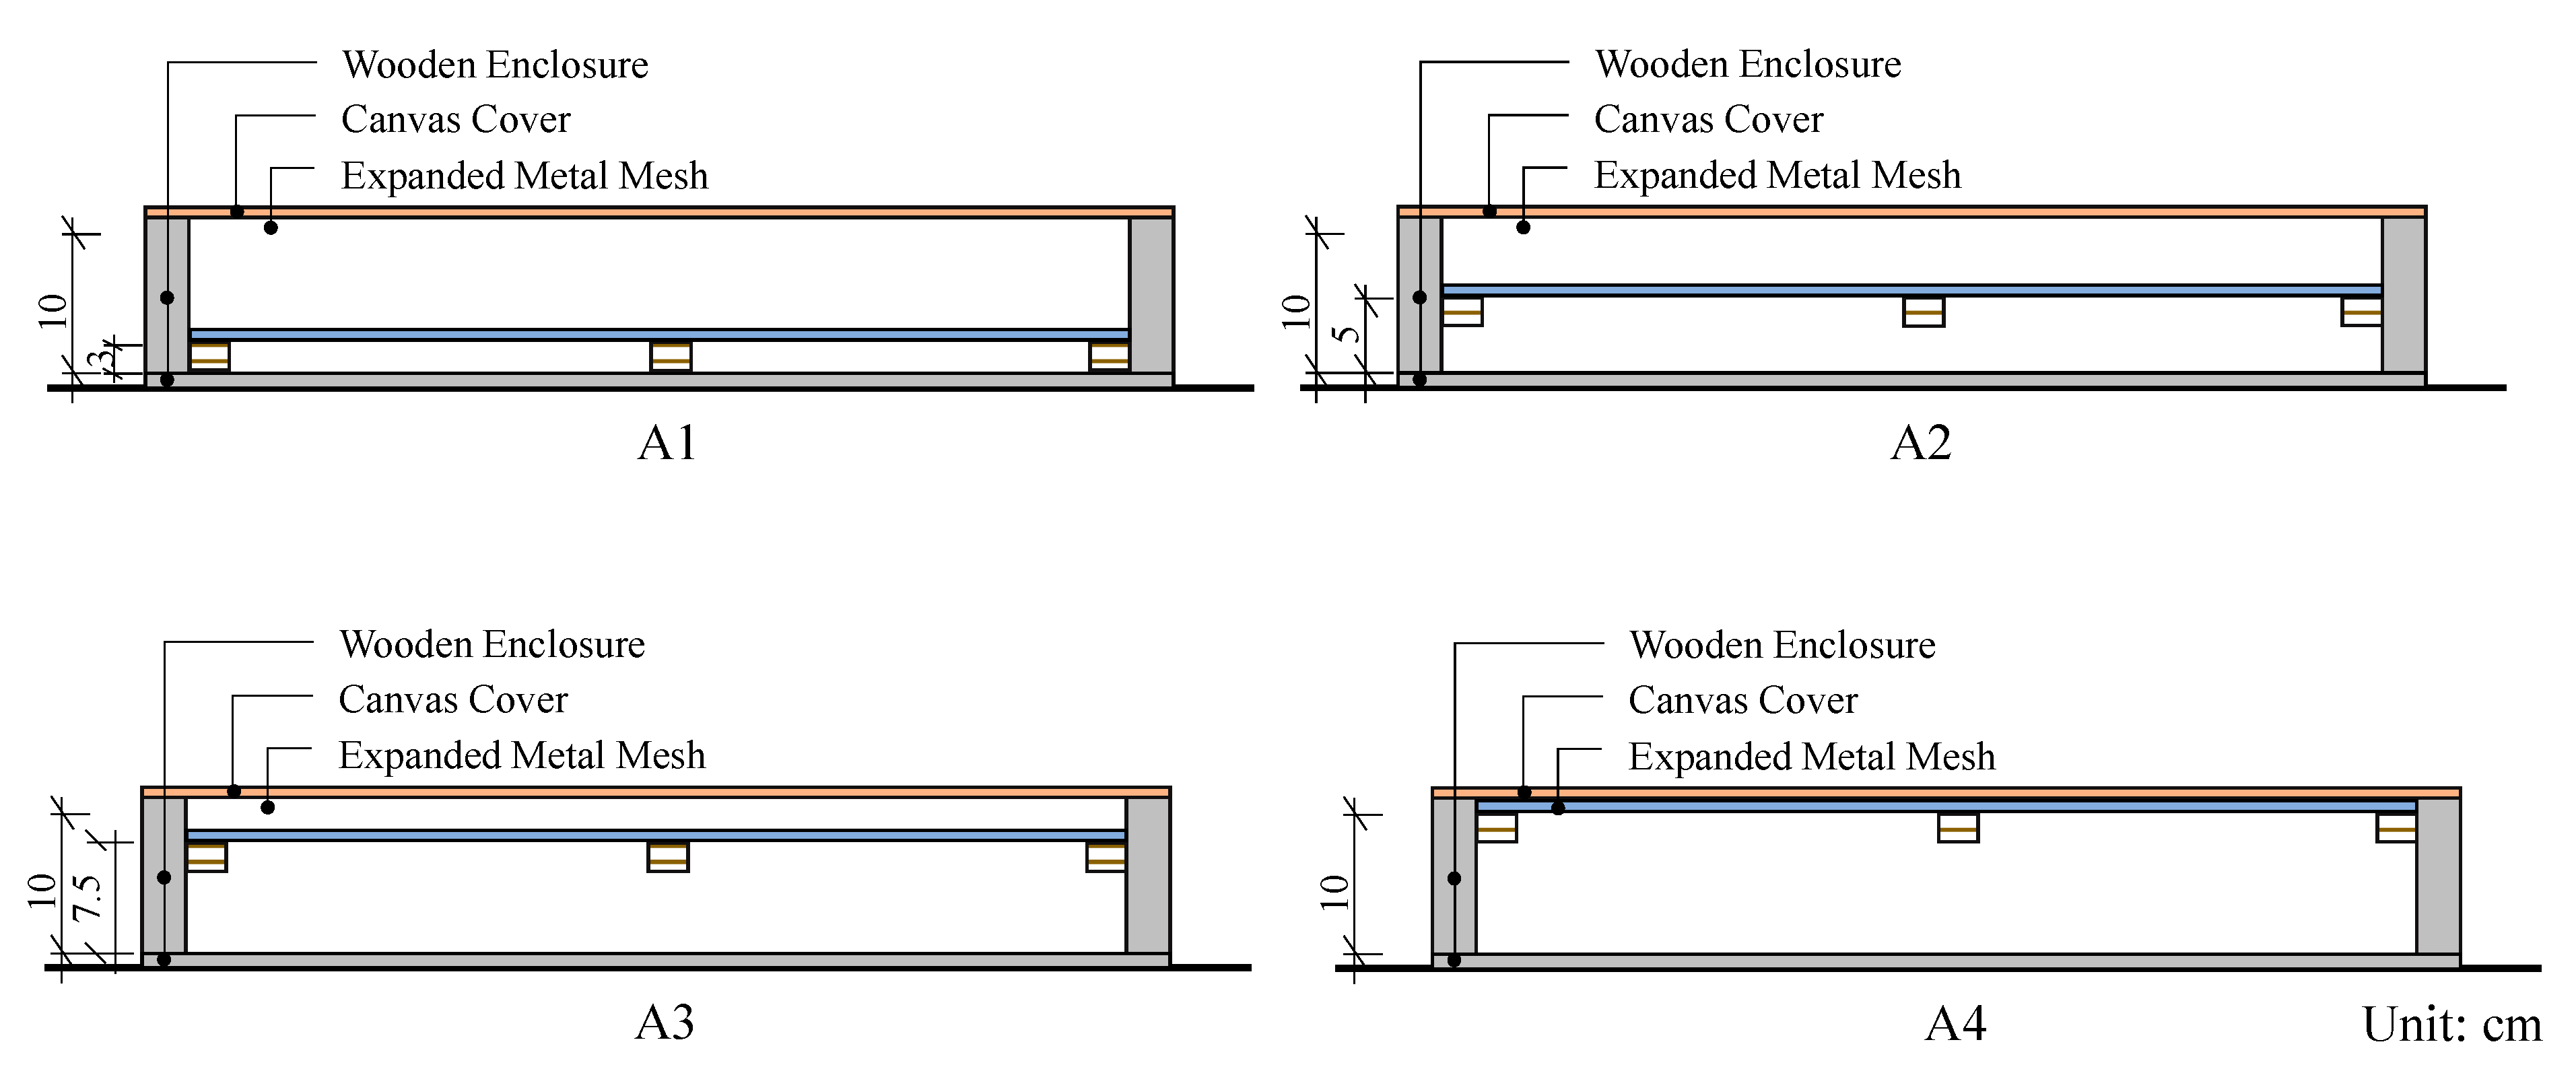
2.1. Specimens
2.2. Experiments
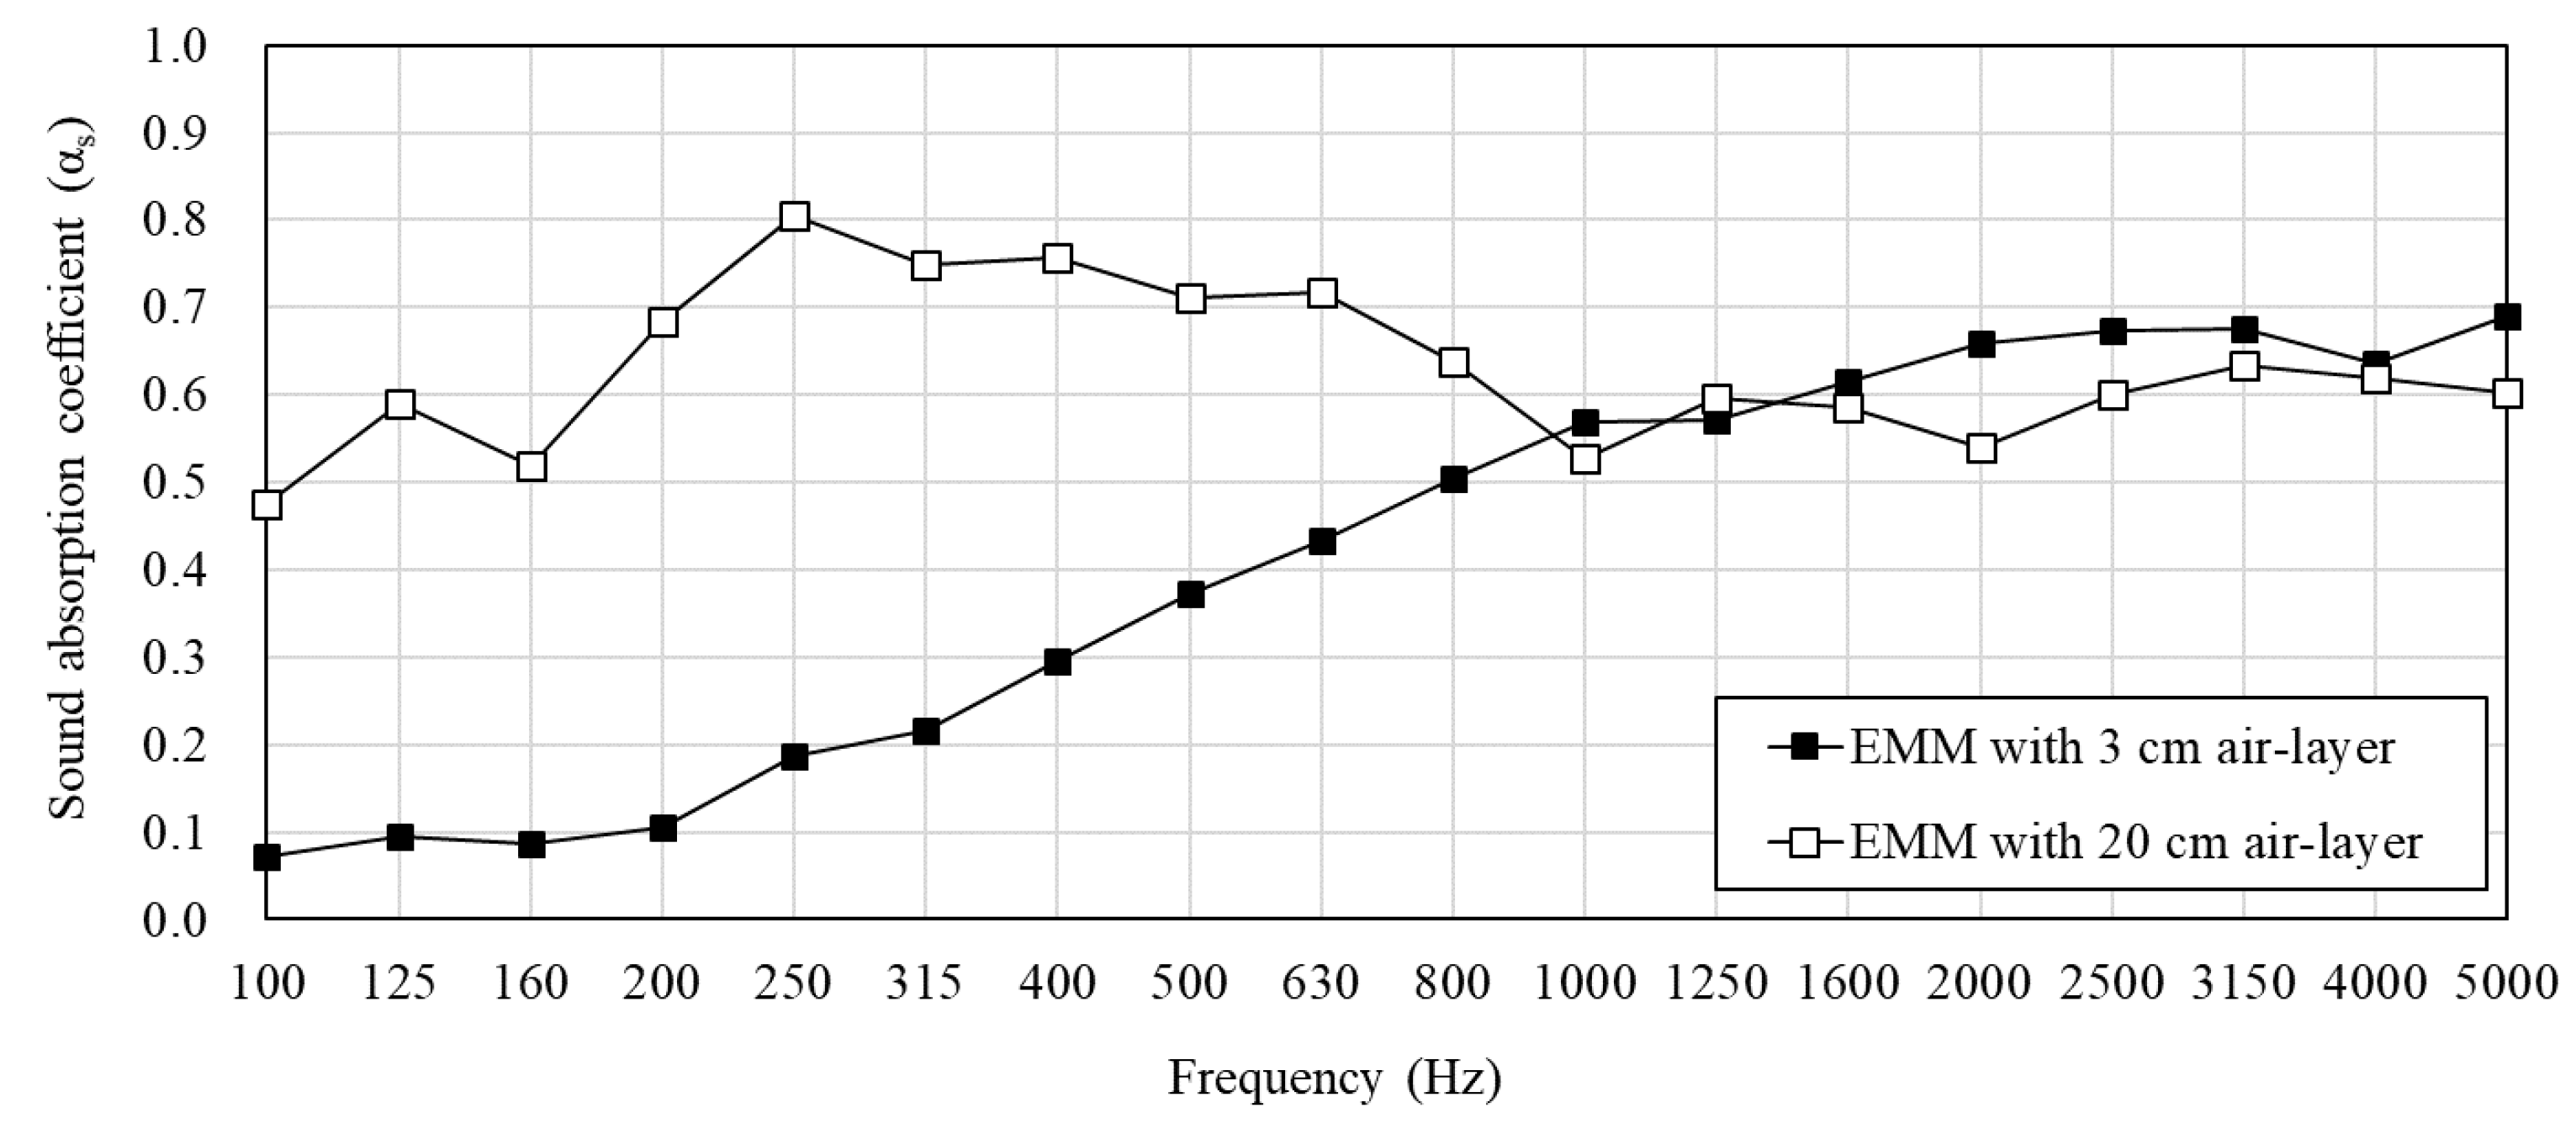
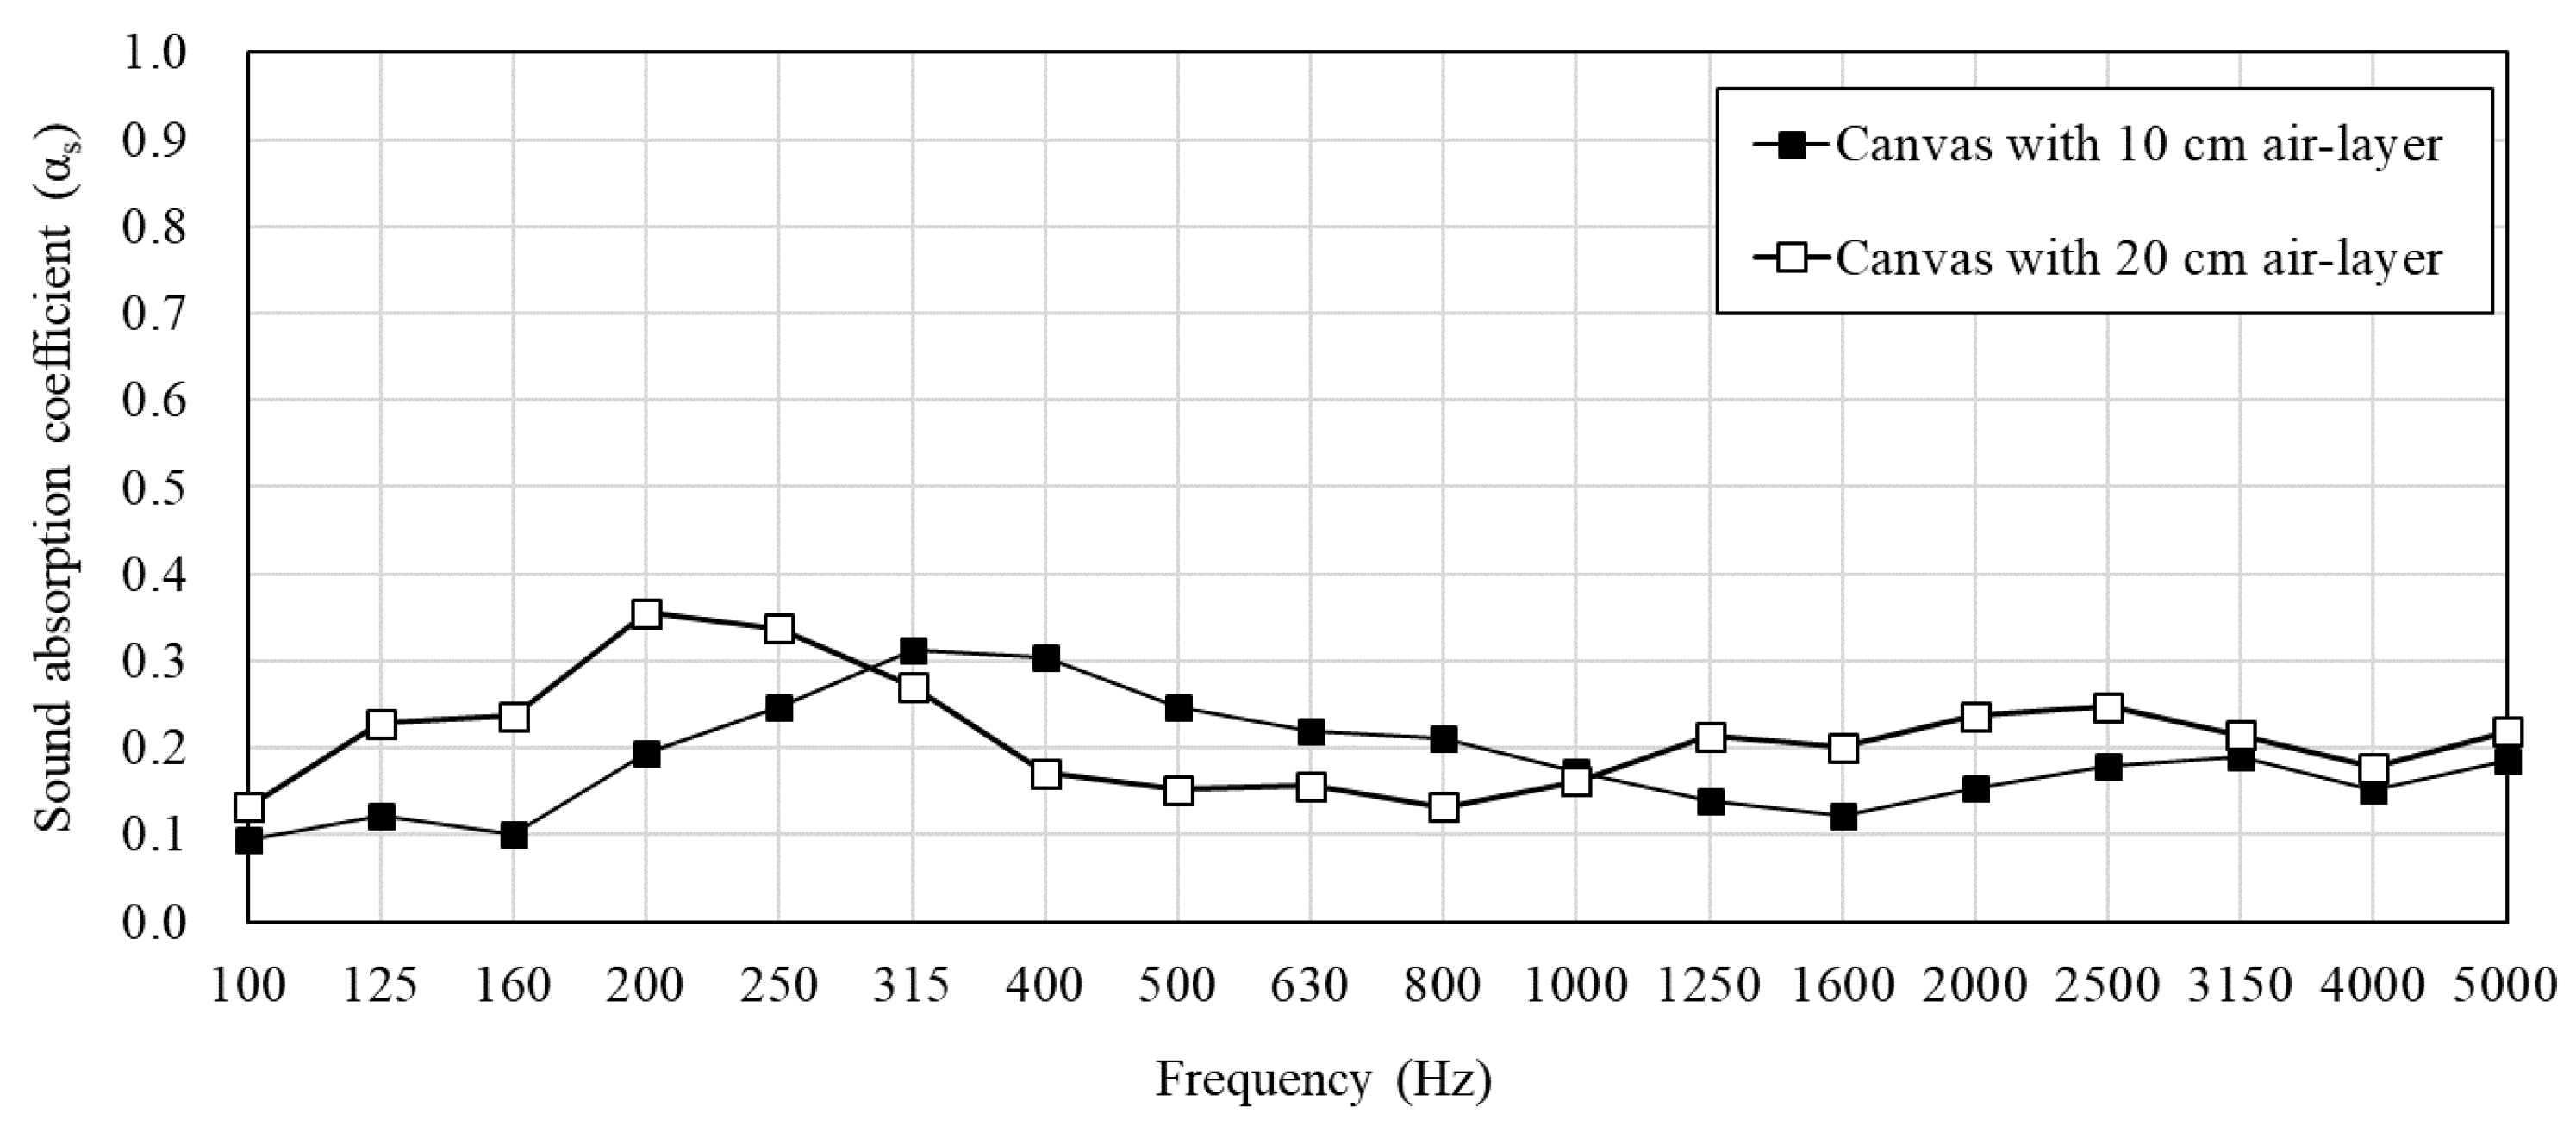
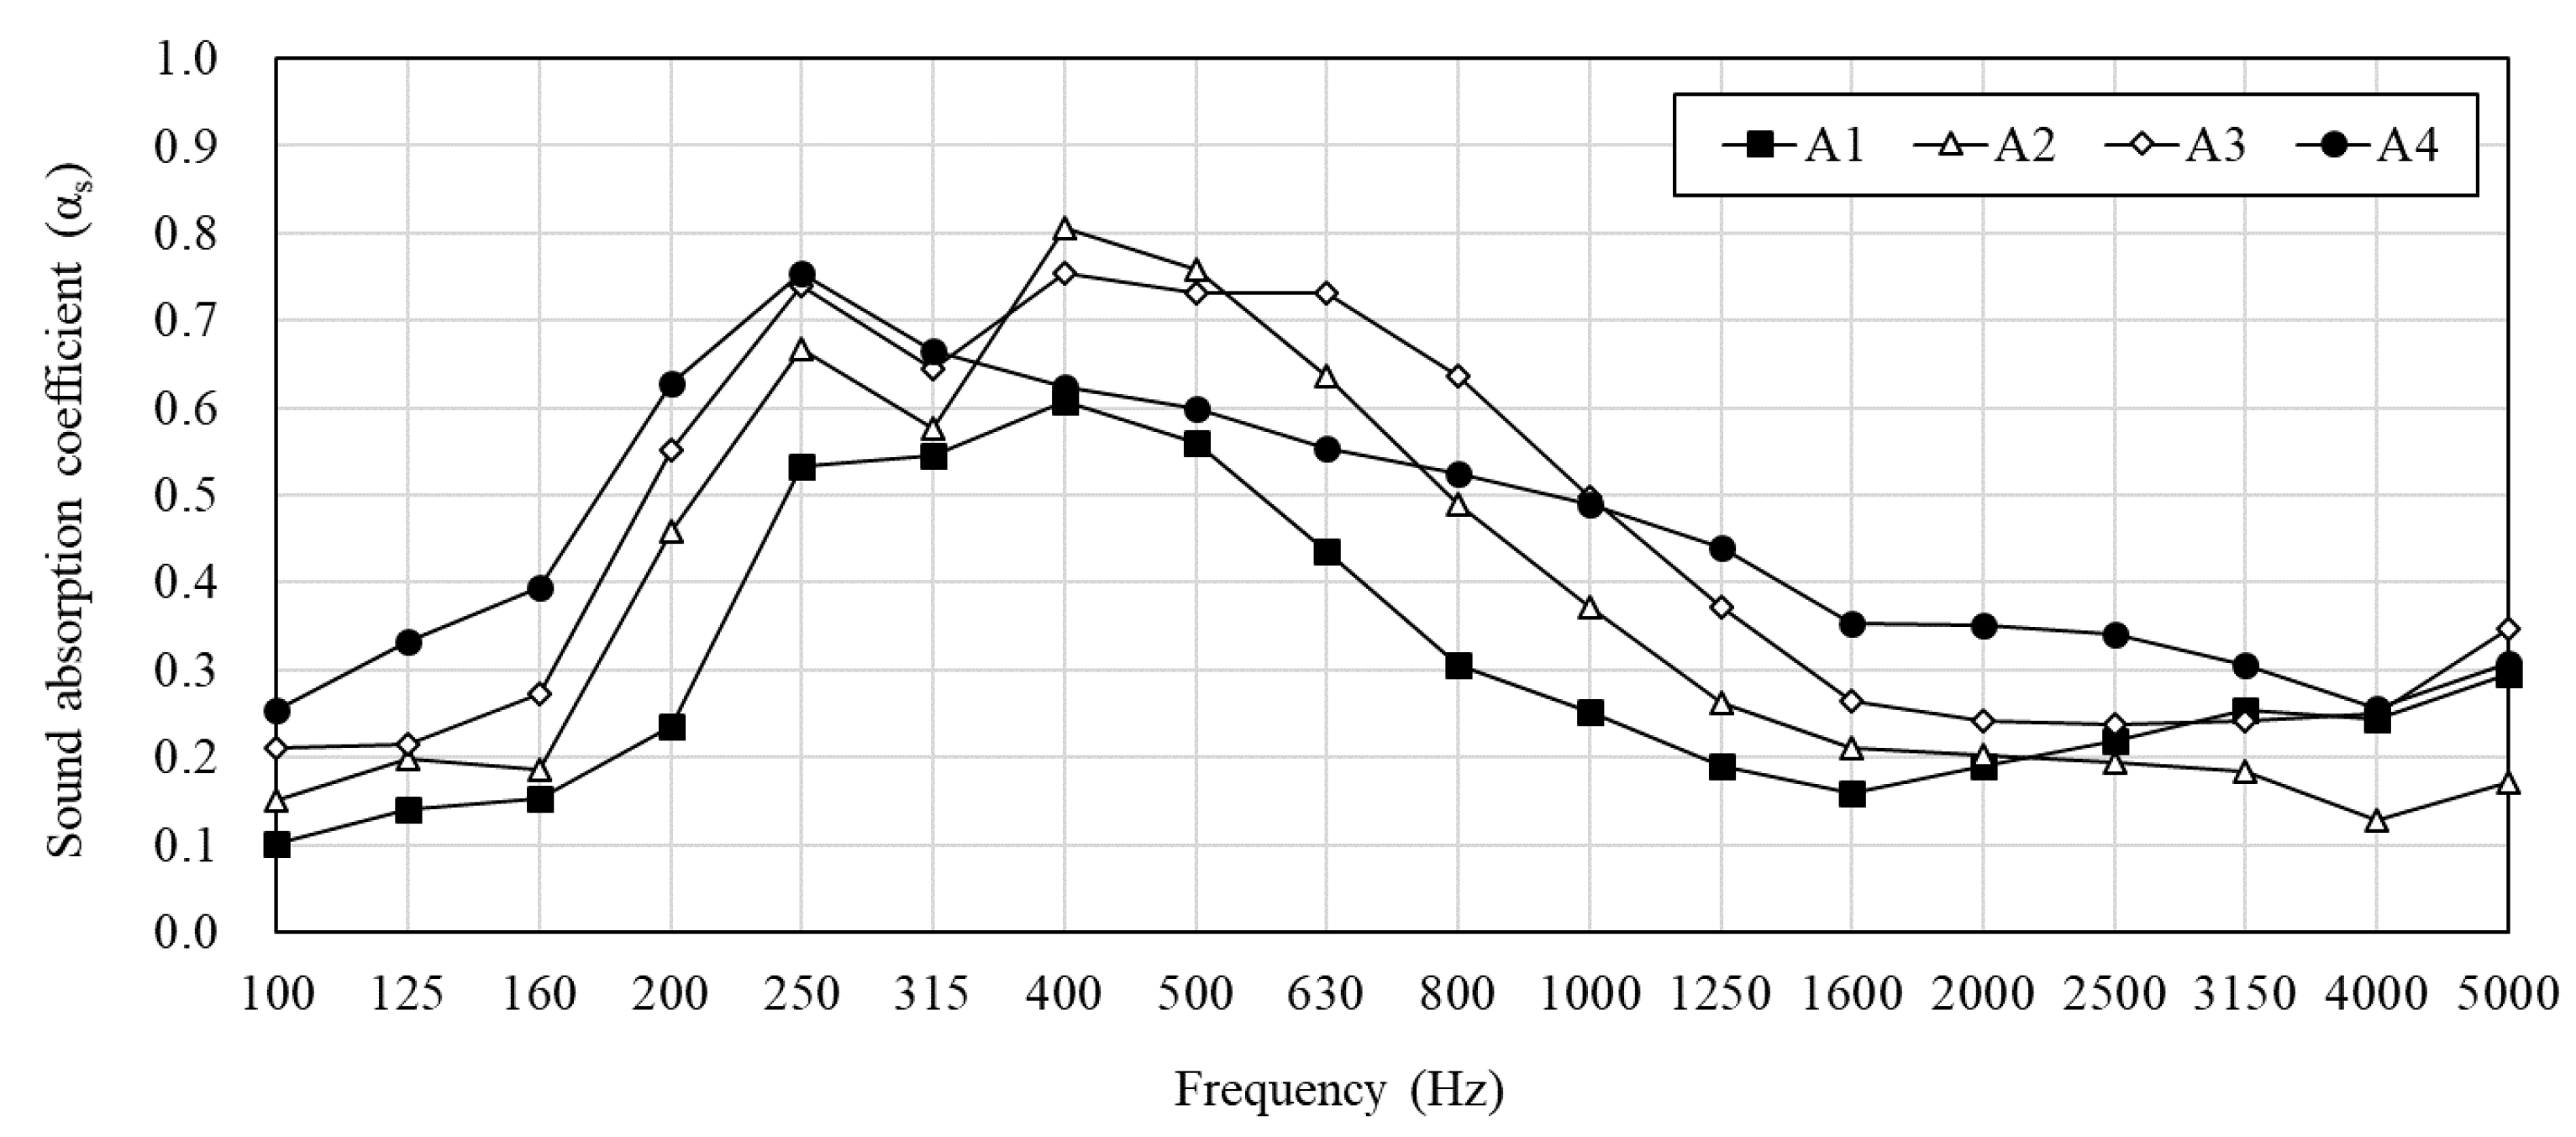
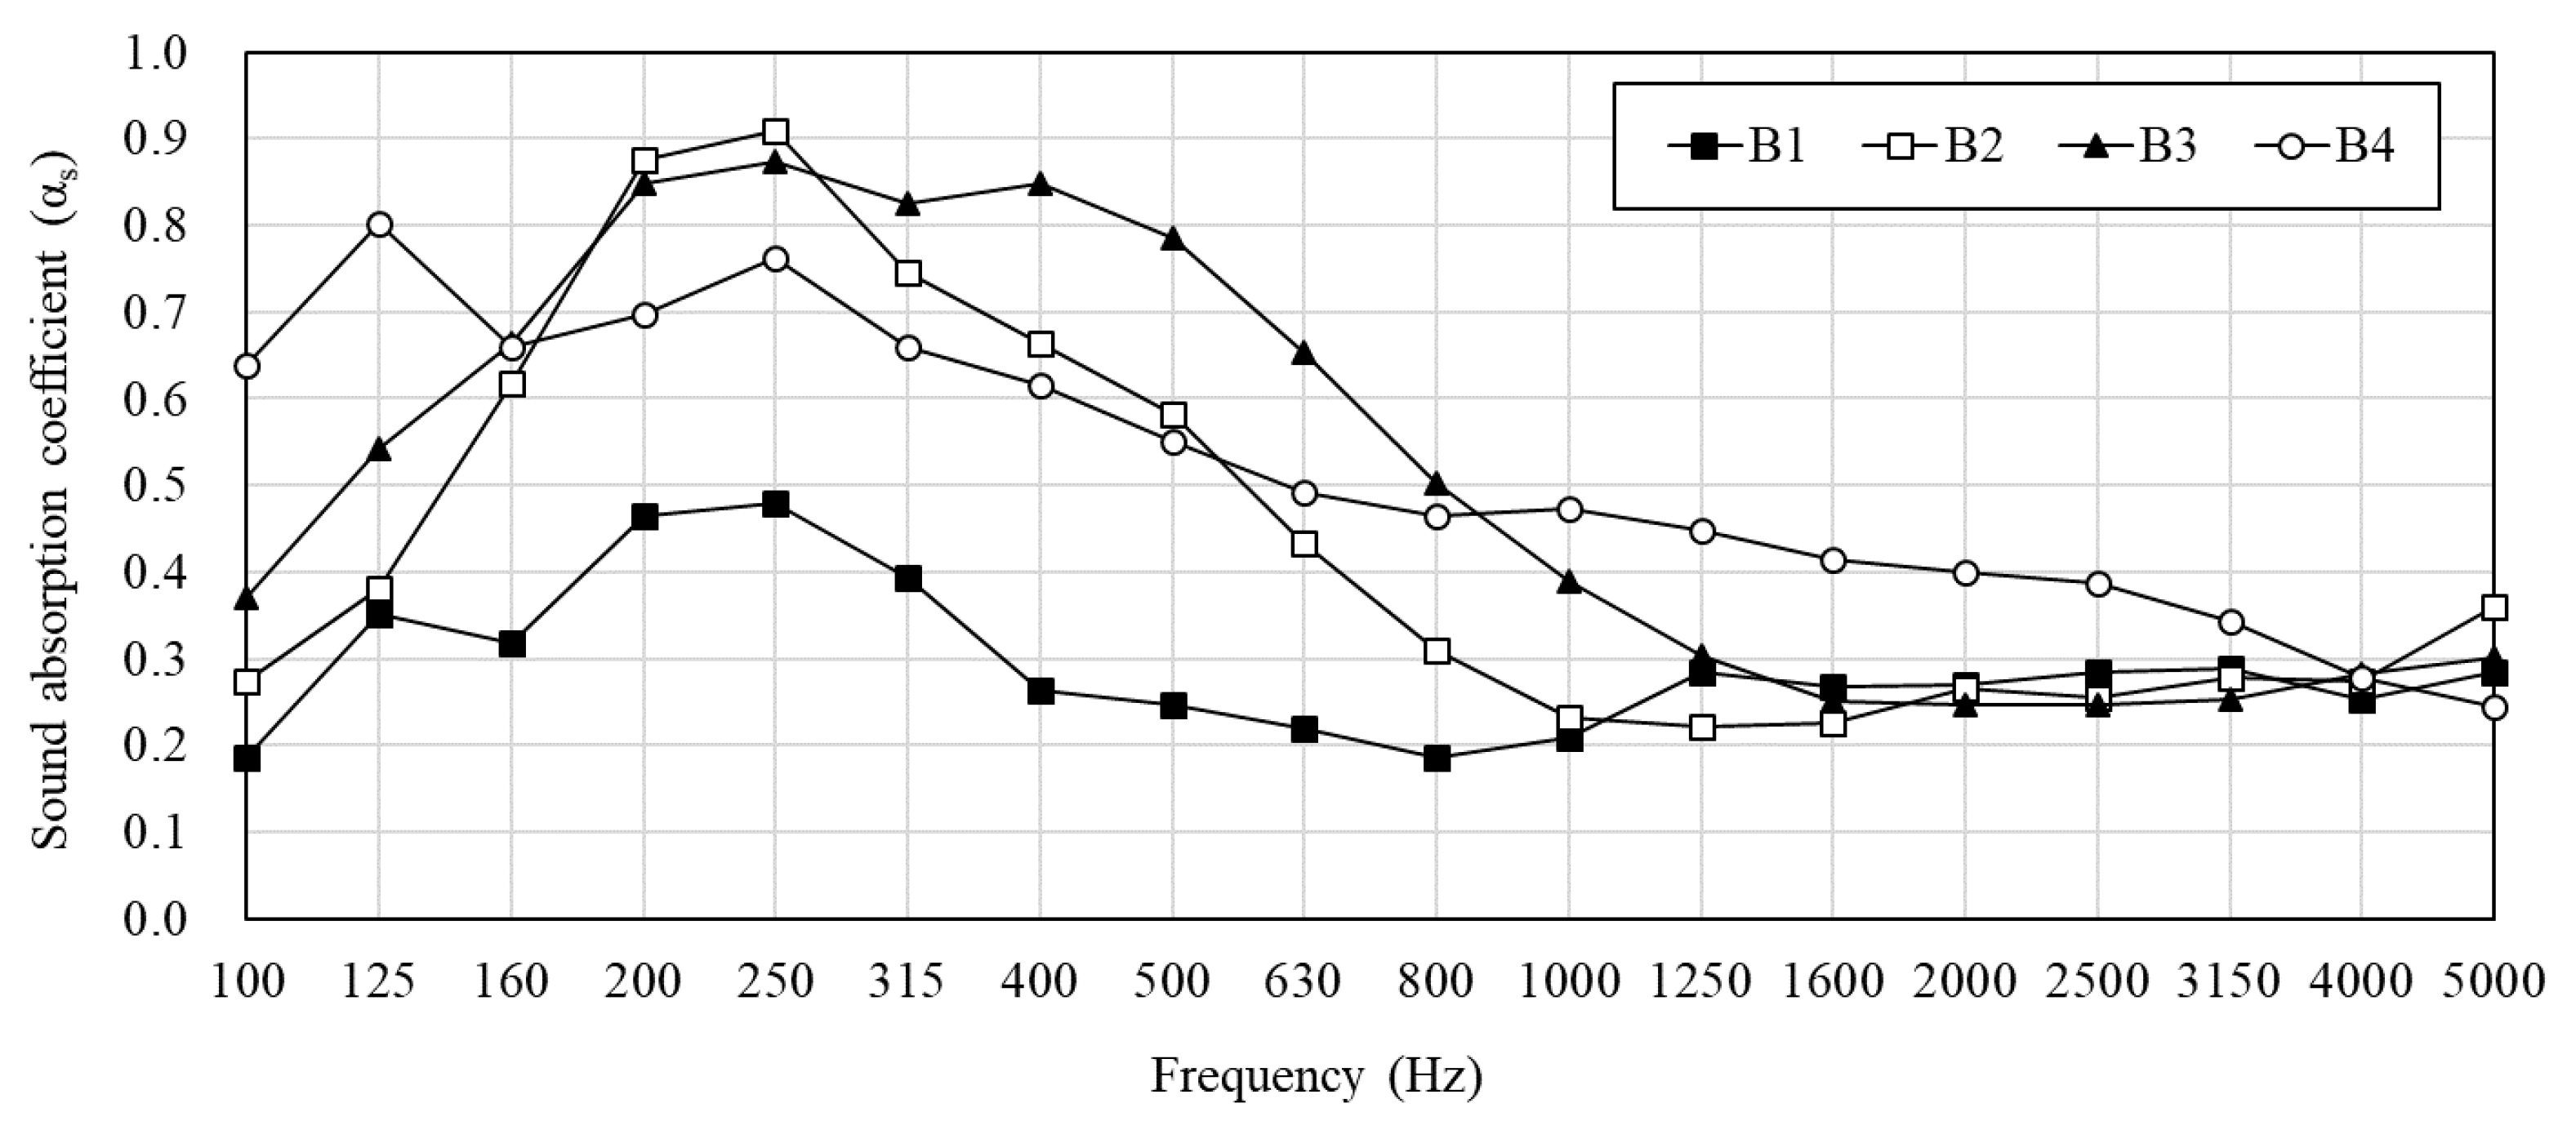
3. Measurement Results of PMRA
4. Field Validation of PMRA
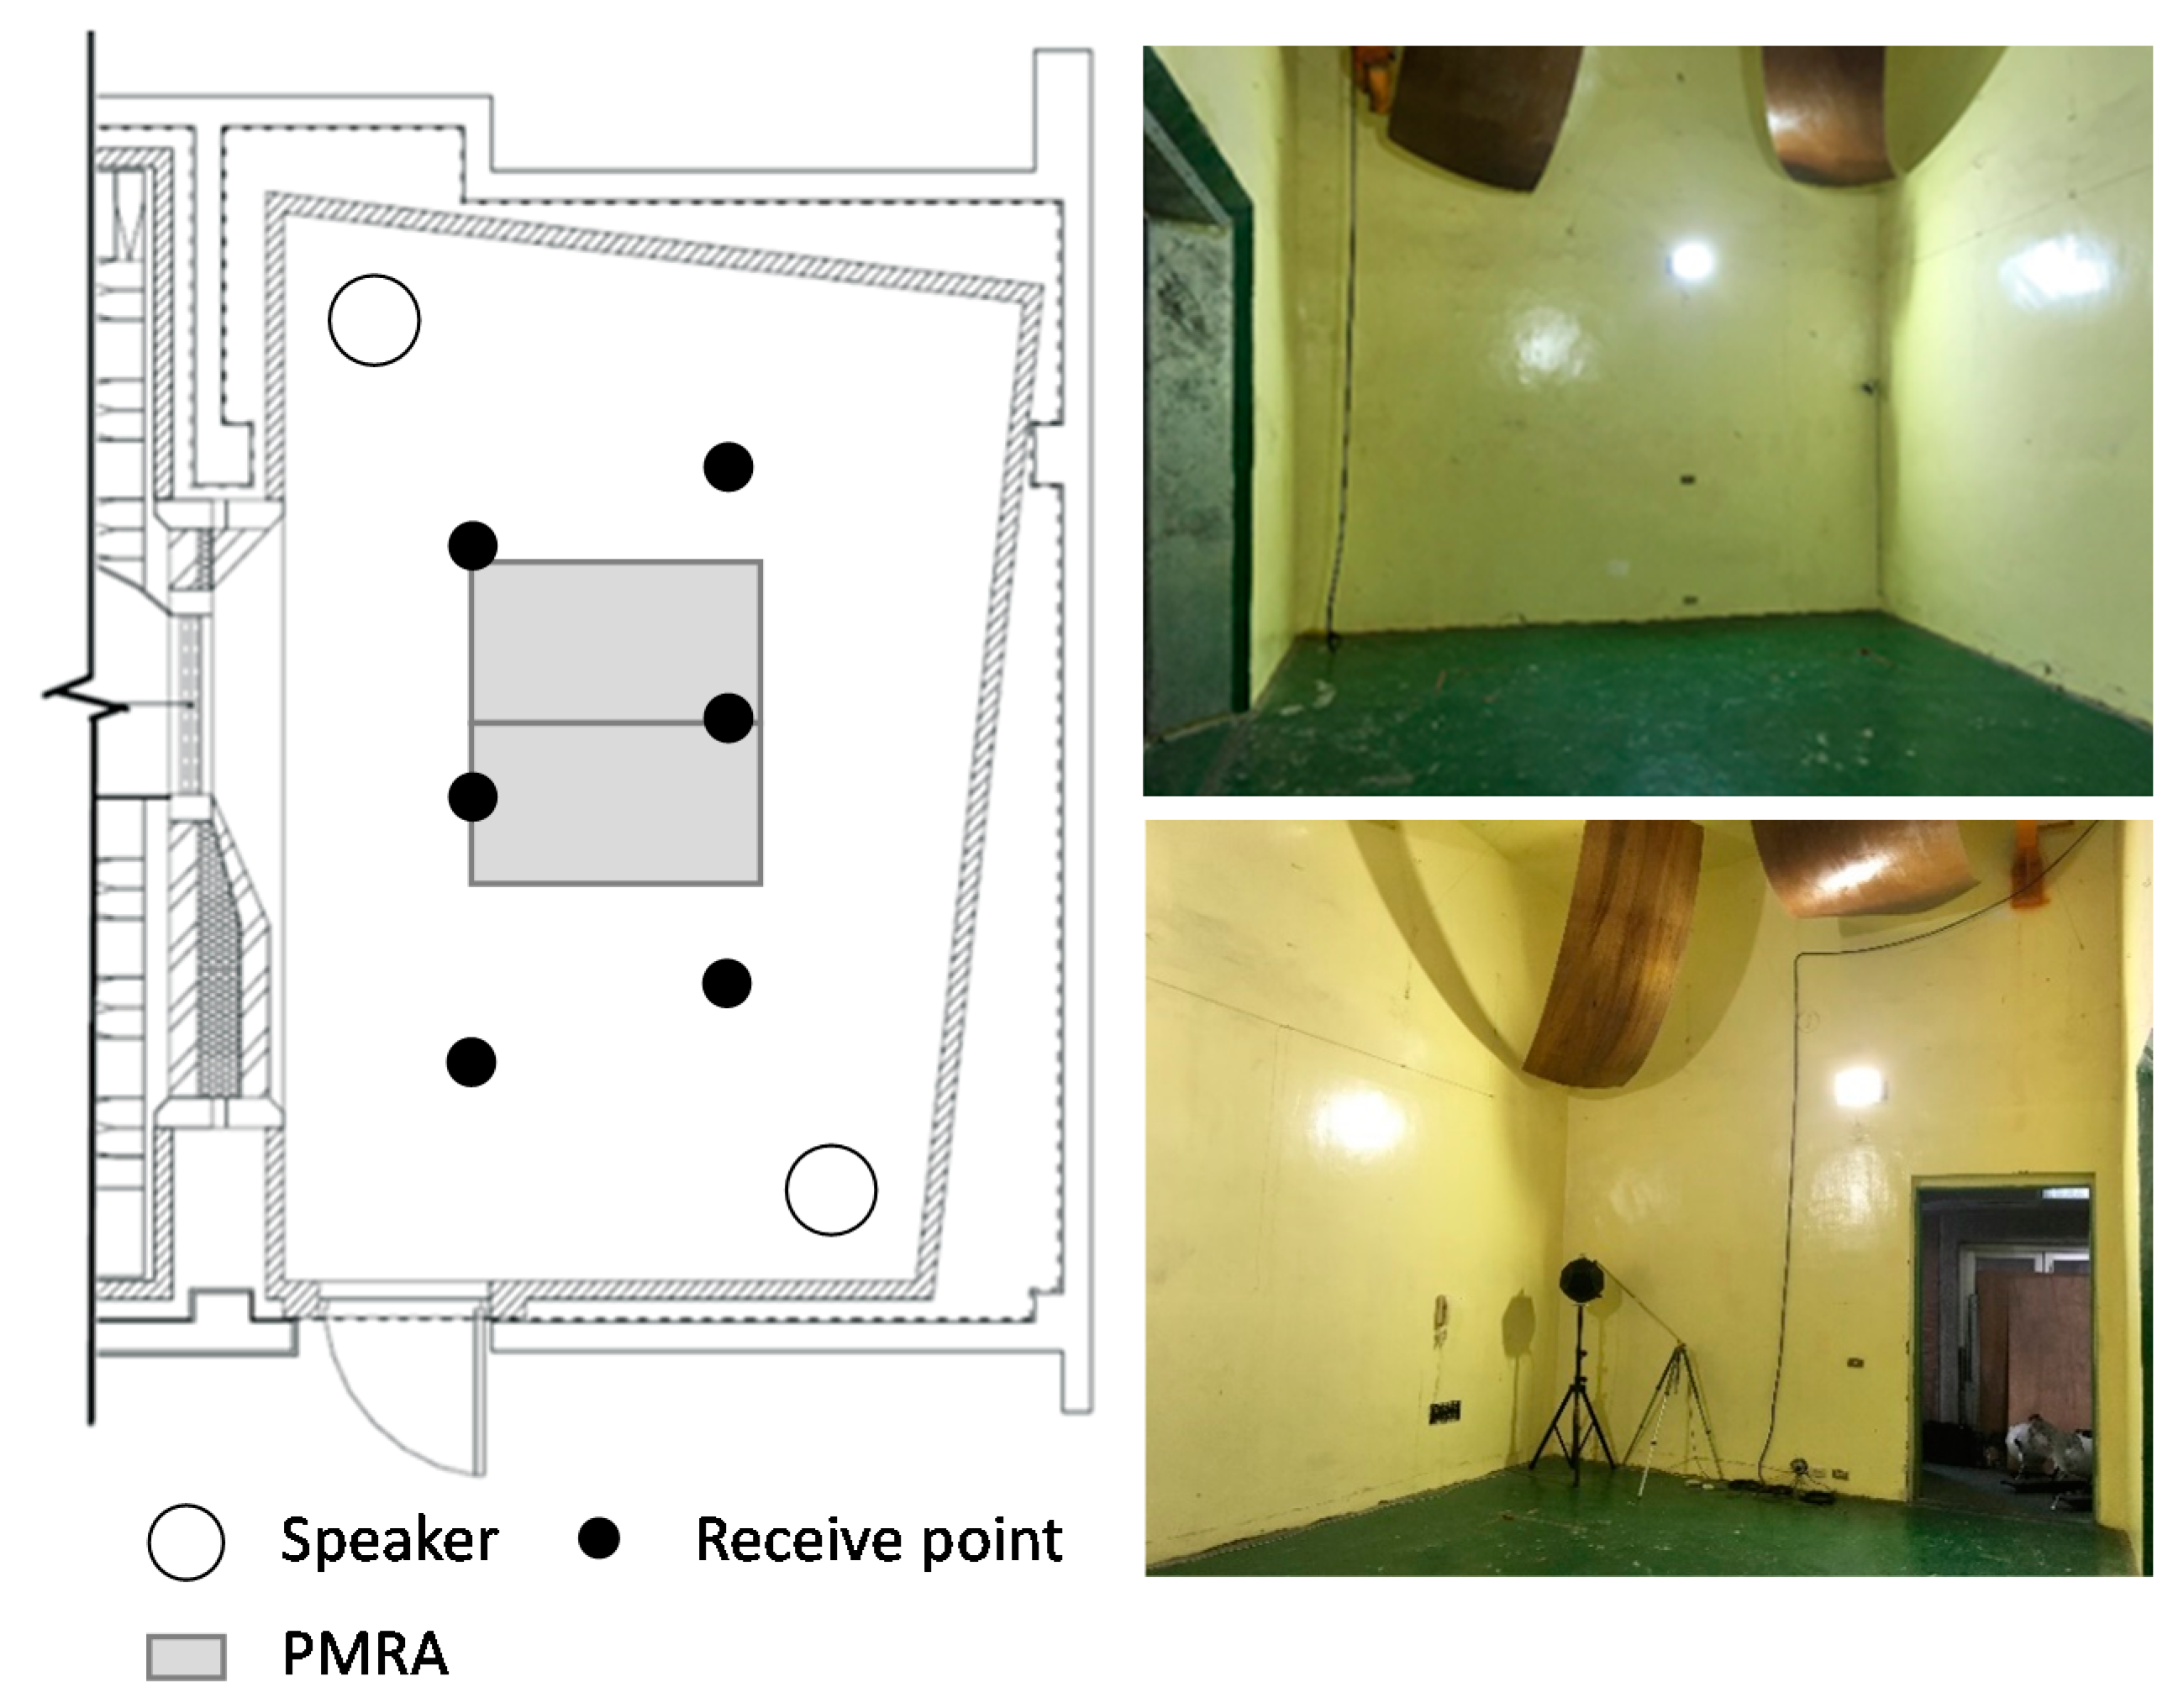
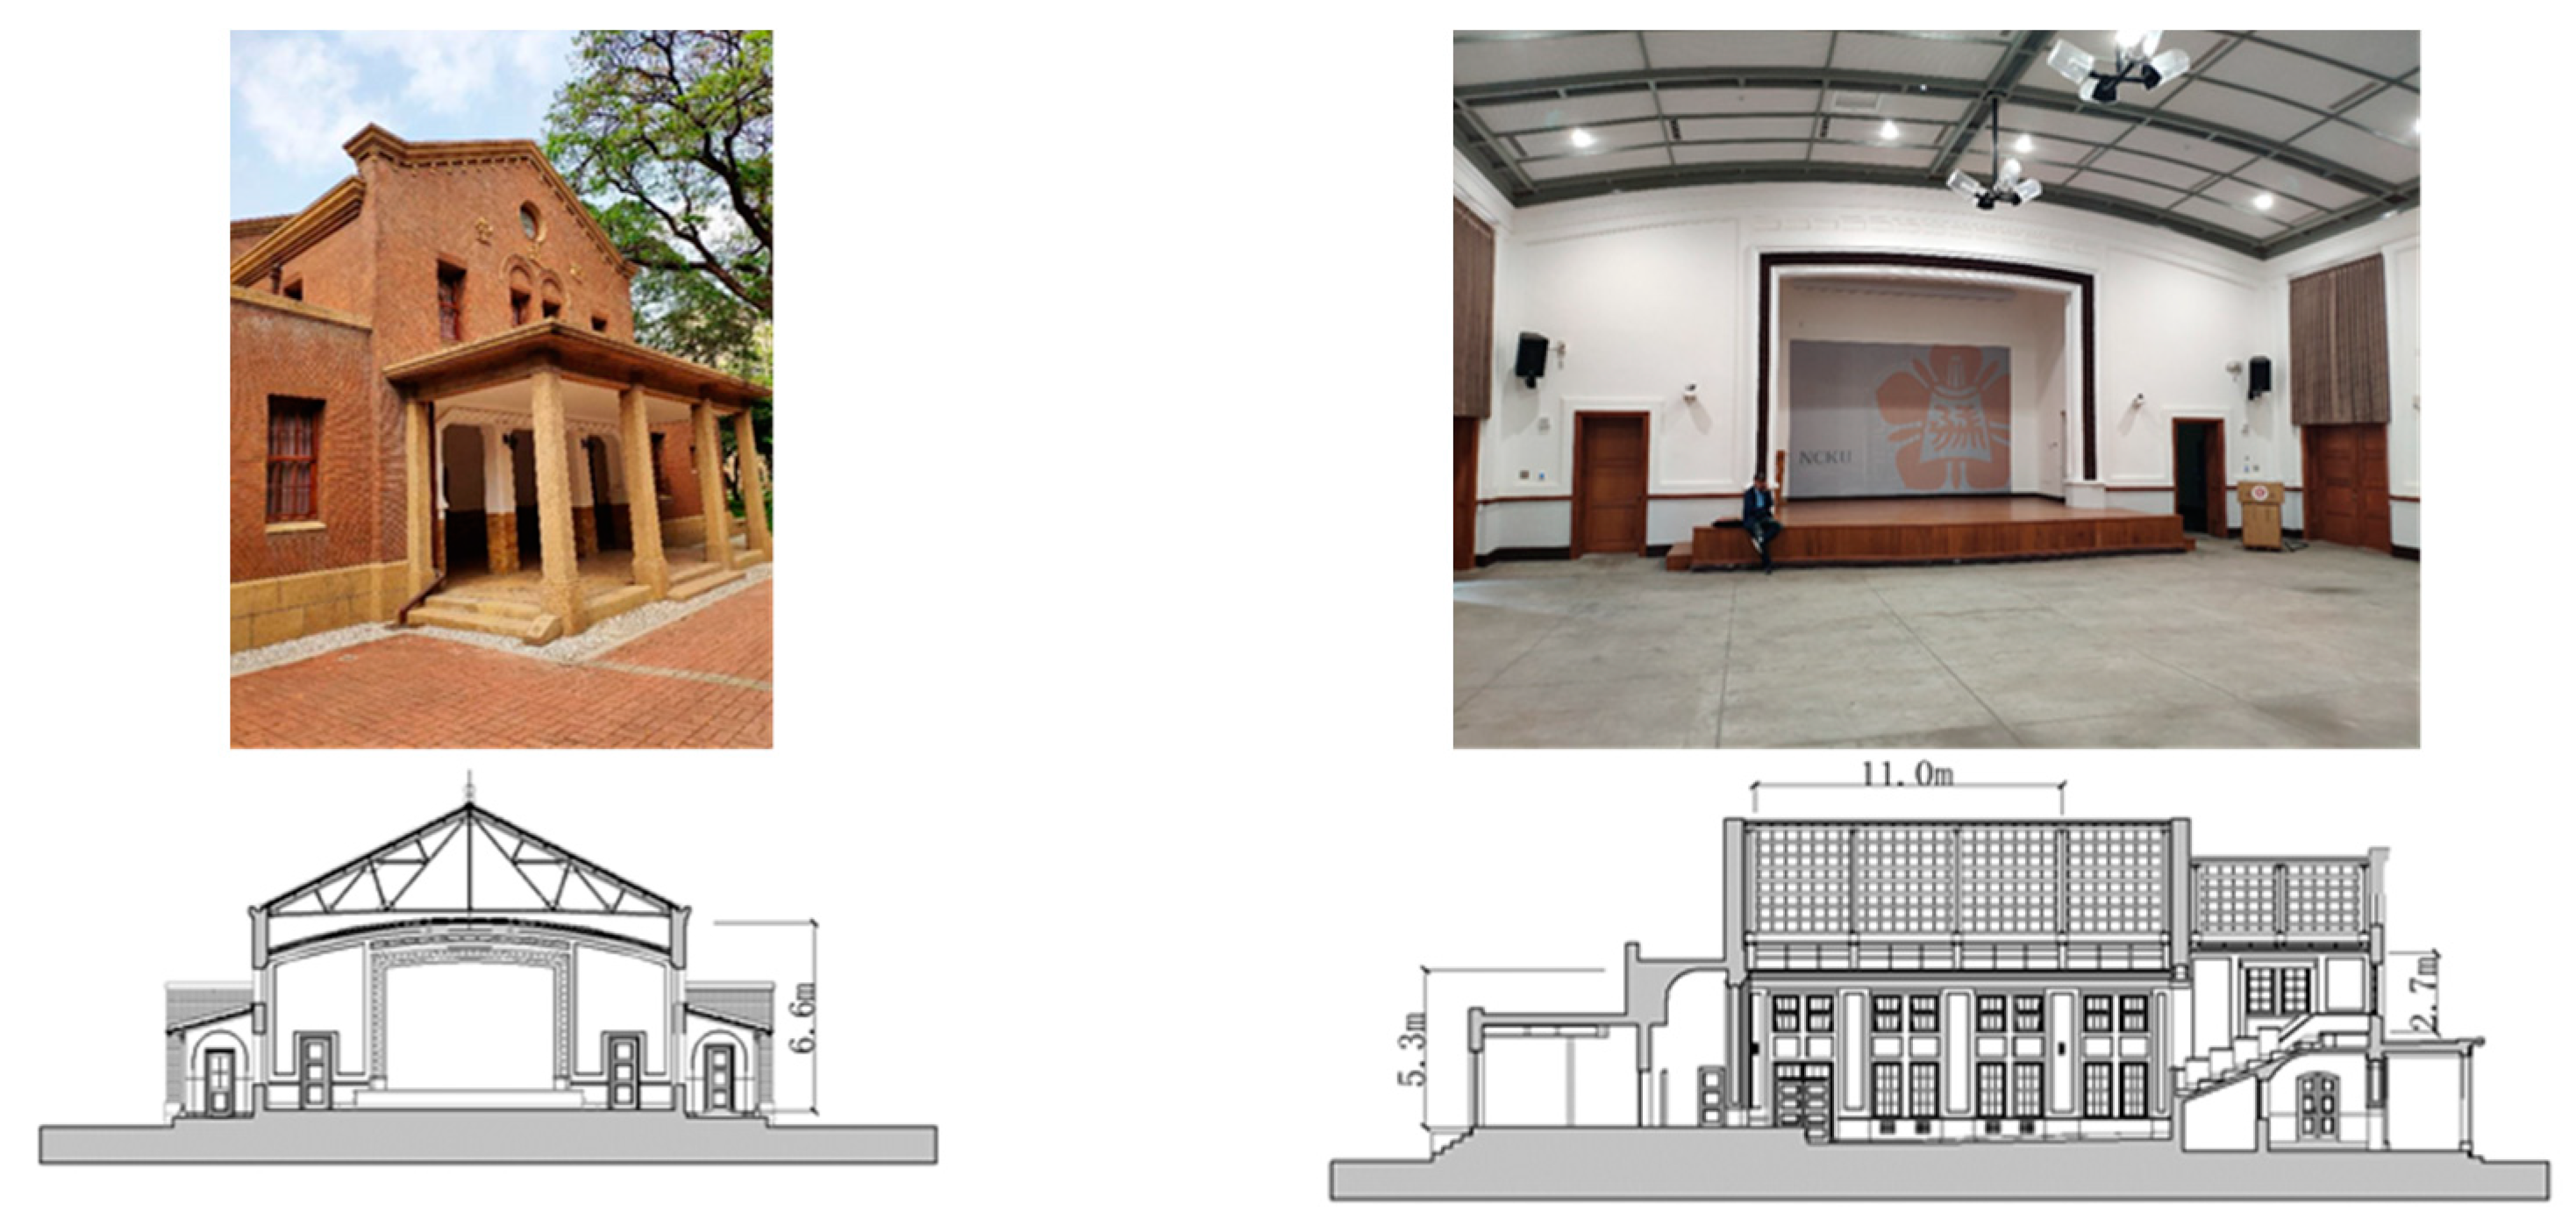
4.1. The Historic Building
4.2. Acoustic Index
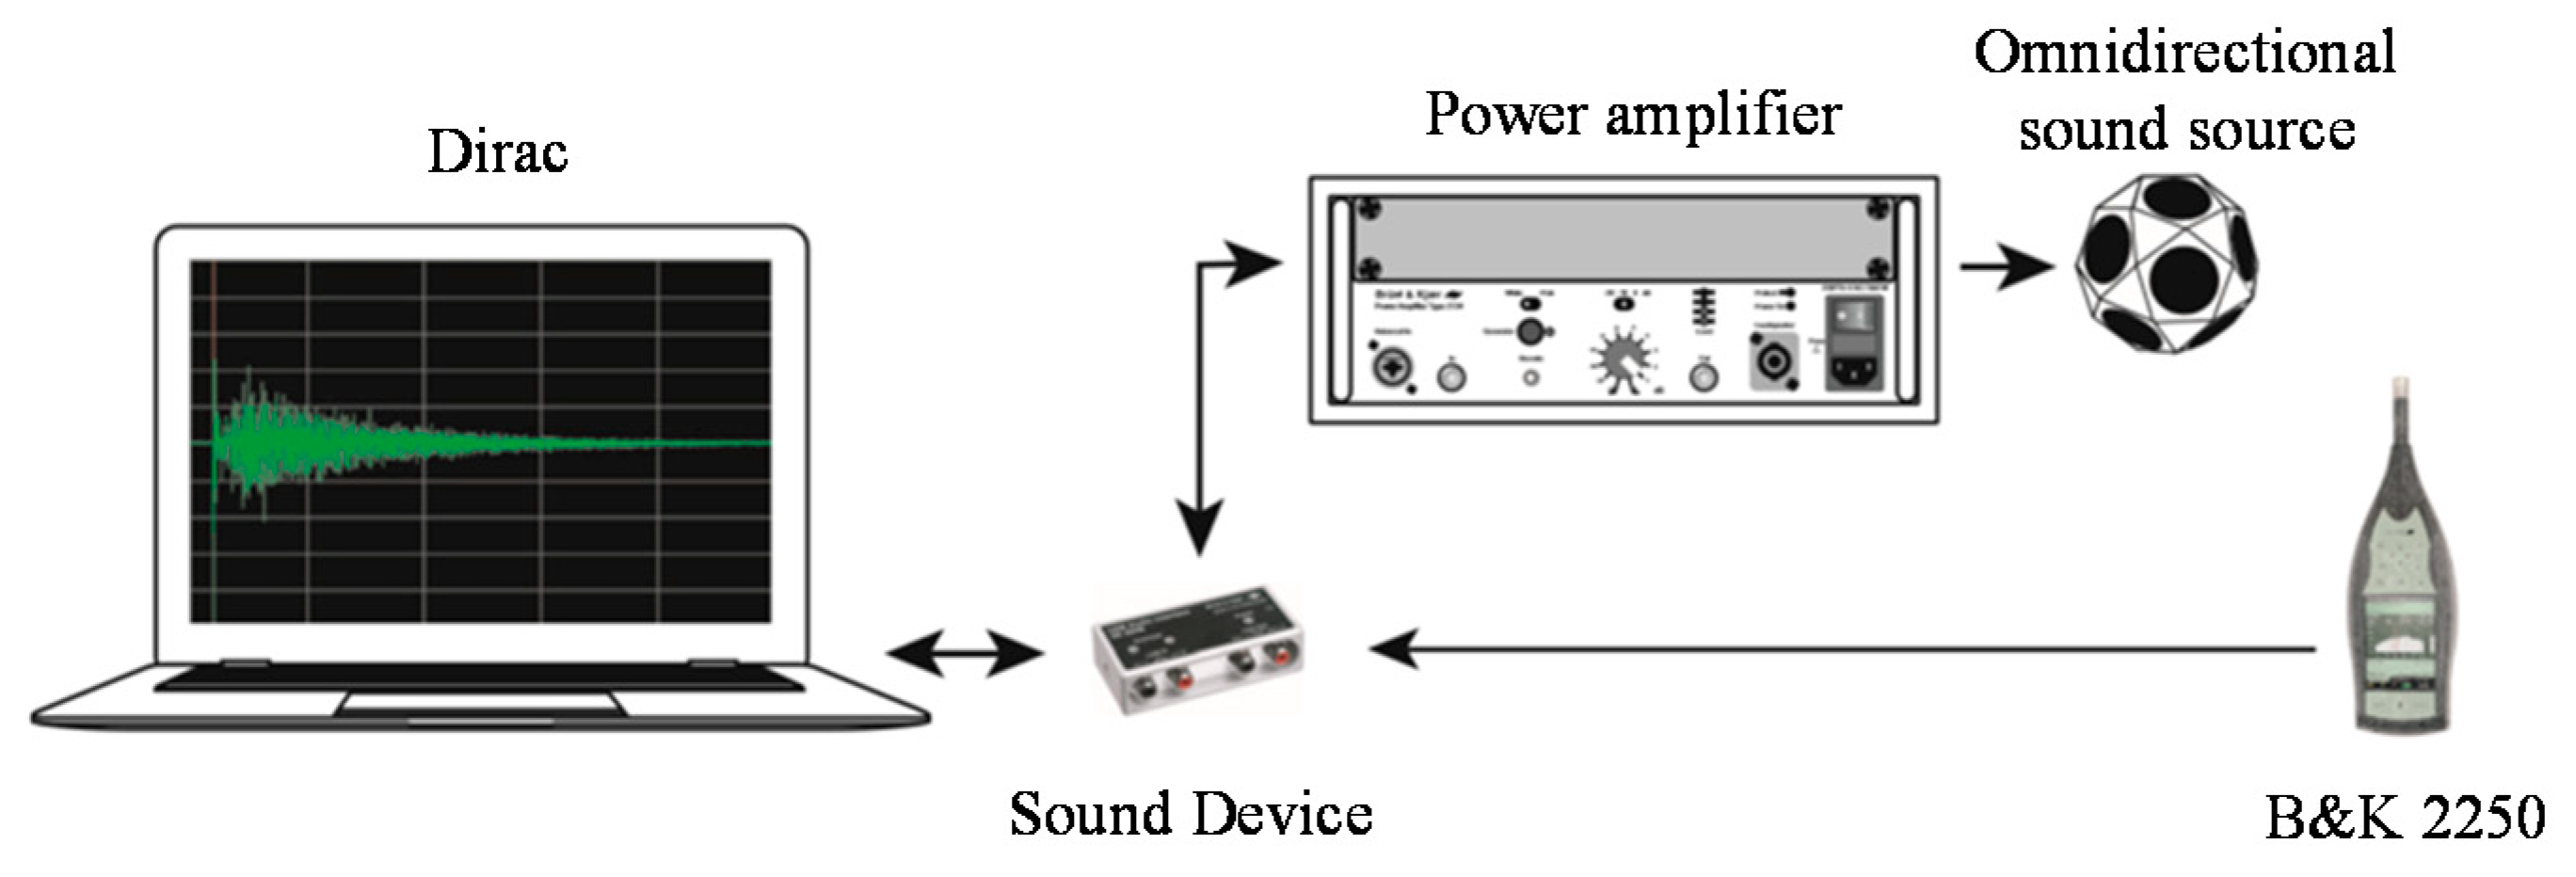
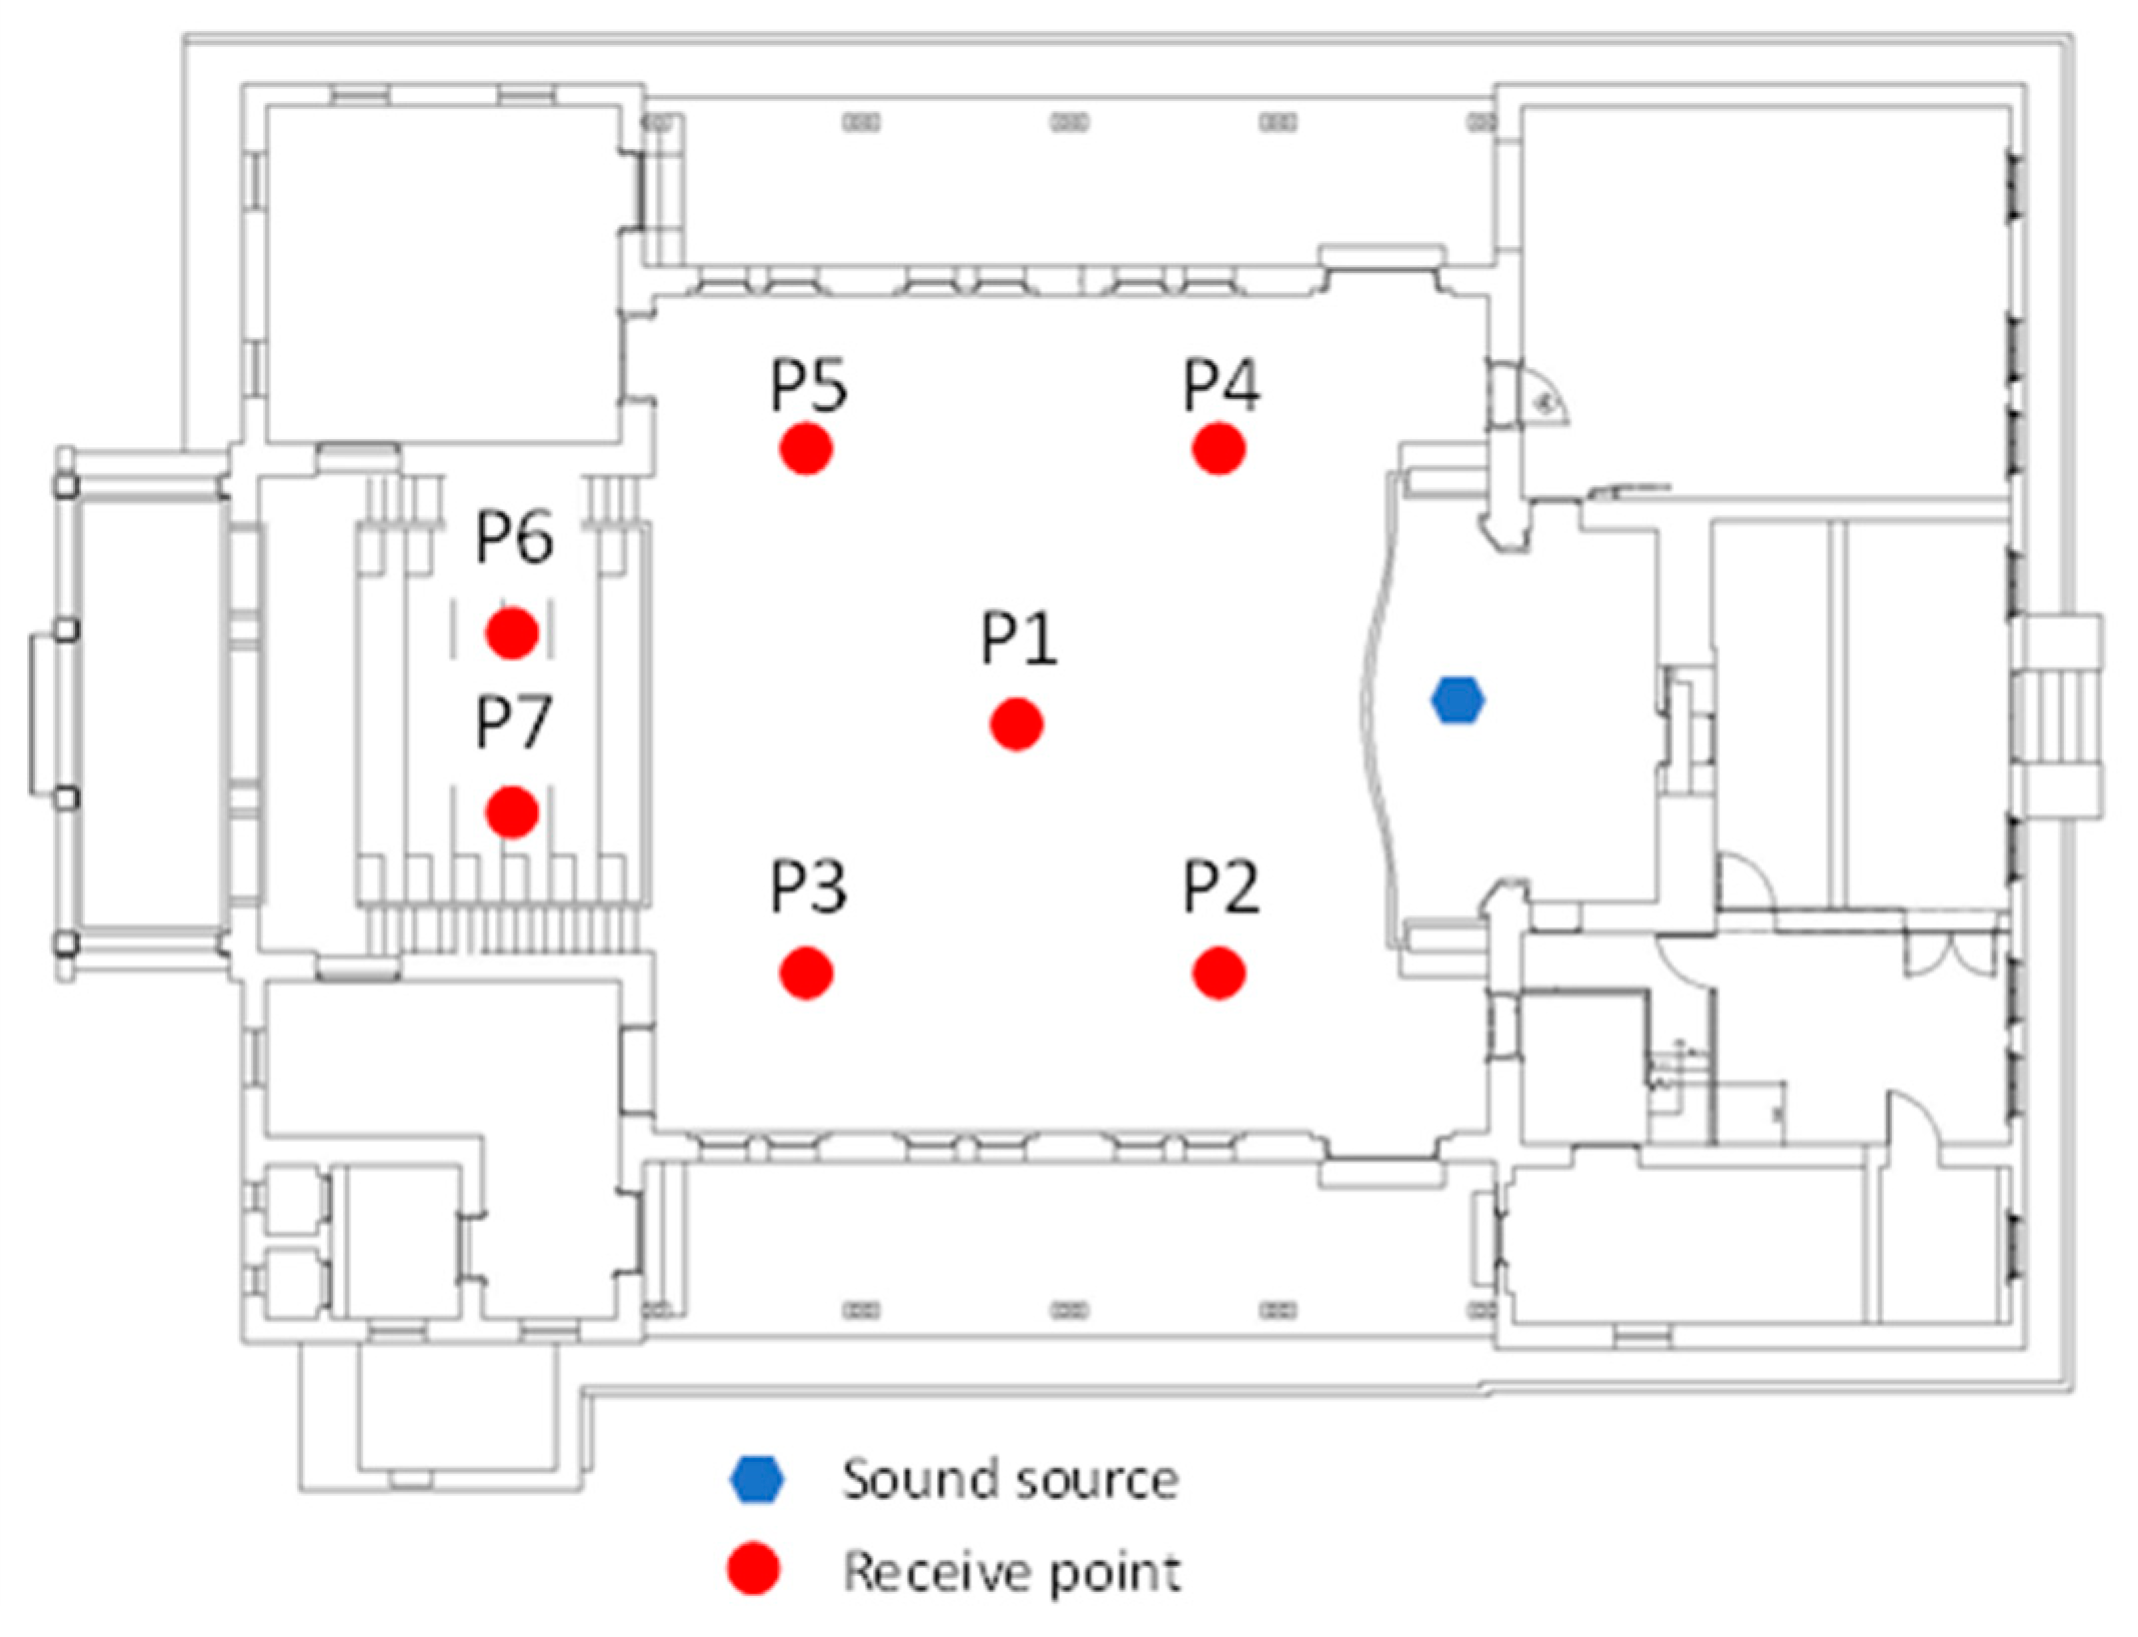
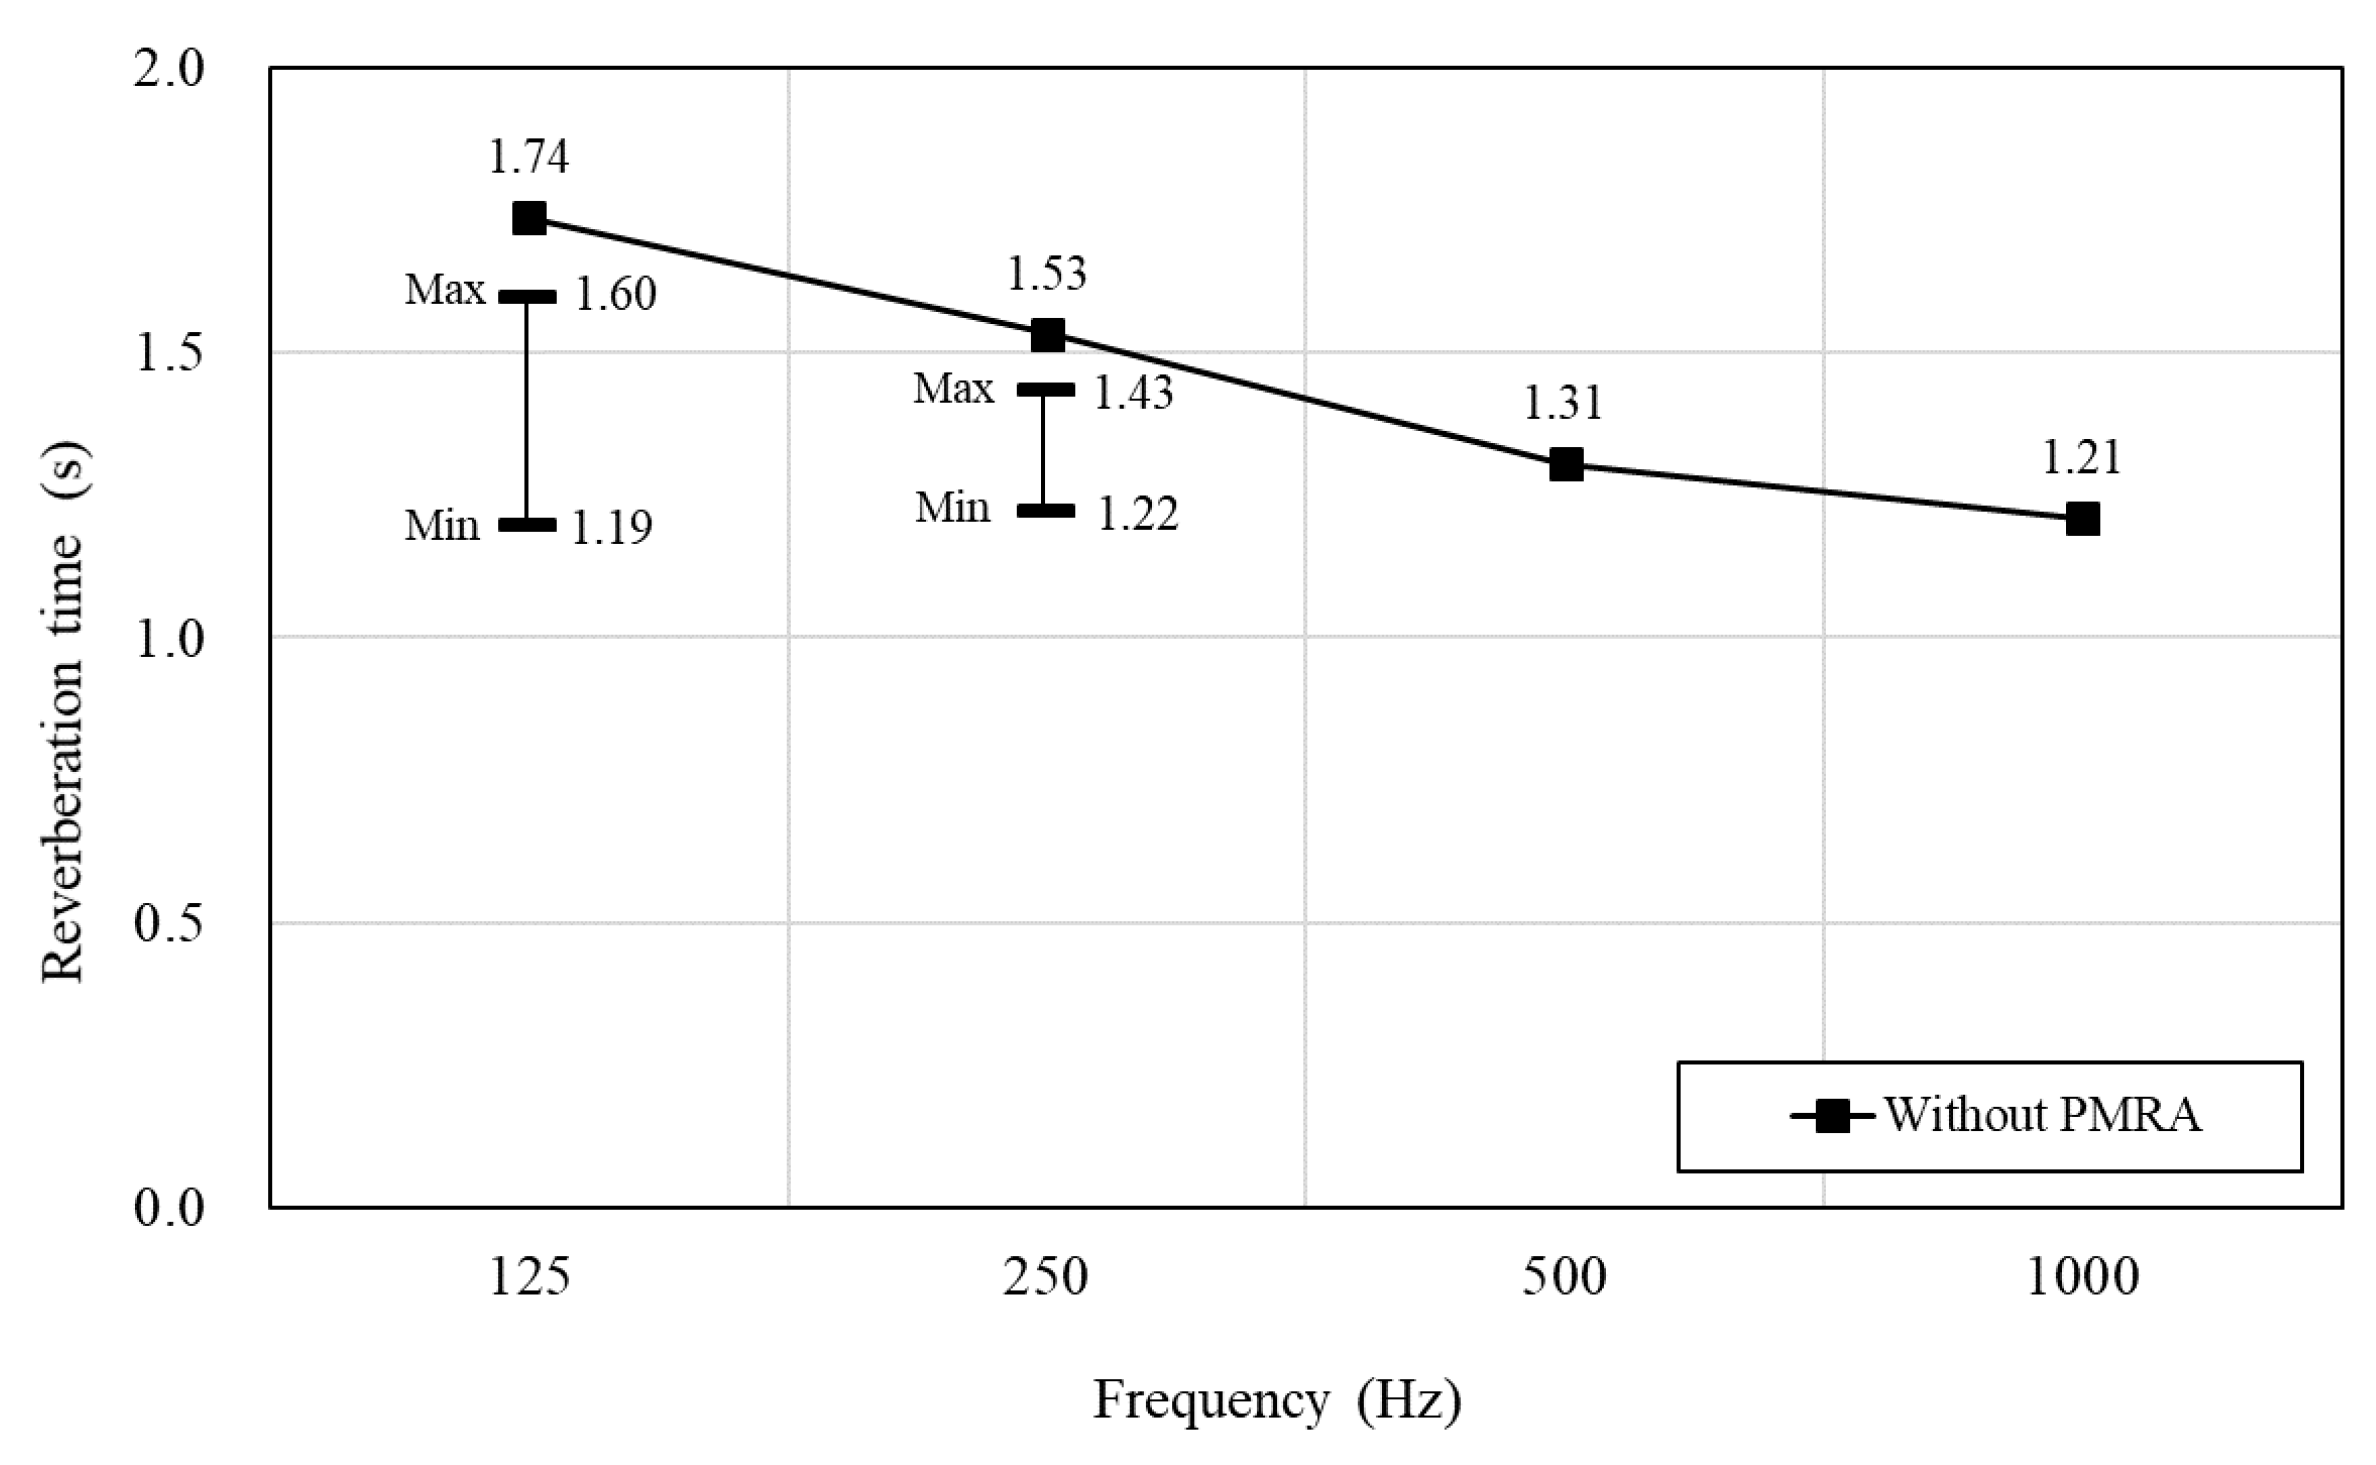
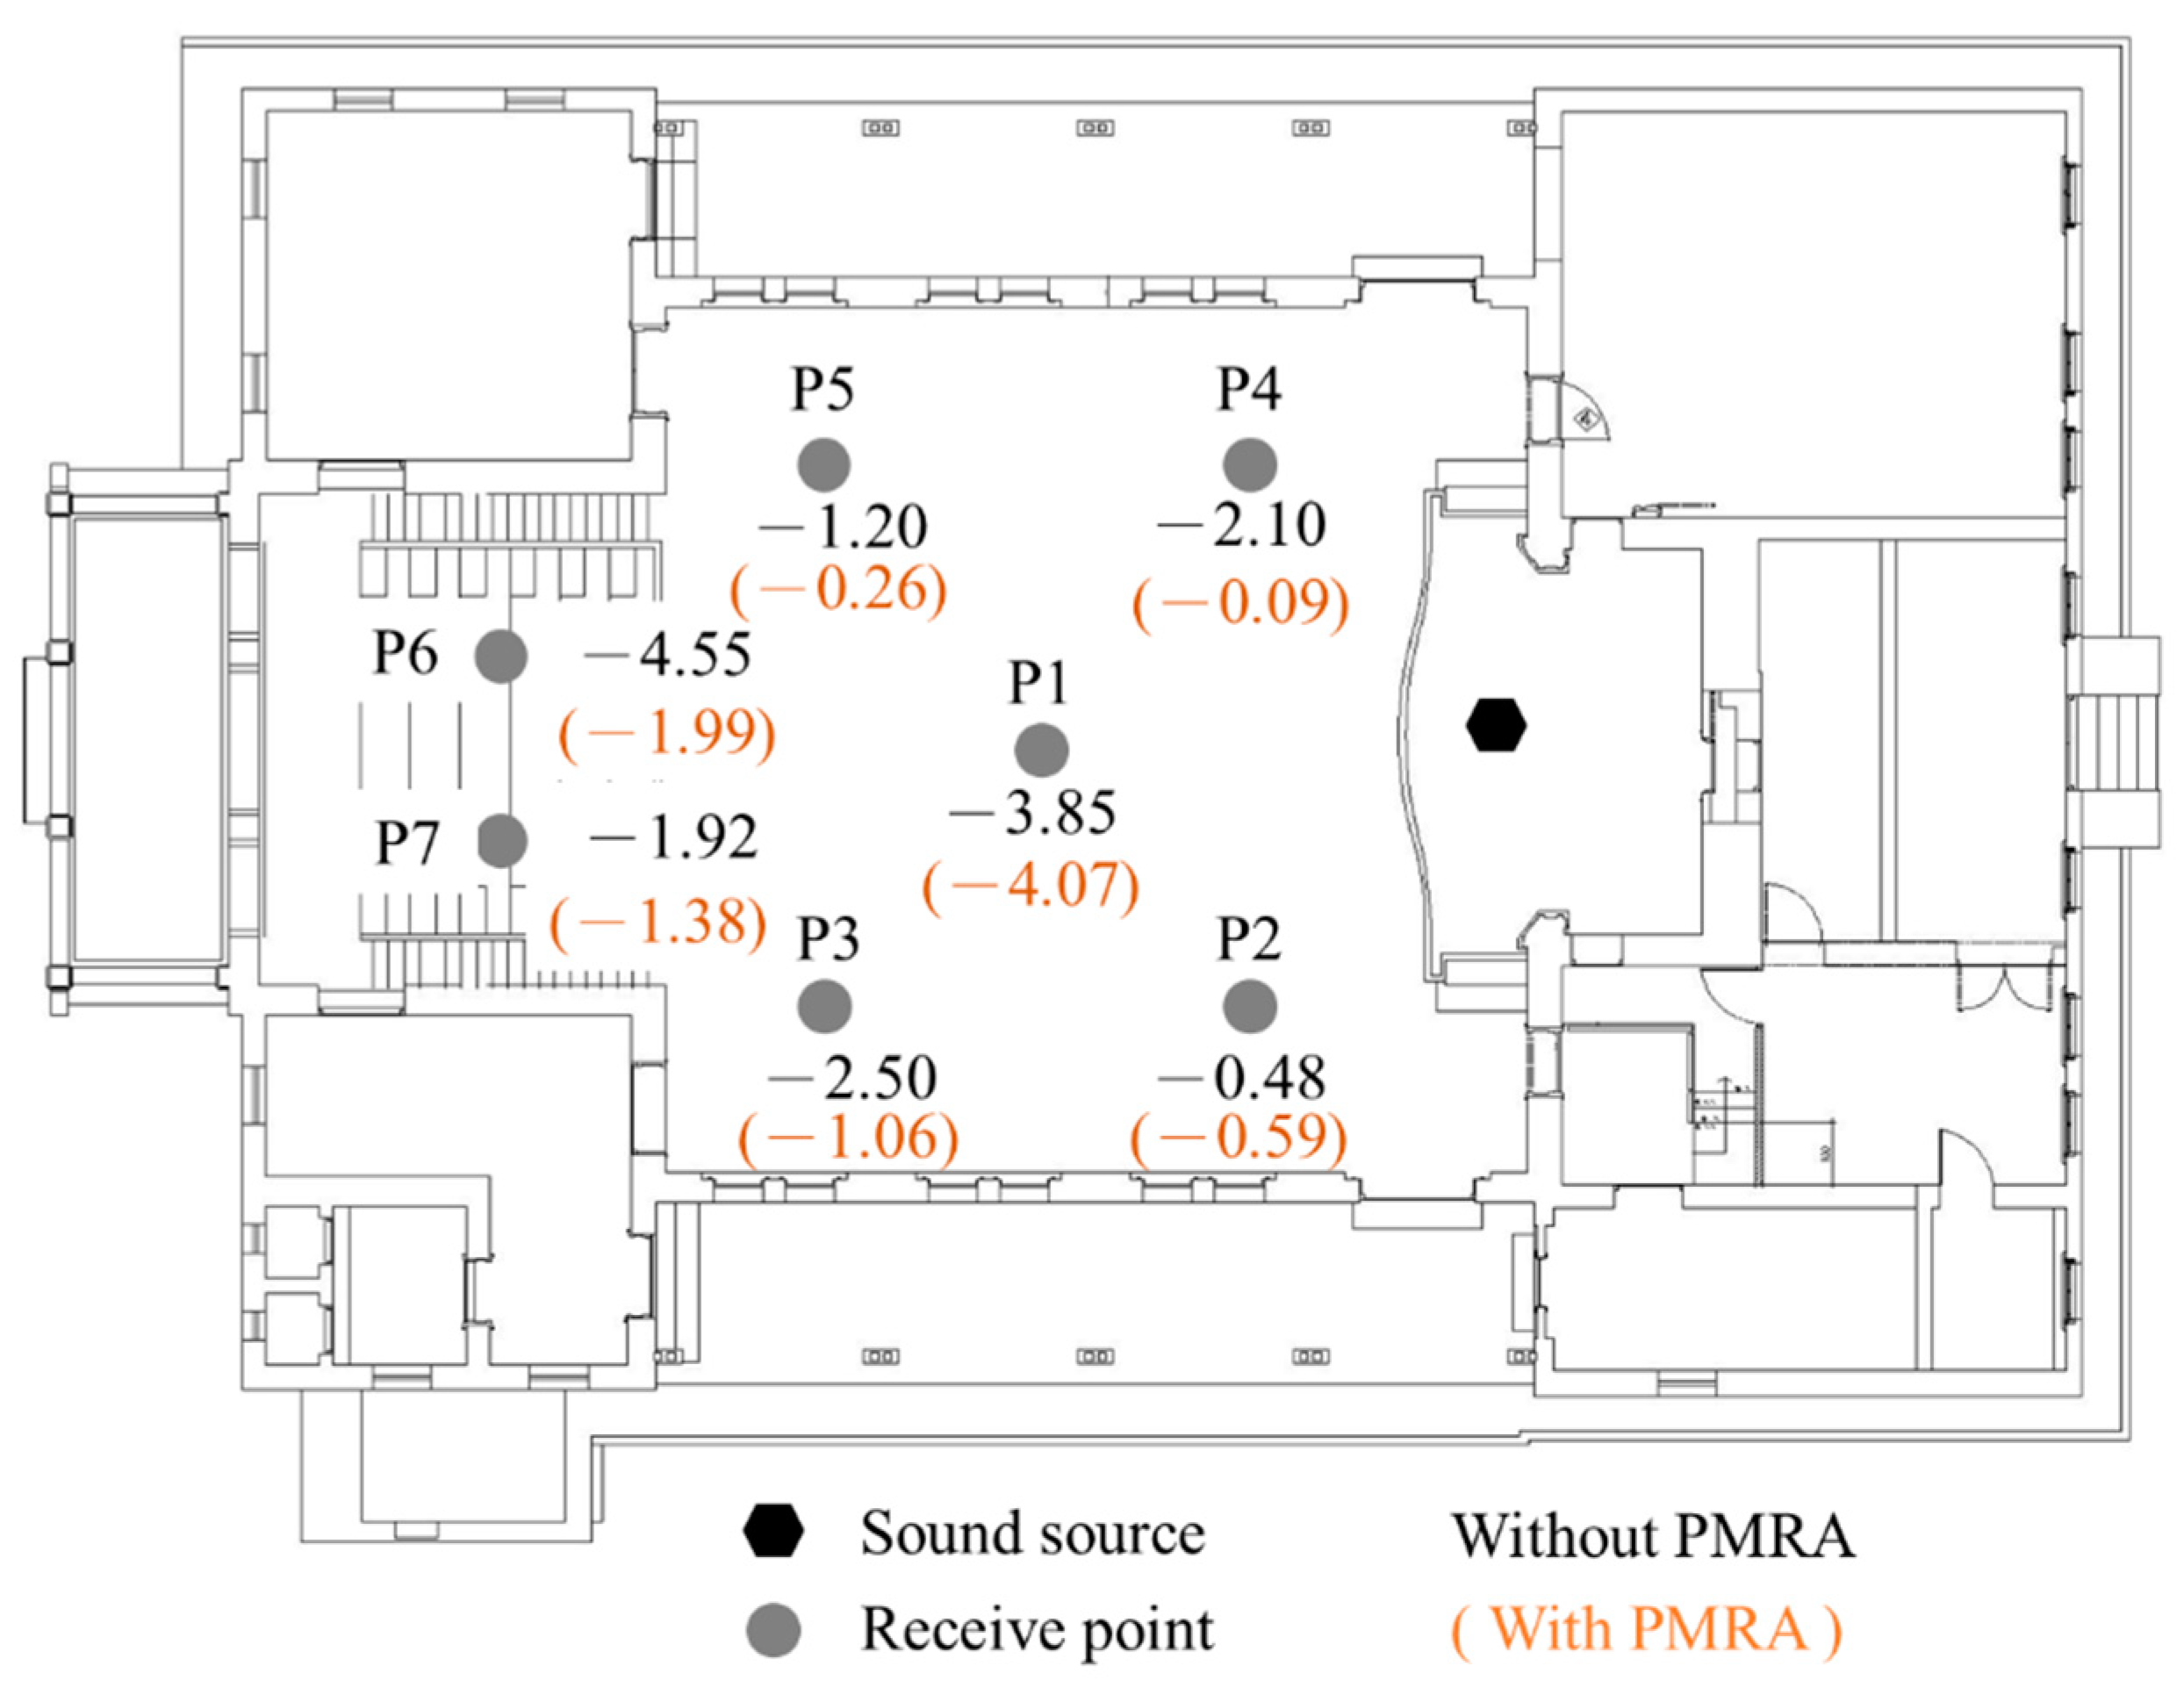
4.3. Field Measurement
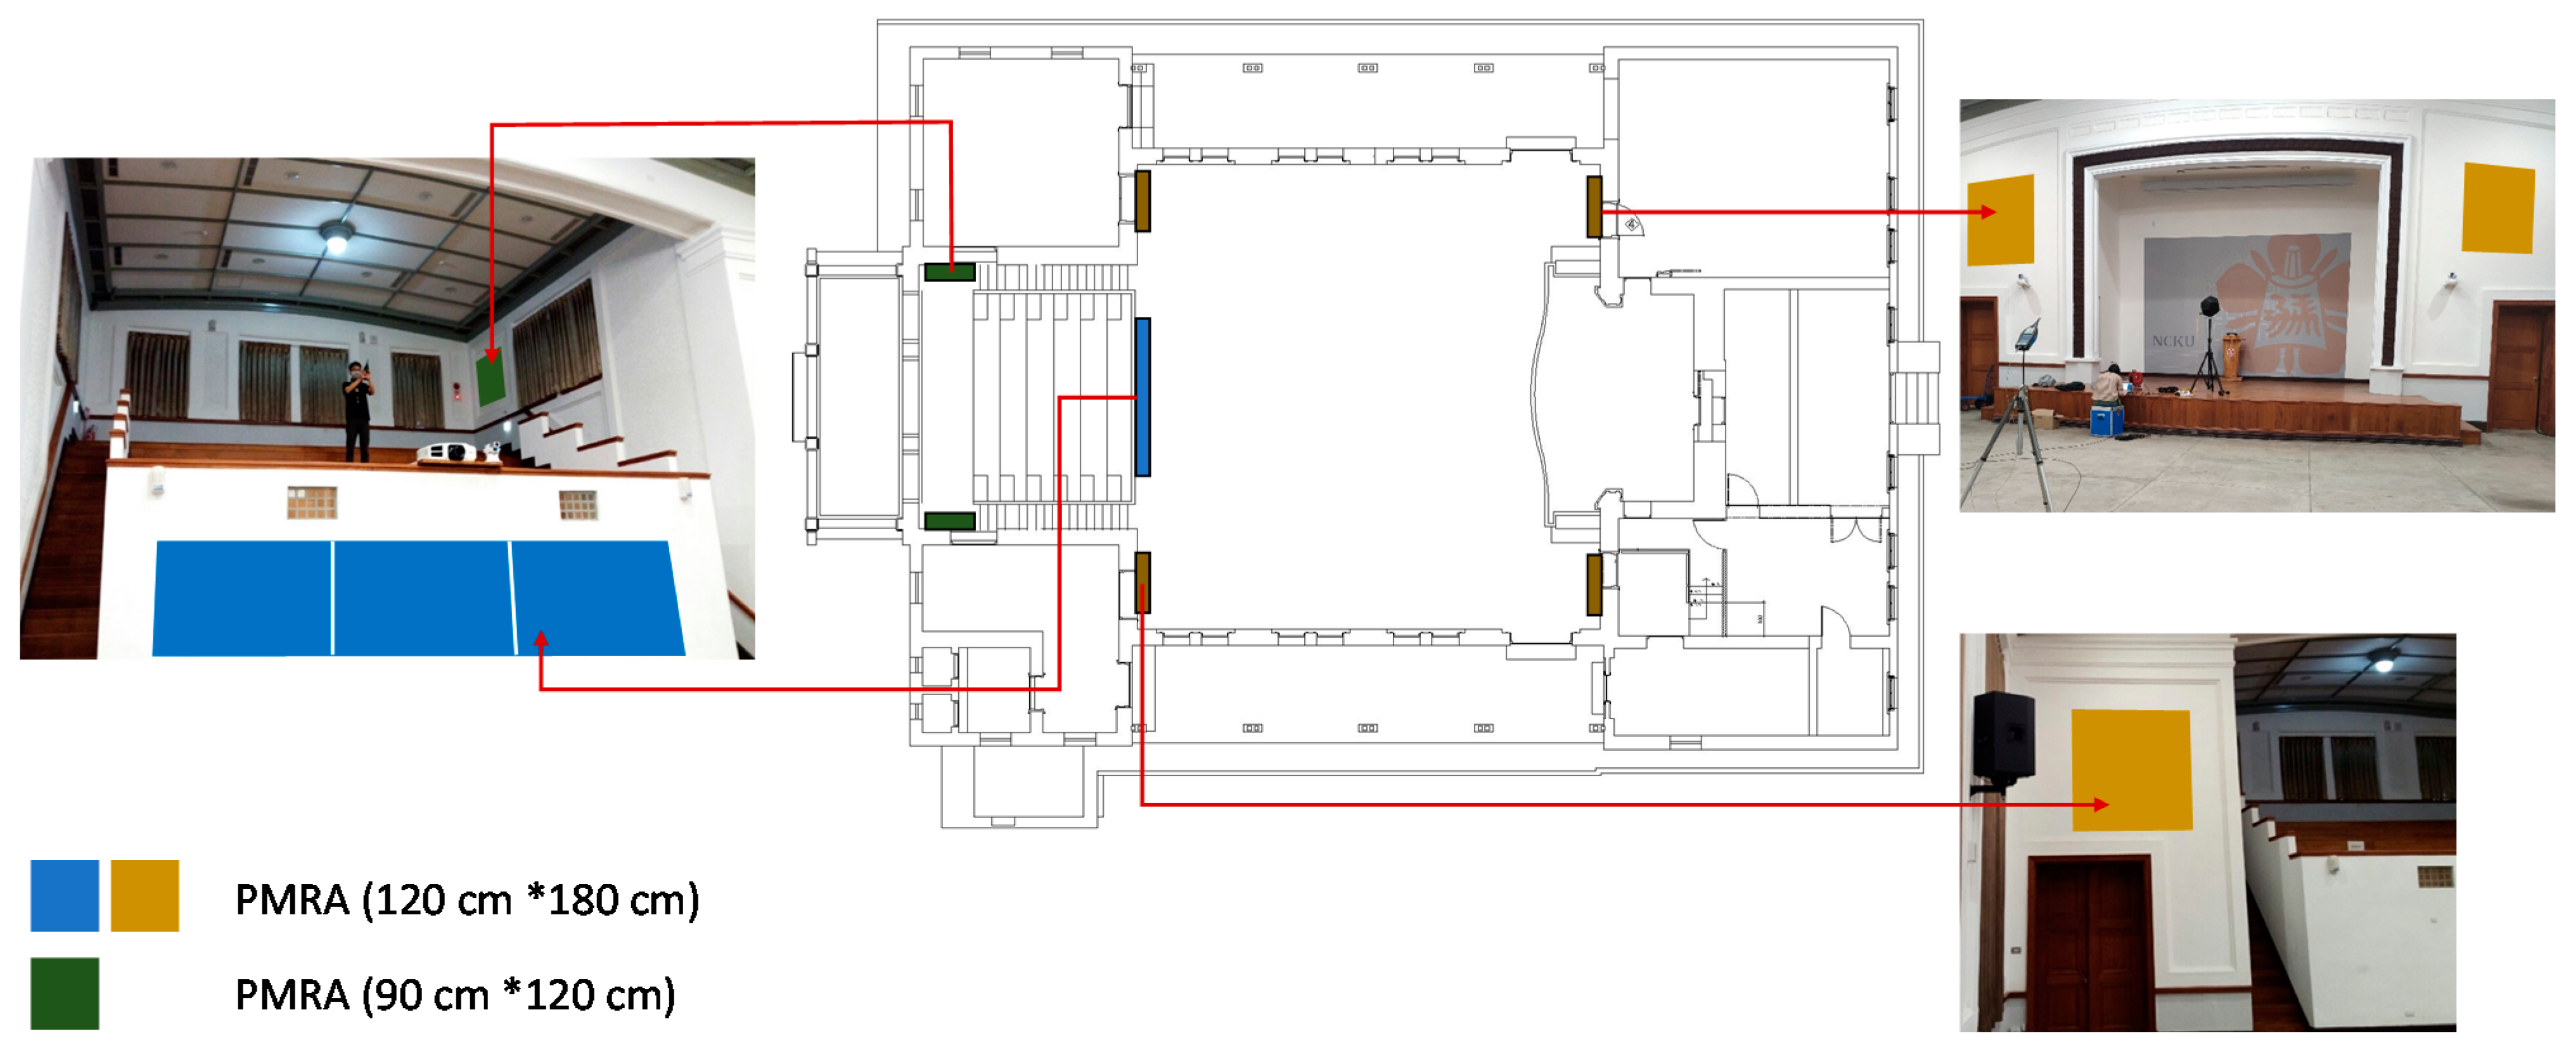
4.4. Installation of PMRA
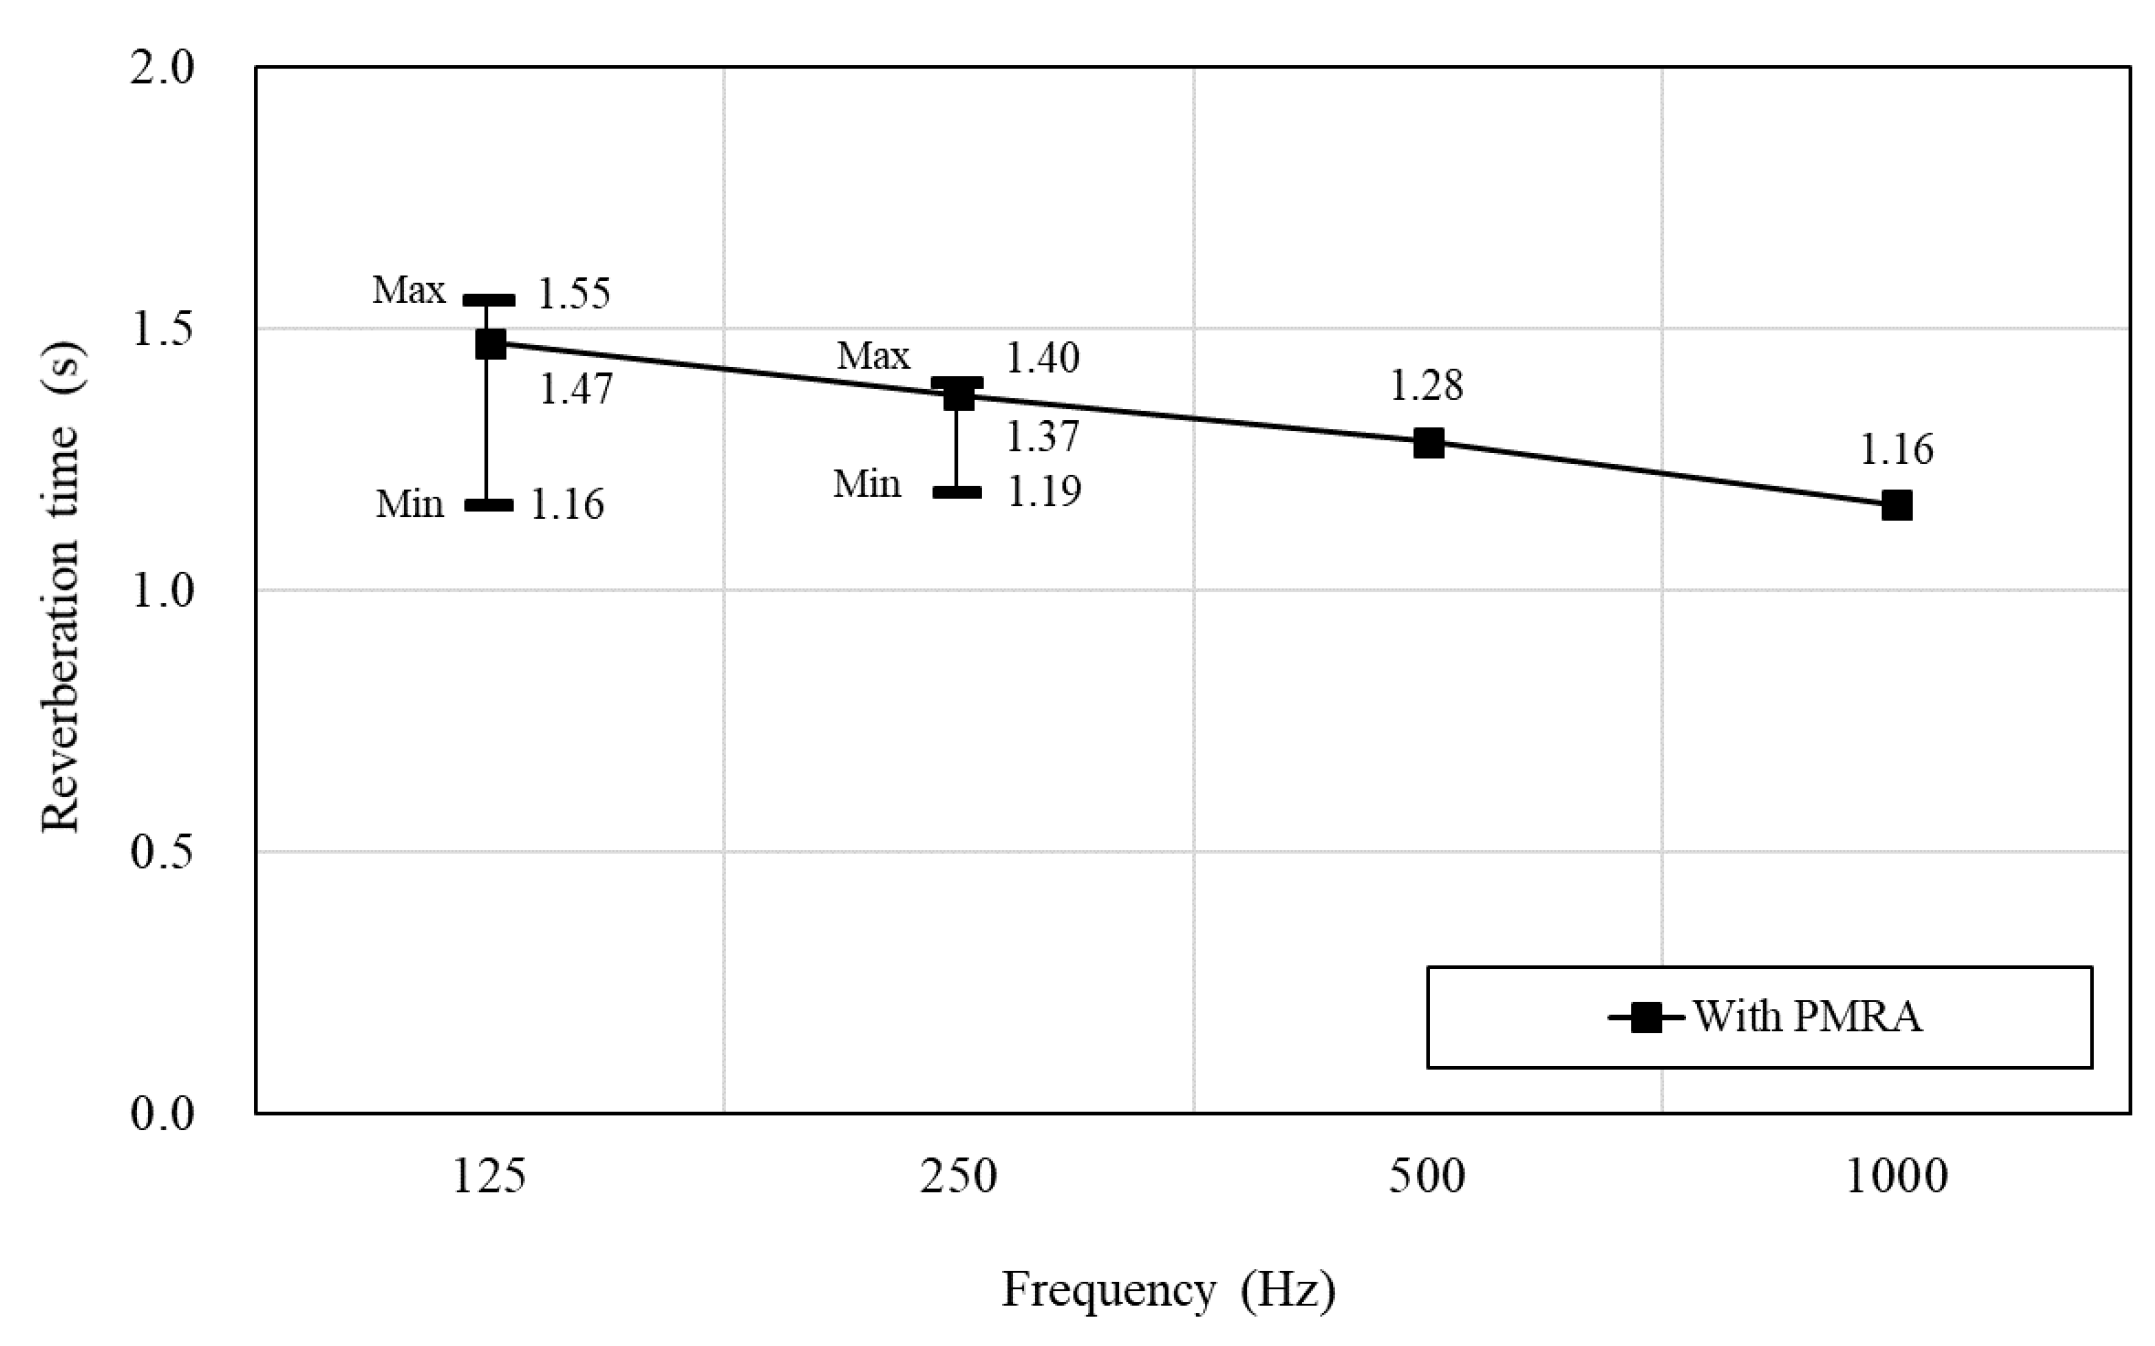
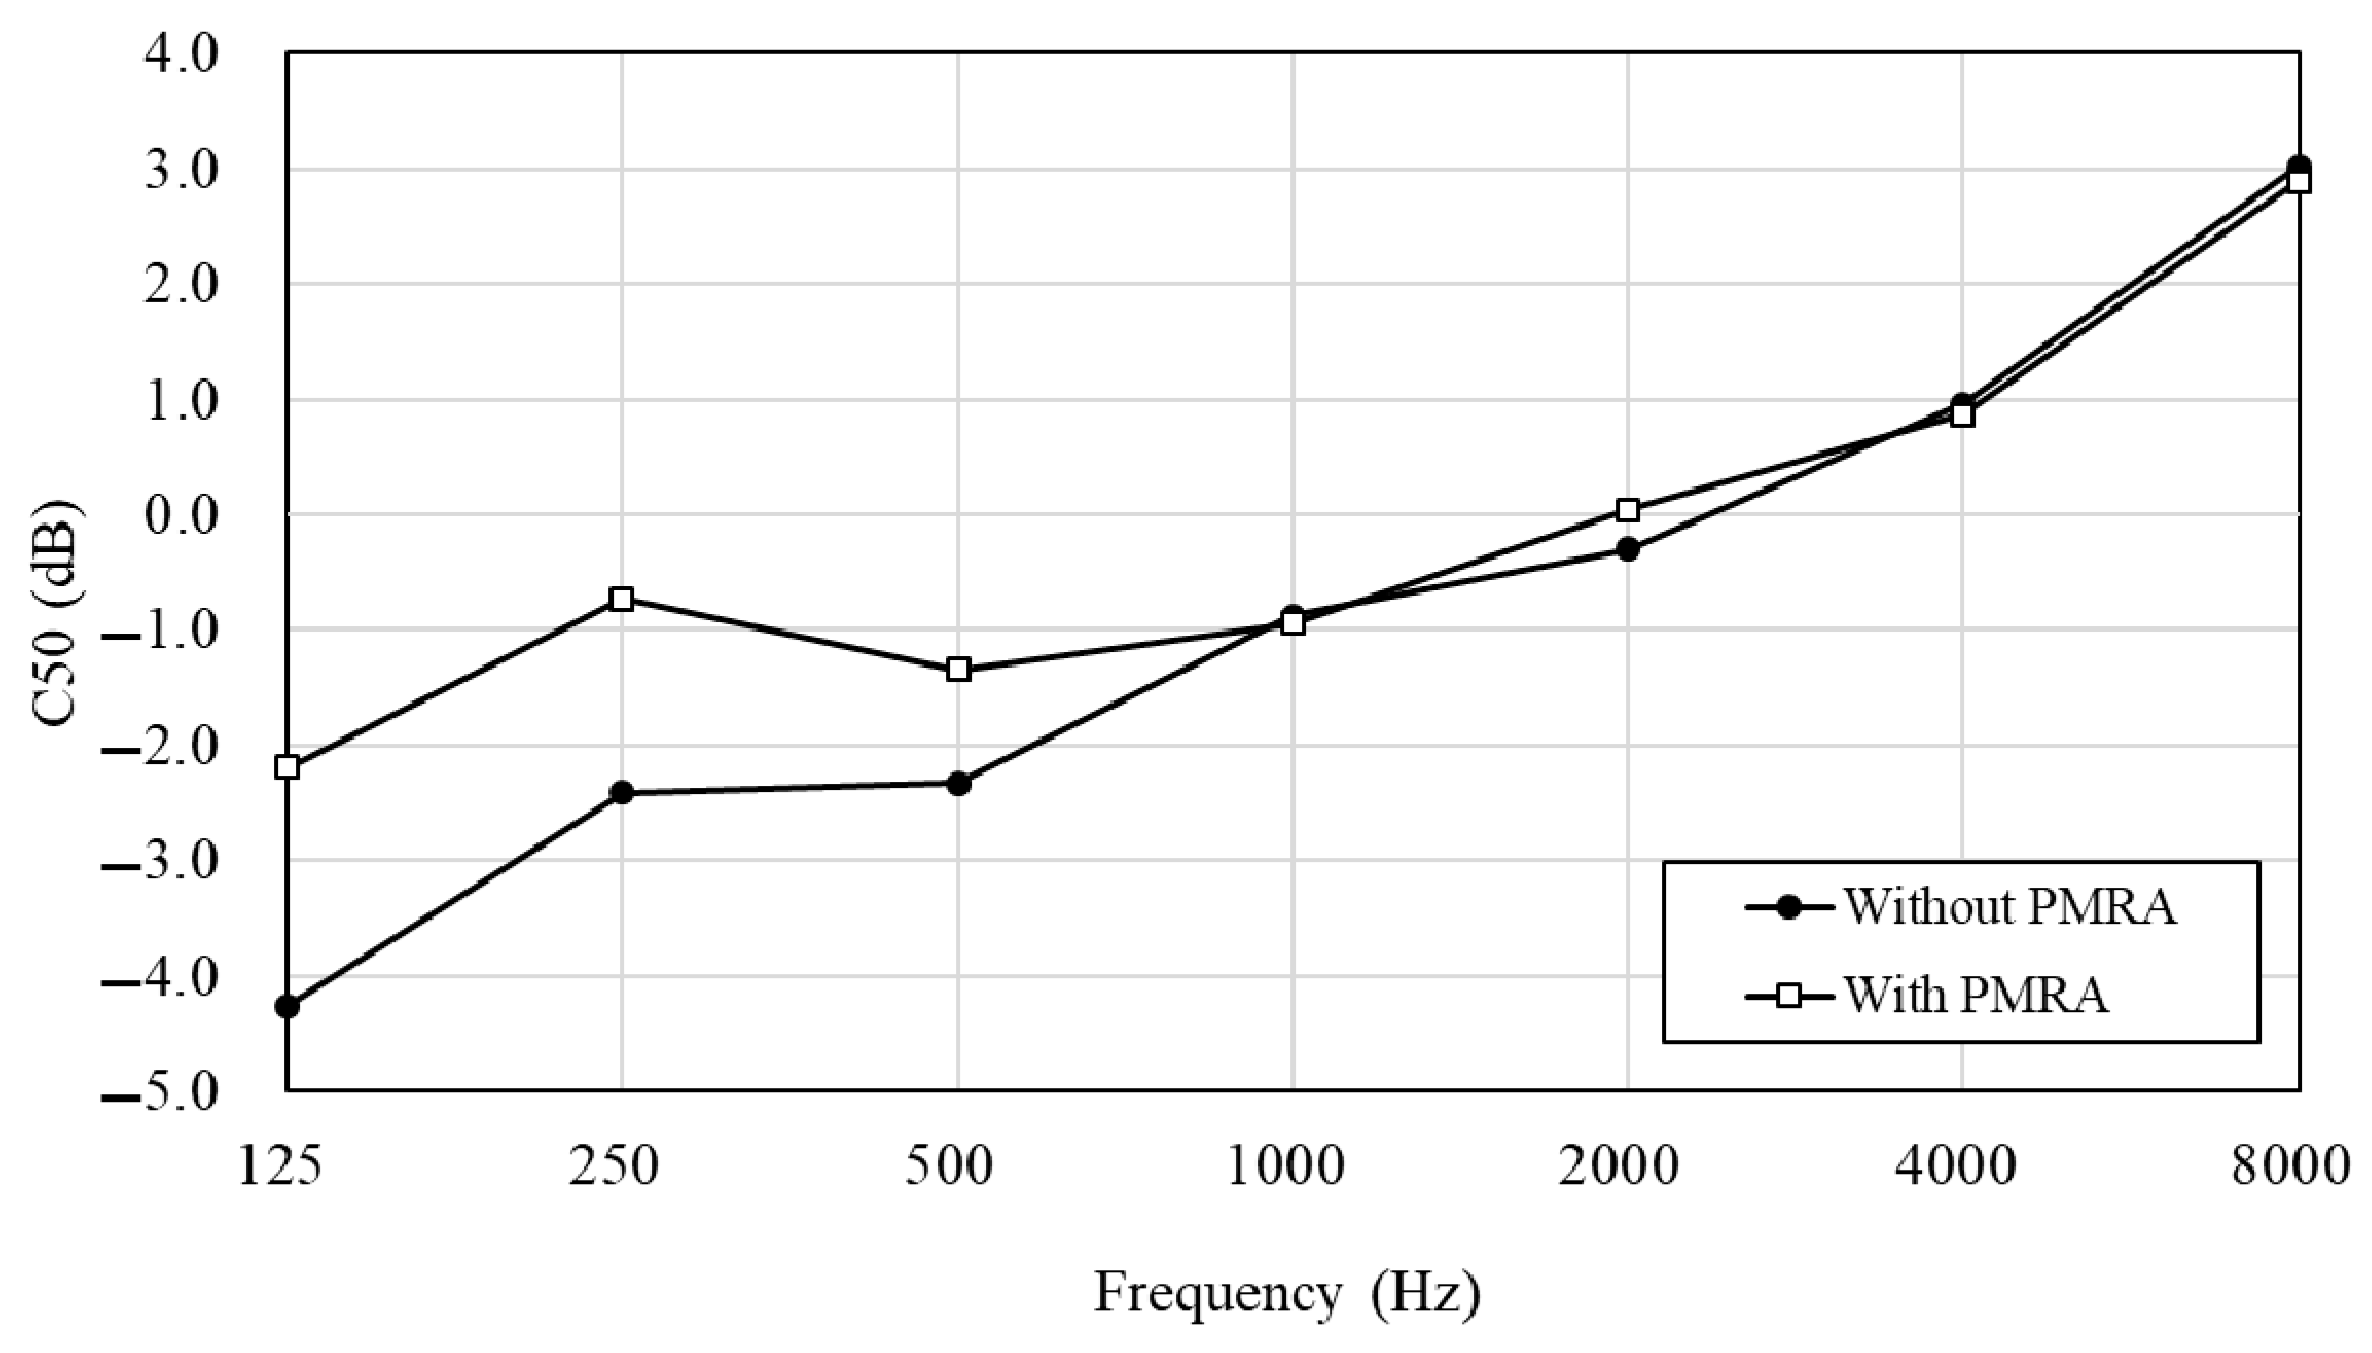
4.5. Field Performance of PMRA
5. Conclusions
Author Contributions
Funding
Institutional Review Board Statement
Informed Consent Statement
Data Availability Statement
Conflicts of Interest
References
- Knudsen, V.O.; Harris, C.M. Acoustical Design in Architecture, 6th ed.; John Wiley & Sons, Inc.: New York, NY, USA, 1962; pp. 194–195. [Google Scholar]
- Ehmer, R.H. Masking Patterns of Tones. J. Acoust. Soc. Am. 1959, 31, 1115–1120. [Google Scholar] [CrossRef]
- Beranek, L.L. Music, Acoustics & Architecture, 1st ed.; Wiley: New York, NY, USA, 1962; pp. 433–443. [Google Scholar]
- Fuchs, H.V.; Zha, X. Requirement for Low-Frequency Reverberation in Spaces for Music: Part 1: Smaller Rooms for Different Uses. Psychomusicol. Music Mind Brain 2015, 25, 272–281. [Google Scholar] [CrossRef]
- Vasudevan, R.; Gordon, C.G. Experimental Study of Annoyance Due to Low Frequency Environmental Noise. Appl. Acoust. 1977, 10, 57–69. [Google Scholar] [CrossRef]
- Leventhall, H.G. Low Frequency Noise and Annoyance. Noise Heal 2004, 6, 59–72. [Google Scholar]
- Alimohammadi, I.; Sandrock, S.; Gohari, M.R. The Effects of Low Frequency Noise on Mental Performance and Annoyance. Environ. Monit. Assess. 2013, 185, 7043–7051. [Google Scholar] [CrossRef] [PubMed]
- Waye, K.P.; Rylander, R. The Prevalence of Annoyance and Effects after Long-Term Exposure to Low-Frequency Noise. J. Sound Vib. 2001, 240, 483–497. [Google Scholar] [CrossRef]
- Caniato, M.; Bettarello, F.; Schmid, C.; Fausti, P. Assessment Criterion for Indoor Noise Disturbance in the Presence of Low Fre-Quency Sources. Appl. Acoust. 2016, 113, 22–33. [Google Scholar] [CrossRef]
- Falourd, X.; Lissek, H.; René, P.J. Active Low-Frequency Modal Noise Cancellation for Room Acoustics: An Experimental Study. In Proceedings of the16th International Congress on Sound and Vibration (ICSV), Kraków, Poland, 7 July 2009. [Google Scholar]
- Abbasi, A.M.; Motamedzade, M.; Aliabadi, M.; Golmohammadi, R.; Tapak, L. Study of the Physiological and Mental Health Effects Caused by Exposure to Low-Frequency Noise in a Simulated Control Room. Build. Acoust. 2018, 25, 233–248. [Google Scholar] [CrossRef]
- Čudina, M.; Prezelj, J.; Pušlar-Čudina, M. The Impact of Paintings Hung on Lecture Room Walls on the Speech Intelligibility and Perception of Background Noise. Indoor Built Environ. 2015, 25, 659–673. [Google Scholar] [CrossRef]
- Zainulabidin, M.H.; Wan, L.M.; Ismail, A.E.; Kasron, M.Z.; Kassim, A.S.M. Effect of membrane surface tension and backed-air gap distance on sound absorption characteristics. J. Eng. Appl. Sci. 2006, 11, 5494–5498. [Google Scholar]
- Yang, M.; Sheng, P. Sound Absorption Structures: From Porous Media to Acoustic Metamaterials. Annu. Rev. Mater. Res. 2017, 47, 83–114. [Google Scholar] [CrossRef]
- Zhao, H.; Wang, Y.; Yu, D.; Yang, H.; Zhong, J.; Wu, F.; Wen, J. A Double Porosity Material for Low Frequency Sound Absorption. Compos. Struct. 2020, 239, 111978. [Google Scholar] [CrossRef]
- Dupont, T.; LeClaire, P.; Panneton, R.; Umnova, O. A Microstructure Material Design for Low Frequency Sound Absorption. Appl. Acoust. 2018, 136, 86–93. [Google Scholar] [CrossRef]
- Liu, C.R.; Wu, J.H.; Chen, X.; Ma, F. A Thin Low-Frequency Broadband Metasurface with Multi-Order Sound Absorption. J. Phys. D: Appl. Phys. 2019, 52, 105302. [Google Scholar] [CrossRef]
- Zhu, X.-F.; Lau, S.-K.; Lu, Z.; Jeon, W. Broadband Low-Frequency Sound Absorption by Periodic Metamaterial Resonators Embedded in a Porous Layer. J. Sound Vib. 2019, 461, 114922. [Google Scholar] [CrossRef]
- Tang, Y.; Ren, S.; Meng, H.; Xin, F.; Huang, L.; Chen, T.; Zhang, C.; Lu, T.J. Hybrid Acoustic Metamaterial as Super Absorber for Broadband Low-Frequency Sound. Sci. Rep. 2017, 7, 1–11. [Google Scholar] [CrossRef]
- ISO. 354 Acoustics — Measurement of Sound Absorption in a Reverberation Room; ISO: Geneva, Switzerland, 2003. [Google Scholar]
- ISO/IEC. 17025 — General Requirements for the Competence of Testing and Calibration Laboratories; ISO: Geneva, Switzerland, 2003. [Google Scholar]
- ISO/IEC. 3382-1 — Acoustics — Measurement of Room Acoustic Parameters — Part 1: Performance Spaces; ISO: Geneva, Switzerland, 2009. [Google Scholar]


| No. | Surface Texture | Air Layer (cm) | Height (cm) |
|---|---|---|---|
| 1 | EMM | 3 | 3 |
| 2 | 20 | 20 | |
| 3 | Canvas | 10 | 10 |
| 4 | 20 | 20 |
| Group | No. | Air Layer Behind the Material (cm) | Height (cm) | |
|---|---|---|---|---|
| Canvas | EMM | |||
| A | A1 | 5.8 | 3 | 10 |
| A2 | 3.8 | 5 | ||
| A3 | 1.3 | 7.5 | ||
| A4 | None | 10 | ||
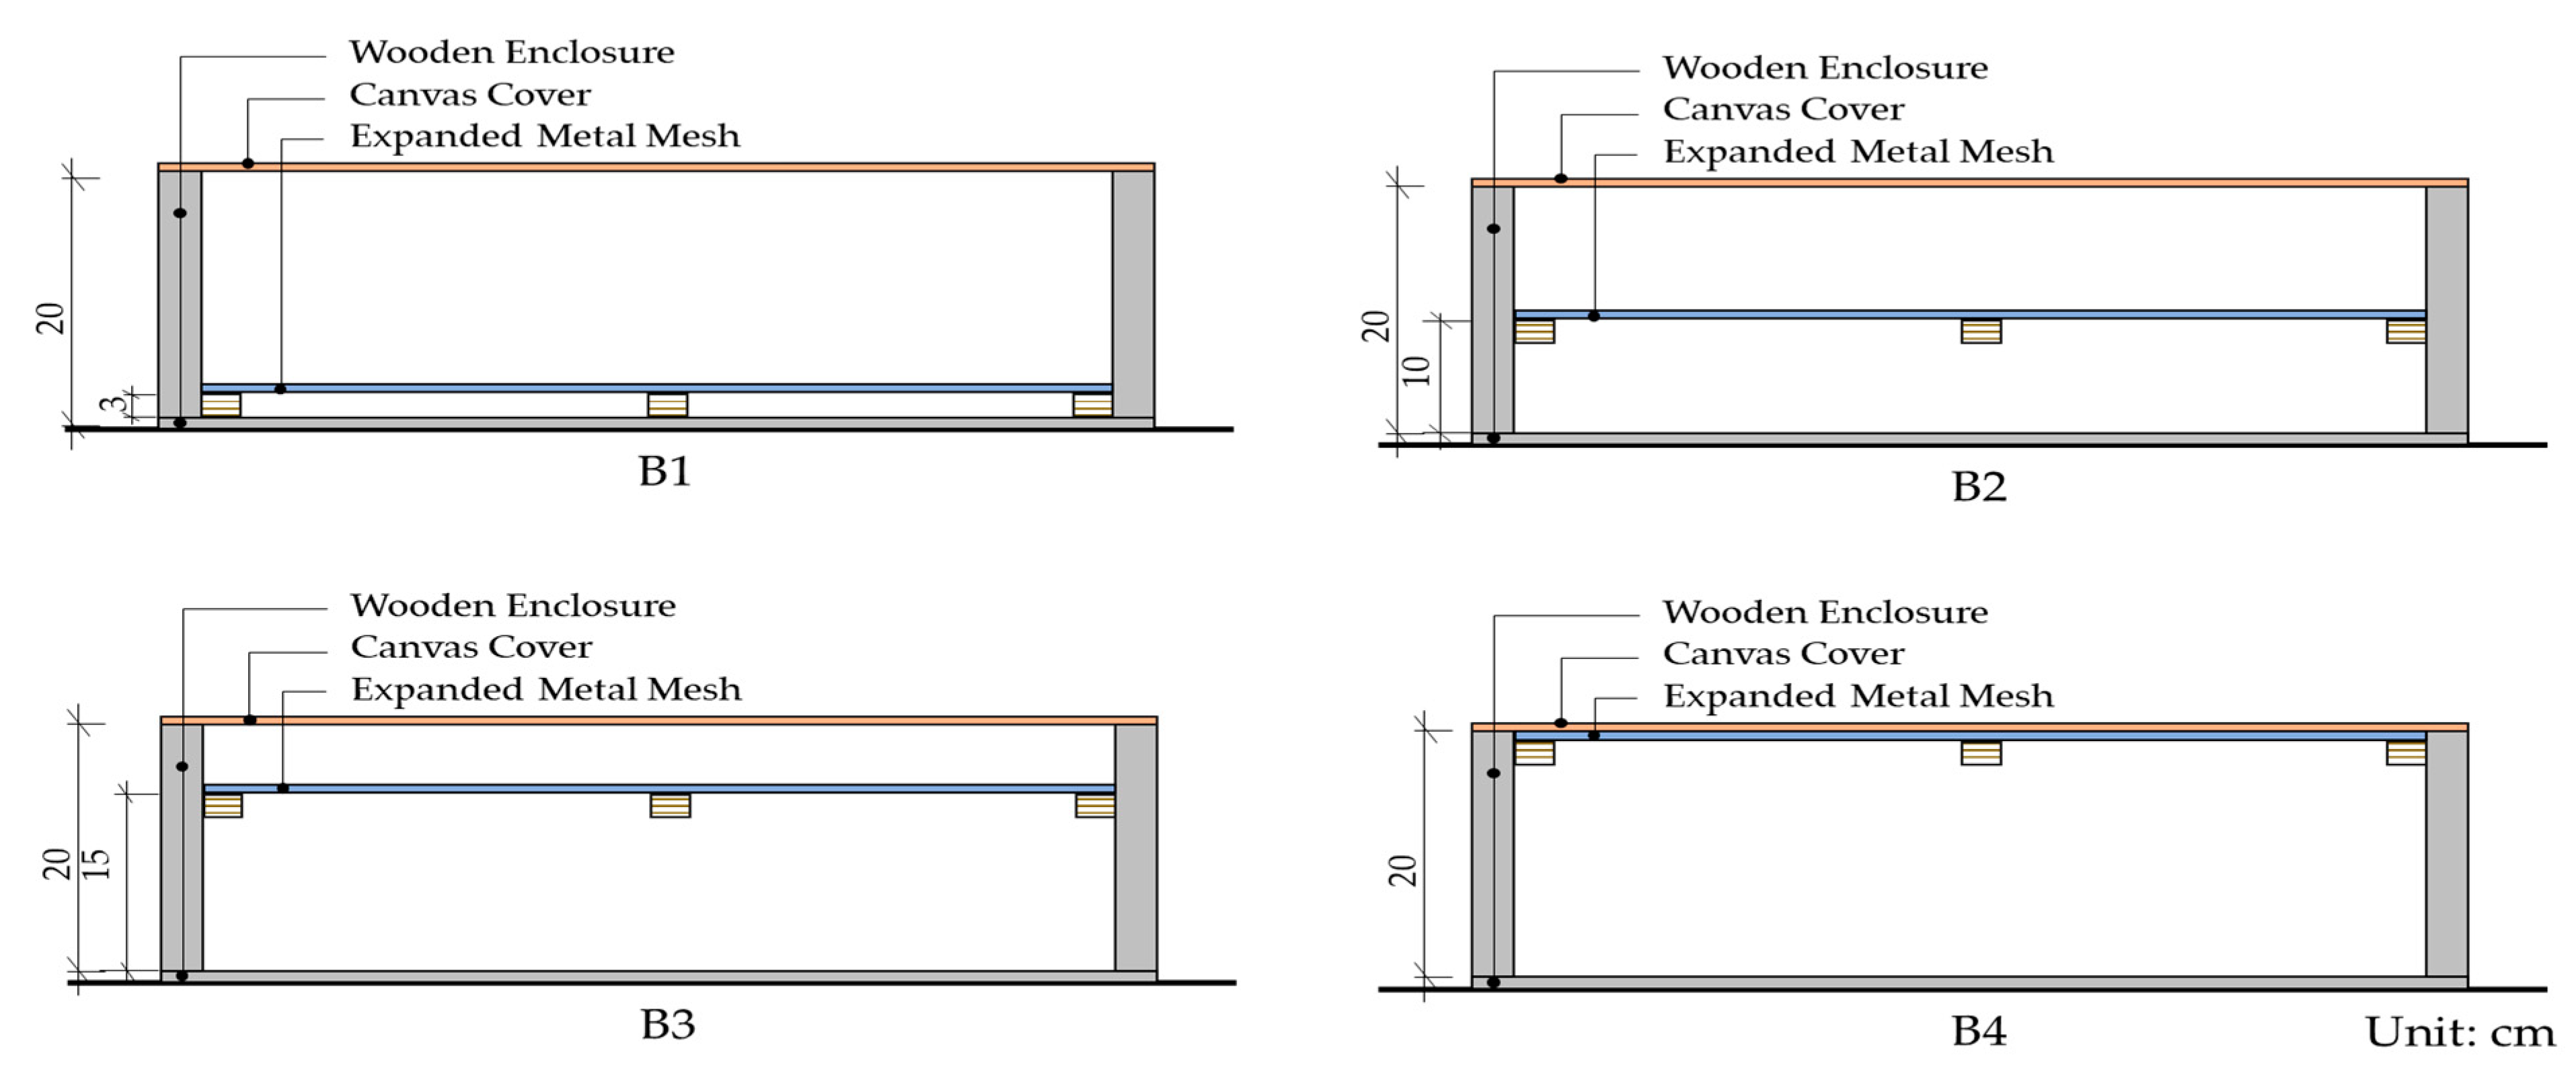
| B | B1 | 15.8 | 3 | 20 |
| B2 | 8.8 | 10 | ||
| B3 | 3.8 | 15 | ||
| B4 | None | 20 | ||
| Category | T250/Tmid | T125/Tmid |
|---|---|---|
| Excellent bass | 1.14 | 1.27 |
| Good bass | 1.06 | 1.03 |
| Fair bass | 0.97 | 0.95 |
| Poor bass | 0.90 | 0.86 |
Publisher’s Note: MDPI stays neutral with regard to jurisdictional claims in published maps and institutional affiliations. |
© 2021 by the authors. Licensee MDPI, Basel, Switzerland. This article is an open access article distributed under the terms and conditions of the Creative Commons Attribution (CC BY) license (http://creativecommons.org/licenses/by/4.0/).
Share and Cite
Tsay, Y.-S.; Lin, J.-Y.; Ma, F. Development of a Panel Membrane Resonant Absorber. Appl. Sci. 2021, 11, 1893. https://doi.org/10.3390/app11041893
Tsay Y-S, Lin J-Y, Ma F. Development of a Panel Membrane Resonant Absorber. Applied Sciences. 2021; 11(4):1893. https://doi.org/10.3390/app11041893
Chicago/Turabian StyleTsay, Yaw-Shyan, Jui-Yen Lin, and Faxin Ma. 2021. "Development of a Panel Membrane Resonant Absorber" Applied Sciences 11, no. 4: 1893. https://doi.org/10.3390/app11041893
APA StyleTsay, Y.-S., Lin, J.-Y., & Ma, F. (2021). Development of a Panel Membrane Resonant Absorber. Applied Sciences, 11(4), 1893. https://doi.org/10.3390/app11041893