Article

A New Indicator to Assess Public Perception of Air Pollution Based on Complaint Data

1
College of Geodesy and Geomatics, Shandong University of Science and Technology, Qingdao 266590, China
2
College of Surveying and Geo-Informatics, Shandong Jianzhu University, Ji’nan 250101, China
3
State Key Laboratory of Resources and Environmental Information System, Institute of Geographic Science and Natural Resources Research, Chinese Academy of Sciences, Beijing 100101, China
*
Author to whom correspondence should be addressed.
Appl. Sci. 2021, 11(4), 1894; https://doi.org/10.3390/app11041894
Submission received: 25 January 2021 / Revised: 14 February 2021 / Accepted: 18 February 2021 / Published: 21 February 2021
(This article belongs to the Section Environmental Sciences)

Abstract

:
Severe air pollution problems have led to a rise in the Chinese public’s concern, and it is necessary to use monitoring stations to monitor and evaluate pollutant levels. However, monitoring stations are limited, and the public is everywhere. It is also essential to understand the public’s awareness and behavioral response to air pollution. Air pollution complaint data can more directly reflect the public’s real air quality perception than social media data. Therefore, based on air pollution complaint data and sentiment analysis, we proposed a new air pollution perception index (APPI) in this paper. Firstly, we constructed the emotional dictionary for air pollution and used sentiment analysis to calculate public complaints’ emotional intensity. Secondly, we used the piecewise function to obtain the APPI based on the complaint Kernel density and complaint emotion Kriging interpolation, and we further analyzed the change of center of gravity of the APPI. Finally, we used the proposed APPI to examine the 2012 to 2017 air pollution complaint data in Shandong Province, China. The results were verified by the POI (points of interest) data and word cloud analysis. The results show that: (1) the statistical analysis and spatial distribution of air pollution complaint density and public complaint emotion intensity are not entirely consistent. The proposed APPI can more reasonably evaluate the public perception of air pollution. (2) The public perception of air pollution tends to the southwest of Shandong Province, while coastal cities are relatively weak. (3) The content of public complaints about air pollution mainly focuses on the exhaust emissions of enterprises. Moreover, the more enterprises gather in inland cities, the public perception of air pollution is stronger.

1. Introduction

Air pollution is a major environmental problem that affects every country and everyone. To solve the problem of air pollution, local monitoring and practical evaluation of pollution levels are needed [1]. Many countries have established air quality monitoring stations to measure pollution levels in real time [2]. However, monitoring stations are limited, and the public is everywhere. As the direct feeler of air quality and the assessor of environmental protection performance, the public is crucial to improving air pollution. Therefore, it is essential to study further the public’s attitudes and opinions on air quality [3,4,5].
Public perception of air pollution assessment can be summarized as the public’s subjective evaluation of air pollution events based on subjective feelings and risk perceptions [6,7]. It is a supplement to objective air quality monitoring, although there is a certain deviation between them [8,9]. According to the different methods of obtaining data, the existing research on public perception of air pollution can be classified into two categories: one based on questionnaires and the second one based on the social media platform.
A questionnaire survey records people’s feelings and emotions about air pollution in the form of a questionnaire according to different research purposes [10,11,12]. The questionnaire survey forms include offline and online; offline is through on-site interviews and paper questionnaires, online is through the mobile devices or professional questionnaire survey platform [13,14]. For example, Oltra et al. [15] collected data through a questionnaire survey of 1202 residents in four cities. They found that there are moderate differences in subjective evaluation of local air pollution, as well as the degree of worry and pain caused by the air pollution. Huang et al. [16] selected three cities in China: Beijing, Nanjing, and Guangzhou, by the questionnaire survey and found that the public’s awareness of the health effects and familiarity of air pollution was significantly higher in winter than in summer. The haze weather is also considerably higher than the typical weather. Chen et al. [17] explored public satisfaction with air pollution and found that the public’s air pollution views would be affected by industrial emissions. However, the perception of air quality based on the questionnaire survey will be affected by many factors, such as investigators and cities’ differences. Moreover, due to the high costs, the questionnaire survey is challenging to perform frequently and regularly.
With the development of information and communication technology, people actively express their attitudes and feelings through social media. Some scholars used the social media data such as Tweet, Facebook, or Sina Weibo in China to extract public responses and abundant information on air quality or air pollution [18,19,20]. For example, Gurajala et al. (2019) explored the text content of Twitter data to understand the public’s response to air quality changes over time and their understanding of air quality issues [18]. Wang et al. [19] proposed a method to infer air quality in Chinese cities based on Sina Weibo and meteorological data. Hswen et al. [20] used Tweet data and sentiment analysis methods to evaluate the feasibility of using social media to monitor outdoor air pollution in London from public perception. Ryu and Tao et al. [21] proposed the air quality perception index (AQPI) based on the Internet search volume data to evaluate air quality views. The above research provides new methods and technologies for the public perception of air quality and expands subjective public emotion on air quality assessment. However, the social media data are complex and need to analyze the positive, negative, neutral, mixed, and other emotion types in the text. There may also be bias, and users may express unreal emotions for social purposes [22].
Unlike the questionnaire and social media data, air pollution complaint data form the real dissatisfaction (negative emotion) expressed by the public, which can most directly reflect the public’s actual air pollution perception. Only a few studies have utilized the complaint data to investigate how people perceive and respond to environmental or air pollution [23,24,25]. These studies mainly analyzed the potential pollution problems implied in the complaint data or identified potential pollution sources through the public complaint data on environment and odor [24,25]. However, the above studies mostly analyzed the content of complaint data from the perspective of statistics and time and space and rarely investigate the subjective feelings of the contents of public complaints. It is imperative to understand the personal emotion of public complaint data, because the change and intensity of public sentiment in complaint data can reflect the severity of air pollution and the effectiveness of governance to a certain extent.
Therefore, this paper proposed a new index to evaluate public perception of air pollution, namely air pollution perception index (APPI), by using the air pollution complaint data and emotion analysis from subjective public emotion. Firstly, we obtained public complaints about air pollution through the network and constructed an air pollution’s emotional dictionary. Then we calculated the emotional intensity of public complaints by using the constructed emotional dictionary and the emotional analysis method of text mining. Secondly, we used the address-matching method to match the geographical location of complaint data. We analyzed the spatial distribution of complaint density and emotion intensity of air pollution by the Kernel density analysis and Kriging interpolation method, and we constructed the air pollution perception index (APPI) through the piecewise function of the normalized complaint density and emotion intensity. Finally, the proposed APPI was applied to the air pollution complaint data of Shandong Province from 2012 to 2017. This paper’s proposed APPI is a supplement to the existing research on public perception of air pollution. It can provide strong support for air quality management and decision-making.
The remainder of this paper is organized as follows: Section 2 shows the datasets used in this study and the proposed index APPI. The results of the application study are presented in Section 3. Section 4 discusses and verifies the application results. Section 5 presents the major conclusions, recommendations, and further research.

2. Materials and Methods

2.1. Data

2.1.1. Public Complaint Data

The Shandong Environmental Public Prosecution is the public’s primary network platform to complain about environmental pollution in Shandong Province. On the network platform, the crowd fills in the complaint’s general title, the complaint’s location, the pollution situation, and other details. After the successful submission, the website will automatically generate the number, complaint date, and additional information and update relevant departments’ replies in real time.
This paper selected 11,699 complaints about air pollution from January 2012 to December 2017 as application examples from the Shandong Environmental Public Prosecution platform. Each example of complaint data includes the number, complaint date, title, content, reply, and other information, as shown in Table 1.

2.1.2. Point of Interest (POI) Data

To analyze whether the areas with a strong public perception of air pollution are related to industrial enterprises, this paper uses POI data from the Gaode map in 2014 to verify and discuss the application results of air pollution complaint data in Shandong Province in 2015. POI data are from a database mainly used for navigation, mainly recording the point’s name, address, and geographical location. In GIS, a POI can represent a building, a shop, a scenic spot, and so on.
From the 2014 POI data, we selected a total of 6706 points data with the keyword “enterprises” or “factory” in Shandong Province, which are near-related to air pollution, mainly the steel industry, chemical industry, building material industry, and so on. To avoid interference, we deleted the sites with “company”, because many companies are not related to pollution sources.

2.2. Methods

Based on air pollution complaint data and sentiment analysis, this paper proposed a new index to evaluate the public perception of air quality, namely the air pollution perception index (APPI). Figure 1 is the flow chart of the APPI method proposed in this paper.
In Figure 1, we firstly collected the public complaint data of air pollution, and we constructed the emotional dictionary for the air pollution complaint data. We analyzed the complaint emotional intensity. Then, the complaint text data were transformed into complaint points by the address-matching method. Secondly, we analyzed the complaint’s density and the spatial distribution of complaint emotion intensity by Kernel density and Kriging interpolation method. Finally, according to the complaint density and emotional intensity of air pollution, we obtained the air pollution perception index (APPI) through the piecewise function and normalization. The index APPI can reasonably evaluate the public’s perception of air pollution. We also further analyzed the temporal and spatial changes of the center of APPI.

2.2.1. Sentiment Analysis of Air Pollution Complaints

Text sentiment analysis, also known as opinion mining and propensity analysis, aims to detect the polarity of emotions (such as negative or positive emotions) or quantify the intensity of emotions [26,27]. Currently, there are three common methods for text sentiment analysis, namely “dictionary-based,” “machine-learning,” and “deep-learning” [26]. Both “machine-learning” and “deep-learning” methods need supervised training. However, sentiment analysis based on a dictionary does not require supervised training, which is the most common and straightforward method. Sentiment analysis based on dictionary refers to calculating sentiment value based on the labeled sentiment dictionary [27]. Therefore, this paper analyzed the public emotion of complaints by constructing the emotional dictionary of air pollution.
1. Construction of the emotional dictionary of air pollution
Firstly, we extracted verb (verb), noun (noun), adjective (adj), adverb (adv), idiom, and preposition phrase (prep) as candidate emotional words through Chinese word segmentation and part of speech tagging. Then, the labeling criteria shown in Table 2 were formulated to classify air pollution emotion words. The column “Intensity” indicates the emotional intensity of the words in the text. These statements in the column “Description” are summarized from the data of the complaint platform. We labeled the emotion intensity of emotion words after artificial selection. Combining with the emotional Dictionary of Dalian University of Technology, we removed the duplication and added the modifier dictionary to get the emotional dictionary of air pollution.
To better understand the air pollution emotion dictionary constructed in this paper, we selected several examples in the dictionary for illustration, as shown in Table 3.
In Table 3, there are expressions about its part of speech, emotional intensity, and polarity for each word in the dictionary. The polarity can be divided into neutral (0), positive (+1), and negative (−1). Since the complaint data are usually negative, the polarity is marked “−1”.
2. Sentiment analysis of air pollution complaints
Based on the constructed air pollution emotion dictionary, this paper calculated the public complaint emotion value, namely complaint emotion intensity, sentence segmentation, and word segmentation of the complaint text. The specific process is as follows.
Text preprocessing: We preprocessed the complaint text by sentence segmentation, word segmentation, and removing stop words.
Emotional word matching: We obtained the words after text preprocessing and matched the constructed air pollution emotion dictionary to get the sentence’s emotional words and mark their positions.
Modifier matching: We matched the words with the modifier dictionary to get the sentence’s modifiers and mark their positions.
Complaint emotion intensity: After matching emotion words and modifiers, we calculated the emotion intensity. Firstly, we used Formula (1) to calculate the emotional intensity of public complaints in short sentences; secondly, we used Formula (2) to calculate the emotional intensity of public complaints in sub-sentences according to the calculation results of short sentences; finally, we used Formula (3) to calculate the emotional intensity E(T) of public complaints on the complaint text according to the calculation results of sub-sentences.
E ( P i ) = E ( S W ) × E ( D W ) × ( 1 ) n
E ( C i ) = M i n ( E ( P 1 ) , E ( P 2 ) , )
E ( T ) = M i n ( E ( C 1 ) , E ( C 2 ) , )
where SW is the emotional word, DW is the degree adverb, E(SW) is the emotional intensity of the emotional word, n is the number of negative words, and E(DW) is the weight of the degree adverb. Moreover, E(Pi) is the emotional value of the ith phrase, E(Ci) is the effective value of the ith clause, and E(T) is the emotional value of the whole text.
The complaint data almost reflect the negative emotions of the public, so the calculated E(T) is negative. The smaller the value, the greater the intensity of negative emotions.
3. Address matching of complaint data
Because the complaint data are not recorded in the form of geographical coordinates, after calculating public complaint emotional intensity, it is necessary to match the address for the geographical location described by each complaint data. Address matching is the process of establishing a correspondence between a textual description address and its spatial geographic location coordinates [28]. The address-matching process mainly includes address extraction, address standardization, and latitude and longitude matching.
Address extraction: We analyzed the words after part of speech tagging and detected the address parts of speech in terms including organization name and place name.
Address normalization: It is necessary to standardize the extracted address and standardize the address information of each comment data as: [province, city, district/county, and detailed address], since the public often uses abbreviations to represent address information in expression.
It is worth noting that when performing detailed address matching, the factory or company name will be used directly in instances where the factory or company name appears; if there is no factory or company name, match ‘town’ + ‘village’; if none of the above, match ‘road name’ + ‘community’.
Longitude and latitude matching: This study used the AutoNavi Map API to perform latitude and longitude matching on the address information after address normalization.

2.2.2. Kernel Density Analysis and Kriging Interpolation

After calculating the complaint emotion intensity of air pollution and address matching of complaint data, in this paper, we analyzed the Kernel density of the complaint data and the spatial–temporal distribution of air pollution complaint emotional intensity by the method of Kriging interpolation.
1. Kernel density analysis of public complaints
Complaint density can reflect the public’s satisfaction with air quality in a specific area. In general, the higher the complaint density, the less satisfied the public. The air pollution complaint density ( A i r d ) of the complaint data point i after address matching was obtained by Kernel density analysis.
A i r d = 1 ( r a d i u s ) 2 i = 1 n [ 3 π × ( 1 ( d i s t i r a d i u s ) 2 ) 2 ]
where n is the number of complaint points after the outliers are removed, d i s t i is the distance between point i and other points. radius is the search radius, and the Kernel density method uses the spatial variable of “Silverman experience rule” to calculate the default search radius for the input complaints dataset.
2. Spatial analysis of public complaint emotion based on Kriging interpolation
The distribution of complaint emotion intensity can also reflect the public’s satisfaction with a specific area’s air quality. In general, the smaller the air pollution complaint emotional value, the greater the negative emotion, and the more dissatisfied the public is.
In this paper, the local air pollution perception Airs was obtained by Kriging interpolation of complaint emotion results, as shown in Equation (5).
A i r s = i = 1 n λ i × z i
where n is the number of complaint points, λi is the weight of complaint point i in space; in this paper, the spherical function is used as the fitting model to calculate λi; zi is the emotion intensity of complaint point i.

2.2.3. Air Pollution Perception Index, APPI

Considering the air pollution complaint density or emotional intensity alone cannot fully characterize the public perception of air pollution. For example, in areas with a high complaint density of air pollution, public complaint emotion’s intensity may be low. On the contrary, in areas with low complaint density, the intensity of public complaint emotion may be high. Therefore, this paper proposed the air pollution perception index, APPI.
APPI can be used to evaluate the public’s perception of air pollution more reasonably through the piecewise function processing of complaint density A i r d (Formula (4)) and complaint emotional intensity A i r s (Formula (5)). The specific calculation process of the index is as follows:
(1) Normalization
We first used the min–max normalization method [29] (Formulae (6) and (7)) to linearly transform the complaint density A i r d and complaint emotional intensity A i r s to unified A i r d * and A i r s * , which ranges between 0 and 1.
A i r d * = 1 A i r d M i n ( A i r d ) M a x ( A i r d ) M i n ( A i r d )
A i r s * = A i r s M i n ( A i r s ) M a x ( A i r s ) M i n ( A i r s )
(2) Piecewise function model
Then, we used Formula (8) to construct a piecewise function model f for APPI, according to the normalized complaint density   A i r d * and complaint emotional intensity A i r s * .
f ( A i r d * , A i r s * ) = { ( A i r s * + 1 ) A i r d * A i r s * , A i r s * A i r d * ( A i r d * + 1 ) A i r s * A i r d * , A i r d * > A i r s *
The advantage of using the piecewise function model [30] to measure the public’s perception of air pollution is that if there is a large difference between the complaint density and complaint emotional intensity, it can reduce the deviation value’s impact on the results.
(3) APPI
Finally, the final air pollution perception index (APPI) is obtained by normalizing the piecewise function f, as shown in Formula (9).
A P P I = f ( A i r d * ,   A i r s * ) M i n M a x M i n
The APPI ranges between 0 and 1. The closer the APPI value is to 1, the stronger the public perception of air pollution.

2.2.4. Perception Center of Gravity

Finally, according to the results of APPI, we used the gravity Formula (10) to analyze the temporal and spatial characteristics of the public perception of air pollution. In this paper, the center of gravity for air pollution perception refers to a point in the study area where public perception in all directions can be balanced.
X = i = 1 n w i x i i = 1 n w i                                         Y = i = 1 n w i y i i = 1 n w i
where X and Y are the coordinates of the perceptual center of gravity, n is the total number of complaint points, xi and yi are the coordinates of the complaint point i, wi is the weight of i, expressed as the inverse number of the APPI.

3. Results

3.1. Descriptive Statistical Analysis

This paper’s application examples consist of 11,699 air pollution public complaints data in Shandong Province from 2012 to 2017. As of December 2017, this comprises 17 cities in Shandong Province, including Jinan, Qingdao, Zibo, Zaozhuang, Dongying, Yantai, Weifang, Jining, Taian, Weihai, Rizhao, Binzhou, Dezhou, Liaocheng, Linyi, Heze, and Laiwu.
Table 4 lists statistical results to understand the data characteristics of public complaints about air pollution in Shandong Province from 2012 to 2017. In Table 4, the column “Counts” represents the total number of complaints, columns “Mean” and “SD” represent the average and standard deviation of the number of complaints or the Emotional intensity of complaints, respectively. The column “Annual changes” of the number of complaints indicates the total number of complaints changes each year. The column “Annual changes” of the emotional intensity of complaints shows the average complaint intensity changes every year.
Table 4 shows that the air pollution complaints were identified with a mean of 1949.83 (SD = 877.74) per year in Shandong Province. From 2012 to 2017, both the number of air pollution complaint data and the public’s complaint emotional intensity in Shandong Province showed a trend of first increasing and then decreasing. However, the annual changes in the number of complaints and the intensity of air pollution complaints were not completely consistent. For example, when the number of complaints is small, the intensity of complaint emotion is not necessarily weakened. When the number of complaints is large, the intensity of complaint emotion is not necessarily strong.
Therefore, from the perspective of statistical analysis, it is not enough to consider the number of public complaints about air pollution or the intensity of complaint emotion alone.

3.2. Spatiotemporal Analysis of Public Perception of Air Pollution

3.2.1. Spatiotemporal Analysis of Complaint Density and Emotional Intensity

We calculated the longitude and latitude coordinates of each complaint data through the address-matching method. The spatial distribution results of air pollution complaint data in Shandong Province from 2012 to 2017 are obtained (Figure 2). Figure 2 shows that the public complaints about air pollution are almost distributed in all regions of 17 cities in Shandong Province.
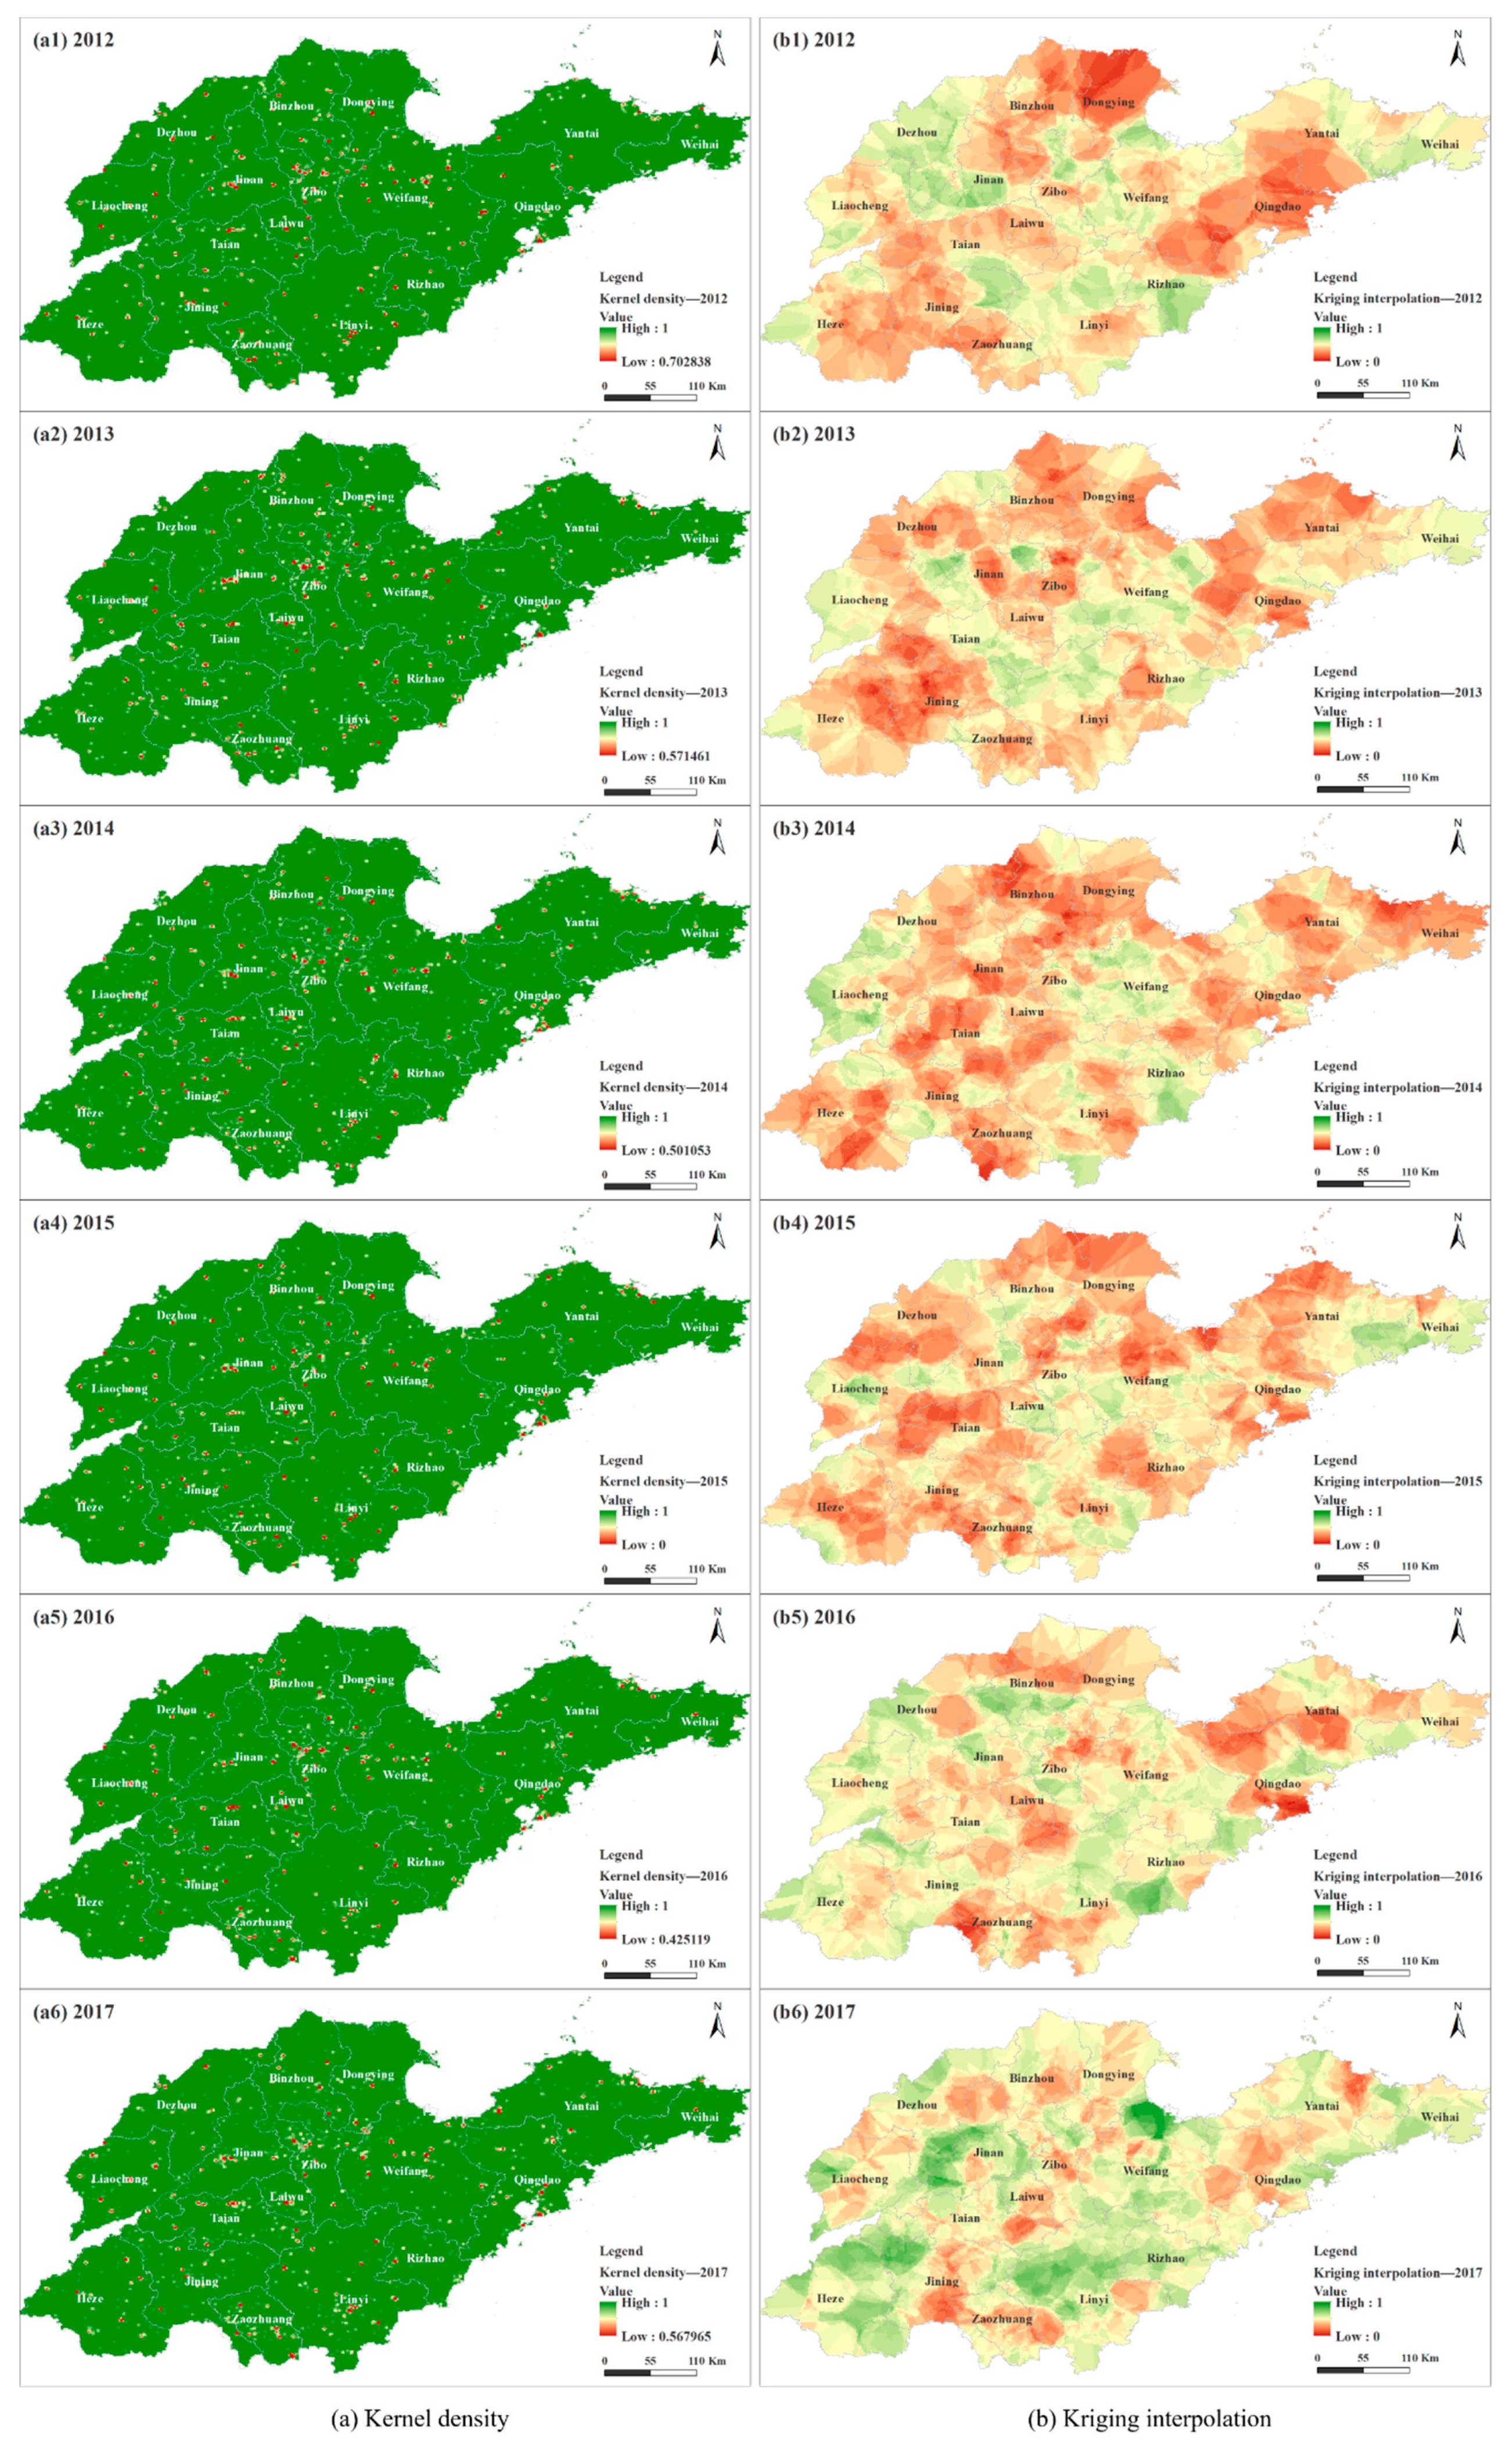
Then, we used Kernel density and Kriging interpolation to analyze the complaint density and complaint emotion intensity of air pollution in Shandong Province from 2012 to 2017. The results are shown in Figure 3.
In Figure 3a, red indicates the area with high public complaints about air pollution. Figure 3a shows that almost every city in Shandong Province has some high-density areas of public complaints. In Figure 3b, the emotional intensity of public complaints about air pollution is negative. The redder the color, the smaller the emotional value of public complaints, and the stronger public’s negative emotional intensity.
From the spatial distribution of complaint density and complaint emotion intensity, public complaints’ negative emotion intensity is not very large in areas with high complaint density, such as Jinan, Zibo, and Linyi in 2016. Public complaints’ negative emotion is also very strong in low complaint density areas, such as Binzhou and Yantai inland in 2017.
The above results reflect that, whether statistical analysis or spatial analysis, only dependent on the public’s complaint density or the public’s complaint emotional intensity, cannot reasonably express the public’s perception of air pollution.

3.2.2. Spatiotemporal Analysis of APPI

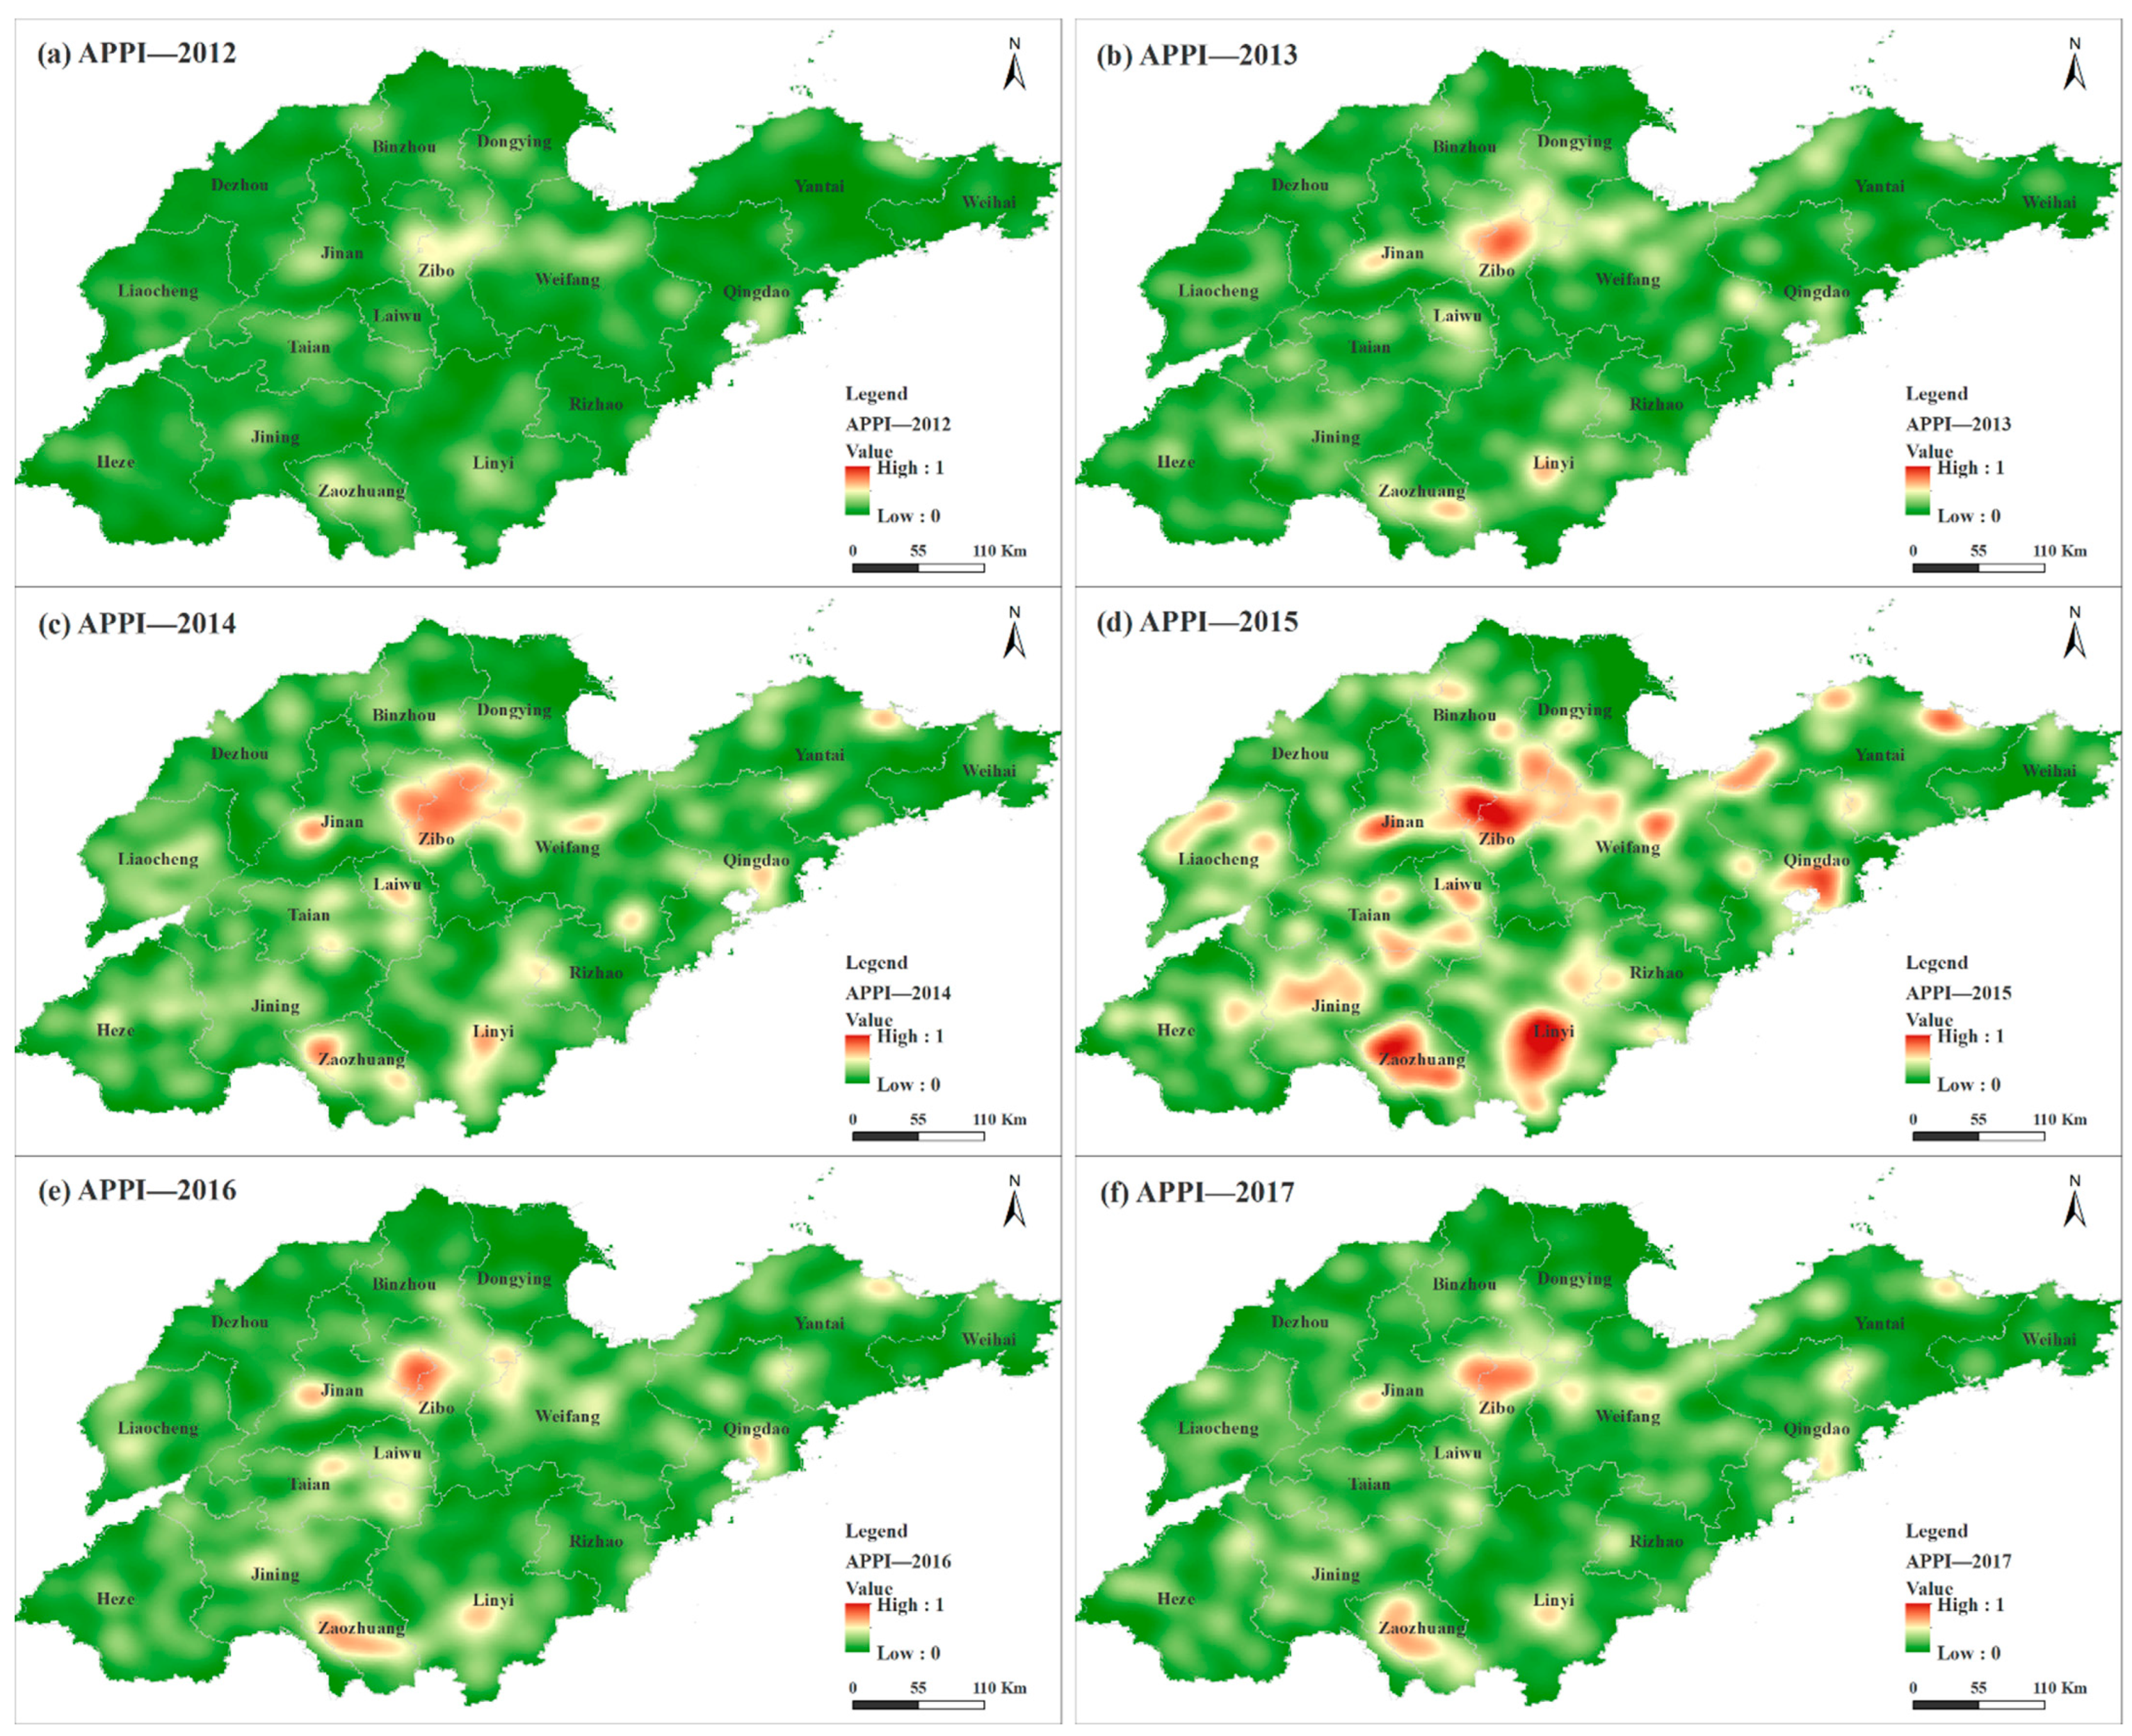
To evaluate the public’s perception of air pollution more reasonably and comprehensively, we used Formula 9 to calculate the index APPI based on the public’s complaint density and complaint emotional intensity. The spatial distribution results of APPI are shown in Figure 4.
As shown in Figure 4, the APPI of different years is normalized and comparable. Moreover, to make the interannual changes of public perception comparable, the maximum density of APPI in 2015 was taken as the standard, and the color changes in other years were set. Red is the high-density area of APPI, which indicates the strongest public perception of air pollution. At the same time, green is the low-density area of APPI, which means the weakest public perception of air pollution.
Figure 4 indicates that, from 2012 to 2015, public perception of air pollution first increased and then decreased. For example, the public’s perception of air pollution had increased year by year in Shandong Province, reaching the peak in 2015. Since 2015, the public’s perception of air pollution had been a progressive decrease every year.
When coupled with the results in Table 4, the increase in the number of public complaints and the perceived intensity of air pollution may be due to the increased public awareness of environmental protection. It may also indicate the aggravation of air pollution. However, the decrease in the number of public complaints and the weakening of public perception of air pollution, to a certain extent, reflects that the air quality has been improved. In addition, existing studies have shown that Shandong Province and even China’s air quality have become better in recent years [1].
Figure 4 also shows that Zibo, Jinan, Laiwu, Zaozhuang, Linyi, and Qingdao are the areas with the strongest public perception of air pollution. Except for Qingdao, other cities are inland cities with developed industry in Shandong Province. Naturally, air pollution cannot be avoided in cities with developed industries, especially in cities where chemical products mainly by refineries are the critical project, which will also be the birthplace of air pollution. Qingdao is not only a coastal city, but also a tourist city. At the same time, there are many industries and enterprises in Qingdao. Therefore, the public’s strong perception of its air pollution may be due to the public’s higher requirements on air quality in Qingdao or the impact of industrial emissions. That may be related to the distribution of industries or enterprises that are prone to air pollution.
This paper will further verify public complaints’ content through word cloud analysis and POI data of industries and enterprises in the discussion section.

3.3. Change of Center of Gravity of APPI

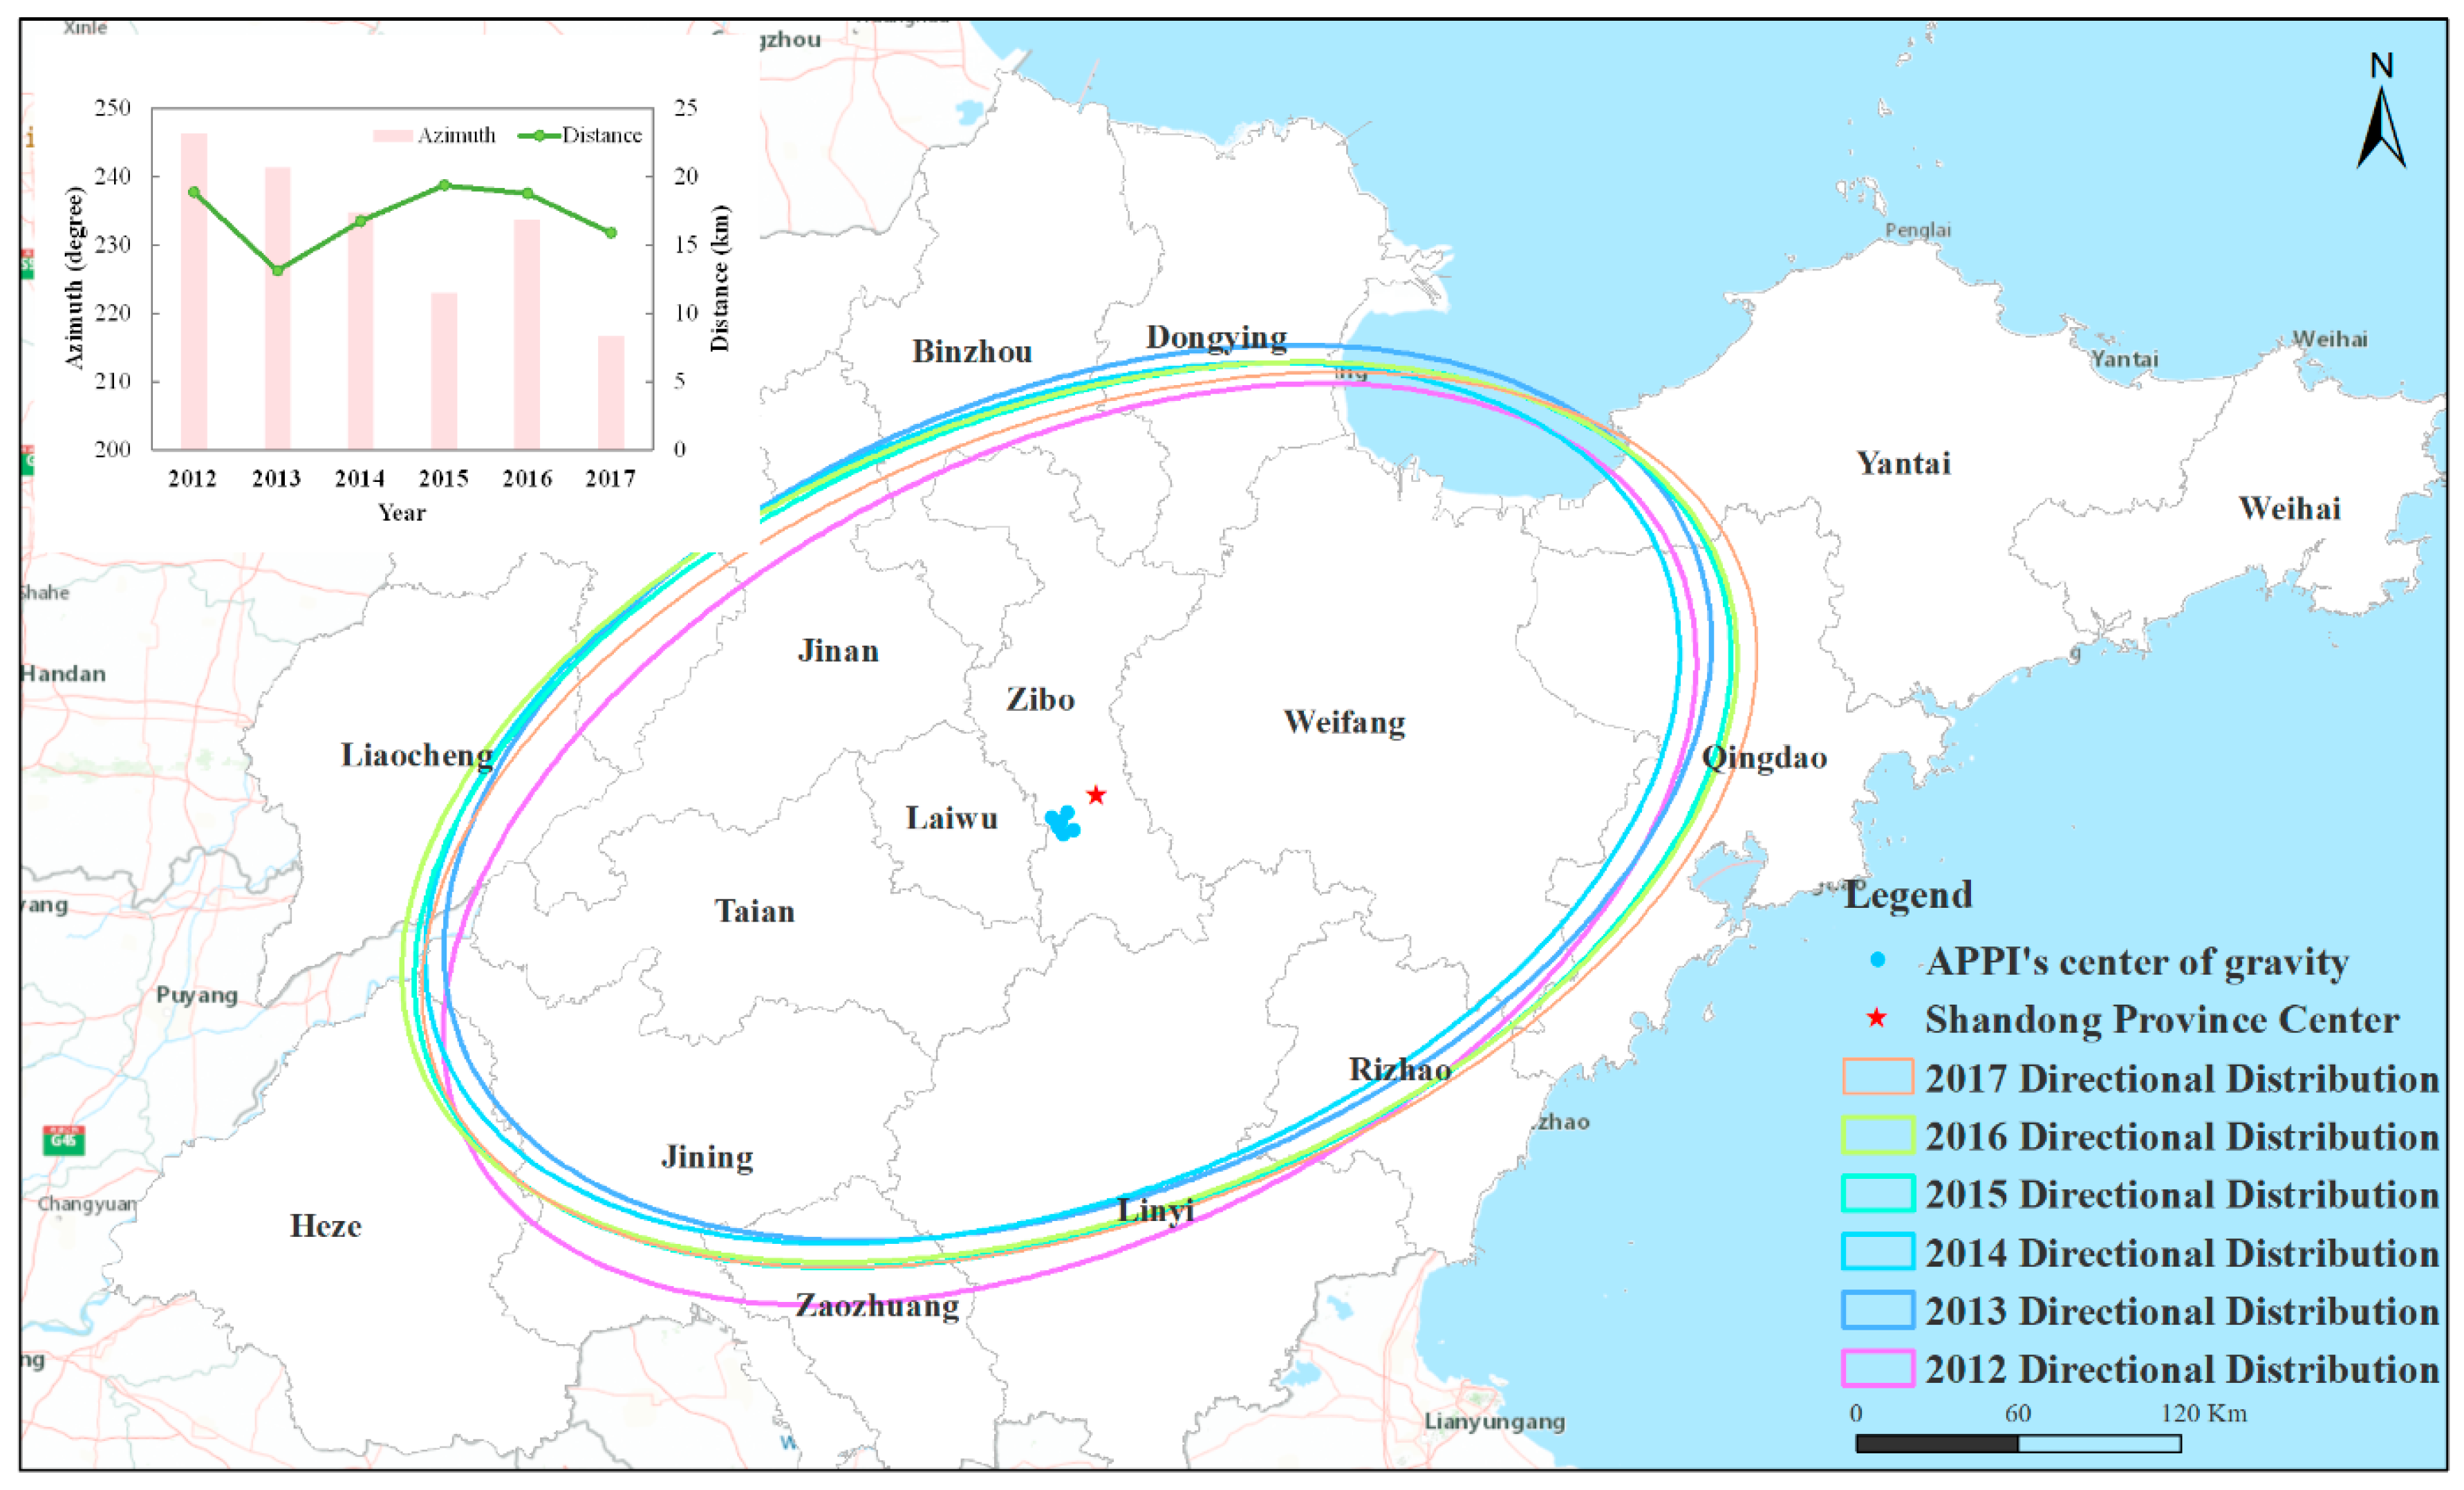
According to the public perception results of air pollution from 2012 to 2017 in Section 3.2.2, the air pollution perception index (APPI) and its geographical location information are used to build the center of the gravity model of public perception according to Equation (10). The results are shown in Figure 5.
The red five-pointed star in Figure 5 represents the center of Shandong Province, and the blue points represent the center of gravity of APPI in different years. The ellipses in different colors represent the directional distribution of APPI in different years. The green line and pink column in the statistical chart respectively indicate the distance and azimuth angle change between the center of gravity of APPI and the center of Shandong Province.
Figure 5 suggests that the general trend of the public’s air pollution perception is in the southwest of Shandong Province from 2012 to 2017. There is little difference in the distance and direction of the center of gravity of public perception of air pollution over the years, the mean offset distance is about 17 km (SD = 2.39), and the mean offset angle is about 232° (SD = 11.09) per year in Shandong Province.
It may be that the northern and eastern regions of Shandong Province are mostly coastal cities. First of all, coastal cities generally have relatively strong winds, and the air circulates quickly. Secondly, seawater will absorb some of the air’s impurities due to the sea and have a specific effect of purifying the air. Moreover, coastal cities generally have more vegetation than inland cities, which can improve the air quality. So coastal cities’ air quality is usually better than inland towns, and the public is more concerned about air pollution. The public’s perception of air pollution is relatively low in the southwestern region of Shandong’s center of gravity, cities such as Jinan, Laiwu, Zibo, Zaozhuang, Linyi, and other towns dominated by industry, mining, and enterprises [31]. The discharge of three industrial wastes, such as exhaust gas, wastewater, solid waste, will pollute the atmosphere and directly endangers human health. Therefore, the public has a stronger perception of air pollution.
Moreover, in recent years, the Shandong public’s perception of air pollution has not been very different. It may be due to some inherent air pollution problems related to industrial development that have not been resolved. Specific issues and reasons need to be further developed with the help of refined data.

4. Discussion

This paper shows that the areas with the strongest public perception of air pollution are mainly located in the southwest of Shandong Province, including Zibo, Laiwu, Jinan, Zaozhuang, Linyi, and other cities. The cities mentioned above primarily focus on industrial development.
Therefore, we used POI data to explore the relationship between the high value of APPI and enterprises’ space distribution. We used word cloud analysis-based complaint data content to discuss the problems of public complaints, because the public’s perception was the strongest in 2015, and we took it as an example.
Word cloud was initially proposed by Rich Gordon, associate professor of Journalism at Northwestern University [32], a visual display of ‘keywords’ with high frequency in the text. Words with increased frequency will be presented in a larger form, while the words with low frequency will be presented in a smaller format. Word cloud image filters out a large number of low-frequency and low-quality text information so that the viewer can appreciate the text’s theme as soon as they scan the text. The distribution of APPI and industrial POI points (a) and the results of complaint content based on word cloud analysis (b) in Shandong Province in 2015 are shown in Figure 6.
Figure 6a describes that cities with the strongest public perception of air pollution, such as Jinan, Zibo, Laiwu, Weifang, Zaozhuang, Linyi, and Qingdao, are also the densest enterprises. The word cloud result shows that the most frequent word is “enterprise” (Figure 6b), followed by “pollution,” “villagers,” or “village” in the complaint content. It indicates that the public is more concerned about the impact of enterprises on air pollution. Moreover, the high-frequency vocabulary words of “village” and “villagers” mean that these enterprises may be located in the suburbs, such as the Zhangdian District of Zibo.
The more enterprises there are, the more the pollutants, and the stronger the public perception of air pollution will be. Although coastal cities also have high-density industries and enterprises, their self-purification ability is relatively strong, the public perception of air pollution is stable.
As an international tourism city, Qingdao mainly focuses on the development of tourism services and enterprises. The public may have higher requirements on its air quality, so the perception of air pollution (APPI) is also stronger.
In this section, we can conclude that the public’s strong perception of air pollution is also the high-density area of enterprises. The word cloud analysis of public complaints’ content well confirms this conclusion, indicating that the index APPI proposed in this paper can effectively evaluate the public perception of air pollution.

5. Conclusions

This paper put forward the air pollution perception index APPI according to the complaint density and complaint emotion intensity based on the air pollution complaint data. APPI uses the piecewise function model to assess the public’s perception of air pollution comprehensively. The proposed APPI was then applied to the air pollution complaint data of Shandong Province from 2012 to 2017, and the results were also verified by word cloud analysis and POI data.
(1) the statistical analysis and spatial distribution of air pollution complaint density and public complaint emotion intensity are not entirely consistent. The proposed APPI can more reasonably evaluate the public perception of air pollution.
(2) The public perception of air pollution tends to the southwest of Shandong Province, and coastal cities are relatively weak.
(3) The content of public complaints about air pollution mainly focuses on enterprises’ exhaust emissions. Moreover, in inland cities with dense industrial enterprises, the value of APPI is higher, the public perception of air pollution is stronger.
Given the above conclusions, some suggestions can be put forward for the relevant air quality management departments in this paper. Firstly, to maintain economic development. It is necessary to strengthen enterprises’ supervision in the Southwest Shandong Province to meet the pollution discharge standards. Although industries and enterprises drive the city’s economic development, they still have to balance the relationship between industrial development and air quality. Secondly, enhance the public’s enthusiasm to participate in air pollution control and cooperate to optimize air quality.
In conclusion, the air pollution perception index (APPI) proposed in this paper has high feasibility and practical application value and can be extended to other cities’ air pollution perception evaluation. It can also test the effectiveness of government air pollution control to a certain extent and has significant supervision value for improving air quality. Moreover, for the objective monitoring station data, it is also a supplement of subjective data analysis. Because where there is pollution, the public will have dissatisfaction and expectation. The complaint data directly reflect the dissatisfaction of the people. The dissatisfaction of the people is an intuitive evaluation of air quality, which is the most convincing.
However, it should be noted that the proposed indicator APPI in this paper is primarily meant for the public’s historical perception. In future research, we need to use meteorological data and social media data for in-depth analysis to predict the public’s perception of air pollution more reliably.

Author Contributions

Conceptualization, Y.S.; methodology, Y.S.; software, Y.S.; validation, Y.S., and H.W.; formal analysis, Y.S. and Y.Z.; investigation, Y.S. and H.W.; resources, M.J.; data curation, M.J.; writing—original draft preparation, Y.S.; writing—review and editing, F.J.; visualization, H.W.; supervision, F.J.; project administration, M.J. and H.W.; funding acquisition, F.J. All authors have read and agreed to the published version of the manuscript.

Funding

This work was supported by the Major Scientific and Technological Innovation Projects in Shandong Province (2019JZZY020103) and a grant from State Key Laboratory of Resources and Environmental Information System.

Data Availability Statement

The data presented in this study are available on request from the corresponding author. The data are not publicly available due to the data also forms part of an ongoing study.

Conflicts of Interest

The authors declare no conflict of interest.

References

  1. Zhou, Z.; Guo, X.; Wu, H.; Yu, J. Evaluating air quality in China based on daily data: Application of integer data envelopment analysis. J. Clean. Prod. 2018, 198, 304–311. [Google Scholar] [CrossRef]
  2. Peng, M.; Zhang, H.; Evans, R.D.; Zhong, X.; Yang, K. Actual Air Pollution, Environmental Transparency, and the Perception of Air Pollution in China. J. Environ. Dev. 2019, 28, 78–105. [Google Scholar] [CrossRef] [Green Version]
  3. Cong, X.; Ma, L.; Wang, L.; Aparauskas, J.; Skibniewski, M. The early warning system for determining the “not in My Back Yard” of heavy pollution projects based on public perception. J. Clean. Prod. 2021, 282, 125398. [Google Scholar] [CrossRef]
  4. Liu, X.; Wu, Y.; Hu, Y.; Liu, D.; Zhang, J.; Chen, C.; Yuan, Z.; Lu, Y. Government employees’ perception of urban air pollution and willingness to pay for improved quality: A cross-sectional survey study in Nanchang, China. Environ. Sci. Pollut. Res. 2016, 23, 22183–22189. [Google Scholar] [CrossRef] [PubMed]
  5. Reames, T.G.; Bravo, M.A. People, place and pollution: Investigating relationships between air quality perceptions, health concerns, exposure, and individual- and area-level characteristics. Environ. Int. 2018, 122, 244–255. [Google Scholar] [CrossRef] [PubMed]
  6. Li, Z.; Folmer, H.; Xue, J. Perception of Air Pollution in the Jinchuan Mining Area, China: A Structural Equation Modeling Approach. Int. J. Environ. Res. Public Health 2016, 13, 735. [Google Scholar] [CrossRef]
  7. Huang, J.; Yang, J.Z. Beyond under the dome: An environmental documentary amplified public risk perception about air pollution in China. J. Risk Res. 2020, 23, 227–241. [Google Scholar] [CrossRef]
  8. Liao, P.; Shaw, D.; Lin, Y. Environmental quality and life satisfaction: Subjective versus objective measures of air quality. Soc. Indic. Res. 2015, 124, 599–616. [Google Scholar] [CrossRef]
  9. Guo, Y.; Li, Y.W. Online amplification of air pollution risk perception: The moderating role of affect in information. Inf. Commun. Soc. 2018, 21, 80–93. [Google Scholar] [CrossRef]
  10. Carducci, A.; Donzelli, G.; Cioni, L.; Palomba, G.; Verani, M.; Mascagni, G.; Anastasi, G.; Pardini, L.; Ceretti, E.; Grassi, T.; et al. Air pollution: A study of citizen’s attitudes and behaviors using different information sources. Epidemiol. Biostat. Public Health 2017, 14, 1–9. [Google Scholar]
  11. Veloz, D.; Gonzalez, M.; Brown, P.; Gharibi, H.; Cisneros, R. Perceptions about air quality of individuals who work outdoors in the San Joaquin Valley, California. Atmos. Pollut. Res. 2020, 11, 825–830. [Google Scholar] [CrossRef]
  12. Song, Y.; Zhou, A.; Zhang, M. Exploring the effect of subjective air pollution on happiness in China. Environ. Sci. Pollut. Res. 2020, 27, 43299–43311. [Google Scholar] [CrossRef] [PubMed]
  13. Pu, S.; Shao, Z.; Fang, M.; Yang, L.; Liu, R. Spatial distribution of the public’s risk perception for air pollution: A nationwide study in China. Sci. Total Environ. 2019, 655, 454–462. [Google Scholar] [CrossRef] [PubMed]
  14. Gu, H.; Yan, W.; Elahi, E.; Cao, Y. Air pollution risks human mental health: An implication of two-stages least squares estimation of interaction effects. Environ. Sci. Pollut. Res. 2020, 27, 2036–2043. [Google Scholar] [CrossRef]
  15. Oltra, C.; Sala, R. Perception of risk from air pollution and reported behaviors: A cross-sectional survey study in four cities. J. Risk Res. 2018, 21, 869–884. [Google Scholar] [CrossRef]
  16. Huang, L.; Rao, C.; Kuijp, T.; Bi Jun Liu, Y. A comparison of individual exposure, perception, and acceptable levels of PM2.5 with air pollution policy objectives in China. Environ. Res. 2017, 157, 78–86. [Google Scholar] [CrossRef]
  17. Chen, L.; Zhang, J.; You, Y. Air Pollution, Environmental Perceptions, and Citizen Satisfaction: A Mediation Analysis. Environ. Res. 2020, 184, 109287. [Google Scholar] [CrossRef]
  18. Gurajala, S.; Dhaniyala, S.; Matthews, J. Understanding Public Response to Air Quality Using Tweet Analysis. Soc. Media Soc. 2019, 5, 2056305119867656. [Google Scholar] [CrossRef] [Green Version]
  19. Wang, Y.D.; Fu, X.K.; Jiang, W.; Wang, T.; Tsou, M.H.; Ye, X.Y. Inferring urban air quality based on social media. Comput. Environ. Urban Syst. 2017, 66, 110–116. [Google Scholar] [CrossRef]
  20. Hswen, Y.; Qin, Q.; Brownstein, J.S.; Hawkins, J.B. Feasibility of using social media to monitor outdoor air pollution in London, England. Prev. Med. 2019, 121, 86–93. [Google Scholar] [CrossRef]
  21. Ryu, Y.H.; Min, S.K. What matters in public perception and awareness of air quality? Quantitative assessment using internet search volume data. Environ. Res. Lett. 2020, 15. [Google Scholar] [CrossRef]
  22. Huang, Y.; Fei, T.; Kwan, M.-P.; Kang, Y. GIS-Based Emotional Computing: A Review of Quantitative Approaches to Measure the Emotion Layer of Human–Environment Relationships. ISPRS Int. J. Geo-Inf. 2020, 9, 551. [Google Scholar] [CrossRef]
  23. Gallagher, D.L.; Dietrich, A.M. Satistical approaches for analyzing customer complaint data to assess aesthetic episodes in drinking water. J. Water Supply Res. Technol. AQUA 2014, 63, 358–367. [Google Scholar] [CrossRef]
  24. Avaliani, S.L.; Balter, B.M.; Balter, D.B. Air pollution source identification from odor complaint data. Air Qual. Atmos. Health 2015, 9, 179–192. [Google Scholar] [CrossRef]
  25. Pan, G.; Wang, B.; Guo, S.; Zhang, W. Statistical analysis of sewer odour based on 10-year complaint data. Water Sci. Technol. 2020, 81, 1221–1230. [Google Scholar] [CrossRef] [PubMed]
  26. Sailunaz, K.; Alhajj, R. Emotion and sentiment analysis from Twitter text. J. Comput. Sci. 2019, 36, 101003. [Google Scholar] [CrossRef] [Green Version]
  27. Chen, S.; Lv, X.; Gou, J. Personalized Recommendation Model: An Online Comment Sentiment Based Analysis. Int. J. Comput. Commun. Control 2020, 15, 1004. [Google Scholar] [CrossRef] [Green Version]
  28. Lin, Y.; Kang, M.; Wu, Y.; Du, Q.; Liu, T. A deep learning architecture for semantic address matching. Int. J. Geograph. Inf. Sci. 2020, 34, 559–576. [Google Scholar] [CrossRef]
  29. Han, J.; Kamber, M.; Pei, J. Data Transformation and Data Discretization. Data Mining: Concepts and Techniques; Elsevier: Amsterdam, The Netherlands, 2011; pp. 111–118. [Google Scholar]
  30. Mumford, D.; Shah, J. Optimal approximations by piecewise smooth functions and associated variational problems. Commun. Pure Appl. Math. 1989, 42, 577–685. [Google Scholar] [CrossRef] [Green Version]
  31. Li, J.; Sun, Z. Urban Function Orientation Based on Spatiotemporal Differences and Driving Factors of Urban Construction Land. J. Urban Plan. Dev. 2020, 146, 05020011. [Google Scholar] [CrossRef]
  32. Qiang, J.; Mitchell, C.; Qiang, A. Tuning of An Adaptive Unified Differential Evolution Algorithm for Global Optimization. In Proceedings of the IEEE Congress on Evolutionary Computation (CEC), Vancouver, BC, Canada, 24–29 July 2016; pp. 4061–4068. [Google Scholar] [CrossRef]
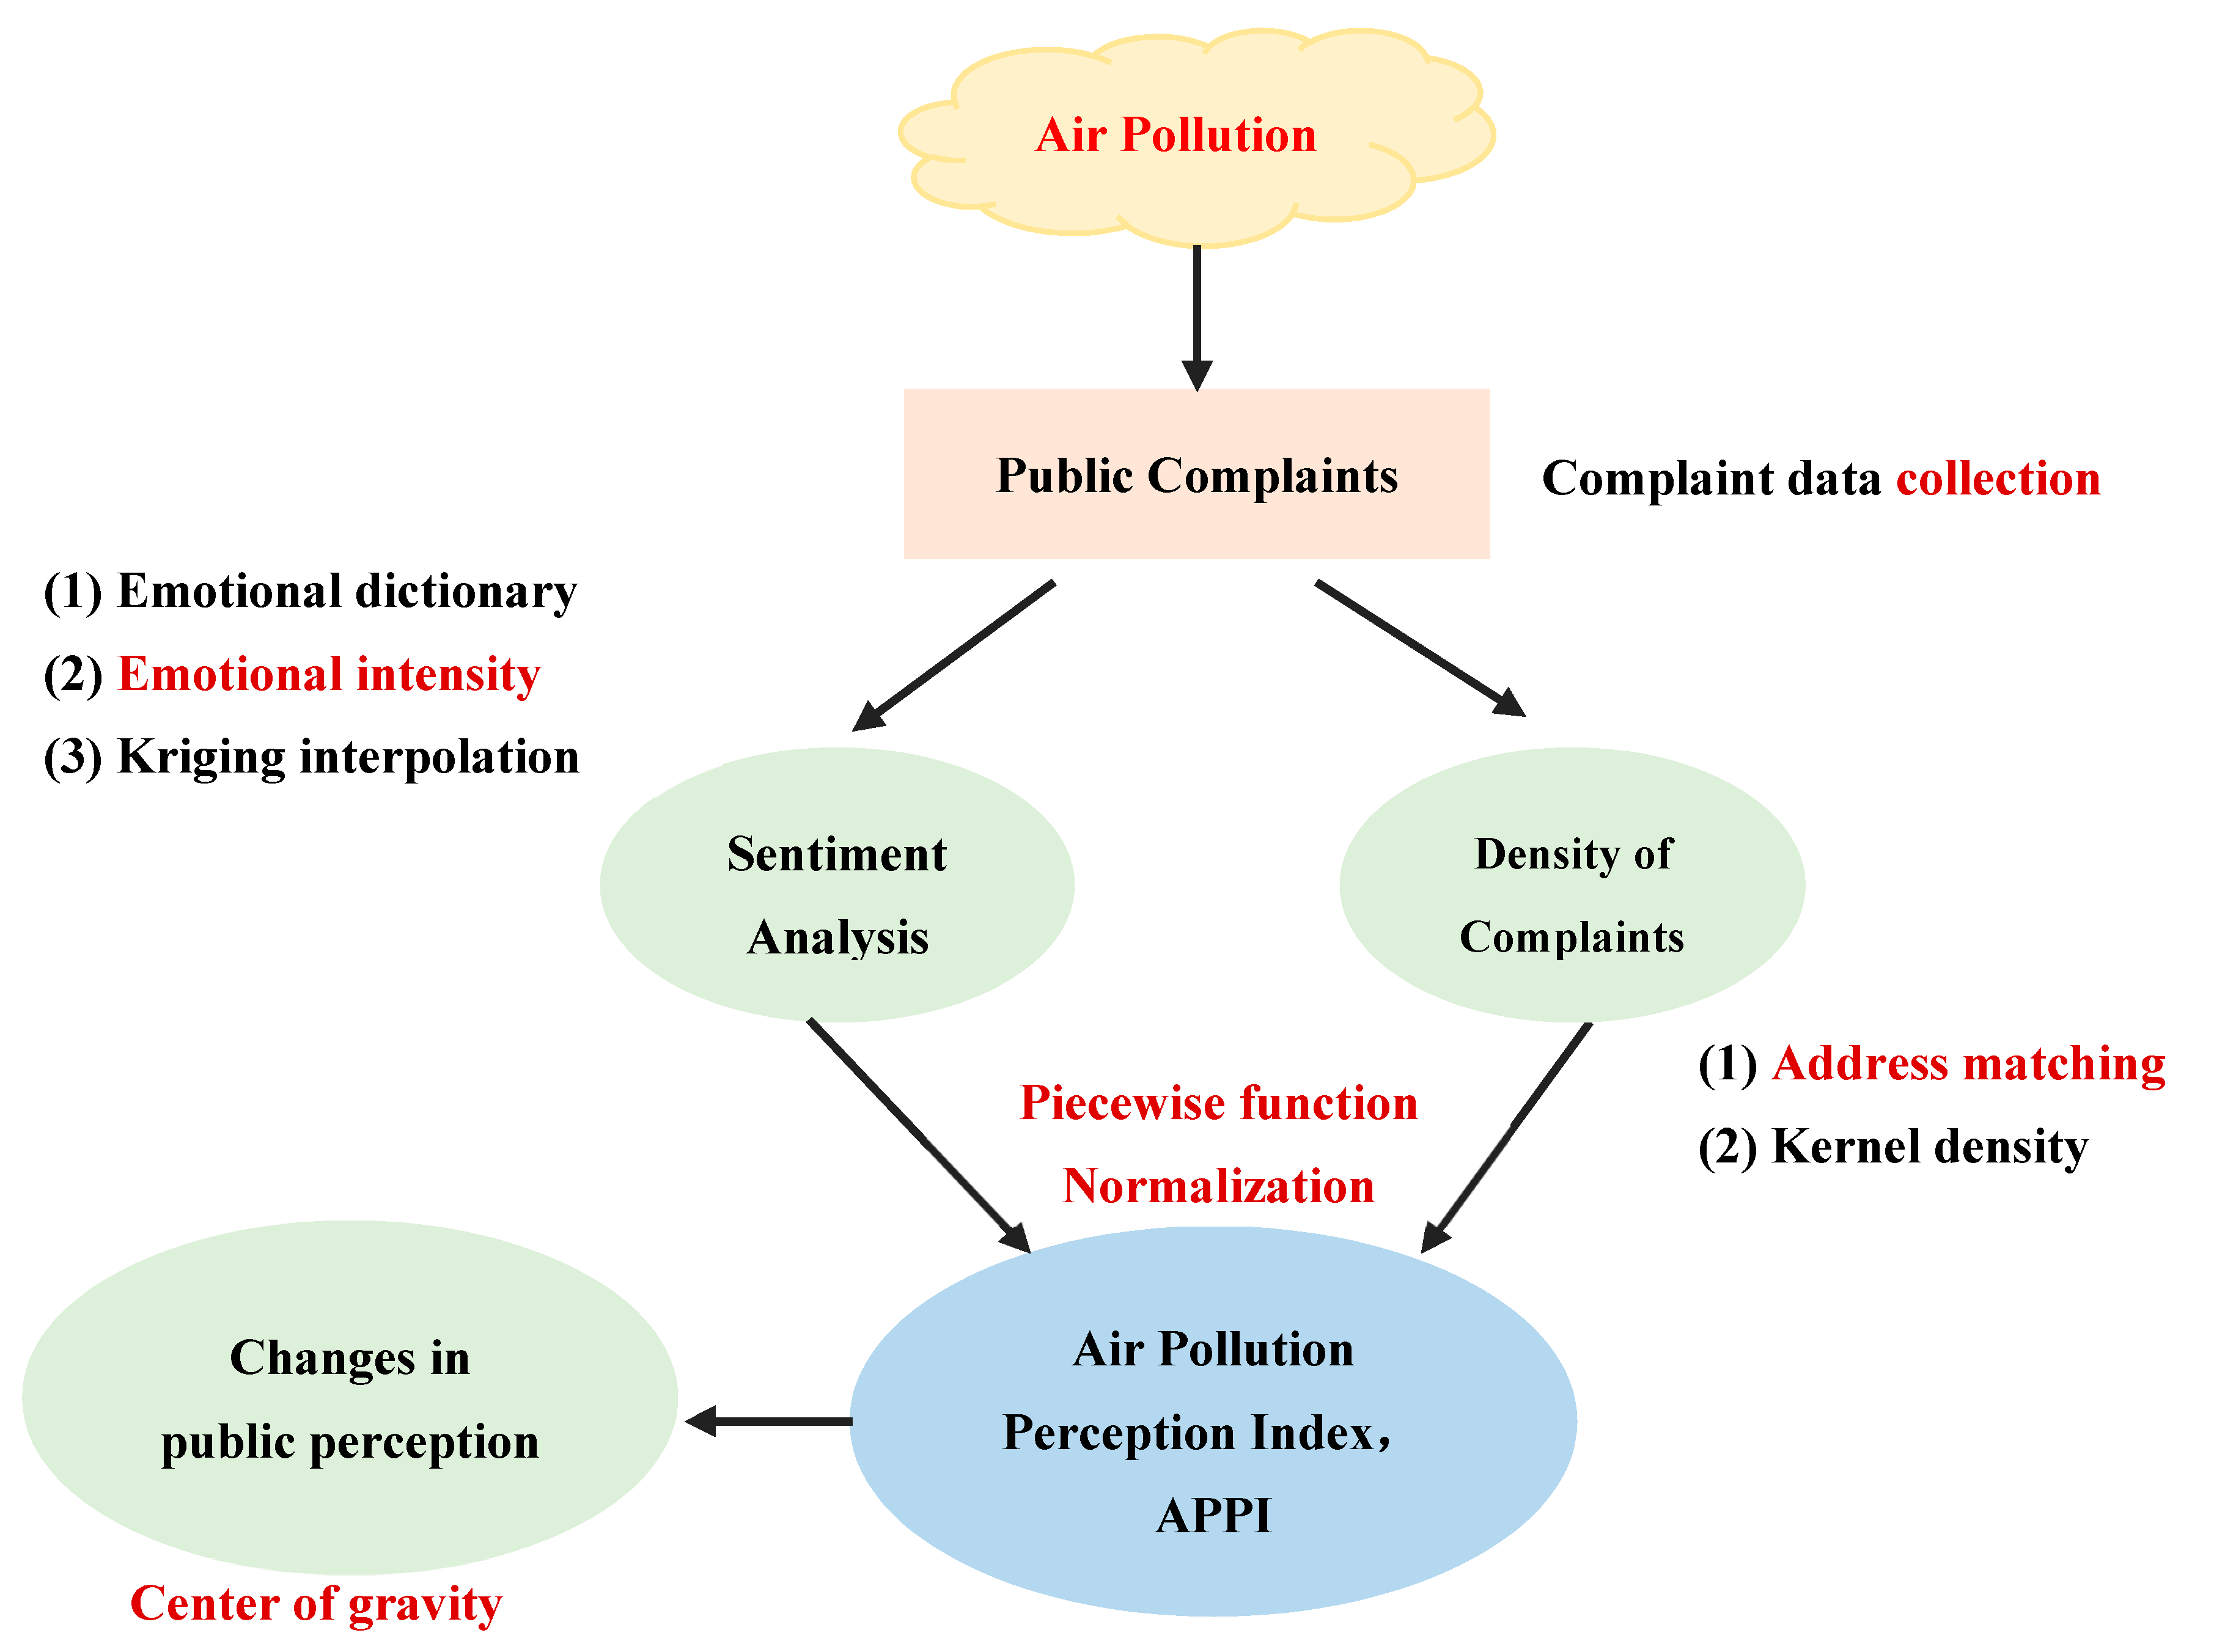
Figure 1. Flow chart of air pollution perception index (APPI) based on public complaint data and emotional analysis.
Applsci 11 01894 g001
Figure 2. Spatial distribution of air pollution complaint data in Shandong Province from 2012 to 2017.
Applsci 11 01894 g002
Figure 3. Spatial distribution of air pollution complaint density (a) and complaint emotion intensity (b) based on Kernel density and Kriging interpolation in Shandong Province from 2012 to 2017.
Applsci 11 01894 g003
Figure 4. The results of APPI in Shandong Province from 2012 to 2017.
Applsci 11 01894 g004
Figure 5. Change of center of gravity of APPI (blue points) from 2012 to 2017.
Applsci 11 01894 g005
Figure 6. Superposition results of industrial sites and APPI in Shandong Province in 2015 (a) and content analysis of air pollution complaints based on word cloud (b).
Applsci 11 01894 g006
Table 1. Sample data of public complaints (Translate data into English).
NumberDateTitleContentReply
2012071803052012/7/18Small polluted refineryIllegal oil refining in Xinzhao Village, Xuzhuang Town, Shanting District, Zaozhuang City, Shandong Province! The water in the river is black with the waste oil discharged. The oil factory removes the pungent smell, and many children get sick.[Environmental Protection Bureau of Zaozhuang City] According to the investigation, there are six small oil refineries in Xinzhao Village, Xuzhuang Town, Shanting District, which uses waste plastics to process diesel products. The production equipment is simple. Shanting District Environmental Protection Bureau issued a Notice of rectification within a time limit for illegal acts.
2015060520082015/6/5Exhaust gas and serious pollutionQingdao Jiaonan Lvyin Environmental Protection Technology Co., Ltd. secretly discharges waste gas at night. As an environmental protection enterprise, illegal operations have caused the surrounding residents to live under waste gas pollution for a long time, and thus, they require relocation.[Qingdao Municipal Environmental Protection Bureau] Provincial Environmental Protection Department: Our bureau immediately organized law enforcement personnel to implement it. Our bureau requested that the company rectify the entire plant’s links that could generate odors, and the company also reported the relevant rectification plan to our bureau.
Table 2. The labeling criteria of emotion intensity.
PolarityIntensityDescriptionExample
-(negative)9Beyond endurance, Cannot survivePain, cancer
7The atmosphere was foul, muddyBlack smoke, headache, dyspnea
5The dust is rising in cloudsDust storms, grey
3Has an unpleasant smellPeculiar smell, stench
1Can feel, but not affectedPollution, not blue
Table 3. The examples of the air pollution emotion dictionary.
Emotional WordsParts of PeechIntensityPolarity
Privatelyadv1−1
Sootnoun3−1
Pungentadj5−1
Reek to high heavenidiom7−1
Killedverb9-1
Table 4. Descriptive statistics of public complaints about air pollution in Shandong Province from 2012 to 2017.
NameNumber of ComplaintsEmotional Intensity of Complaints
CountsMeanSDAnnual ChangesMeanSDAnnual Changes
Shandong Province11,6991949.83877.74 Applsci 11 01894 i001−6.550.18 Applsci 11 01894 i002
Jinan46477.3332.00 Applsci 11 01894 i003−6.990.35 Applsci 11 01894 i004
Qingdao687114.5064.97 Applsci 11 01894 i005−6.470.33 Applsci 11 01894 i006
Zibo772128.6739.34 Applsci 11 01894 i007−6.560.25 Applsci 11 01894 i008
Zaozhuang721120.1761.12 Applsci 11 01894 i009−6.500.26 Applsci 11 01894 i010
Dongying43873.0018.38 Applsci 11 01894 i011−6.520.24 Applsci 11 01894 i012
Yantai924154.0074.75 Applsci 11 01894 i013−6.590.19 Applsci 11 01894 i014
Weifang1288214.6788.05 Applsci 11 01894 i015−6.710.23 Applsci 11 01894 i016
Jining714119.0050.50 Applsci 11 01894 i017−6.330.33 Applsci 11 01894 i018
Taian722120.3355.22 Applsci 11 01894 i019−6.800.36 Applsci 11 01894 i020
Weihai17128.5014.69 Applsci 11 01894 i021−6.450.27 Applsci 11 01894 i022
Rizhao37863.0027.93 Applsci 11 01894 i023−6.610.30 Applsci 11 01894 i024
Binzhou866144.3362.06 Applsci 11 01894 i025−6.460.21 Applsci 11 01894 i026
Dezhou50684.3339.46 Applsci 11 01894 i027−6.610.19 Applsci 11 01894 i028
Liaocheng793132.1767.36 Applsci 11 01894 i029−6.300.42 Applsci 11 01894 i030
Linyi1074179.0068.79 Applsci 11 01894 i031−6.300.31 Applsci 11 01894 i032
Heze697116.1742.15 Applsci 11 01894 i033−6.720.29 Applsci 11 01894 i034
Laiwu48781.1737.84 Applsci 11 01894 i035−6.530.17 Applsci 11 01894 i036
Publisher’s Note: MDPI stays neutral with regard to jurisdictional claims in published maps and institutional affiliations.