
Persistent Organic Pollutants and Metals in Atmospheric Deposition Rates around the Port-Industrial Area of Civitavecchia, Italy

 ,
,  , ,
, , 
Abstract
Featured Application
Abstract
1. Introduction
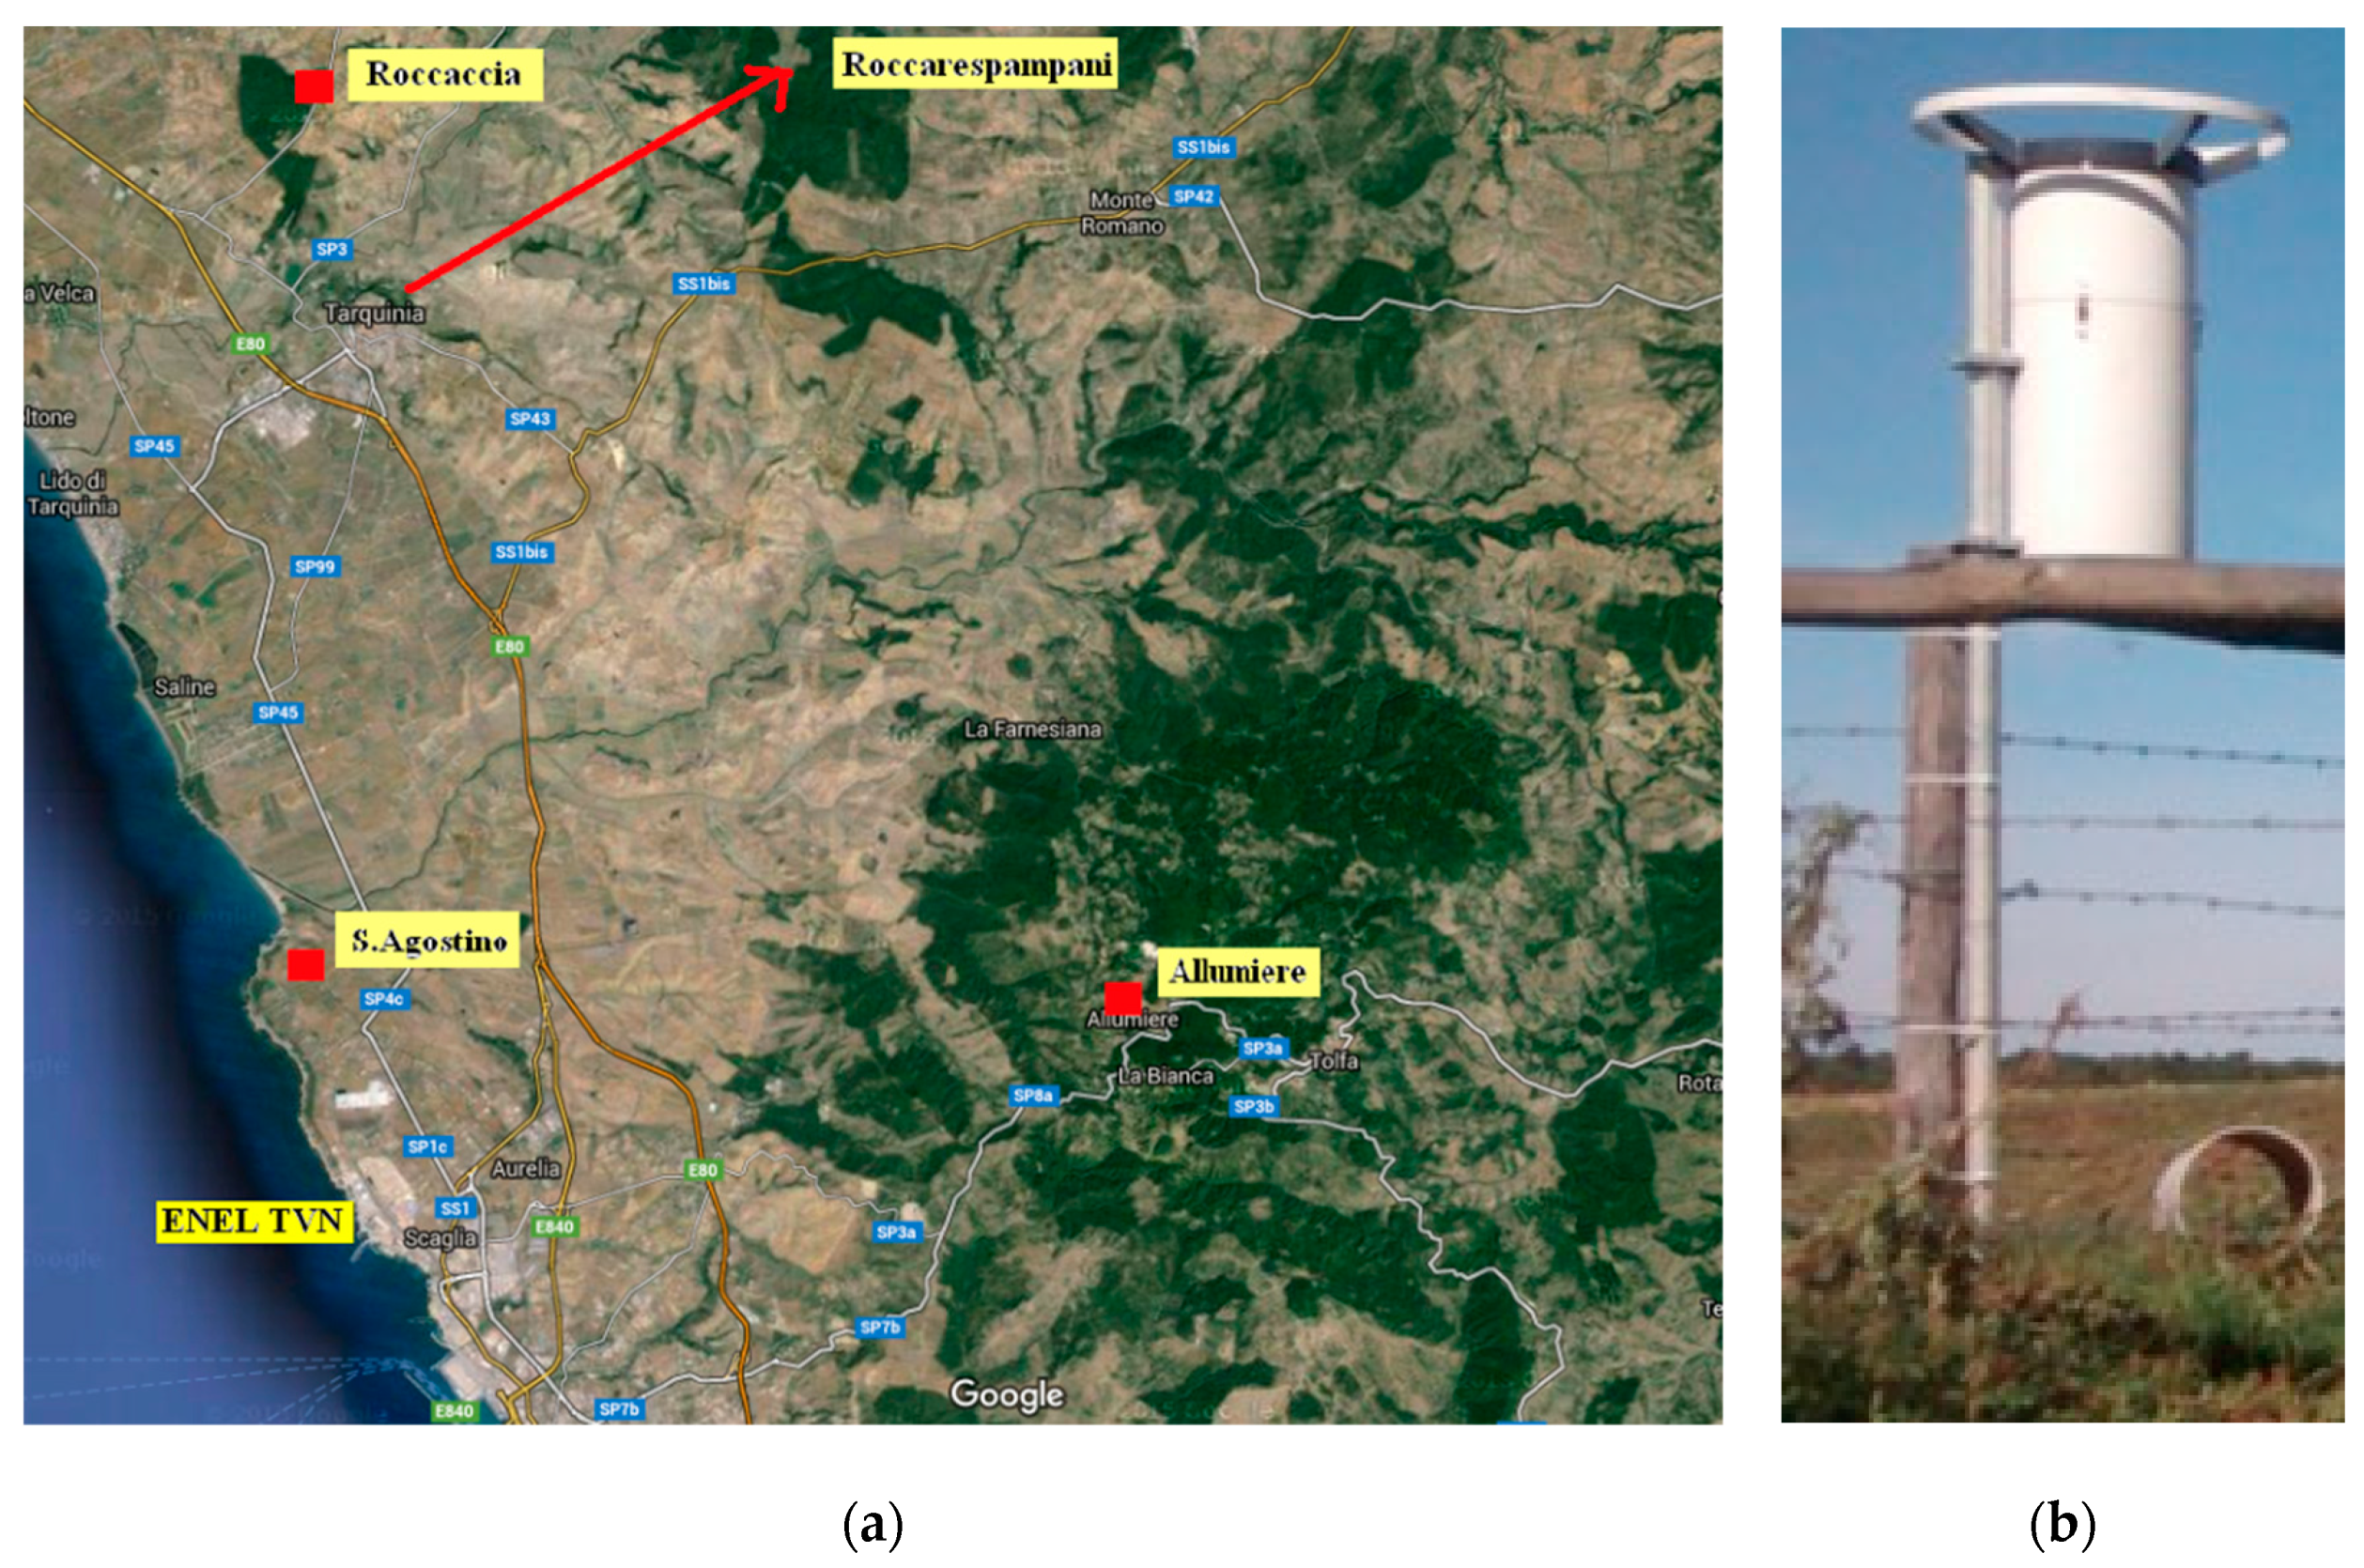
2. Materials and Methods
- Location #1: area not affected by industrial and urban sources; positioning: at the Roccaccia Business Center, Tarquinia Agricultural University;
- Location #2: area characterized by the absence of settlements; positioning: Enel Sant’Agostino electrical power station;
- Location #3: area characterized by medium population density; positioning: at the environmental monitoring station of the Management Consortium of the Environmental Observatory of Civitavecchia, at Allumiere;
- Location #4: area not affected by industrial and urban sources; positioning: at the Rocca Respampani Agricultural Company (background site).
3. Results and Discussion
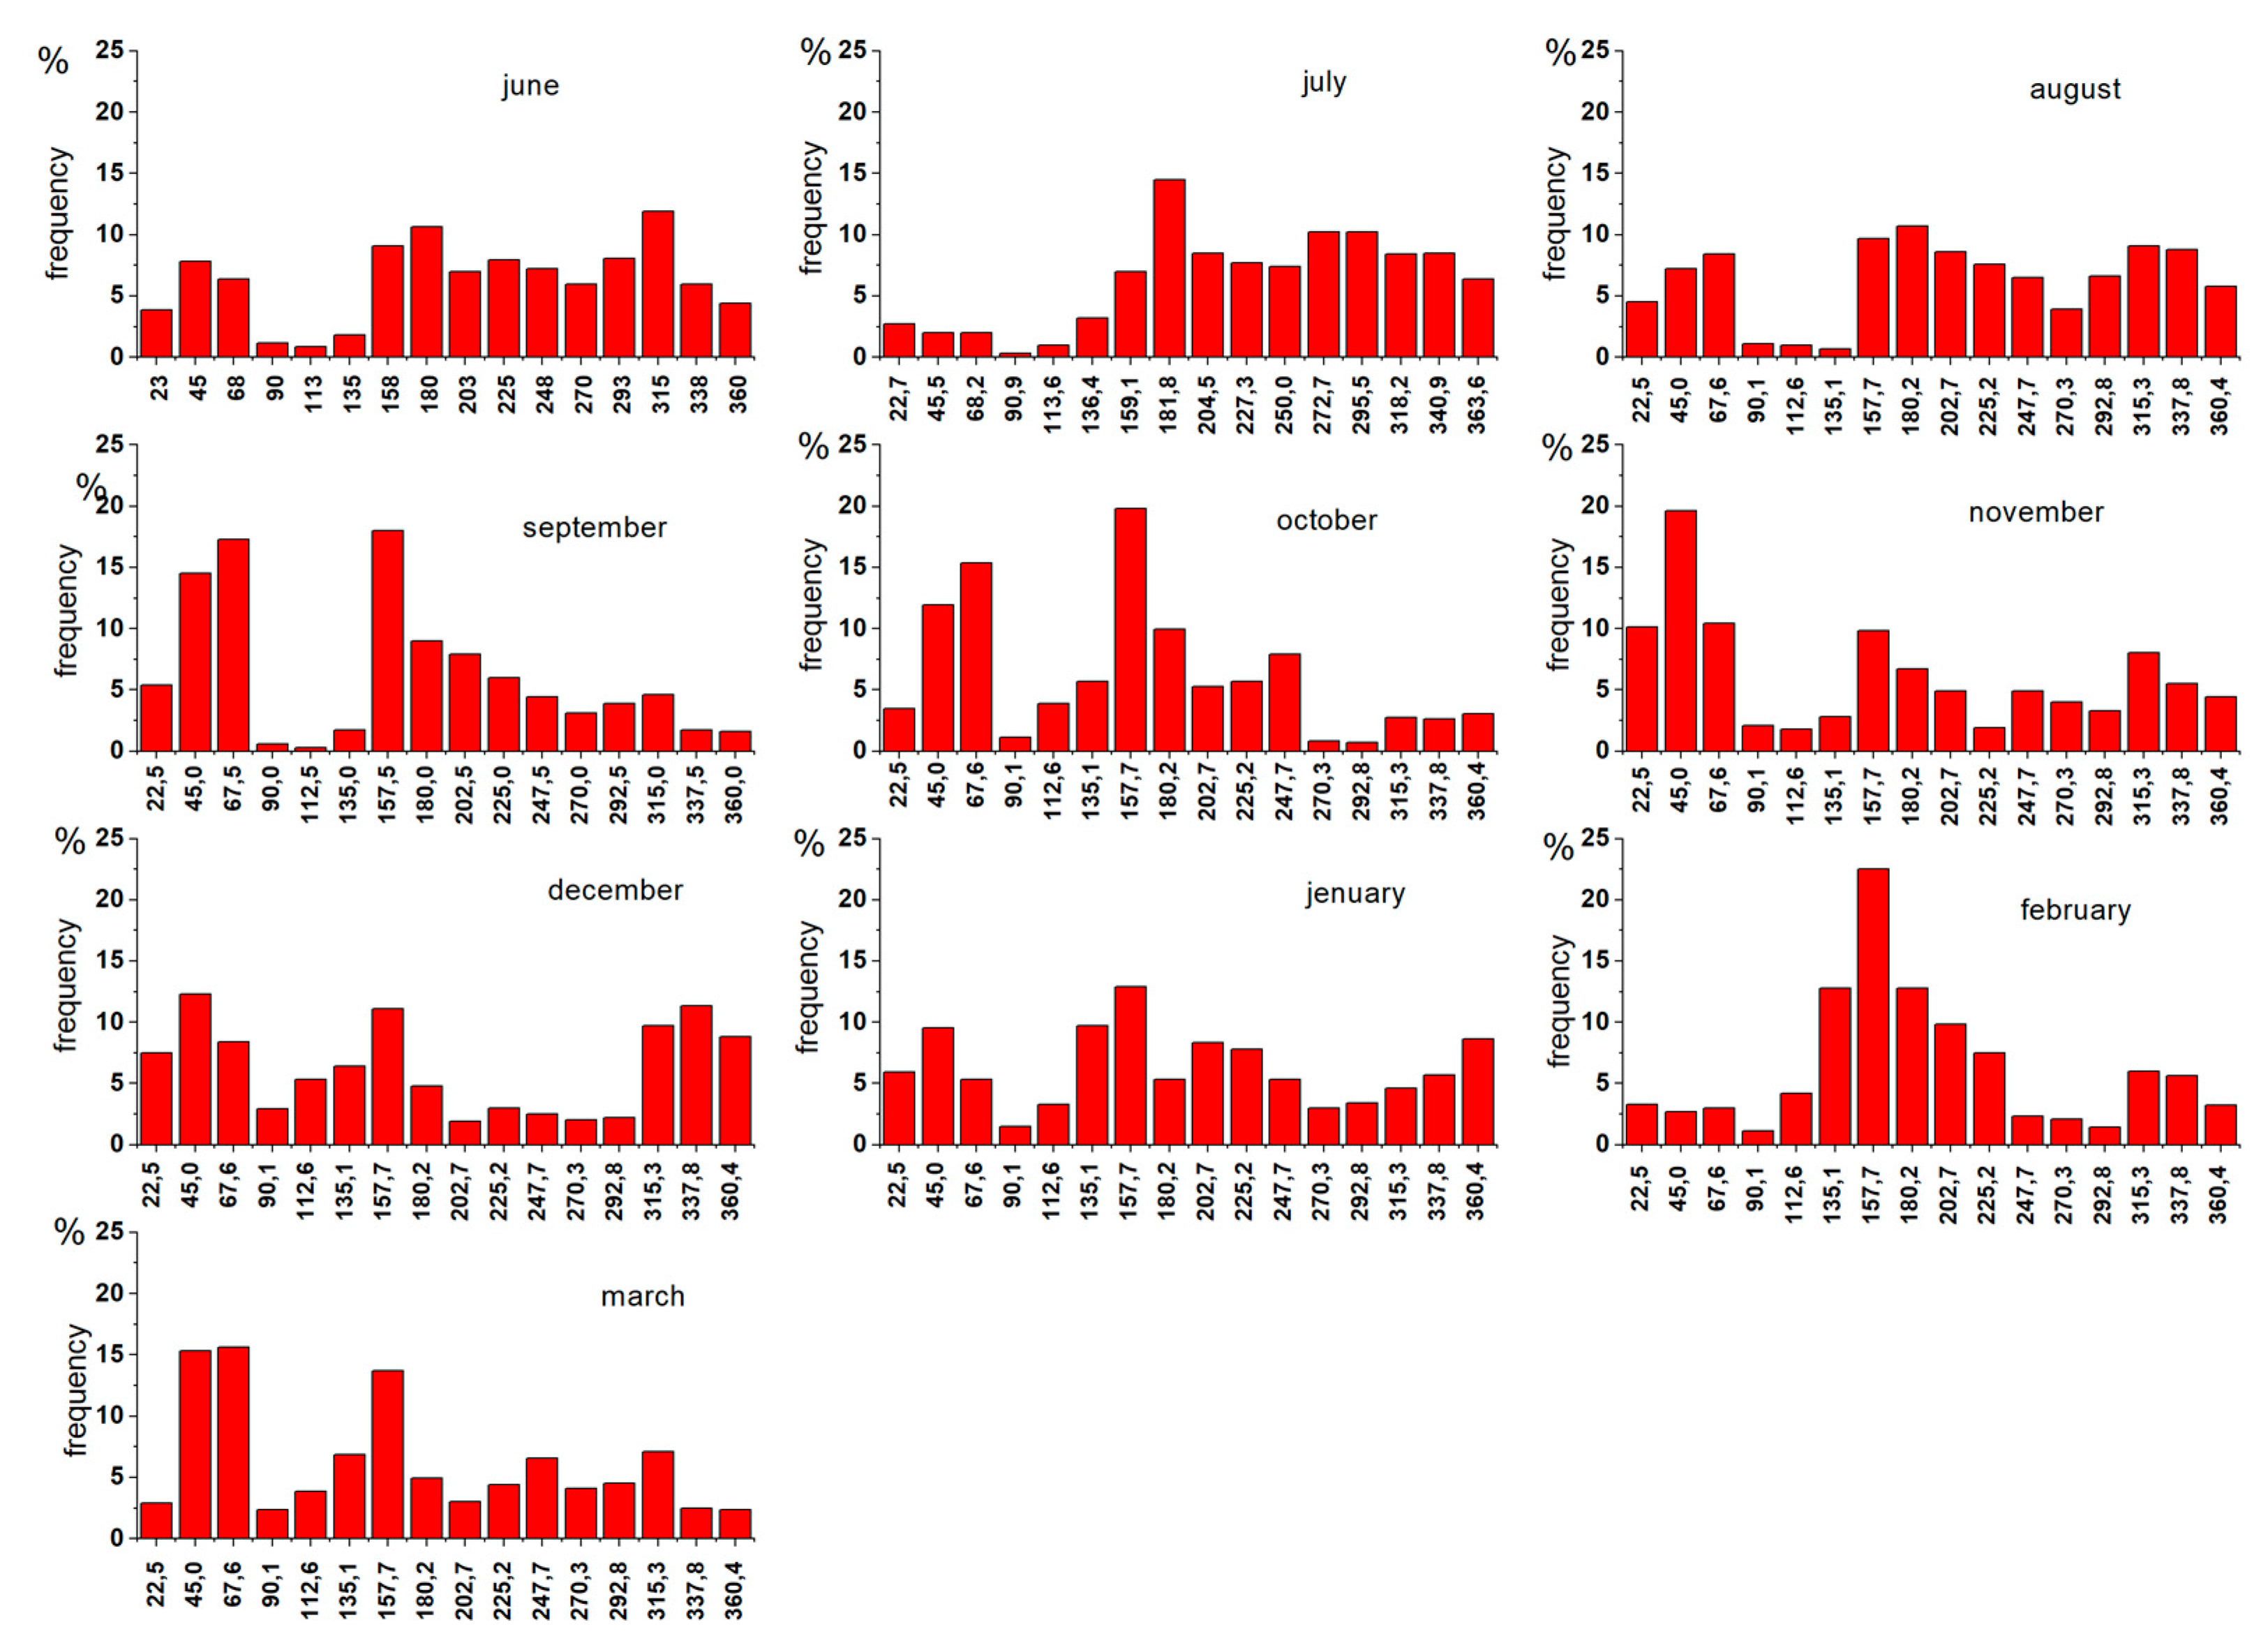
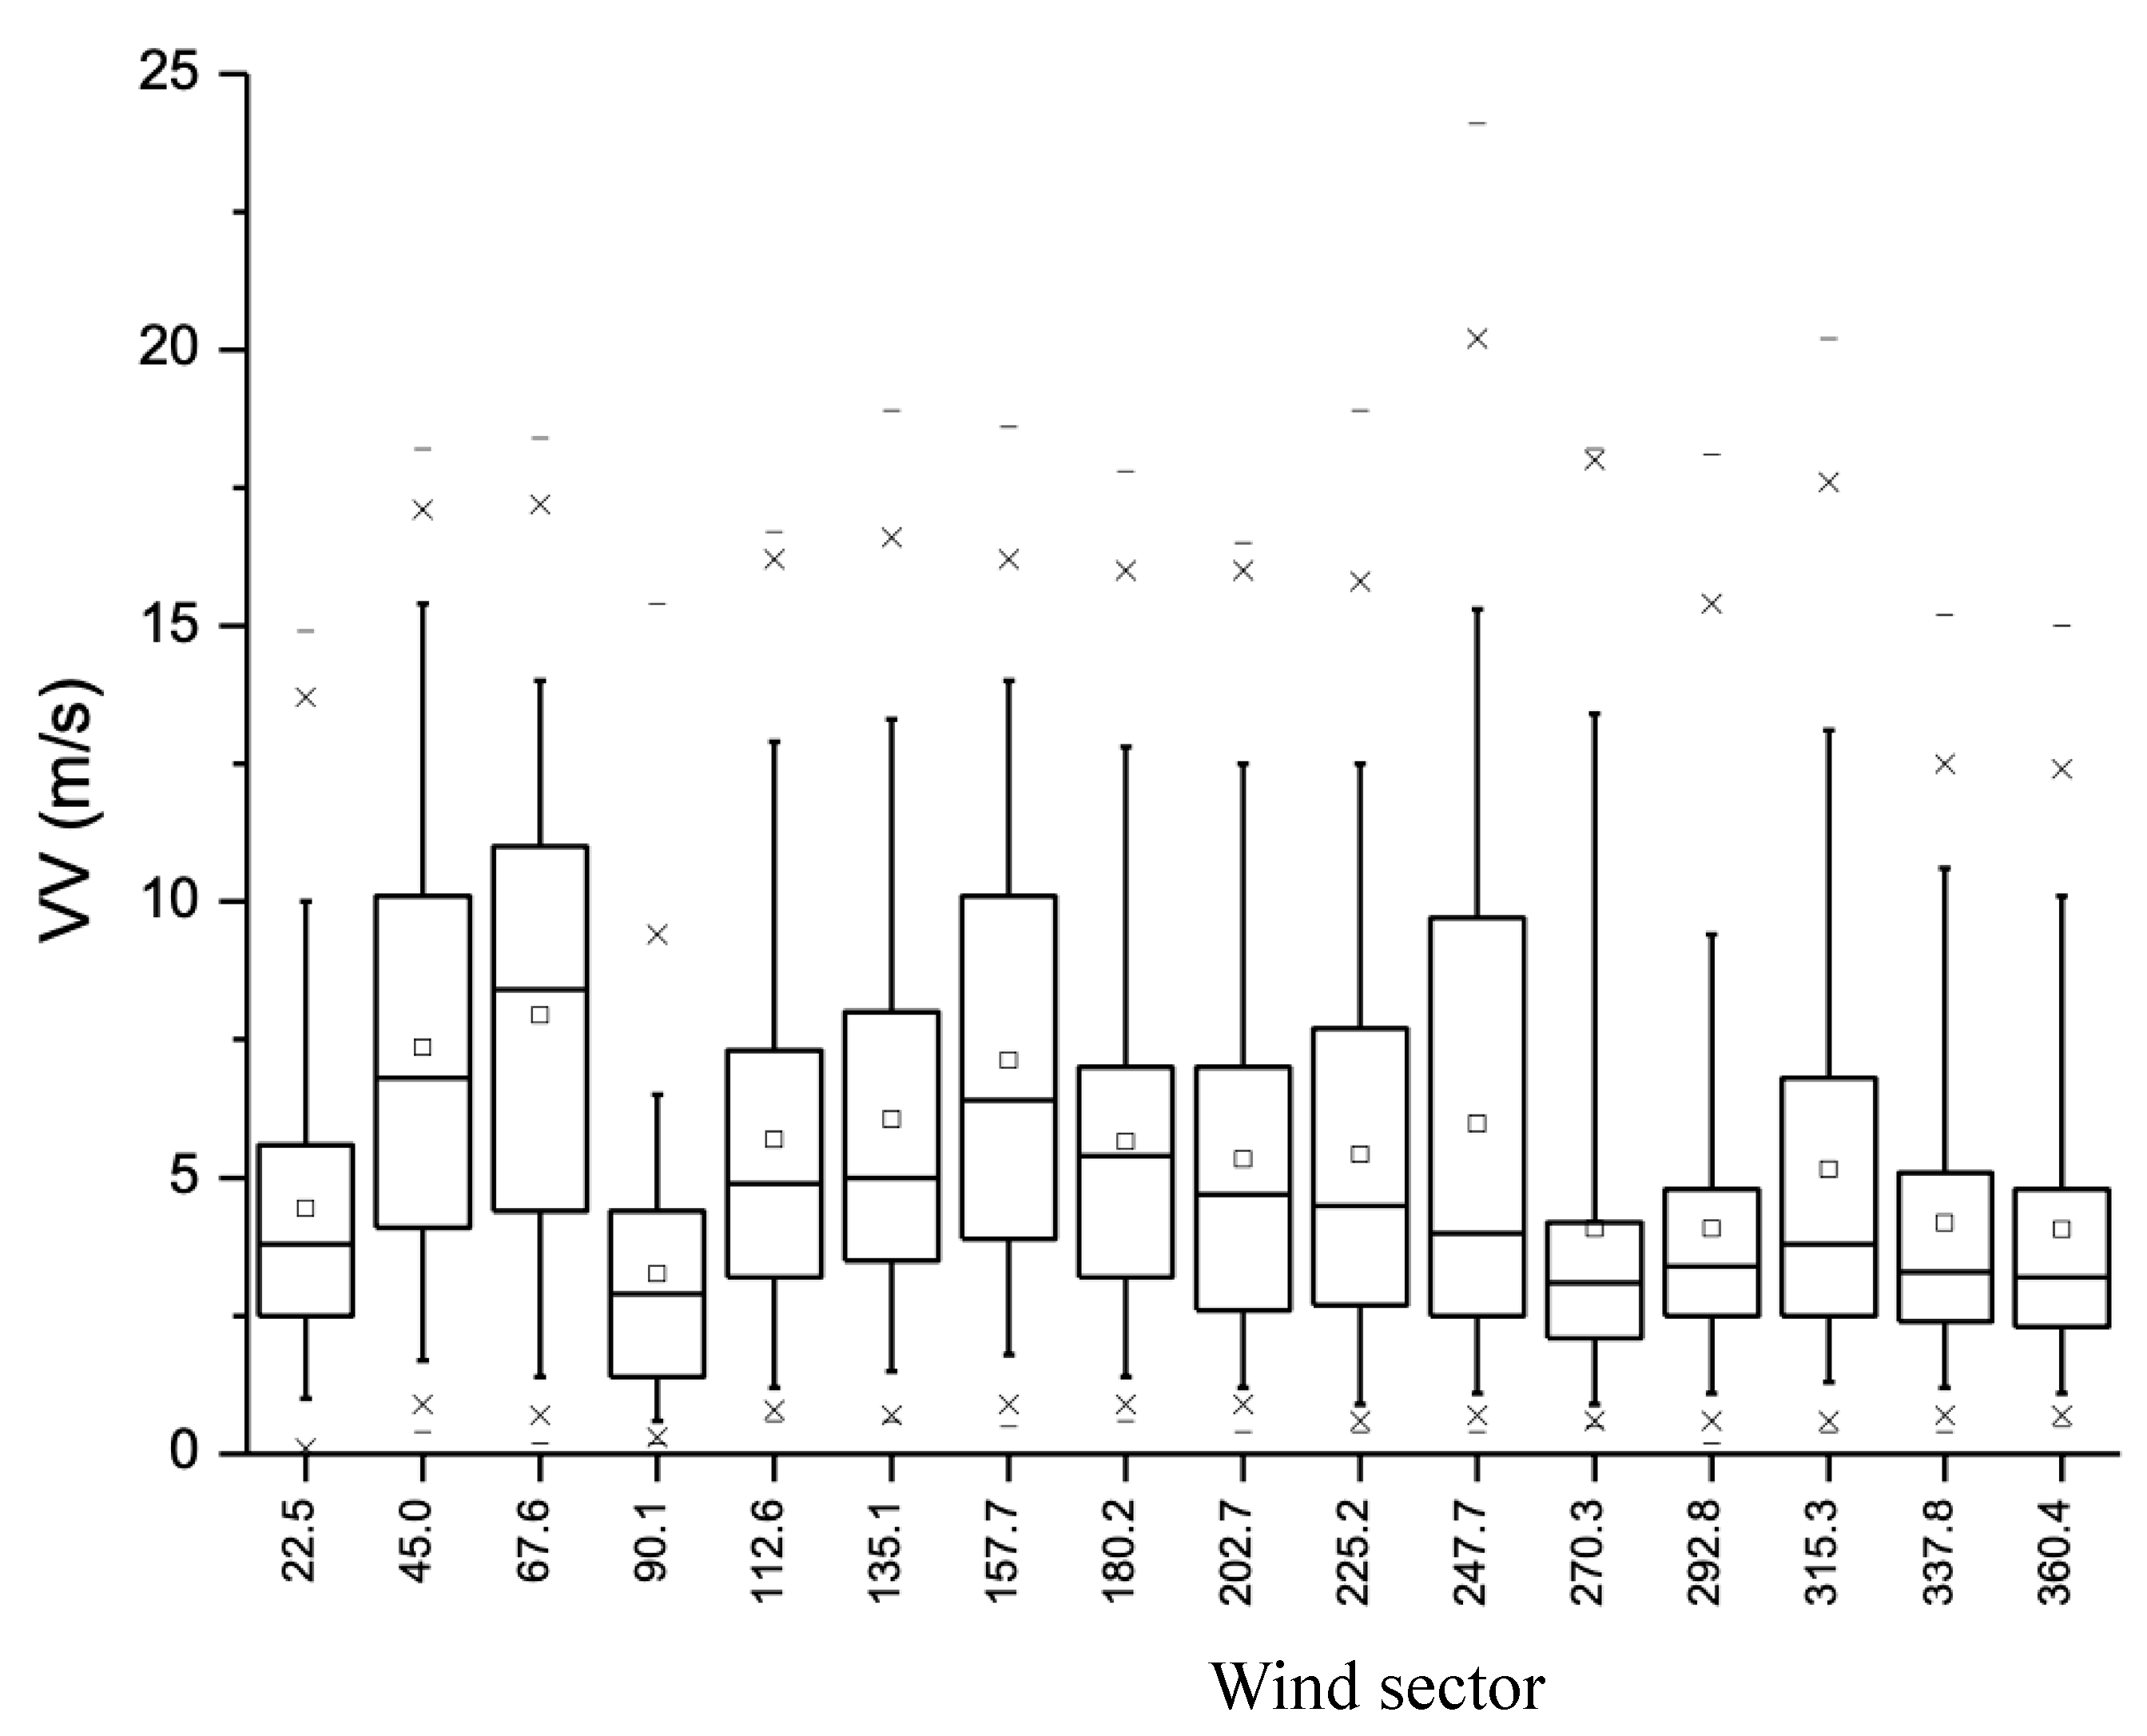
3.1. Analysis of the Prevailing Wind Direction
3.2. Atmospheric Deposition
3.2.1. Annual Deposition Rates
3.2.2. PCDD/Fs and DL-PCBs
3.2.3. PAHs
3.2.4. Metals
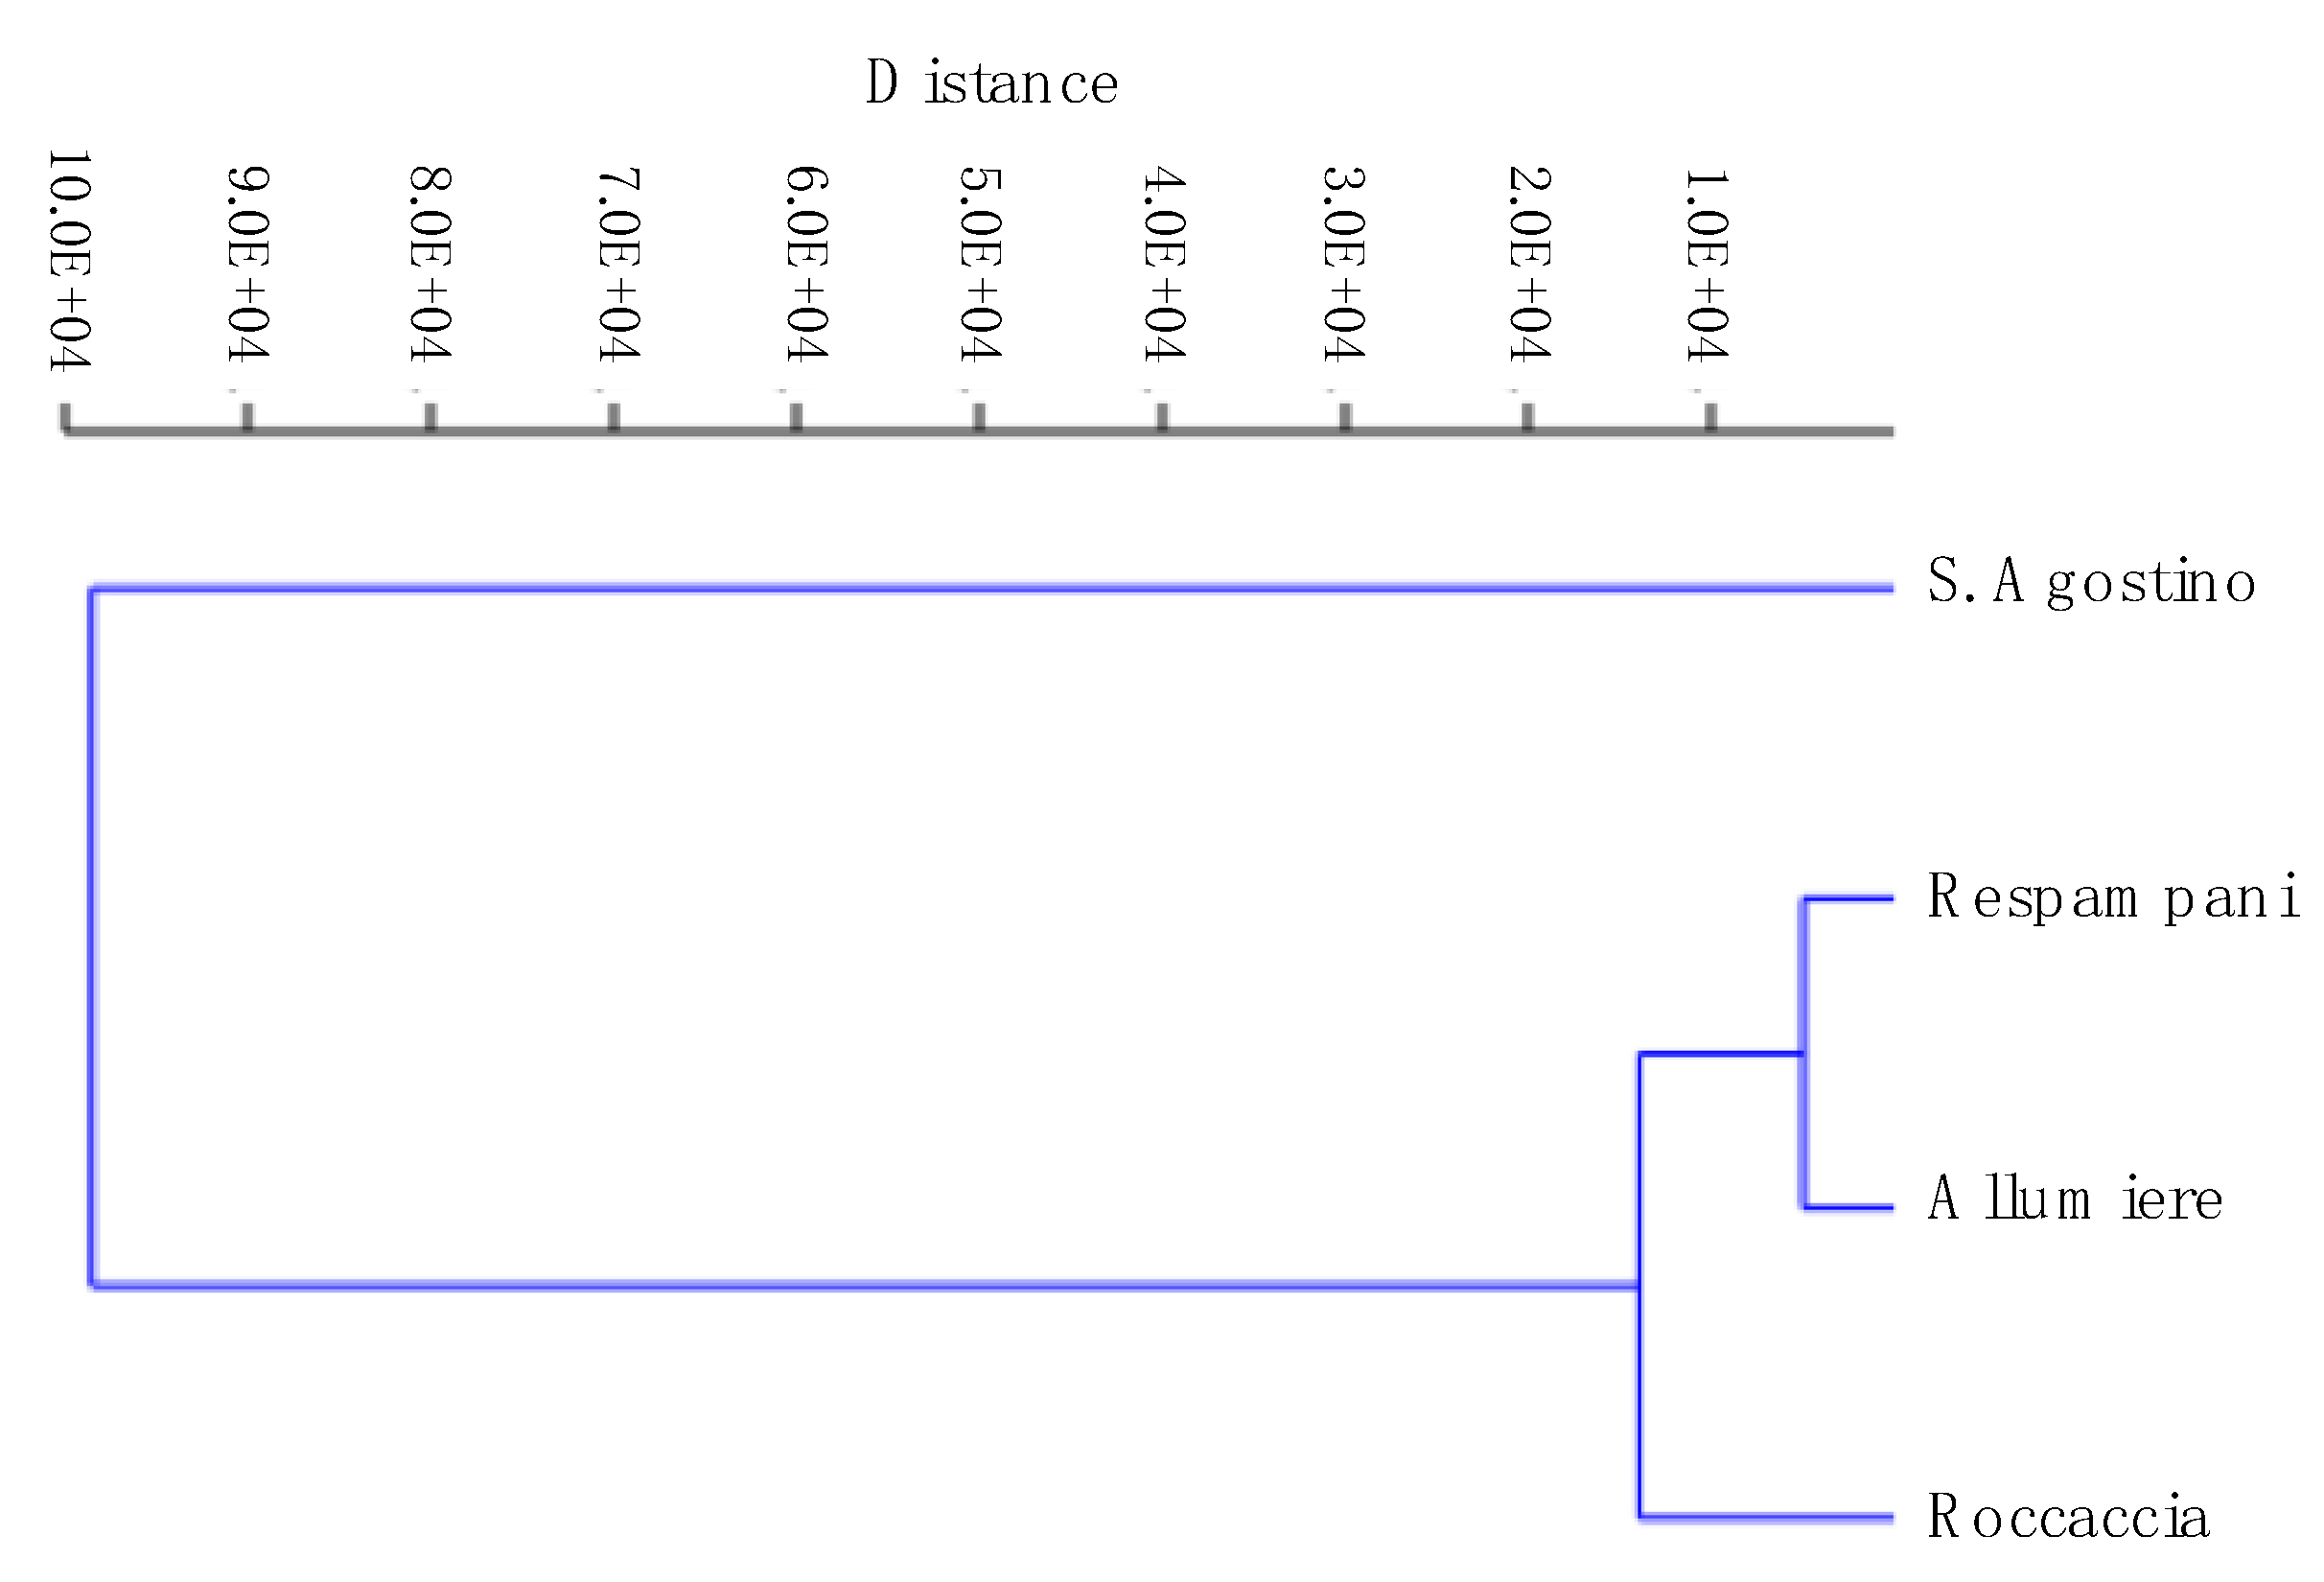
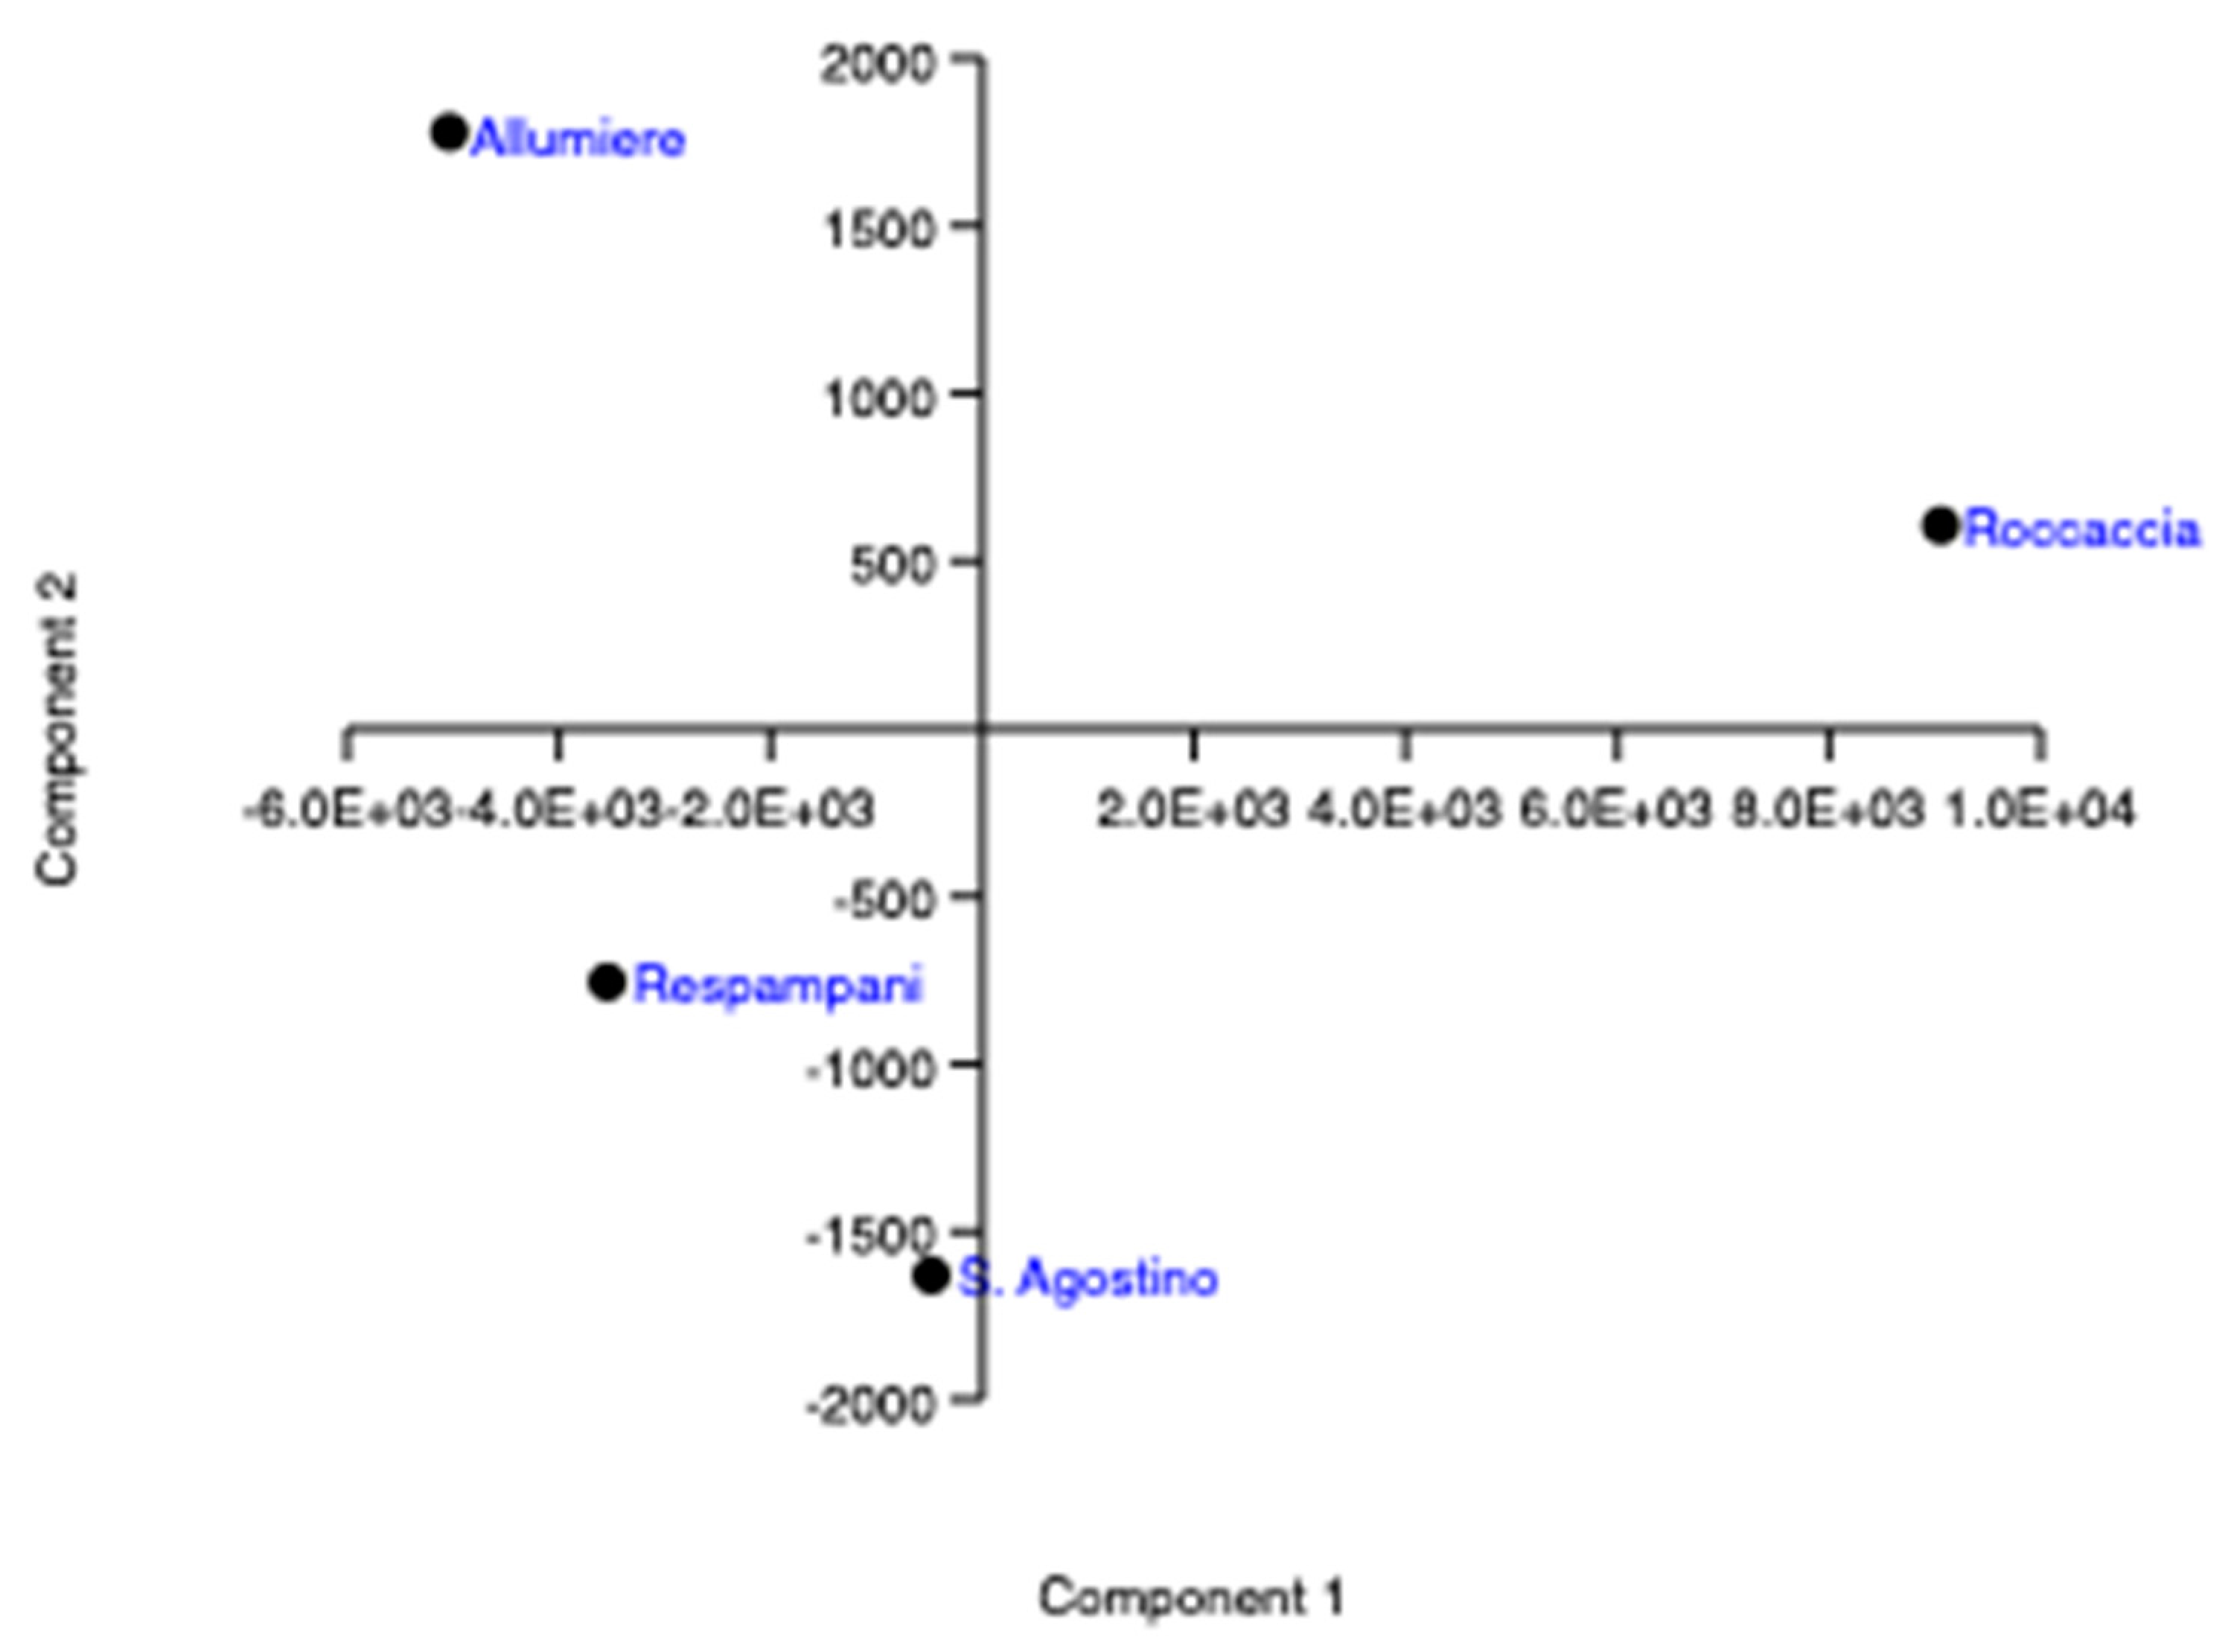
3.3. Chemometric Approach
| cluster # 1 1 compound: Sn; |
| cluster # 2 5 compounds: 118-CB, Ba, Mn, Sr, Zn; |
| cluster # 3 62 compounds: all other compounds/elements. |
4. Conclusions
Supplementary Materials
Author Contributions
Funding
Institutional Review Board Statement
Informed Consent Statement
Data Availability Statement
Acknowledgments
Conflicts of Interest
References
- Avino, P.; Manigrasso, M. Ten-year measurements of gaseous pollutants in urban air by an open-path analyzer. Atmos. Environ. 2008, 42, 4138–4148. [Google Scholar] [CrossRef]
- Costabile, F.; Alas, H.; Aufderheide, M.; Avino, P.; Amato, F.; Argentini, S.; Barnaba, F.; Berico, M.; Bernardoni, V.; Biondi, R.; et al. First Results of the “Carbonaceous Aerosol in Rome and Environs (CARE)” Experiment: Beyond Current Standards for PM10. Atmosphere 2017, 8, 249. [Google Scholar] [CrossRef]
- Manigrasso, M.; Vernale, C.; Avino, P. Traffic aerosol lobar doses deposited in the human respiratory system. Environ. Sci. Pollut. Res. 2017, 24, 13866–13873. [Google Scholar] [CrossRef] [PubMed]
- Slanina, S.; Piantaz, M.; Wyers, G.P. Deposition: From local measurements to conclusion on a European scale. In Proceedings of the EUROTRAC Symposium ‘94; Borrel, S., Ed.; SPB Academic Publishing: The Hague, The Netherlands, 1994; pp. 606–613. [Google Scholar]
- European Community. Directive 2004/107/EC of the European Parliament and of the Council of 15 December 2004 relating to arsenic, cadmium, mercury, nickel and polycyclic aromatic hydrocarbons in ambient air. Off. J. Eur. Union 2005, L23, 3–16. [Google Scholar]
- Belgium. Royal Decree of 23 April 1998 on maximum levels of dioxin in food. In force from 12 June 1998. Available online: https://ec.europa.eu/environment/archives/dioxin/pdf/dioxin.pdf (accessed on 18 February 2021).
- Germany. Bericht des Länderausschusses für Immissionsschutz (LAI), Bewertung von Schadstoffen, für die keine Immissionswerte festgelegt sind—Orientierungswerte für die Sonderfallprüfung und für die Anlagenüber-wachung sowie Zielwerte für die langfristige Luftreinhalteplanung unter besonderer Berücksichtigung der Beurteilung krebserzeugender Luftschadstoffe. Vom 21 September 2004. Available online: https://www.lanuv.nrw.de/fileadmin/lanuv/gesundheit/pdf/LAI2004.pdf (accessed on 11 February 2021).
- Jeffries, D.S.; Snyder, W.R. Atmospheric deposition of heavy metals in central Ontario. Water Air Soil Pollut. 1980, 15, 127–152. [Google Scholar] [CrossRef]
- Morrison, K.A.; Kuhn, E.S.; Watras, C.J. Comparison of three methods of estimating atmospheric mercury deposition. Environ. Sci. Technol. 1995, 29, 571–576. [Google Scholar] [CrossRef]
- Azimi, S.; Ludwig, A.; Thévenot, D.R.; Colin, J.-L. Trace metal determination in total atmospheric deposition in rural and urban areas. Sci. Total Environ. 2003, 308, 247–256. [Google Scholar] [CrossRef]
- Erisman, J.W.; Mols, H.; Fonteijn, P.; Geusebroek, M.; Draaijers, G.; Bleeker, A.; van der Veen, D. Field intercomparison of precipitation measurements performed within the framework of the Pan European Intensive Monitoring Program of EU/ICP Forest. Environ. Pollut. 2003, 125, 139–155. [Google Scholar] [CrossRef]
- Avila, A.; Rodrigo, A. Trace metal fluxes in bulk deposition, throughfall and stemflow at two evergreen oak stands in NE Spain subject to different exposure to the industrial environment. Atmos. Environ. 2004, 38, 171–180. [Google Scholar] [CrossRef]
- Aas, W.; Alleman, L.Y.; Bieber, E.; Gladtke, D.; Houdret, J.-L.; Karlsson, V.; Monies, C. Comparison of methods for measuring atmospheric deposition of arsenic, cadmium, nickel and lead. J. Environ. Monit. 2009, 11, 1276–1283. [Google Scholar] [CrossRef] [PubMed]
- Bacardit, M.; Camarero, L. Fluxes of Al, Fe, Ti, Mn, Pb, Cd, Zn, Ni, Cu, and As in monthly bulk deposition over the Pyrenees (SW Europe): The influence of meteorology on the atmospheric component of trace element cycles and its implications for high mountain lakes. J. Geophys. Res. 2009, 114, G00D02. [Google Scholar] [CrossRef]
- Gunawardena, J.; Egodawatta, P.; Ayoko, G.A.; Goonetilleke, A. Atmospheric deposition as a source of heavy metals in urban stormwater. Atmos. Environ. 2013, 68, 235–242. [Google Scholar] [CrossRef]
- Bari, M.A.; Kindzierski, W.B.; Cho, S. A wintertime investigation of atmospheric deposition of metals and polycyclic aromatic hydrocarbons in the Athabasca Oil Sands Region, Canada. Sci. Total Environ. 2014, 485–486, 180–192. [Google Scholar] [CrossRef]
- Korhonen, M.; Kiviranta, A.; Ketola, R. Bulk deposition of PAHs, PCBs and HCHs in Finland in summer seasons 1993–1996. Toxicol. Environ. Chem. 1998, 66, 37–45. [Google Scholar] [CrossRef]
- Ollivon, D.; Blanchoud, H.; Motelay-Massei, A.; Garban, B. Atmospheric deposition of PAHs to an urban site, Paris, France. Atmos. Environ. 2002, 36, 2891–2900. [Google Scholar] [CrossRef]
- Garban, B.; Blanchoud, H.; Motelay-Massei, A.; Chevreuil, M.; Ollivon, D. Atmospheric bulk deposition of PAHs onto France: Trends from urban to remote sites. Atmos. Environ. 2002, 36, 5395–5403. [Google Scholar] [CrossRef]
- Motelay-Massei, A.; Ollivon, D.; Tiphagne, K.; Garban, B. Atmospheric bulk deposition of trace metals to the Seine river Basin, France: Concentrations, sources and evolution from 1988 to 2001 in Paris. Water Air Soil Pollut. 2005, 164, 119–135. [Google Scholar] [CrossRef]
- Rossini, P.; Guerzoni, S.; Molinaroli, E.; Rampazzo, G.; De Lazzari, A.; Zancanaro, A. Atmospheric bulk deposition to the lagoon of Venice part I. Fluxes of metals, nutrients and organic contaminants. Environ. Int. 2005, 31, 959–974. [Google Scholar] [CrossRef][Green Version]
- Menichini, E.; Barbera, S.; Merli, F.; Settimo, G.; Viviano, G. Atmospheric bulk deposition of carcinogenic PAHs in a rural area in southern Italy. Polycycl. Aromat. Compd. 2006, 26, 253–263. [Google Scholar] [CrossRef]
- Moon, H.-B.; Kannan, K.; Lee, S.-J.; Ok, G. Atmospheric deposition of polycyclic aromatic hydrocarbons in an urban and a suburban area of Korea from 2002 to 2004. Arch. Environ. Contam. Toxicol. 2006, 51, 494–502. [Google Scholar] [CrossRef] [PubMed]
- Motelay-Massei, A.; Ollivon, D.; Garban, B.; Tiphagne-Larcher, K.; Zimmerlin, I.; Chevreuil, M. PAHs in the bulk atmospheric deposition of the Seine river basin: Source identification and apportionment by ratios, multivariate statistical techniques and scanning electron microscopy. Chemosphere 2007, 67, 312–321. [Google Scholar] [CrossRef]
- Rossini, P.; Matteucci, G.; Raccanelli, S.; Favotto, M.; Guerzoni, S.; Gattolin, M. Polycyclic aromatic hydrocarbons in atmospheric depositions around the Venice lagoon. Polycycl. Aromat. Compd. 2007, 27, 197–210. [Google Scholar] [CrossRef][Green Version]
- Gocht, T.; Klemm, O.; Grathwohl, P. Long-term atmospheric bulk deposition of polycyclic aromatic hydrocarbons (PAHs) in rural areas of Southern Germany. Atmos. Environ. 2007, 41, 1315–1327. [Google Scholar] [CrossRef]
- Su, Y.; Wania, F.; Harner, T.; Lei, Y.D. Deposition of polybrominated diphenyl ethers, polychlorinated biphenyls, and polycyclic aromatic hydrocarbons to a boreal deciduous forest. Environ. Sci. Technol. 2007, 41, 534–540. [Google Scholar] [CrossRef] [PubMed]
- Esen, F.; Cindoruk, S.S.; Tasdemir, Y. Bulk deposition of polycyclic aromatic hydrocarbons (PAHs) in an industrial site of Turkey. Environ. Pollut. 2008, 152, 461–467. [Google Scholar] [CrossRef]
- Wang, W.; Simonich, S.L.M.; Giri, B.; Xue, M.; Zhao, J.; Chen, S.; Shen, H.; Shen, G.; Wang, R.; Cao, J.; et al. Spatial distribution and seasonal variation of atmospheric bulk deposition of polycyclic aromatic hydrocarbons in Beijing Tianjin region, North China. Environ. Pollut. 2011, 159, 287–293. [Google Scholar] [CrossRef] [PubMed][Green Version]
- Gladtke, D.; Bakker, F.; Biaudet, H.; Brennfleck, A.; Coleman, P.; Creutznacher, H.; Van Egmond, B.F.; Hafkenscheid, T.; Hahne, F.; Houtzager, M.M.; et al. Different collector types for sampling deposition of polycyclic aromatic hydrocarbons—Comparison of measurement results and their uncertainty. J. Environ. Monit. 2012, 14, 2054–2062. [Google Scholar] [CrossRef]
- Liu, F.; Xu, Y.; Liu, J.; Liu, D.; Li, J.; Zhang, G.; Li, X.; Zou, S.; Lai, S. Atmospheric deposition of polycyclic aromatic hydrocarbons (PAHs) to a coastal site of Hong Kong, South China. Atmos. Environ. 2013, 69, 265–272. [Google Scholar] [CrossRef]
- Settimo, G.; Viviano, G. Atmospheric depositions of persistent pollutants: Methodological aspects and values from case studies. Ann. Ist. Super. Sanità 2015, 51, 298–304. [Google Scholar] [PubMed]
- Fiedler, H.; Buckley-Golder, D.; Coleman, P.; King, K.; Petersen, A. Compilation of EU dioxin exposure and health data: Environmental levels. Organohalogen Compd. 1999, 43, 141–144. [Google Scholar]
- Lee, K.-L.; Lee, W.-J.; Mwangi, J.K.; Wang, L.-C.; Gao, X.; Chang-Chien, G.-P. Atmospheric PM2.5 and depositions of polychlorinated Dibenzo-p-dioxins and dibenzofurans in Kaohsiung area, Southern Taiwan. Aerosol Air Qual. Res. 2016, 16, 1775–1791. [Google Scholar] [CrossRef]
- Ngo, T.H.; Tsou, H.H.; Chen, Y.F.; Chen, Y.W.; Chi, K.H. Sources identification of PCDD/Fs in soil and atmospheric deposition in Taiwan. Chemosphere 2018, 208, 374–381. [Google Scholar] [CrossRef] [PubMed]
- Avino, P.; Russo, M.V. A comprehensive review of analytical methods for determining persistent organic pollutants in air, soil, water and waste. Curr. Org. Chem. 2018, 22, 939–953. [Google Scholar] [CrossRef]
- Deng, Y.; Peng, P.; Jia, L.; Yin, H.; Hu, J.; Mao, W. Atmospheric bulk deposition of polychlorinated dibenzo-p-dioxins and dibenzofurans (PCDD/Fs) in the vicinity of MSWI in Shanghai, China. Ecotoxicol. Environ. Saf. 2020, 196, 110493. [Google Scholar] [CrossRef]
- Nevalainen, L.; Tuomisto, J.; Haapasaari, P.; Lehikoinen, A. Spatial aspects of the dioxin risk formation in the Baltic Sea: A systematic review. Sci. Total Environ. 2021, 753, 142185. [Google Scholar] [CrossRef]
- Fang, M.; Choi, S.-D.; Baek, S.-Y.; Jin, G.; Chang, Y.-S. Deposition of polychlorinated biphenyls and polybrominated diphenyl ethers in the vicinity of a steel manufacturing plant. Atmos. Environ. 2012, 49, 206–211. [Google Scholar] [CrossRef]
- Mangia, C.; Cervino, M. Modelling wet and dry depositions of PCDD/F releases from industrial plants in Apulia, Southern Italy. Int. J. Environ. Pollut. 2012, 48, 185–193. [Google Scholar] [CrossRef]
- Brambilla, G.; De Filippis, S.P.; Esposito, V.; Settimo, G. Dioxin like compounds bulk deposition on corn (Zea mais) and alfa alfa (Medicago sativa): Modelled levels on derived silage and hay and their relevance for dairy production. Clean Soil Air Water 2013, 41, 113–118. [Google Scholar] [CrossRef]
- Onofrio, M.; Spataro, R.; Botta, S. Deposition fluxes of PCDD/Fs in the area surrounding a steel plant in northwest Italy. Environ. Monit. Assess. 2014, 186, 3917–3929. [Google Scholar] [CrossRef]
- Rada, E.C.; Ragazzi, M.; Schiavon, M. Assessment of the local role of a steel making plant by POPs deposition measurements. Chemosphere 2014, 110, 53–61. [Google Scholar] [CrossRef]
- Chuang, K.-Y.; Lai, C.-H.; Peng, Y.-P.; Yen, T.-Y. Characteristics of particle-bound polychlorinated dibenzo-p-dioxins and dibenzofurans (PCDD/Fs) in atmosphere used in carbon black feeding process at a tire manufacturing plant. Environ. Sci. Pollut. Res. 2015, 22, 19451–19460. [Google Scholar] [CrossRef]
- Van Dijk, C.; van Doorn, W.; van Alfen, B. Long term plant biomonitoring in the vicinity of waste incinerators in The Netherlands. Chemosphere 2015, 122, 45–51. [Google Scholar] [CrossRef] [PubMed]
- European Community. Communication from the Commission to the Council, the European Parliament and the Economic and Social Committee Community—Strategy for Dioxins, Furans and Polychlorinated Biphenyls /* COM/2001/0593 final */. Off. J. Eur. Union 2001, 322, 2–18. [Google Scholar]
- European Community. Communication from the Commission to the Council, the European Parliament and the Economic and Social Committee. On Implementation of the Community Strategy for Dioxins, Furans and Polychlorinated Biphenyls (COM(2001) 593). Brussels, 13/4/2004. COM(2004) 240 Final. Available online: https://eur-lex.europa.eu/legal-content/EN/TXT/PDF/?uri=CELEX:52004DC0240&from=EN (accessed on 18 February 2021).
- European Community. Council Decision of 14 October 2004 Concerning the Conclusion, on Behalf of the European Community, of the Stockholm Convention on Persistent Organic Pollutants. Off. J. Eur. Union 2006, L209, 1–2. [Google Scholar]
- European Community. Communication from the Commission to the Council, the European Parliament and the Economic and Social Committee. On Implementation of the Community Strategy for Dioxins, Furans and Polychlorinated Biphenyls (COM(2001) 593)—Second Progress Report. Brussels, 10/7/2007. COM(2007) 396 Final. Available online: https://eur-lex.europa.eu/legal-content/EN/TXT/?uri=CELEX%3A52007DC0396 (accessed on 18 February 2021).
- Decreto Legislativo 13 agosto 2010, n.155. Attuazione della direttiva 2008/50/CE relativa alla qualità dell’aria ambiente e per un’aria più pulita in Europa. Gazz. Uff. 2010, 216 (Suppl. 217). Available online: https://www.camera.it/parlam/leggi/deleghe/testi/10155dl.htm (accessed on 18 February 2021).
- UNI EN 15980:2011. Air Quality—Determination of the Deposition of Benz[a]anthracene, Benzo[b]fluoranthene, Benzo[j]fluoranthene, Benzo[k]fluoranthene, Benzo[a]pyrene, Dibenz[a,h]anthracene and Indeno[1,2,3-cd]pyrene; UNI: Milan, Italy, 2011. [Google Scholar]
- UNI EN 15841:2009. Ambient Air Quality—Standard Method for Determination of Arsenic, Cadmium, Lead and Nickel in Atmospheric Deposition; UNI: Milan, Italy, 2010. [Google Scholar]
- UNI EN 1948-2:2006. Stationary Source Emissions—Determination of the Mass Concentration of PCDDs/PCDFs and Dioxin-Like PCBs—Part 2: Extraction and Clean-Up of PCDDs/PCDFs; UNI: Milan, Italy, 2006. [Google Scholar]
- UNI EN 1948-3:2006. Stationary Source Emissions—Determination of the Mass Concentration of PCDDs/PCDFs and Dioxin-Like PCBs—Part 3: Identification and Quantification of PCDDs/PCDFs; UNI: Milan, Italy, 2006. [Google Scholar]
- UNI EN 1948-4:2010+A1:2013. Stationary Source Emissions—Determination of the Mass Concentration of PCDDs/PCDFs and Dioxin-Like PCBs—Part 4: Sampling and Analysis of Dioxin-Like PCBs; UNI: Milan, Italy, 2006. [Google Scholar]
- Agenzia Regionale per la Prevenzione e la Protezione dell’Ambiente Valle d’Aosta (ARPAVDA). Risultati della Campagna di Monitoraggio delle Deposizioni Atmosferiche Totali Condotta nel Periodo Giugno 2006–Luglio 2007; ARPA VDA, Air Laboratory: Saint-Christophe, Italy, 2008; Available online: https://www.arpa.vda.it/images/stories/ARPA/aria/datiQA/deposimetri/relazione_deposimetri_2006_2007.pdf (accessed on 10 January 2021).
- Turrio-Baldassarri, L.; Battistelli, C.A.; di Domenico, A.; Iamiceli, A.L.; Iacovella, N.; Mazzoli, P.; Settimo, G.; Viviano, G. A study on PCDD and PCDF contamination in a case of public concern. Organohalogen Compd. 2002, 59, 181–184. [Google Scholar]
- Agenzia Regionale per la Prevenzione e la Protezione dell’Ambiente Umbria (ARPA Umbria). Ricerca Diossine e PCB. Attività svolta da Arpa nel Periodo 2003–2010. Available online: http://www.arpa.umbria.it/resources/documenti/aria/RICERCA%20DIOSSINE.pdf (accessed on 8 January 2021).
- Agenzia Regionale per la Prevenzione e la Protezione dell’Ambiente Puglia (ARPA Puglia). Il Monitoraggio della Qualità dell’Aria Taranto; Aggiornamento all’Anno 2019 (2008–2019); ARPA Puglia, Dap Taranto Servizi Territoriali Polo Microinquinanti Organici: Taranto, Italy, 2019; Available online: http://www.arpa.puglia.it/c/document_library/get_file?uuid=5e6a8e07-73ce-41d5-84c3-f6400a5bdea6&groupId=13883 (accessed on 8 January 2021).
- Bove, B.; Cattani, G.; Cusano, M.C.; De Luca, S.; Dellatte, E.; di Domenico, A.; Fochi, I.; Fulgenzi, A.R.; Iacovella, N.; Inglessis, M.; et al. PCDD, PCDF, and PCB baseline levels in air near a waste incineration plant site in southern Italy. Organohalogen Compd. 2005, 67, 2083–2085. [Google Scholar]
- Desmedt, M.; Roekens, E. New policy in Flanders to link environmental levels of PCDD/F and dioxin-like PCBs to health. Organohalogen Compd. 2011, 73, 2042–2045. [Google Scholar]
- Landesanstalt für Umweltschutz Baden-Württemberg. Literaturstudie zur Ermittlung des Depositionswertes von Dioxinen, Furanen und Dioxinähnlichen PCB; Landesanstalt für Umweltschutz Baden-Württemberg: Karlsruhe, Germany, 2004; Available online: http://www4.lubw.baden-wuerttemberg.de/servlet/is/14558/ (accessed on 27 December 2020).
- Kirchner, M.; Freie, K.P.; Denner, M.; Ratz, G.; Jakobi, G.; Korner, W.; Ludewig, E.; Schaub, M.; Schramm, K.-W.; Weiss, P.; et al. Air concentrations and deposition of chlorinated dioxins and furans (PCDD/F) at three high alpine monitoring stations: Trends and dependence on air masses. Atmos. Environ. 2020, 223, 117199. [Google Scholar] [CrossRef]
- Vikelsoe, J.; Hovmand, M.; Andersen, H.V. PCDD/F in deposition, spruce throughfall and air in Denmark. Organohalogen Compd. 2003, 61, 454–457. [Google Scholar]
- Oxbol, A.; Schleicher, O.; Fuglsang, K.; Jensen, A.A.; Borg-Jensen, K.; Schilling, B. Dioxin deposition around a danish municipal incinerator. Organohalogen Compd. 2002, 57, 369–372. [Google Scholar]
- Air Rhône-Alpes. Programme de Suirvaillance des Dioxines, Furanes, & Metaux Lourds. 2015. Available online: https://www.atmo-auvergnerhonealpes.fr/sites/ra/files/atoms/files/surveillance_dioxines_metaux_lourds-synthese_2013-2014.pdf (accessed on 10 January 2021).
- Soggiu, M.E.; Inglessis, M.; Gagliardi, R.V.; Settimo, G.; Marsili, G.; Notardonato, I.; Avino, P. PM10 and PM2.5 qualitative source apportionment using selective wind direction sampling in a port-industrial area in Civitavecchia, Italy. Atmosphere 2020, 11, 94. [Google Scholar] [CrossRef]
- Alam, M.S.; Keyte, I.J.; Yin, J.; Stark, C.; Jones, A.M.; Harrison, R.M. Diurnal variability of polycyclic aromatic compound (PAC) concentrations: Relationship with meteorological conditions and inferred sources. Atmos. Environ. 2015, 122, 427–438. [Google Scholar] [CrossRef]
- IARC. Overall Evaluations of Carcinogenicity: An Updating of IARC Monographs Volumes 1 to 42; IARC Monographs on the Evaluation of Carcinogenic Risks to Humans, Supplement 7; International Agency for Research on Cancer: Lyon, France, 1987. [Google Scholar]
- WHO. Air Quality Guidelines for Europe, European Series No. 91, 2nd ed.; World Health Organization, Regional Office for Europe: Copenhagen, Denmark, 2000. [Google Scholar]
- Manoli, E.; Samara, C.; Kostantinou, I.; Albanis, T. Polycyclic aromatic hydrocarbons in the bulk precipitation and surface waters of Northern Greece. Chemosphere 2000, 41, 1845–1855. [Google Scholar] [CrossRef]
- Arellano, L.; Fernández, P.; van Drooge, L.B.; Rose, N.L.; Nickus, U.; Thies, H.; Stuchlík, E.; Camarero, L.; Catalan, J.; Grimalt, J.O. Drivers of atmospheric deposition of polycyclic aromatic hydrocarbons at European high-altitude sites. Atmos. Chem. Phys. 2018, 18, 16081–16097. [Google Scholar] [CrossRef]
- Agenzia Regionale per la Prevenzione e la Protezione dell’Ambiente Valle d’Aosta (ARPAVDA). Monitoraggio delle Deposizioni Atmosferiche—Periodo 2010; ARPA VDA, Air Laboratory: Saint-Christophe, Italy, 2010; Available online: https://www.arpa.vda.it/images/stories/ARPA/aria/datiQA/deposimetri/relazione_deposimetri_2010.pdf (accessed on 10 January 2021).
- Agenzia Regionale per la Prevenzione e la Protezione dell’Ambiente Umbria (ARPA Umbria). Qualità dell’Aria in Umbria: Valutazioni e Analisi di Microinquinanti; ARPA Umbria: Terni, Italy, 2015; Available online: https://www.arpa.umbria.it/MC-API/Risorse/StreamRisorsa.aspx?guid=6497cd9c-7cfa-4e82-85cf-e30d0c6fbfec (accessed on 8 January 2021).
- OSPAR Commission. Pilot Study and Intercomparison Exercise on Atmospheric Inputs of PAHs. Available online: https://www.ospar.org/documents?v=6925 (accessed on 18 February 2021).
- European Communities. Ambient Air Pollution by As, Cd and Ni Compounds; Position Paper. Prepared by the Working Group on As, Cd and Ni compounds; Office for Official Publications of the European Communities: Luxembourg, 2001; Available online: http://europa.eu.int/comm/environment/air/pdf/pp_as_cd_ni.pdf (accessed on 12 October 2020).
- Avino, P.; Capannesi, G.; Rosada, A. Ultra-trace nutritional and toxicological elements in Rome and Florence drinking waters determined by Instrumental Neutron Activation Analysis. Microchem. J. 2011, 97, 144–153. [Google Scholar] [CrossRef]
- Avino, P.; Capannesi, G.; Renzi, L.; Rosada, A. Instrumental neutron activation analysis and statistical approach for determining baseline values of essential and toxic elements in hairs of high school students. Ecotoxicol. Environ. Saf. 2013, 92, 206–214. [Google Scholar] [CrossRef] [PubMed]
- Settimo, G.; Soggiu, M.E.; Inglessis, M.; Manigrasso, M.; Avino, P. Submicron and ultrafine particles in downtown Rome: How the different euro engines have influenced their behavior for two decades. Atmosphere 2020, 11, 894. [Google Scholar] [CrossRef]


| Dust 1 | As 2 | Cd 2 | Hg 2 | Ni 2 | Pb 2 | Tl 2 | Zn 2 | PCDD/Fs + DL-PCBs | ||
|---|---|---|---|---|---|---|---|---|---|---|
| Monthly 3 | Annual 3 | |||||||||
| Austria | 210 | -- | 2 | -- | -- | 100 | -- | -- | - | - |
| Belgium | 350 | -- | 2 | -- | -- | 250 | -- | -- | 21 | 8.2 |
| Croatia | 350 | 4 | 2 | 1 | 15 | 100 | 2 | -- | ||
| Germany | 350 | 4 | 2 | 1 | 15 | 100 | 2 | -- | - | 4 |
| UK | 200 | -- | -- | -- | -- | -- | -- | -- | - | - |
| Switzerland | 200 | -- | 2 | -- | -- | 100 | 2 | 400 | - | - |
| Slovenia | 200 | -- | 2 | -- | -- | 100 | -- | 400 | - | - |
| Season | Roccaccia | S. Agostino | Allumiere | Rocca Resp. |
|---|---|---|---|---|
| Annual | 21.5 | 35.8 | 18.8 | 27.9 |
| Season | Roccaccia | S. Agostino | Allumiere | Rocca Resp. |
|---|---|---|---|---|
| Summer | 14.1 | 0.33 | 0.39 | 1.04 |
| Autumn | 0.90 | 2.70 | 0.29 | 0.82 |
| Winter | 0.53 | 0.33 | 0.59 | 0.27 |
| Spring | 0.19 | 0.21 | 0.14 | 0.16 |
| Annual average | 3.93 | 0.89 | 0.35 | 0.57 |
| Congener | Roccaccia | Rocca Respampani | Allumiere | S. Agostino | ||||
|---|---|---|---|---|---|---|---|---|
| fg m−2d−1 | WHO-TE1998 | fg m−2d−1 | WHO-TE1998 | fg m−2d−1 | WHO-TE1998 | fg m−2d−1 | WHO-TE1998 | |
| 2,3,7,8-TCDD | 38.0 | 38.0 | 15.4 | 15.4 | 15.4 | 15.4 | 24.8 | 24.8 |
| 1,2,3,7,8-PCDD | 509 | 509 | 15.4 | 15.4 | 29.1 | 29.1 | 15.4 | 15.4 |
| 1,2,3,4,7,8-HxCDD | 399 | 39.9 | 15.4 | 1.54 | 22.1 | 2.21 | 15.4 | 1.54 |
| 1,2,3,6,7,8-HxCDD | 609 | 60.6 | 36.5 | 3.65 | 31.4 | 3.14 | 38.2 | 3.82 |
| 1,2,3,7,8,9-HxCDD | 218 | 21.7 | 27.8 | 2.78 | 46.3 | 4.62 | 15.4 | 1.54 |
| 1,2,3,4,6,7,8-HpCDD | 8513 | 85.1 | 417 | 4.17 | 498 | 4.98 | 489 | 4.89 |
| OCDD | 137.09 | 13.7 | 4023 | 0.402 | 5533 | 0.552 | 5630 | 0.565 |
| 2,3,7,8-TCDF | 419 | 41.9 | 119 | 11.9 | 134 | 13.4 | 99.2 | 9.92 |
| 1,2,3,7,8-PCDF | 810 | 40.5 | 67.3 | 3.36 | 76.1 | 3.81 | 45.8 | 2.29 |
| 2,3,4,7,8-PCDF | 1033 | 516 | 69.7 | 34.9 | 96.4 | 48.2 | 44.2 | 22.1 |
| 1,2,3,4,7,8-HxCDF | 1173 | 117 | 72.9 | 7.29 | 155 | 15.6 | 64.6 | 6.46 |
| 1,2,3,6,7,8-HxCDF | 1199 | 119 | 71.0 | 7.10 | 95.1 | 9.51 | 62.0 | 6.2 |
| 2,3,4,6,7,8-HxCDF | 637 | 63.7 | 84.7 | 8.48 | 140 | 14.0 | 75.3 | 7.53 |
| 1,2,3,7,8,9-HxCDF | 27.2 | 2.72 | 29.9 | 2.99 | 34.5 | 3.45 | 15.4 | 1.54 |
| 1,2,3,4,6,7,8-HpCDF | 2231 | 22.3 | 245 | 2.45 | 768 | 7.69 | 283.9 | 2.84 |
| 1,2,3,4,7,8,9-HpCDF | 49.2 | 0.492 | 27.0 | 0.270 | 48.9 | 0.487 | 24.5 | 0.245 |
| OCDF | 2899 | 0.287 | 1155 | 0.117 | 1222 | 0.122 | 690 | 0.0675 |
| Total | 158,072 | 1694 | 6493 | 122 | 8947 | 207 | 7634 | 112 |
| 77-CB | 127,165 | 12.7 | 25,277 | 2.53 | 12,750 | 176 | 44,216 | 4.42 |
| 81-CB | 3814 | 0.382 | 765 | 0.078 | 12,750 | 1.27 | 44,216 | 0.240 |
| 105-CB | 3,9632,69 | 396 | 652,429 | 65.2 | 445 | 0.045 | 2405 | 116 |
| 114-CB | 336,172 | 168 | 52,101 | 26.0 | 301,770 | 30.2 | 1,169,450 | 53.9 |
| 118-CB | 1,399,6455 | 1399 | 2,265,709 | 227 | 9780 | 4.89 | 10,7856 | 487 |
| 123-CB | 1,145,574 | 114 | 890,431 | 89.0 | 954,798 | 95.5 | 4,873,182 | 29.5 |
| 126-CB | 893 | 89.3 | 154 | 15.4 | 48,220 | 4.82 | 294,745 | 47.405 |
| 156-CB | 108,006 | 54.0 | 46,223 | 23.1 | 154 | 15.4 | 474 | 28.3 |
| 157-CB | 1443 | 0.722 | 769 | 0.385 | 46,336 | 23.2 | 56,507 | 0.697 |
| 167-CB | 48,895 | 0.488 | 14,061 | 0.140 | 1088 | 0.545 | 1396 | 0.222 |
| 169-CB | 280 | 2.80 | 154 | 1.53 | 12,630 | 0.125 | 22,097 | 2.96 |
| 189-CB | 1568 | 0.155 | 769 | 0.077 | 154 | 1.54 | 296 | 0.167 |
| Total | 19,733,537 | 2239 | 3,948,844 | 450 | 1159 | 0.117 | 1669 | 772 |
| Locations | PCDD/Fs | Ref. |
|---|---|---|
| Aosta (North-West Italy) | urban sites: 0.6–3.0 industrial sites: 3.7 | [56] |
| Venice (North-East Italy) | urban sites: 13–200 industrial sites: 15–2767 | [21] |
| Mantua a (North Italy) | urban site: 1.2–4.2 industrial site: 1.3–5.1 rural area: 1.3–2.7 | [57] |
| Stroncone‑Terni (Central Italy) | urban site: <5.0 | [58] |
| Taranto (South Italy) | industrial site: 0.57–45 rural sites: 1.6–33 | [59] |
| Melfia (South Italy) | industrial site: 1.7–2.1 rural area: 1.2–2.7 | [32,60] |
| Belgium | urban site: <1–12 rural area: <1–3.1 | [61] |
| Germany | urban site: <0.5–464 rural area:7–17 | [62,63] |
| UK | urban site: <1–312 rural area: 0–517 | [33] |
| Denmark | urban site: 300–31,600 rural area: 300–1700 | [64,65] |
| France | urban site: 100–147 rural area: 20–50 | [66] |
| North Latium (Central Italy) | urban site: 1.4–7.1 industrial site: 1.4–4.6 rural area: 1.4–3.9 | This study |
| Compound | Roccaccia | Rocca Respampani | Allumiere | S. Agostino |
|---|---|---|---|---|
| Benz[a]Anthracene | 3.593 | 4.515 | 6.268 | 2.510 |
| Benzo[b]Fluoranthene | 4.760 | 100.493 | 6.320 | 2.587 |
| Benzo[j]Fluoranthene | 4.995 | 1.538 | 3.403 | 1.538 |
| Benzo[k]Fluoranthene | 3.763 | 1.538 | 3.190 | 3.325 |
| Benzo[a]Pyrene | 5.873 | 2.325 | 3.950 | 2.165 |
| Dibenzo[a,h]Anthracene | 1.553 | 1.538 | 1.538 | 1.538 |
| Dibenzo[a,e]Pyrene | 2.073 | 1.538 | 1.538 | 1.538 |
| Dibenzo[a,h]Pyrene | 1.553 | 1.538 | 1.538 | 1.538 |
| Dibenzo[a,i]Pyrene | 2.323 | 1.538 | 1.538 | 1.538 |
| Dibenzo[a,l]Pyrene | 1.553 | 1.538 | 1.538 | 1.538 |
| Indeno[1,2,3-cd]Pyrene | 4.853 | 1.538 | 2.428 | 1.538 |
| Acenaphthene | 34.663 | 7.178 | 212.348 | 11.710 |
| Acenaphthylene | 36.023 | 9.028 | 18.228 | 16.213 |
| Anthracene | 13.465 | 10.295 | 7.953 | 6.145 |
| Benzo[g,h,i]Perilene | 5.670 | 1.538 | 4.695 | 1.538 |
| Crysene | 6.228 | 4.193 | 9.175 | 4.065 |
| Phenanthrene | 103.723 | 77.238 | 72.873 | 51.878 |
| Fluoranthene | 14.000 | 8.473 | 15.990 | 10.693 |
| Fluorene | 84.898 | 78.830 | 88.820 | 47.730 |
| Naphthalene | 164.510 | 67.385 | 103.665 | 68.620 |
| Pyrene | 11.433 | 7.058 | 15.128 | 7.745 |
| Total PAHs | 511.498 | 390.853 | 582.118 | 247.690 |
| Locations | Benzo[a]Pyrene | Ref. |
|---|---|---|
| Aosta (North-West Italy) | urban site: 28 reference site: 5.0 | [57,73] |
| Venice (North-East Italy) | urban site: 30 rural area: 6–9 | [21] |
| Perugia (Central Italy) | urban site: 5.0-14 | [74] |
| Terni (Central Italy) | urban sites: 10–11 industrial sites: 18–27 | [74] |
| Melfi (South Italy) | urban sites: 3.2–4.1 industrial sites: 4.6–6.9 rural site: 140 remote/reference sites: 1.9–5.7 | [22,32] |
| Taranto (South Italy) | urban sites: 2.0–182 industrial site: 57–555 rural area: 5.6–42 | [59] |
| Finlanda | remote sites: 51–280 rural area: 2–10 | [17] |
| Rorvik (Sweden) | rural area: 5–17 | [75] |
| Paris (France) | urban site: 25 | [18,19] |
| Cardiff, Manchester a (UK) | urban area: 219–300 | [33] |
| North Latium (Central Italy) | urban site: 1.4–7.1 industrial site: 1.4–4.6 rural area: 1.4–3.9 | This study |
| Metals | Roccaccia | Rocca Resp. | Allumiere | S. Agostino |
|---|---|---|---|---|
| As | 0.073 | 0.084 | 0.441 | 0.409 |
| Ba | 1.470 | 2.947 | 4.583 | 1.541 |
| Be | 0.009 | 0.037 | 0.016 | 0.012 |
| Cd | 0.013 | 0.009 | 0.020 | 0.072 |
| Co | 0.083 | 0.092 | 0.105 | 0.082 |
| Cr | 0.452 | 0.435 | 0.758 | 0.588 |
| Cu | 0.858 | 0.550 | 0.751 | 0.869 |
| Mn 1 | 4.773 | 3.266 | 3.581 | 3.034 |
| Ni | 0.394 | 0.300 | 0.470 | 0.479 |
| Pb | 1.105 | 1.452 | 0.921 | 2.553 |
| Sb | 0.024 | 0.042 | 0.059 | 0.048 |
| Se | 0.025 | 0.025 | 0.025 | 0.027 |
| Sn | 12.881 | 14.402 | 17.955 | 113.356 |
| Sr 1 | 1.519 | 2.998 | 3.534 | 1.592 |
| Tl | 0.006 | 0.016 | 0.015 | 0.006 |
| Te 1 | 0.001 | 0.001 | 0.001 | 0.001 |
| Ti 1 | 1.227 | 2.181 | 1.327 | 1.292 |
| V | 0.375 | 0.487 | 0.592 | 0.531 |
| Zn | 6.174 | 3.846 | 6.115 | 5.449 |
| Total | 31.460 | 33.168 | 41.265 | 131.941 |
| Metals | Type of Area | ||
|---|---|---|---|
| Rural | Urban | Industrial | |
| As | 0.082–0.43 | 0.22–3.4 | 2.0–4.3 |
| Cd | 0.011–0.14 | 0.16–0.90 | 0.12–4.6 |
| Ni | 0.03–4.3 | 5–11 | 2.3–22 |
Publisher’s Note: MDPI stays neutral with regard to jurisdictional claims in published maps and institutional affiliations. |
© 2021 by the authors. Licensee MDPI, Basel, Switzerland. This article is an open access article distributed under the terms and conditions of the Creative Commons Attribution (CC BY) license (http://creativecommons.org/licenses/by/4.0/).
Share and Cite
Settimo, G.; Soggiu, M.E.; Inglessis, M.; Marsili, G.; Avino, P. Persistent Organic Pollutants and Metals in Atmospheric Deposition Rates around the Port-Industrial Area of Civitavecchia, Italy. Appl. Sci. 2021, 11, 1827. https://doi.org/10.3390/app11041827
Settimo G, Soggiu ME, Inglessis M, Marsili G, Avino P. Persistent Organic Pollutants and Metals in Atmospheric Deposition Rates around the Port-Industrial Area of Civitavecchia, Italy. Applied Sciences. 2021; 11(4):1827. https://doi.org/10.3390/app11041827
Chicago/Turabian StyleSettimo, Gaetano, Maria Eleonora Soggiu, Marco Inglessis, Giovanni Marsili, and Pasquale Avino. 2021. "Persistent Organic Pollutants and Metals in Atmospheric Deposition Rates around the Port-Industrial Area of Civitavecchia, Italy" Applied Sciences 11, no. 4: 1827. https://doi.org/10.3390/app11041827
APA StyleSettimo, G., Soggiu, M. E., Inglessis, M., Marsili, G., & Avino, P. (2021). Persistent Organic Pollutants and Metals in Atmospheric Deposition Rates around the Port-Industrial Area of Civitavecchia, Italy. Applied Sciences, 11(4), 1827. https://doi.org/10.3390/app11041827