Abstract
Contact curvature plays a pivotal role in the Young’s modulus determination and mechanical response of a particle. This paper presents the sensitivity analysis of a particle morphology to contact curvature and its influence on the Young’s modulus determination during the elastic deformation of a particle. X-ray computed micro-tomography (μCT) was conducted to obtain the prototype of a single particle. The digital information of the scanned particle, including 2D slices and 3D rendering was processed and the variation of contact curvature of the particle was examined using the circular (spherical at 3D) and polynomial fitting methods. The fitting sections of the particle are taken into account. The effect of contact curvature on Young’s modulus determination was investigated and it was found that Young’s modulus changed substantially from global fitting to local fitting. Young’s modulus is highly related to the surface roundness, which exerts a significant influence on the determination of Young’s modulus.
1. Introduction
Contact curvature is a critical parameter in particle mechanical response based on Hertz’s contact theory. In particular, contact curvature plays a pivotal role in the measurement of Young’s modulus, which is an indispensable input parameter in the discrete element method (DEM) for modelling particle–particle and particle–equipment interactions [1]. The significance of particle shape in DEM has been studied by McDowell et al. [2] and Gao et al. [3]. This is because non-spherical particles are more diverse than spherical particles in nature and industries, which results in additional intricate features such as complicated contact force and secondary motion [4]. Over the past decades particle morphology and its influence on the mechanical properties of particulate materials such as Young’s modulus have been vastly studied. Using a lower Young’s modulus is a common practice to speed up the simulation in DEM. The reduction of Young’s modulus in DEM simulation has been studied in various applications. For example, a study of Young’s modulus in the range 0.0001–0.01 of the real value was carried out in the mixing of particles in a rotary drum [5]. It showed that Young’s modulus has a significant effect on the motion of individual particles during collision. However, little effect was found in the mixing of a granular bed which is the cumulative effect of all individual particles’ motion. The effect of Young’s modulus in DEM simulation of particulate systems has been specifically investigated by several researchers. The DEM simulation of flow behaviour for the discharging particles implies that a reduction in Young’s modulus can speed up the DEM simulations without altering the bulk flow behaviour [6]. The three reference values of Young’s modulus are varied at 0.02, 2.0 and 200 GPa. The corresponding time step is 5 × 10⁻⁶ s, 5 × 10⁻⁷ s, and 5 × 10⁻⁸ s, leading to the computation time as ~0.5, ~3 and 240 h, accordingly. It was further reported that the input value of Young’s modulus ranging from 107 to 1011 has negligible effect on the repose angle measurement. However, in the cases of compression and penetration, the reduction of Young’s modulus should be cautioned with regards to bulk stiffness and bulk restitution. Complex imaging-based methods were proposed to quantitatively describe particle morphology and texture [7,8,9]. Clayton and Heymann showed that particle shape can impose a significant impact on stiffness [10]. The influence of geometrical properties of constituent grains on the overall granular material response was experimentally examined [11]. It was found that the threshold force where Hertzian behaviour takes over is dependent on topographical feature of the particle including size, roundness and roughness. Moreover, the influence of particle shape was much more pronounced than the influence of surface roughness in the macro-scale compression tests. Young’s modulus of particle is routinely determined using Hertz’s equation [12], in which the averaging method of principal curvature is adopted regardless of the true profile of the particle. Given a natural particle with imperfect roundness, it will be problematic to choose the averaging radius as the equivalent radius. Furthermore, the effect of particle roundness on elastic stiffness should not be negligible especially when sphericity of a particle exceeds a tolerance level. Interestingly, few literatures are available to demonstrate the effect of contact curvature on the determination of elastic modulus even though the importance of particle shape has been recognized by the aforementioned studies.
Although numerous experimental devices have been developed to measure the Young’s modulus of a particle [13,14,15,16], the measurement of contact curvature is scarce for non-spherical particles. As a consequence, the influence of contact curvature on Young’s modulus determination remains elusive. Notable attempts to clarify the influence of contact curvature are found in the work of Armstrong et al. [17] and Chung [18]. Armstrong et al. chose a voxel-based approach to form a Hessian matrix by calculating the image gradient and the tangential derivative vectors and the 2nd order partial-derivatives. Chung proposed a method to measure the radii of curvature using a 3D scanner subject to a rigid platen compression test [18]. The common ground of their work is to compute the principal curvature which is directly related to the measurement of Young’s modulus. Details of principal curvature computation and how it is derived with principal curvature will be expanded below. However, the evaluation of contact curvature is still not fully established due to the lack of comparative analysis of contact curvature measurement by different methods. In light of the aforementioned drawbacks, this paper presents the comparative analysis to measure the contact curvature using circular and polynomial fitting methods in 2D pixel-based and 3D voxel-based approaches. The methods to determine Young’s modulus in the literature are first briefly described, indicating the defect of the existing methods due to the ignorance of particle morphology. In order to tackle this shortcoming, X-ray micro-computed tomography is conducted to build the particle profile based on the digital information of tomography. The fitting section in the particle profile is varied to examine its influence on principal curvature and Young’s modulus measurement.
2. Young’s Modulus Measurement
Before proceeding, the methods to determine Young’s modulus of a single particle are first briefed in the literature as a prelude to interpret the interlink between contact curvature and Young’s modulus. The first method is using single particle compression test to determine the elastic modulus. The force-displacement curve of a particle subject to uniaxial compression is employed to observe the elastic and elastic-plastic deformation until rupture. A typical deformation curve is shown in Figure 1. At near-zero stress and strain, the stress–strain curve is linear and theoretically follows the Hertz contact model until the yield point, which tops the boundary of elastic deformation. After that, the slope of the force-displacement curve decreases with the embarkation on the elastic-plastic deformation. The elastic modulus of a particle in a diametric compression can be determined following the equation below:
where F is the applied force; d and ∆ are the particle diameter and total displacement, respectively; E* is the effective modulus of elastic modulus of the particle and it further gives:
where and υ are the Young’s modulus and Poisson’s ratio of the particle, respectively. Examples of determining Young’s modulus by this method can be extensively found in [1,19].

Figure 1.
A typical force-displacement curve to determine particle elastic modulus.
Alternatively, nanoindentation where the diamond tip is placed against the particle surface by generating minute indentation depth can be adopted to determine the elastic modulus of a particle. In a complete cycle of indentation test shown in Figure 2, the force-displacement is composed of loading and unloading stages. The data from the unloading stage are used for analysis as only the elastic displacement is recovered. As a result, this method is not applicable to particles where plasticity reverses during unloading. However, studies from finite element simulations indicate that reverse plastic deformation is negligible over the unloading stage [16]. Note that the most commonly used tip is the Berkovich indenter having a three-sided pyramid with a half-angle of 65.3°. The superiority of Berkovich indenter over other indenters such as the four-sided Vickers indenter is the easier generation of a sharp tip, resulting in more attainable results at lower loading conditions [20]. The equation to compute the elastic modulus by nanoindentation can be expressed:
where is the reduced Young’s modulus; and denote the unloading stiffness and the projected area of indentation, respectively.
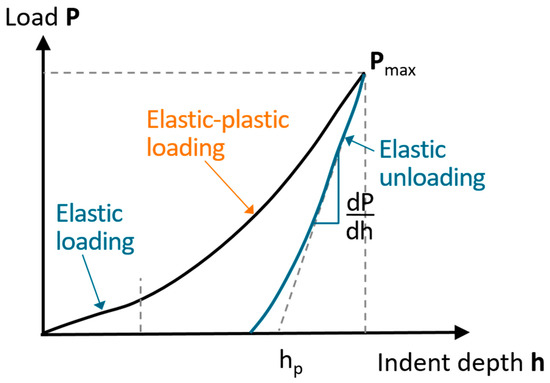
Figure 2.
A typical loading curve from nanoindentation to measure Young’s modulus. (Modified from [14,20]).
However, it has been noted that the indentation method is not suitable for particles that are not sufficiently flat. The unsuitability of this method results from the slipping and bending of indenter when the particle is not reasonably flat in the contact region. As a result, a vertical compression test of the irregularly shaped particle between two rigid platens is proposed with the aid from the 3D laser scanning technique. This improved method to measure the Young’s modulus was developed by capturing the three-dimensional surface geometry of individual granule. A pair of orthogonal planes intersecting at the contact point is shown in Figure 3, where the curvature of the mutually perpendicular planes can be computed from the scanned data. The measured Young’s modulus of a corn granule based on the proposed method was found to differ significantly from the indentation test because of the imperfect roundness.
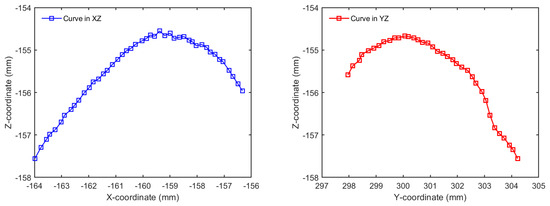
Figure 3.
Digital profile of a corn granule with orthogonal XZ and YZ planes (modified from [18]).
Whilst these three methods have been used in the determination of Young’s modulus, it has been observed that there is a large scatter of the Young’s modulus even for the same supplier of particles with a narrow size regime [21,22]. Despite some plausible reasons to interrogate the scatter, the lack of consideration on the particle morphology can impose potential uncertainty on the value of Young’s modulus. In recognition of the potential significance of particle morphology and its overlooked study in the literature, the following actions are taken for deterministic evaluation of contact curvature with its influence on the particle Young’s modulus by means of X-ray μCT.
3. Contact Curvature Theories
3.1. The Hertz Contact Theory
Hertz pioneered the contact mechanics by investigating the contact of two elastic isotropic solids [12]. He considered geometrical effects on local elastic deformation properties but neglected surface interactions. The radius of elastic contact in [12] is given:
where R* and are the effective radius and effective modulus of elasticity, respectively, and F is the contact force.
The depth of indentation δ gives:
The relationship between the contact force and the maximum pressure is [23]:
where is the radius of a circular contact area and is the contact pressure:
It shows that the maximum contact pressure is 1.5 times the mean pressure p on the elastic contact area Ace. The effective radius R* of both solids is given by
where R1 and R2 are the radius of the principal curvatures of two solids before flattening, and E* the effective modulus of elasticity [24]:
where and are Poisson’s ratio of the two solids, and and are the elastic moduli of the two solids.
In the case of a particle under compression by two parallel platens, the equation for calculating the modulus of elasticity, based on the Hertz contact stress, is expressed as [25]:
where and denote the Young’s modulus and indentation displacement, respectively, and and F are Poisson’s ratio and applied force, respectively. and , and and are the radii of principal curvature at the corresponding points of contact, respectively. The sketch of two particles under contact is schematically shown in Figure 4.

Figure 4.
Schematic of two contacting particles with different radii of curvature.
The constants and in Equation (10) are determined by cosθ. The values of and give inverse correlation with ; the variation between and is given elsewhere [25] and is calculated from the following formula:
3.2. Euler’s Theorem
In the field of differential geometry, the Euler’s theorem is a result of the curvature of curves on a surface [26]. For each point p on a surface, there exist two such particular directions. They are mutually perpendicular and the curvatures and of the normal sections in these directions are the minimum and maximum values of all normal sections at point , respectively, (Figure 5a). and are termed the principal curvatures.
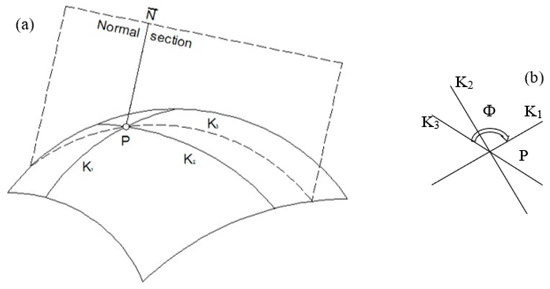
Figure 5.
Sketch of principal curvature on a surface (a) in 3D Euclidean space and (b) by top view.
A normal plane through p is a plane passing through the point p containing the normal vector. Let Φ be the angle in the tangent plane (Figure 5b); the normal curvature in direction Φ is given by:
Equation (12) is called Euler’s equation [27].
3.3. Curvature Formula
Curvature is the amount by which a geometric object deviates from being flat with the equivalent definition as the reciprocal of the radius of the osculating circle. For a planar curve given explicitly as , and using primes for derivatives with respect to the coordinate , the curvature is:
For an implicit surface , three notations including the gradient , the Hessian , and the adjoint of the Hessian for surface are needed to derive curvature formula [28]:
Here applied to a row vector refers to taking the gradient of each component and storing these component gradients in a matrix as consecutive column vectors. The gradient is parallel to the normal of the surface .
The following curvature formulas for implicit surfaces appear in [29]:
Gaussian curvature gives:
Mean curvature gives:
The principal curvatures and can be computed from the mean and Gaussian curvature and , respectively, from
The detailed derivation for Gaussian and mean curvatures of implicit surfaces can be found in [28].
4. Experimental Protocol
A single zeolite particle with diameter 2.27 mm was imaged by X-ray μCT, which was carried out in X-ray μCT laboratory in the School of Geoscience, University of Edinburgh. The reason for choosing a zeolite particle is because of its scientific merit and widespread industrial application [24,30,31,32]. The particles mentioned in this work are intended to be granulated zeolite particles instead of primary particles. The mean diameter for zeolite granules, d50 is varied from 1.0 to 3.5 mm in the literature and their mechanical response subject to compressive and impact loading can be found elsewhere [21,22,24]. The projection data were collected by incrementing a small rotation angle around the rotation axis during X-ray scanning. The collected data were digitally processed in an image processing software Avizo Fire [33]. In this way the imaged particle could be visualized in 3D by data reconstruction and the digital information of the reconstructed particle could be captured and processed. The global and local curvature estimation at the contact point was conducted with two different fitting methods. The effect of the fitting scope is investigated and the detailed procedure for image processing is described as follows.
4.1. X-ray μCT Instrument
An in-situ loading apparatus was purposefully built which positions the sample to be scanned by the X-ray instrument. The X-ray instrument consists of a 120 keV transmission X-ray source with a diamond coated W target, a 4MP flat panel GADOX (Gadolinium Oxysulfide) X-ray camera and an air-bearing rotary table on which the in-situ loading apparatus is mounted. A complete scan is accomplished through 360° rotation which takes approximately 1 h to collect 1000 radiographs. The in-situ loading apparatus and the sketch of the loading apparatus are shown in Figure 6. As can be seen, the press base of the loading frame is attached to the rotary table, which enables the particle to be rotated during an X-ray scan. The particle is placed between two boron nitride (BN) pistons in the loading frame and can be pressed to a maximum load of 100 N by means of a manual micrometer screw thread. The plastic pillar is made of polycarbonate, which is transparent to X-rays. A recess of the plastic pillar was intentionally built so as to reduce the energy loss of X-rays although the plastic pillar is X-ray transparent. The load is measured by means of a strain gauge load cell situated below the lower BN piston. The load cell was provided by OMEGA’s LCMKD series with the loading capacity of 100 N.
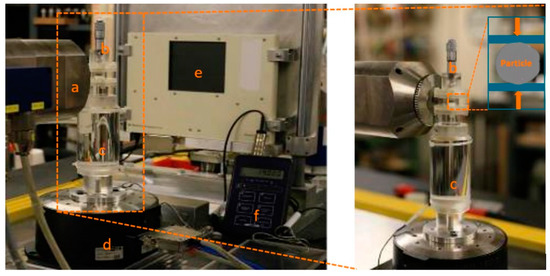
Figure 6.
In-situ loading apparatus and X-ray scanning instrument a: X-ray source, b: barrel as displacement control mode, c: plastic pillar, d: rotary table, e: X-ray detector and f: meter reading.
The particle is placed in a small channel of the in-situ loading rig, which levels up with the X-ray source. These particles were provided by CWK Bad Kostritz Gmbh and the specification of tested zeolite particle could be referenced elsewhere [30]. The particle was fed into the channel and increasingly compressed under displacement control loading by screwing the barrel on top of the loading rig. The applied load was recorded by the force transducer placed beneath the bottom plate and the value of the applied load was monitored by the meter reading at every loading stage. In this work, the zeolite particle was first scanned by the X-ray instrument to inspect the initial state of internal structure. Then the zeolite particle was loaded until the loading force of 6 N was reached, where the zeolite particle was scanned again by X-ray µCT. The morphology of the zeolite particle was used to compute the contact curvature by 2D and 3D fitting methods. However, the purpose of X-ray µCT, apart from what is used to measure the contact curvature, serves to examine the microstructure of zeolite particles, and to visualize the progressive failure process subject to compressive loading. More details of the progressive deformation of the zeolite particles can be found in our previous work [34] or the literature work [19] which describes the aid of X-ray μCT.
4.2. Data Acquisition and Image Conversion
During the rotation of the X-ray scan, the projection image is generated by sequential capture of attenuated X-ray beams by the detector. For cone beam geometry, it requires projection images with equal angular separation between 0° and 360°. The last image at 360° is called the short scan, which is not used for the reconstruction, but is used for the calculation of the rotation center. In terms of the number of projections herein, 1000 projections are collected in the cone beam geometry, which is deemed sufficient for the quality of reconstruction. Alignment of the scanning system is a prerequisite to ensure tomography acquisition with good quality. The beam axis should be aligned with the center of the detector. Image reconstruction is the mathematical process of converting raw data collected via data acquisition into two-dimensional slice images [35]. There are several methods to implement the reconstruction process such as analytical, iterative, back and filtered back projection. Amongst these, filtered back projection is the most widely used method. The advantage of filtered back projection is that blurring resulting from simple back projection can be mitigated with this method. In other words, a filter function is applied to each 2D attenuation profile before performing the back projection. The software utilized for image reconstruction is Octopus 8.0 [36], which was originally developed for neutron tomography. An Octopus dataset typically includes projection images (raw data), optionally beam profile images (flat images) and dark images (offset images). The reconstruction procedure based on the Octopus dataset is described below:
1. Select the directory with projection images in Octopus and then input the beam profile image and dark images in turn (Figure 7). Then the scanning parameters of the cone beam mode are specified.
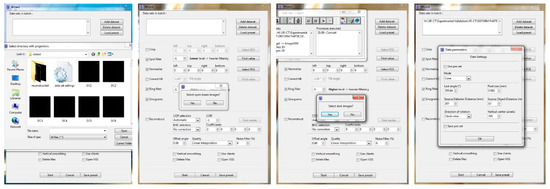
Figure 7.
Selection of projection images, open beam images and dark images in Octopus.
2. After selecting the data in step 1, the original projections should be cropped with a desired region of interest (ROI) in Figure 8 so as to keep the data volume as small as possible. Then set up the value of the spot filter to eliminate white spots. Projection normalizing is performed to divide the projections by the beam profile images (flat images). Note that the selection of ROI for normalization should not be too close to the object, since the background radiation level can be influenced by the scattering of radiation from the object. A value of ring filter is then assigned to remove the rings artifact due to inappropriate behavior of pixels in the detector. With the option of sonogram ticked, the Start option is enabled to generate normalized images and sonograms.
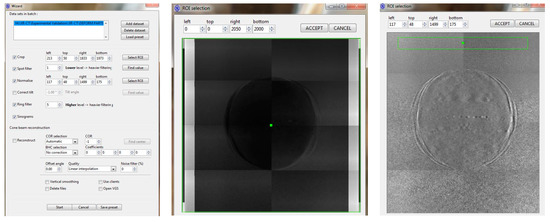
Figure 8.
Selection of region of interest (ROI) to crop and normalize.
3. The tomographic images are ready to output following image reconstruction and rescale in Figure 9.
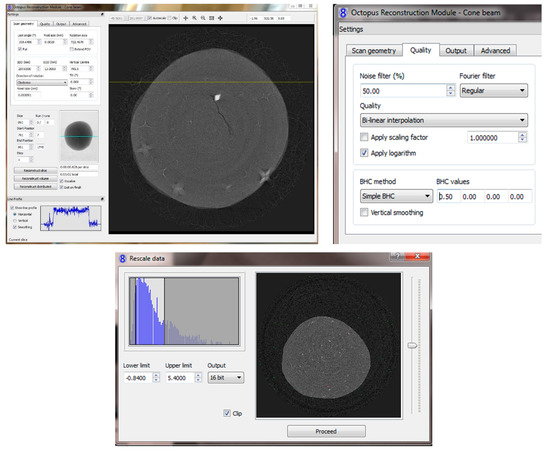
Figure 9.
Reconstruction and rescale module.
4.3. Image Processing
As stated above, acquired data were reconstructed by filtered back projection using Octopus 8.0 [29], where noises were minimized and raw data was converted to be readable in Avizo [33]. Then 2D tomographic slices were stacked for 3D volume rendering using Avizo [33] after beam hardening and ring artifacts were filtered in post-processing. The whole image process is schematically shown in Figure 10.
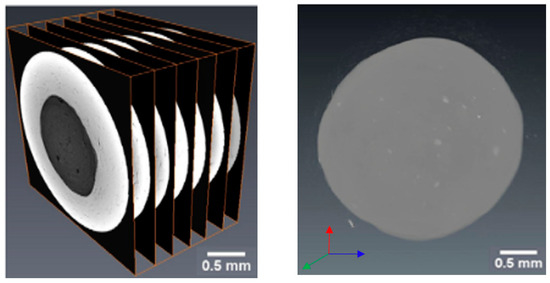
Figure 10.
Image processing from data acquisition to 3D volume rendering.
A sequence of slices in the XY cross-section is stacked in Avizo [33] and orthogonal planes around the vertex of particles are displayed as shown in Figure 11.
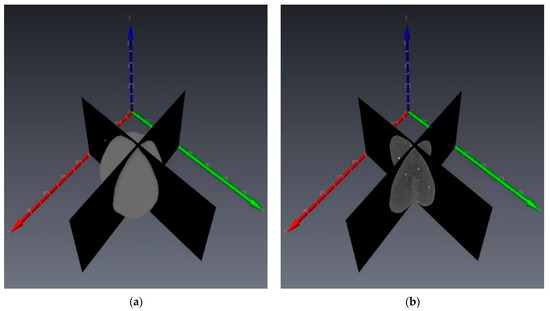
Figure 11.
Schematic of a zeolite particle: (a) volume rendering and (b) dual orthogonal slices.
4.4. Image Binarization
Image binarization is a process to convert a grey image to a black and white one. The binarized image has only two colours, black and white, in which the black (background) is represented by “0” whilst white (the object) is represented by “1”. Figure 12 shows a pair of orthogonal planes with grayscale images which are binarized using the image processing software Fiji in order to get the outline of the slice. Binary images require lower storage and a simpler processing algorithm compared to greyscale images.
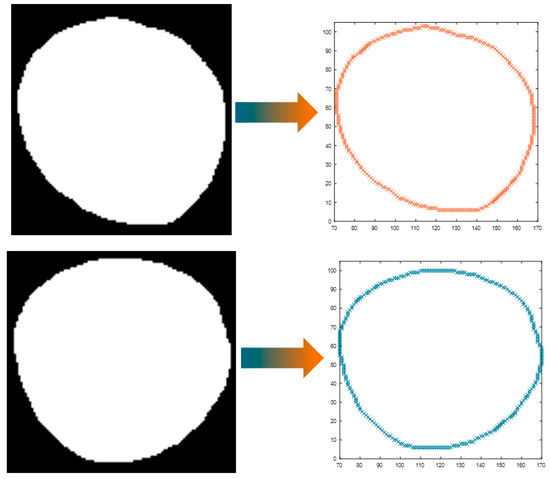
Figure 12.
Binarization images of orthogonal slices and periphery by post-processing of binary images.
The reason for binarizing images is to extract the digits of the periphery in every slice, which is used to compute either pixel-based profile or voxel-based spatial entity. An example of 3D entity composed of binarized images is shown in Figure 13. As clearly shown in the top view of the voxel-based 3D entity in Figure 13b, the scanned zeolite particle exhibits imperfect roundness, indicating an imperative need to consider the particle shape in computing the contact curvature and Young’s modulus.
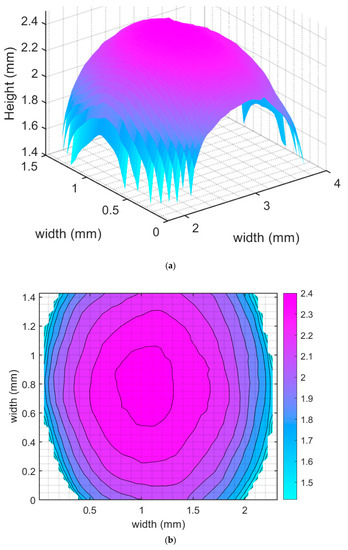
Figure 13.
3D construction of the zeolite particle using digital information from binarized images of orthogonal slices: (a) inclined view and (b) top view.
4.5. Curvature Estimation
The polynomial and circular (spherical) fitting methods are used here to compute the principal curvatures of the contact point in 2D and 3D. The effect of fitting scope of tomography is investigated, which has not been studied by previous publications. Figure 14 represents the centre position of the tomography as Section 1 and the geometry above the section is fitted for curvature estimation with 10 and 20 sections for demonstration purposes. The fitting scope is thus becoming increasingly smaller from the centre position until Section 10, with an equal section distance. The fitting scope is varied by 10, 20 and 50 sections for sensitivity analysis in the fitting scope of the semi-particle. In other words, the interval of fitting scope for 10, 20, and 50 sections is 0.1135 mm (Radius/10), 0.0568 mm (Radius/20), and 0.0227 mm (Radius/50), respectively. All the circular, spherical and polynomial fitting methods are implemented in MATLAB.
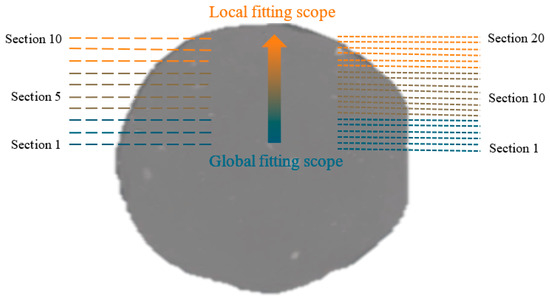
Figure 14.
Sketch of 10 and 20 fitting sections from global fitting to local fitting.
Similar to curvature estimation by Armstrong et al. [17], two distinct approaches are adopted to measure the contact curvature shown in Figure 15. The first method is conducted based on computing contact curvature from a set of orthogonal slices at different orientations. Then the principal curvature is optimised from the contact curvature measured in varying orthogonal slices. Figure 15a shows a pair of orthogonal slices, of which their binarized images are used for 2D curvature estimation in Figure 15b. Figure 15c shows the second method to compute the principal curvature directly in light of Gaussian curvature and mean curvature in Equations (17) and (18).
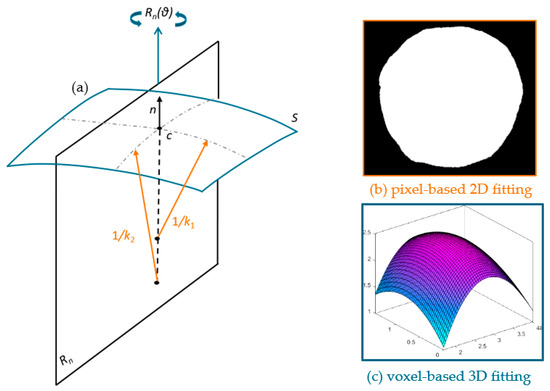
Figure 15.
(a) Sketch of a surface with segment of orthogonal slice, (b) pixel-based 2D and (c) voxel-based 3D fitting methods to compute principal curvature (modified from [17]).
The parameters used to calculate the Young’s modulus and the indentation depth during deformation are summarized in Table 1 below. R was the averaged value of 6 times-measurement at different cross-sections using the caliper ruler with the accuracy 0.01 mm. Note that the particle diameter measured by caliper ruler is also used to calibrate the pixel size as 4.3 μm of zeolite particle before compression. The indentation displacement was recorded by the barrel increment as the displacement control model as shown in Figure 6, which is further calibrated by the downwards movement of pixels of the compressed zeolite at 6N as compared to the unloaded particle scanned by X-ray μCT. The Poisson’s ratio is assumed to be 0.25, referred from the literature [37].

Table 1.
Parameters in Equation (10) to calculate Young’s modulus and indentation depth of a zeolite 4AK particle.
5. Results and Discussion
5.1. Effect of Angular Division
As for 2D circular and polynomial fitting, a decision needs to be made regarding the number of pairs of orthogonal planes in order to compute the principal curvature. Eighteen pairs of orthogonal planes around the contact point were first obtained from stacked slices by an incremental rotation of 5 degrees shown in Figure 16. The curvature value of individual orthogonal plane using the 3rd polynomial and circular fitting methods are tabulated in Table 2 using fitting Section 1. Note that the curvature using the 3rd polynomial fitting is determined by Equation (13). As in Equation (10), the Young’s modulus is determined by the summation of maximum and minimum principal curvature, thus the summation of principal curvature is shown in Table 2 as well.
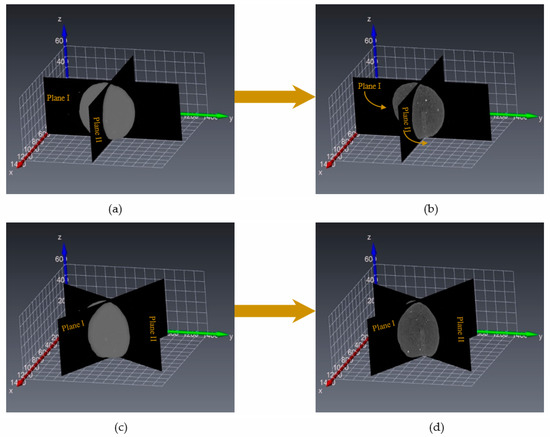
Figure 16.
Schematic of 3D rendering of the zeolite particle: (a) reference 3D volume; (b) reference dual orthogonal slices (c) 3D volume with rotation angle (d) orthogonal slices with rotation angle.

Table 2.
Estimated curvature in orthogonal planes by the 3rd polynomial and circular fitting methods in Section 1.
According to the Euler’s theory, there exists principal curvatures around one point on a smooth surface, which represents the maximum and minimum curvature. The non-linear least squares approach was used in MATLAB to optimise the principal curvature based on the curvature value listed in Table 2. The term stands for the curvature estimated by the 3rd polynomial fitting method whilst stands for the curvature estimated by circular fitting method. The principal curvatures are found to be 1.612 and 1.275 using the 3rd polynomial fitting method, while they are found to be 0.892 and 0.829 using the circular fitting method. The same method is applied to optimise the principal curvature calculated by the 3rd polynomial fitting method and circular fitting method under different incremental rotation angles. The optimised results are shown in Table 3 and the corresponding plot is shown in Figure 17. The terms and are the maximum and minimum curvature by 3rd polynomial fitting, respectively. The terms and are the maximum and minimum curvature by circular fitting, respectively. The curvature calculated by 3rd polynomial fitting is larger than that by circular fitting. When the particle is irregularly shaped, the curvature estimated by polynomial fitting will be more representative than circular fitting. It further shows that the curvature in a pair of orthogonal planes differs even by the circular fitting method at different rotation angles. This means that the scanned particle is not perfectly spherical and hereby the consideration of particle shape is imperative in order to quantify the contact curvature.

Table 3.
Optimised principal curvature with varying incremental rotation angles using the 3rd polynomial and circular fitting methods.
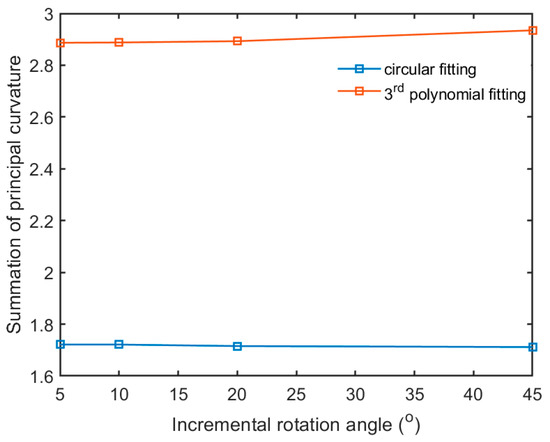
Figure 17.
Variation of incremental rotation angle versus summation of principal curvature under the 3rd polynomial and circular fitting methods.
In Figure 17, as the incremental rotation angle is increased, the summation of the principal curvatures using 3rd polynomial fitting method increases slightly whereas that using the circular fitting method decreases lightly. The curvature estimation thereafter is obtained by 5 degrees of incremental rotation angle under different fitting sections.
5.2. Effect of Fitting Section on Principal Curvature
The fitting section is varied in the spectrum of 10, 20, 50 respectively, within the fitting scope of the semi-particle. The estimated principal curvature summation from 2D and 3D 3rd polynomial fitting methods within 10 sections is shown in Figure 18 whilst the estimated principal curvature summation from the circular and spherical fitting methods is shown in Figure 19. Note that the relative variation is defined by the difference of principal curvature summation under 2D and 3D fitting conditions divided by the principal curvature summation from 3D fitting condition. Take 3rd polynomial fitting for example, the relative variation is defined as (-)/, where and are the principal curvature summations in 3D and 2D fitting using the 3rd polynomial fitting method.
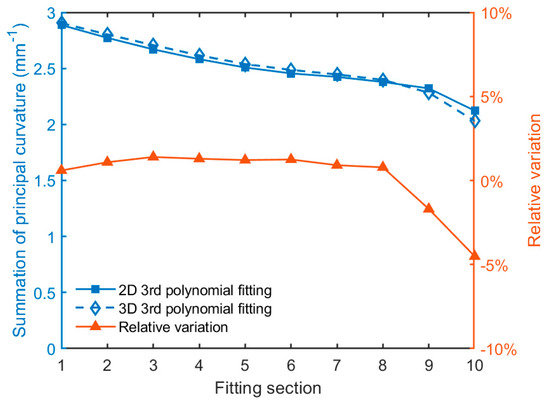
Figure 18.
Summation of principal curvature using 2D and 3D polynomial fitting methods in 10 sections.
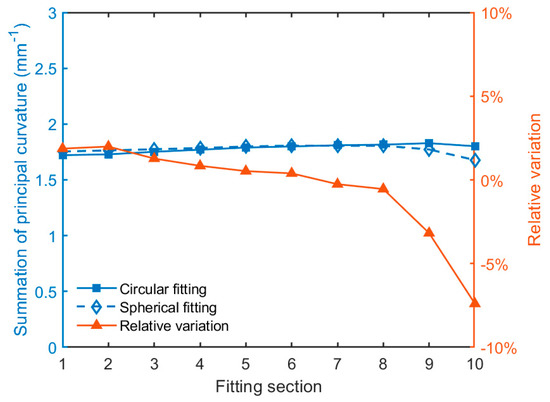
Figure 19.
Summation of principal curvature under circular and spherical fitting methods in 10 sections.
As seen from Figure 18, the principal curvature summation obtained in 2D and 3D from the 3rd fitting methods are generally in good agreement with each other. The principal curvature summation decreases and the relative variation is increasingly large as the fitting section increases. Similarly, the principal curvature summation through circular fitting agrees well with that through the spherical fitting. However, the principal curvature summation increases slightly and then reduces as the fitting section increases. Likewise, the principal curvature calculated in 20 sections through the 3rd polynomial fitting is plotted in Figure 20. The principal curvature calculated in 20 sections through the circular and spherical fitting method is plotted in Figure 21.

Figure 20.
Summation of principal curvature under 2D and 3D polynomial fitting methods in 20 sections.
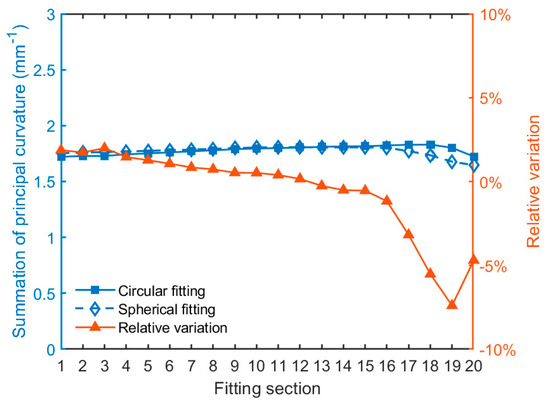
Figure 21.
Summation of principal curvature under circular and spherical fitting methods in 20 sections.
In Figure 20 of the 3rd polynomial fitting, the principal curvature summation with 20 sections decreases with the increase of fitting section, similar to the trend in 10 sections. However, the relative variation in 20 sections is more deviated as compared to that in 10 sections. Despite some fluctuations of principal curvature summation in Figure 21, it shows that the principal curvature summation through circular and spherical fitting is more stable than that from the 3rd polynomial fitting. Similarly, the principal curvature calculated in 50 sections through the 3rd polynomial fitting is plotted in Figure 22. The principal curvature calculated in 50 sections through circular and spherical fitting is summarized plotted in Figure 23 respectively. In particular, the principal curvature summation by the 3rd polynomial fitting is larger than that by circular or spherical fitting.

Figure 22.
Summation of principal curvature under 2D and 3D polynomial fitting methods in 50 sections.
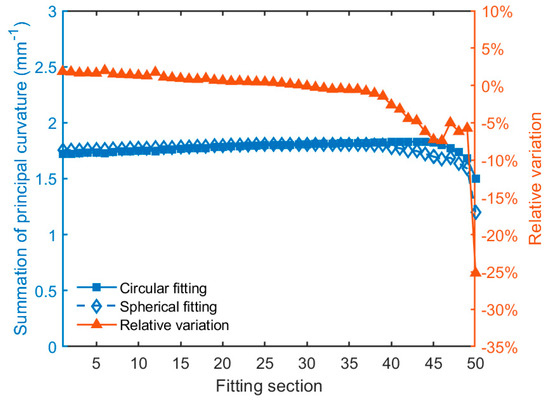
Figure 23.
Summation of principal curvatures using the circular and spherical fitting methods in 50 sections.
The principal curvature summation in 50 sections generally follows the trend in 10 and 20 sections. Amongst Figure 18, Figure 20 and Figure 22, it is found that the principal curvature summation obtained through the 3rd polynomial fitting decreases as the fitting section increases. The principal curvature summation obtained from the circular or spherical fitting method is more stable compared to the 3rd polynomial fitting. The relative variation of principal curvature summation through 3rd polynomial fitting is more drastic than that through the circular or spherical fitting. The principal curvature summation under 2D and 3D fitting are in good agreement.
5.3. Influence of Fitting Section on Young’s Modulus
As indicated from Equation (10), the value of the Young’s modulus is associated with the principal curvature summation of the upper and lower contact points during parallel platen compression. Note that the conventional way of measuring the contact curvature is to use the average of particle size. The Young’s modulus through the fitting methods and averaging method is summarized for comparison. The computed Young’s modulus in 10, 20 and 50 sections in terms of the semi-particle are shown in Figure 24, Figure 25 and Figure 26, respectively. It can be seen that the circular fitting in 2D and the spherical fitting in 3D give rise to close agreement for Young’s modulus. This observation also applies to the polynomial fitting irrespective of the 2D or 3D method. However, the Young’s modulus by polynomial fitting is generally larger than that by circular and spherical fitting methods. More discussions of Young’s modulus determination are expanded in the following sector.
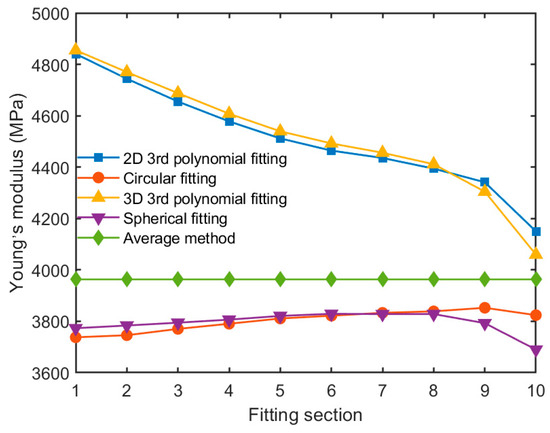
Figure 24.
The Young’s modulus determined from different fitting methods with a semi-particle scope.
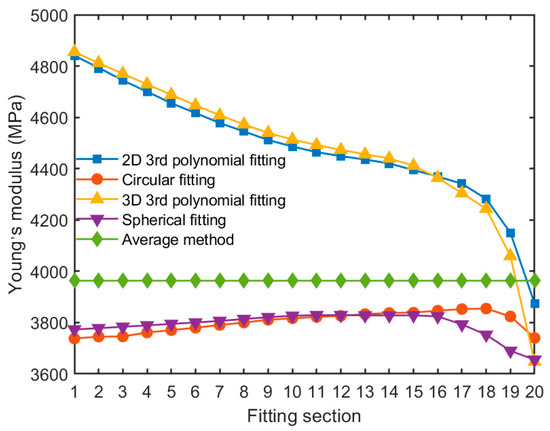
Figure 25.
The Young’s modulus determined by different fitting methods with a semi-particle scope of 20 sections.
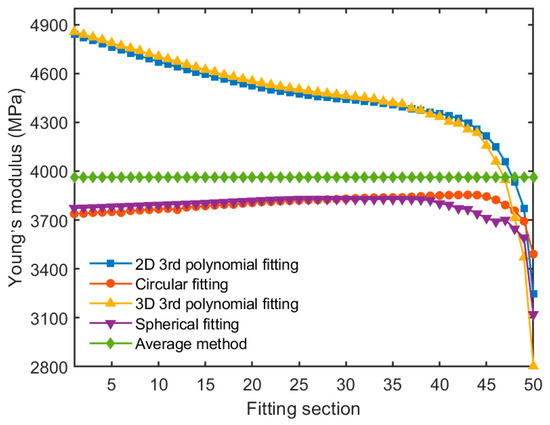
Figure 26.
The Young’s modulus determined by different fitting methods in semi-particle scope of 50 sections.
5.4. Discussion
1. The Young’s modulus reduces with the increase of the number of fitting sections when the 3rd polynomial fitting method is used. The Young’s modulus obtained in 10 fitting sections with a semi-particle is larger than that by the traditional averaging method. The majority of the Young’s modulus obtained in 20 and 50 fitting sections of semi-particle is larger than that by the traditional averaging method 3963 MPa, which is calculated by Equation (10), substituting the parameter values in Table 1. The Young’s modulus obtained using the circular and spherical fitting is constantly lower than 3963 MPa for the three fitting sections within a semi-particle. The summation of the principal curvatures changes dramatically under higher fitting sections. The Young’s modulus from the circular and spherical fitting methods is constantly lower than 3963 MPa. The value of the Young’s modulus reduces significantly in higher fitting sections, indicating that the Young’s modulus determined by principal curvature is more sensitive to local fitting regions.
2. The largest value of the Young’s modulus calculated from polynomial and spherical fitting is respectively 4855 MPa and 3773 MPa within Section 1 of the semi-particle scope whereas the smallest value of the corresponding Young’s modulus is 2165 MPa and 3108 MPa in fitting section number 50. This indicates that a drastic change of the Young’s modulus when fitting from globally to locally, which results from a drastic change of contact curvature.
3. Interestingly, a large scatter of Young’s modulus is also observed for the zeolite particles with similar sizes in the literature. For example, the Young’s moduli for zeolite 4AK with mean granule size at 1.75, 2.05 and 3.5 mm are shown as 5400 ± 1570 MPa, 2450 ± 640 MPa, and 3340 ± 1050 MPa, respectively [21]. Another study of Young’s modulus for zeolite 4A shows the value of 4160 ± 950 MPa [38]. This can be attributed to individual variability of sphericity, porosity and surface roughness [39]. Moreover, the structural inhomogeneities such as pores, microcracks, solid bridge bonds and non-uniform surface curvature. These factors can play collectively significant roles in differentiating the macroscopic behaviour, ultimately leading to dramatic scatter in Young’s modulus and statistically distributed breakage probability.
4. The preceding study has shown that the calculated Young’s modulus of a particle exhibits a non-negligible variability, and is highly associated with its profile. The contact curvature becomes significant in determining the Young’s modulus when taking particle shape into account. The significance of particle shape can provide plausible reason to account for a large scatter of Young’s modulus for zeolite particles by the compression test [21]. An accurate and repeatable topological characterization measurement is still an enigma [40]. However, a criterion to determine Young’s modulus should consider the effect of contact curvature where the particle is irregularly shaped.
6. Conclusions
The principal curvature at the contact point has been computed to determine Young’s modulus based on Hertz’s contact theory. X-ray μCT tests were carried out to obtain the profile of a single particle where the particle shape was digitally constructed from the tomography. The orthogonal slices of the particle were binarized to obtain the intersecting profile of the particle. Two fitting methods, namely the 3rd polynomial fitting and the circular fitting (spherical in 3D) were chosen. The principal curvature in 2D fitting was optimised by a non-linear least squares method. A good agreement of the principal curvature was reached under 2D and 3D conditions irrespective of the fitting method. The effect of contact curvature on the Young’s modulus determination was then studied and it was found that the Young’s modulus changes drastically from global fitting to local fitting, which demonstrates a non-negligible variation when particle shape is considered. It was shown that contact curvature exerts an important role on the determination of Young’s modulus when particle shape is taken into account. It is advocated that a criterion for the Young’s modulus should consider the effect of contact curvature in which the particle shape is an important factor. However, the sensitivity analysis of the Young’s modulus to contact curvature is considered for one particle only. Therefore, a robust and accurate criterion to determine Young’s modulus considering the effect of contact curvature will form an interesting research topic via a systematic analysis of multiple particles compared to other measuring techniques.
Author Contributions
Conceptualization, Z.L. and L.G.W.; methodology, L.G.W.; software, Z.L.; formal analysis, Z.L., L.Z., X.C. and R.Z.; writing—original draft preparation, L.G.W. and Z.L.; writing—review and editing, Z.L., X.C. and R.Z.; visualization, L.Z.; funding acquisition, Z.L. All authors have read and agreed to the published version of the manuscript.
Funding
This research was funded by International Fine Particle Research Institute, National Key Research and Development Project, grant number 2020YFB1600500, National Science Foundation of China, grant No. 51909146 and 51909147.
Institutional Review Board Statement
Not applicable.
Informed Consent Statement
Not applicable.
Data Availability Statement
The data reported in this work can be found in https://github.com/barcelonawlg/Data-availability_APS (accessed on 10 February 2021).
Acknowledgments
The first author would like to thank Jian-Fei Chen, Jin Y. Ooi and Alvaro Janda from the University of Edinburgh for many helpful discussions. The courtesy of providing the X-ray CT instrument by Ian Butler from University of Edinburgh is highly appreciated.
Conflicts of Interest
The authors declare no conflict of interest.
Nomenclature
| Indentation area, mm2 | |
| Elastic modulus, MPa | |
| Effective modulus, MPa | |
| Reduced modulus, MPa | |
| Applied force, N | |
| H(F) | Hessian matrix, - |
| Curvature, mm−1 | |
| Principal curvature, mm−1 | |
| Gaussian curvature, mm−1 | |
| Mean curvature, mm−1 | |
| Poisson’s ratio, - | |
| Contact pressure, N/m2 | |
| Radius of contact, mm | |
| R1, R2 | Solid radius, mm |
| Effective radius, mm | |
| Unloading stiffness, N/m | |
| δ | Indentation depth, mm |
| ϕ | Angle in the tangent plane, ° |
| Total displacement, mm | |
| Gradient of implicit surface, - |
References
- Portnikov, D.; Kalman, H. Determination of elastic properties of particles using single particle compression test. Powder Technol. 2014, 268, 244–252. [Google Scholar] [CrossRef]
- McDowell, G.; Li, H.; Lowndes, I. The importance of particle shape in discrete-element modelling of particle flow in a chute. Geotech. Lett. 2011, 1, 59–64. [Google Scholar] [CrossRef]
- Gao, X.; Yu, J.; Lu, L.; Li, C.; Rogers, W.A. Development and validation of SuperDEM-CFD coupled model for simulating non-spherical particles hydrodynamics in fluidized beds. Chem. Eng. J. 2020, 127654. [Google Scholar] [CrossRef]
- Zhong, W.; Yu, A.; Liu, X.; Tong, Z.; Zhang, H. DEM/CFD-DEM Modelling of Non-spherical Particulate Systems: Theoretical Developments and Applications. Powder Technol. 2016, 302, 108–152. [Google Scholar] [CrossRef]
- Chen, H.; Xiao, Y.G.; Liu, Y.L.; Shi, Y.S. Effect of Young’s modulus on DEM results regarding transverse mixing of particles within a rotating drum. Powder Technol. 2017, 318, 507–517. [Google Scholar] [CrossRef]
- Yan, Z.; Wilkinson, S.K.; Stitt, E.H.; Marigo, M. Discrete element modelling (DEM) input parameters: Understanding their impact on model predictions using statistical analysis. Comput. Part. Mech. 2015, 2, 283–299. [Google Scholar] [CrossRef]
- Bowman, E.; Soga, K.; Drummond, T.W. Particle shape characterisation using Fourier analysis. Géotechnique 2000, 315, 1–20. [Google Scholar] [CrossRef]
- Sukumaran, B.; Ashmawy, A.K. Quantitative characterisation of the geometry of discret particles. Géotechnique 2001, 51, 619–627. [Google Scholar] [CrossRef]
- Hu, J.; Stroeven, P. Shape Characterization of Concrete Aggregate. Image Anal. Stereol. 2006, 25, 43–53. [Google Scholar] [CrossRef]
- Clayton, C.R.I.; Heymann, G. Stiffness of geomaterials at very small strains. Géotechnique 2001, 51, 245–255. [Google Scholar] [CrossRef]
- Cavarretta, I.; Coop, M.; O’Sullivan, C. The influence of particle characteristics on the behaviour of coarse grained soils. Geotechnique 2010, 60. [Google Scholar] [CrossRef]
- Hertz, H. Über die Berührung fester elastischer Körper. J. Die Reine Angew. Math. 1881, 156–171. [Google Scholar] [CrossRef]
- Silva, N.V.; Angulo, S.C.; Barbosa, A.S.R.; Lange, D.A.; Tavares, L.M. Improved method to measure the strength and elastic modulus of single aggregate particles. Mater. Struct. Constr. 2019, 52. [Google Scholar] [CrossRef]
- Marigo, M.; Cairns, D.L.; Bowen, J.; Ingram, A.; Stitt, E.H. Relationship between single and bulk mechanical properties for zeolite ZSM5 spray-dried particles. Particuology 2014, 14, 130–138. [Google Scholar] [CrossRef]
- Perkins, M.; Ebbens, S.J.; Hayes, S.; Roberts, C.J.; Madden, C.E.; Luk, S.Y.; Patel, N. Elastic modulus measurements from individual lactose particles using atomic force microscopy. Int. J. Pharm. 2007, 332, 168–175. [Google Scholar] [CrossRef]
- Oliver, W.C.; Pharr, G.M. Measurement of hardness and elastic modulus by instrumented indentation: Advances in understanding and refinements to methodology. J. Mater. Res. 2004, 19, 3–20. [Google Scholar] [CrossRef]
- Armstrong, R.T.; Pentland, C.H.; Berg, S.; Hummel, J.; Lichau, D.; Bernard, L.; Group, V.S. Estimation of Curvature from Micro-Ct Liquid-Liquid Displacement Studies with Pore Scale Resolution. In Proceedings of the International Symposium of the Society of Core Analysts, Aberdeen, UK, 27–30 August 2012; pp. 1–6. [Google Scholar]
- Chung, Y.C. Discrete Element Modelling and Experimental Validation of a Granular Solid Subject to Different Loading Conditions. Ph.D. Thesis, University of Edinburgh, Edinburgh, UK, 2006; pp. 1–376. [Google Scholar]
- Russell, A.; Schmelzer, J.; Müller, P.; Krüger, M.; Tomas, J. Mechanical properties and failure probability of compact agglomerates. Powder Technol. 2015, 286, 546–556. [Google Scholar] [CrossRef]
- Meier, M.; John, E.; Wieckhusen, D.; Wirth, W.; Peukert, W. Influence of mechanical properties on impact fracture: Prediction of the milling behaviour of pharmaceutical powders by nanoindentation. Powder Technol. 2009, 188, 301–313. [Google Scholar] [CrossRef]
- Müller, P.; Tomas, J. Compression behavior of Moist Spherical Zeolite 4A Granules. Chem. Eng. Technol. 2012, 35, 1677–1684. [Google Scholar] [CrossRef]
- Mueller, P.; Aman, S.; Tomas, J. Evaluation of impact velocity and compression force of moist zeolite 4A granules at breakage using an equivalence function. Chem. Eng. Technol. 2014, 37, 813–818. [Google Scholar] [CrossRef]
- Johnson, K.L. Contact Mechanics; University of Cambridge: Cambridge, UK, 1992. [Google Scholar]
- Antonyuk, S.; Tomas, J.; Heinrich, S.; Mörl, L. Breakage behaviour of spherical granulates by compression. Chem. Eng. Sci. 2005, 60, 4031–4044. [Google Scholar] [CrossRef]
- Lien, C.-C.; Ting, C.-H. ASAE Standard Compression Test of Food Materials of Convex Shape. Am. Soc. Agric. Eng. 1998, S368.3, 580–587. [Google Scholar]
- Euler, L. Recherches sur la courbure des surfaces. In Memoires de L’academie des Sciences de Berlin; Gauthier-Villars: Paris, France, 1760; Volume 16, pp. 119–143. [Google Scholar]
- Eisenhart, L.P. A Treatise on the Differential Geometry of Curves and Surfaces; Dover Publications: Dover, UK, 2004; ISBN 0-486-43820-1. [Google Scholar]
- Goldman, R. Curvature formulas for implicit curves and surfaces. Comput. Aided Geom. Des. 2005, 22, 632–658. [Google Scholar] [CrossRef]
- Spivak, A Comprehensive Introduction to Differential Geometry. 1975. Available online: http://strangebeautiful.com/other-texts/spivak-intro-diff-geom-v1-3ed.pdf (accessed on 1 January 2021).
- Li, Z.P.; Wang, L.G.; Chen, W.; Chen, X.; Liu, C.; Yang, D. Scale-up Procedure of Parameter Estimation in Selection and Breakage Functions for Impact Pin Milling. Adv. Powder Technol. 2020. [Google Scholar] [CrossRef]
- Wang, L.G. Particle Breakage Mechanics in Milling Operation. Ph.D. Thesis, University of Edinburgh, Edinburgh, UK, 2016. [Google Scholar]
- Antonyuk, S.; Heinrich, S.; Tomas, J.; Deen, N.G.; Van Buijtenen, M.S.; Kuipers, J.A.M. Energy absorption during compression and impact of dry elastic-plastic spherical granules. Granul. Matter 2010, 12, 15–47. [Google Scholar] [CrossRef]
- Avizo. 2012. Available online: https://www.fei.com/software/amira-avizo/ (accessed on 1 October 2020).
- Wang, L.G.; Ooi, J.Y.; Butler, I. Interpretation of particle breakage under compression using X-ray computed tomography and digital image correlation. Procedia Eng. 2015, 102, 240–248. [Google Scholar] [CrossRef]
- Ketcham, R.A.; Carlson, W.D. Acquisition, optimization and interpretation of x-ray computed tomographic imagery: Applications to the geosciences. Comput. Geosci. 2001, 27, 381–400. [Google Scholar] [CrossRef]
- Octopus Imaging. 2012. Available online: https://octopusimaging.eu/ (accessed on 1 June 2020).
- Hare, C.; Wang, L.; Ooi, J.Y. Characterisation of Particle Grindability by Indentation and Impact; International Fine Particle Research Institute: Woodbury, MN, USA, 2015. [Google Scholar]
- Müller, P.; Russell, A.; Tomas, J. Influence of binder and moisture content on the strength of zeolite 4A granules. Chem. Eng. Sci. 2015, 126, 204–215. [Google Scholar] [CrossRef]
- Russell, A.; Müller, P.; Tomas, J. Quasi-static diametrical compression of characteristic elastic-plastic granules: Energetic aspects at contact. Chem. Eng. Sci. 2014, 114, 70–84. [Google Scholar] [CrossRef]
- Miller, M.; Bobko, C.; Vandamme, M.; Ulm, F.J. Surface roughness criteria for cement paste nanoindentation. Cem. Concr. Res. 2008, 38, 467–476. [Google Scholar] [CrossRef]
Publisher’s Note: MDPI stays neutral with regard to jurisdictional claims in published maps and institutional affiliations. |
© 2021 by the authors. Licensee MDPI, Basel, Switzerland. This article is an open access article distributed under the terms and conditions of the Creative Commons Attribution (CC BY) license (http://creativecommons.org/licenses/by/4.0/).