1. Introduction
In the 21st century, the electronic system has become the basic element in most modern electronic equipment. Nowadays, electronics are used in many technologies, such as information processing, telecommunication, commercial, military, and medical applications. Each commercial demand in electronics technology encourages manufacturers to investigate and follow their evolution or stay ahead of it. The reflow soldering is an important phase in the assembly process, especially in the field of Surface-Mount Technology (SMT). After positioning the components into the previously printed solder paste, reflow soldering stage follows, in which the solder paste will melt and create a permanent solder joint [
1]. To enable the high quality of the joints, this process of heating should be controlled precisely.
The common heating methods of the reflow soldering are performed by three different approaches; the first is the infrared heating. This method has faced many criticisms due to uneven heating, difficult profile composition, and different radiation heating related soldering failures [
2]. The second and most widely used reflow method in mass manufacturing is the forced-convection heating, where heat is transferred via controlled gas flow in separated work zones. [
3]. The third method is the Vapour Phase Soldering (VPS). It is based on filmwise-condensation based heat transfer. After the 1980s, this technology fell out of focus. It was due to a toxic component in the heat transfer medium that was used in the process [
4]. Nowadays, inert and chemically stable PFPE-based Galden fluids [
5] enable clean and harmless reflow procedures [
6]. This material reintroduced the vapour phase soldering method again to the manufacturers, starting a new age in the application of VPS. During VPS process, the vaporized medium is distributed and saturated inside the oven [
7], and the colder printed circuit board (PCB) assembly (PCBA) is immersed into a vapour “blanket” or “column” in other words. Heat transfer occurs when condensation starts on the cold PCBA surfaces.
During the reemergence of VPS, different new oven constructions and control paradigms appeared on the market. One of these was the “heat-level” based VPS approach (HL-VPS) [
7]. This method is based on the standard process, but it is refined in many aspects. At first, the PCBA is positioned onto a sample holder at the top of a reservoir (or tank) at the loading height. Then, a lid closes on this tank, and the PCBA is lowered into the workspace of the oven. During standard VPS processes, saturated vapours are already present in the tank at this point. In HL-VPS, the vapour is generated onto the surfaces of the assembly from the bottom of the tank after the board reaches the lower position specified for soldering. The workspace control is based on thermocouple sensor measurements from different height points of the reservoir. They provide feedback on heating and eventual boiling of the heat transfer medium. The measurement points are usually located at the level of the boiling fluid in contact with it, at the vertical level of the PCBA where the PCBA is positioned in the tank, and at a specific height above the soldering level. When increased temperatures are measured above the PCBA level, the given sensor sends a signal that the vapour developed over this vertical position, while the heated assembly does not draw away any more significant amounts of vapour with condensation. The overreaching vapour heats the upper thermocouple, and after a programmed delay (the so-called heating delay, which keeps the maximum temperature for a specific time), the oven halts (or as the jargon says: breaks) the soldering process. Finally, the PCB is elevated to the loading height. The power of the heater can be controlled with percentage-based settings, and heating time delays (in the second range) could be programmed to extend the soldering process at peak temperatures. One soldering job (which can be batched processing) takes between 10–15 min altogether.
The heating power can cause variations in the transients of the process; also, it can affect the vapour column height, thus consequently controlling the temperature profile of the soldering, including the heating gradient. This approach was a significant improvement upon standard, saturated-vapour based soldering principles, and in this paper, we focus on HL-VPS. It is important to highlight that this approach has its practical limits. The process has idle times for detecting the medium type by identifying boiling point temperature (noted as “medium recognition”). The cooling can also take a long time, elongating the soldering job. In addition, the use of mid-profile temperature plateaus is not available in HL-VPS ovens.
Despite its recent fame, the VPS process can still be improved from many aspects, e.g., in the aforementioned thermocouple-based measurements [
8]. Thermocouple application was investigated by Lam et al. [
9] and Livovsky [
10], both in experimental ovens, for real-time profiling and control. Before the vapour starts to saturate the available volume above the boiling fluid, non-saturated air-vapour mixture is present in the workspace, which was modelled with FDM in [
11]. It is not straightforward to use this non saturated vapour for soldering, but more advanced ovens can take advantage of the vertical concentration gradients inside the tank.
Galden vapour concentration and the consequent saturated vapour column is increasing from the bottom due to the boiling. The volumetric mass density of the Galden vapour is 20 times larger than the density of the air. Consequently, even unsaturated vapours (air-Galden mixture) can store a non-negligible amount of energy. Thus, the energy of this mixture can be still enough to heat up temperature sensors monitoring the workspace. The need to measure dynamic concentration changes can be satisfied with pressure-based sensing with tubes. This approach was introduced when sensitive, differential flow-sensor based pressure-measurement was realized in standard VPS ovens. This approach can increase productivity [
12] by reducing idle times of the ovens. Dynamic vapour concentration monitoring can provide information on the development of the saturated vapour column. However, in [
12], the hydrostatic pressure detection was limited due to the then available apparatus.
There is another alternative for vapour height detection for control application. Livovsky presented a plate capacitor for vapour column height monitoring, which is able to withstand high-temperatures [
13,
14]. The change of dielectric properties inside the two plates of the capacitor change as the saturated vapour condenses between the plates. The capacity change can be used to fine-tune the oven controls. However, this solution is still in an experimental phase, and it is not yet available for commercial use. The application of an experimental optical probe is also possible [
15], but it is not applicable for continuous use, only with individual dipping into the vapour.
Recent application of vapour phase soldering was mostly presented for modern surface mounted PCBAs. The method was investigated for LED and BGA based assemblies [
16]. The quality of the joints was also a crucial question in comparison of other reflow methods [
17], in the specific field of power electronics [
18], airborne electronics [
19], or regular surface mounting, with the focus on void failure analysis [
20,
21].
Advances in commercial pressure sensors enable unprecedented resolution in ultra-low atmospheric pressure levels with gauge-based sensor cores. Due to the gauge-principles, such sensors are ideal for hydrostatic pressure sensing with fine resolution. The aim and the novelty of this research are to present the application of such sensor type in the control of the heat-level based vapour phase soldering process and to compare pressure-profiles with the traditional thermocouple-based temperature profiles in HL-VPS. The sensor is also used to identify leakage inside the workspace. The proposed method is generally applicable for VPS ovens based on the same principle, and the industry may benefit in various aspects, discussed in the following chapters.
2. Materials and Methods
2.1. Principles of the Condensation Heat Transfer Based VPS Process
During VPS the PCBA is immersed to the workspace, filled with saturated vapour, which condenses on the colder surface, forming a continuous fluid film, which transfers the released latent heat to the PCBA.
To enable continuous heating, permanent vapour source is needed. While condensation reduces vapour concentration in the workspace, the vapour needs to be regenerated from the boiling fluid. As the film cools down on the assembly, more vapour condenses. The heat transfer can be described by the filmwise condensation on horizontal plates [
22] derived from the original Nusselt theory [
23]. The film thickness can be approximated in the order of 0.1 mm for Galden fluids. It depends on the given substrate parameters, like material, size, inclination, etc. When horizontal positioning is assumed, the thickness remains near-constant during the soldering process due to the balance between the gravity force and the force originated from the condensate surface tension. The amount of the transferred heat is mostly determined by the latent heat of the heat transfer fluid and partially by the internal energy of the condensing mass. This heat passes towards the colder assembly through the condensate layer and heats it. The process continues until the PCBA is heated to the boiling temperature of the Galden Fluid. More complex discussion and VPS modelling approaches can be found in [
11,
15].
2.2. The Applied VPS Oven
The oven used for this experiment is an Asscon Quicky-450 (Asscon, Königsbrunn, Germany) type oven (
Figure 1), which is both used in a laboratory environment, in prototyping and low quantity manufacturing by the industry [
24]. The maximum solderable piece height is reportedly 60 mm; the maximum power drawn by the system is 3.3 kW. This oven has a self-supporting structure in the workspace with an electrically operated lift-unit. The controller is responsible for placing the board to a defined level. The control of the oven is based on the principles described in the relevant datasheet [
24] and the Introduction chapter, at the description of HL-VPS.
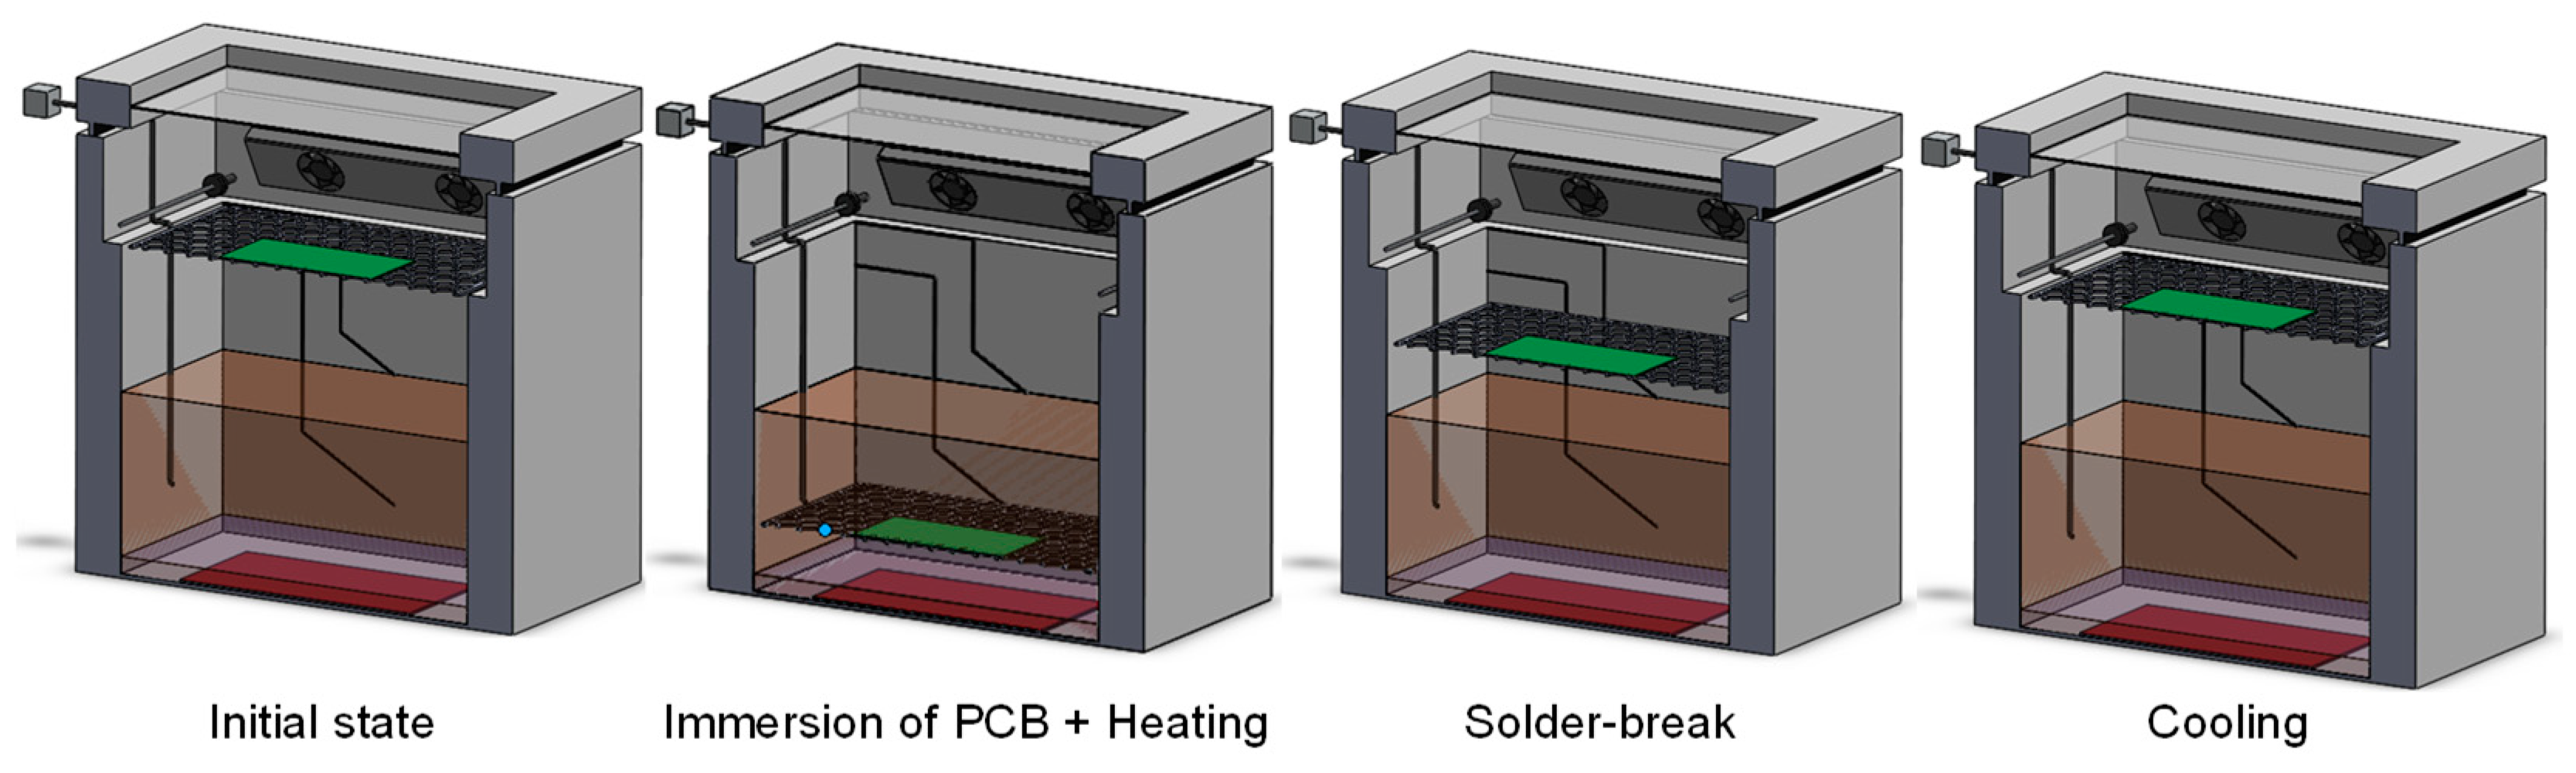
The phases of an HL-VPS soldering process in the applied oven is represented in
Figure 2.
The soldering phase is finished when the temperature reaches the defined temperature limit above the board, and the programmed heating delay is over. Then, the electric motor moves the workpiece carrier to the position of the cooling. In this last phase, the oven closes the reservoir of the vapour and turns on the cooling blowers. When the cooling phase is ended, the machine indicates the safe removal of the assemblies. The glass window allows the observation of the whole soldering process.
Galden fluid was used as the heat-transfer medium. Galden was heated at the lowest point of the workspace with a plate heater. The heating is supposed to be homogeneous along the heater surface, enabling homogeneous vapour build-up. The process zone is oxygen-free when the vapour is saturated; the medium forms a barrier around the lowered PCBA [
25,
26,
27]. The maximum heating temperature is limited by the boiling temperature of the applied Galden fluid. For our experiment, a heat transfer medium with 230 °C boiling point (LS230) was applied, which is widely used in modern lead-free soldering. The boiling point limited temperature eliminates usual overheating damages, common to other soldering methods [
25,
26,
27], such as the delamination of the PCB or the damage to components [
28].
2.3. Applied Sensors
K-type thermocouples (TCs) are integrated initially into the specific points of the workspace and were also retrofitted to the system by us for measurement purposes. The construction of the retrofitted TC is a fast-response, general-purpose welded tip PFA (perfluoroalkoxy) insulated sensor. These TCs can be placed inside the workspace in a flexible manner, without workspace and vapour perturbing fixtures (the TC type is shown in
Figure 3, left.)
The applied K-type TCs have 0.2mm solid conductor covered by insulation PFA layer allowing application in the operating range between −75 °C to +250 °C (ideal for lead-free reflow temperatures) with the precision of ±1 °C (acceptable tolerance, in our case from ambient to 230 °C). The small 0.5 mm diameter of the welded spot enables fast response. The length of the thermocouple wires was chosen so that they can be immersed to the same level as the pressure probe (presented later in
Section 2.4) without perturbing the vapour and leaving any significant impact on the measurement results. A compact thermal profiler (V-M.O.L.E. 3-Channel Thermal Profiler) was used for the TC data acquisition, with a sample rate of 1 s.
Based on the early approximations, the hydrostatic pressure values of the generated vapour column are in the range of 0–30 Pa. The appropriate pressure sensor was chosen for this purpose from the High-accuracy Silicon Ceramic (HSC) series (
Figure 3, right), which has a pressure range of 0–6 kPa (Honeywell, Fort Mill, SC, USA). While the range seems to be large for the purpose, the sensor is considered as highly sensitive among gauge-type products. The HSC Series are piezoresistive gauge silicon pressure sensors, having an analogue output for pressure reading over the full-scale pressure span calibrated for specific ranges. The sensor was acquired in a robust DIP package format (2.54 mm distance between pins). The port has ~2.5 mm diameter; we used a silicone hose with 2 mm inner diameter. Under ~100kPa, clamps are not typically required, so we omitted the use of such fixing [
31]. With an appropriate analogue-digital converter, the resolution can be kept in the sub-Pa range. NI LabView software and a 16-bit NI MyDAQ hardware (NI, Austin, TX, USA) was used for gauge-type pressure sensor data acquisition. With this setup, the pressure resolution can be kept around 0.1 Pa. The sampling was performed on a per-second basis. We consider this sample rate appropriate for monitoring the ~15 min long process.
2.4. Measurement Setup
The experimental setup was based on monitoring the temperature and the pressure of the vapour concurrently. A heat-resistant silicone probe was attached to the positive terminal of the gauge pressure sensor and installed to the vapour space via an insulated outlet. The sensor package was kept outside of the oven, and the other terminal of the gauge sensor the vent was interfaced to the ambient atmosphere. The probe passed through the original sealing and was lowered into the workspace. The opening of the lowered probe was set to the intended PCBA soldering level.
The TC was placed onto the same level as the end of the pressure probe. The influence of the TC thermal capacitance could be omitted because the heating cycles period of the investigation generally takes around 15 min in the workspace, which was conceded as long time compared to the TC response (few seconds).
The process of the soldering starts with the opening of the cover and inserting the assembly on the metal support carrier (sample holder) after an initial medium detection phase.
Figure 4 presents the measurement setup.
The hydrostatic pressure relation (1) was used to identify the vapour column height based on the pressure sensor output data:
where
Pm is the measured pressure [Pa],
ρG is the density of the Galden vapour [kg/m
3];
hVAP is the height [m] of the vapour column,
g is the standard gravity [m/s
2]. The concentration of the Galden vapour is ~20 [kg/m
3] at the saturation temperature.
Actual pressure values can be calculated with the following analogue transfer function (2):
where
Papp [Pa] is the required pressure information,
Pmax [Pa] and
Pmin [Pa] are the maximum, and minimum pressure values in the measurement range,
Vsup [V] is the supplied voltage to the sensor.
In the experiment, we focused on the basic methodology of the oven without PCBA load. The load extends transients in the system, without perturbing the nature of the obtained results, while the flat geometry of a standard PCB thermally blends into the thermal mass of the metal support. For special cases (tall PCBA-s with power electronic component) further investigations are required in the future. At the same time, they can have serious extrusion from the flat geometry of a classic PCBA.
Summing up, the experimental is based on the observation of:
hydrostatic pressure profile, combined with synced temperature measurements;
the maximum of the pressure peaks and height data obtained with different heating power settings;
process steps during the soldering with the heat-level method;
sensor feedback in the case of oven leakage.
For the experiment, the focus was on the heat-level based VPS process in general. The results should be possible to be applied to all HL-based VPS machines. The industrial oven was used as a representative application example.
3. Results and Discussion
3.1. General Validation of the Process: Observation of the Pressure Changes during Heat-Level VPS
Initially, the validation of the process was performed with the analysis of the sensor data over a repeated setting of the oven. The phases were also followed by personal observation, which is—in general practice—not necessary, due to the automated control.
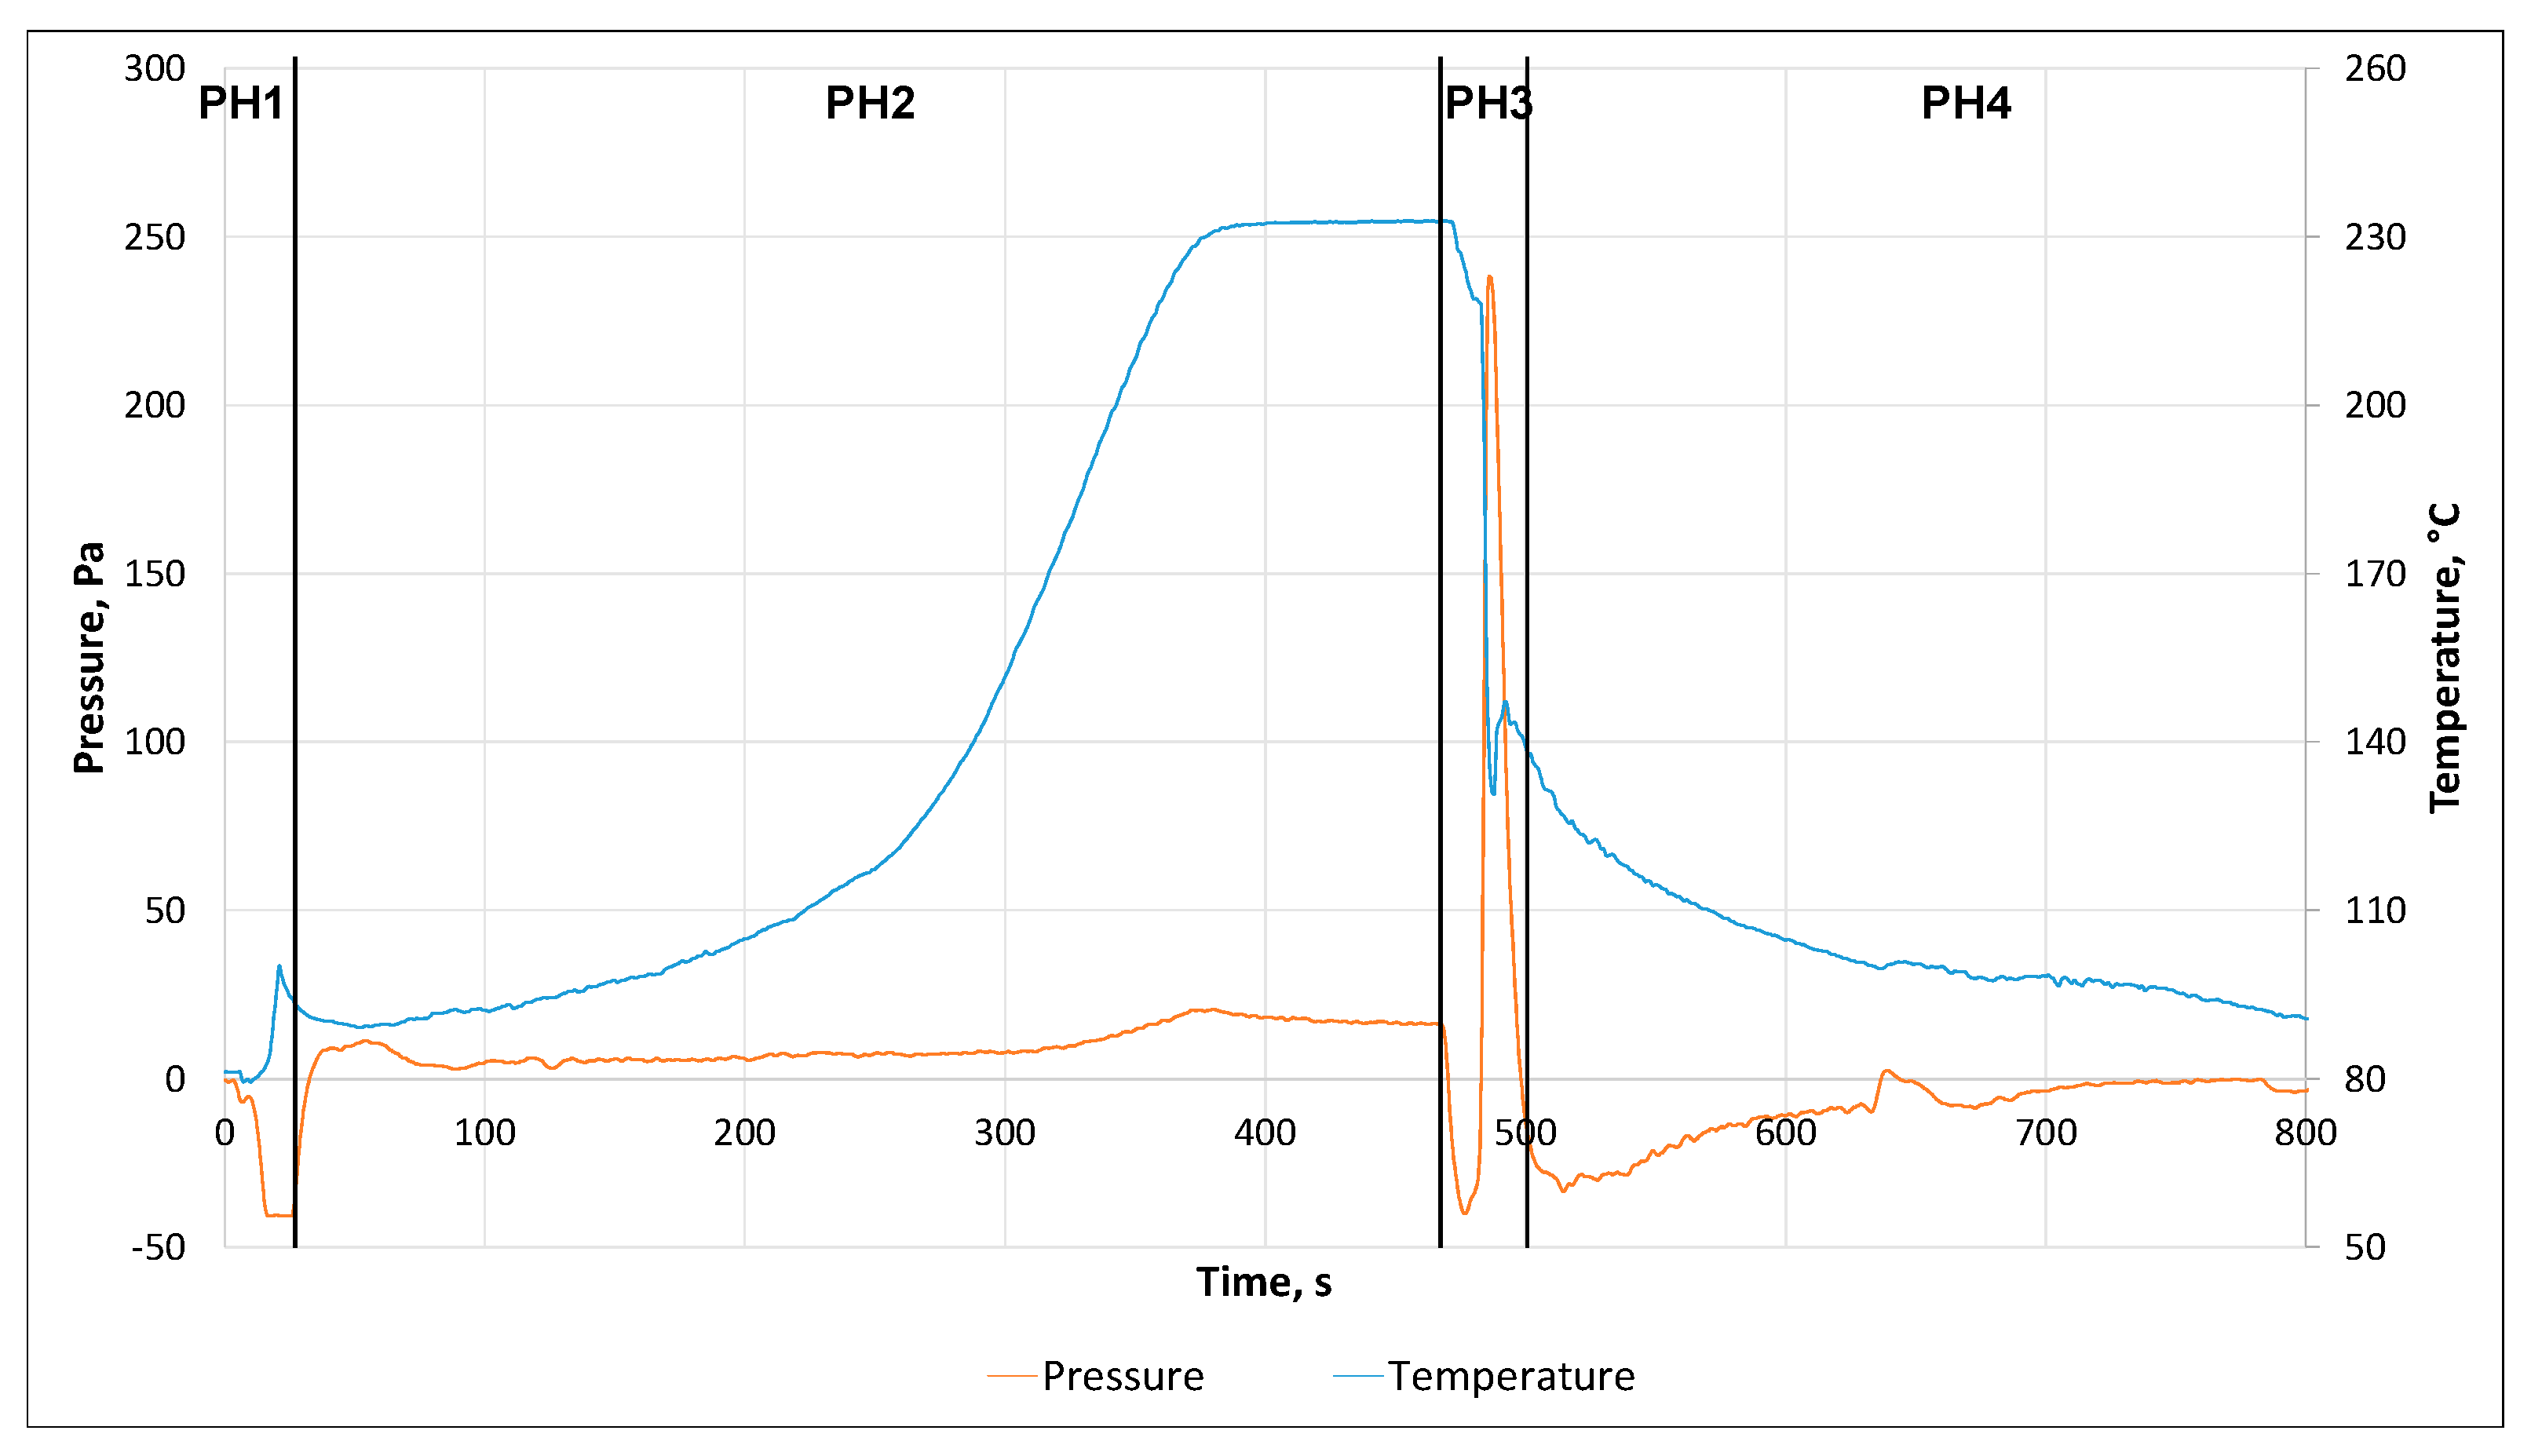
It was found that the identification of the heat-level VPS process is possible in sufficient detail with one gauge-sensor based pressure measurement inside the workspace. During the soldering process, the output of the pressure sensor reveals the phases (PH1-4) of the process in fine details. The four phases are distinguishable by analysing the pressure signal (
Figure 5). The different phases are as follows: the immersion of the PCB, heating, solder-break, and cooling (see
Figure 2 for a graphical representation).
Phase 1 (PH1) represents the immersion of the carrier lift to the depth of the workspace after the closure of the cover (initial state). The pressure decrease is due to the downward movement of the colder carrier, which causes vapour condensation and perturbs the initial state around the heater at the bottom. It should be noted that this phase is approximately similar for every setting, even if the heating power or other process parameters are changed.
During Phase 2 (PH2), the heating phase is presented, which is the main part of the soldering temperature profile. The first part of the phase is suggested to heat the TCs with unsaturated vapour—heating with saturated vapours would result in a step-response feedback on the TC. Heating is more intense in the second part of the phase—concurrently, saturated vapour height increases. The peak of the pressure is much narrower than the temperature peak (shown at around 380 s in the case of
Figure 4.) This indicates that the vapour column generation and reaching its maximum height can be easily monitored by pressure sensors (similar result was already validated on standard VPS processes but with flow sensors [
11]). Usually, the control of the oven is solely based on a temperature basis. According to our findings, it is recommended to expand the general concept of solder profiling with the measurement of pressure peak in fusion with the signals from the temperature sensors. The pressure peaks are later observable in
Figure 6 and
Figure 7 too. Generally, we can assume, that temperature-feedback based control takes a longer time at the detection of the exponential saturation—the time can be reduced, and productivity increased when the temperature is combined with pressure peak detection.
In Phase 3 (PH3), the workpiece carrier moves up after the heating is done, to prepare the VPS for the cooling stage. This step was noted in the introduction section as the soldering “break”. Just as in the first phase, the movement of the support can easily perturb the homogeneity and overall state of the vapour. Therefore, the pressure suddenly shows a decreasing and increasing nature in a short time.
At the start of Phase 4 (PH4), the oven gives a signal that the PCB is ready to be taken out. Additional condensation is caused by the coolers; a significant amount of the vapour transforms back again to the liquid state, which results in a negative swing in the pressure curve. In this stage, the temperature and the pressure inside the oven return to the initial state.
3.2. Gauge Pressure Sensor Response to the Heating Control
The heating power was set to specific values: 60%, 80%, and 100% to investigate the effect of the heating on the pressure and temperature profiles. This setting ultimately affects the actual product—the soldered PCBA and, more specifically, the joint quality. The actual wattage is masked behind the controls of the system, but it is expected that the given maximum reported power drawing of the oven is close to the actual 100% setting. Each set heating value was obtained from experience on the shop floor, from actual manufacturing. This coarse adjustment makes considerable changes in real-life production; finer tuning of the oven was therefore not considered.
Figure 6 presents a selected saturated vapour height plot calculated from the pressure in
Figure 5, according to equation (8). The figure also shows that the pressure curve could well define the most critical part of the heating process. The approximate peak of the pressure reaches around 100 mm height (~20 Pa); the peak occurs in accordance with the saturation of the temperature at the 230 °C. The minor overshoot on 230 °C suggests an insignificant boiling point drift in the applied heat transfer medium.
With the detection of the pressure peak, we are able to enable a faster medium type recognition process in the working cycles of the oven. The recorded temperature is representing the boiling point of the medium when the pressure peak appears.
The signal of the pressure sensor shows a decreasing trend after reaching the peak, which represents the full distribution of the vapour inside the designated workspace. The sensor plot shows a slight relaxation, which eventually settles to a flat plateau (it can be seen after 400 s in the pressure curve in
Figure 5). After the initial peak of the hydrostatic pressure, the height of the column, also the available saturated vapour settles to a steady height. This means that at this point, the oven is practically generating as much vapour, as much is condensed on the PCBA. When the vapour is able to extend above the level of the PCBA, the heated TC breaks the soldering process. It is important to note that heating comes from an unsaturated mixture of vapour and air, which heats up the integrated TC to a pre-programmed level of 150 °C, which also shows that non-saturated vapours are used to break the process.
Figure 7 shows the curves for various heating settings; the maximum of the temperature is not affected in a significant manner; only the time is prolonged.
Heating power affects the resulting measured hydrostatic pressure; consequently, the height of the saturated vapour, which is an important finding—the pressure signal shows that the saturated vapour column reaches different levels when the power of heating is modified (see
Table 1 and
Table 2). The power is presented in percentage as noted before and is suggested to be close to the 3.3 kW indicated in 2.1. It is clear that the time of the saturation depends on the heating power. In case the heating goes lower than 60%, the pressure sensor loses stable and repeatable performance, with flat response curves, meaning that the oven is working on the boundary of producing saturated vapour at the measurement height. For delicate heating, this can be a good approach in reflow soldering; however, the process becomes long and non-practical for actual mass-production. In addition, the importance of the pressure sensor decreases in such cases.
The results in
Table 1 and
Table 2 show that, with lower heating power, the delay between reaching the saturation of the vapour and reaching the maximum temperature becomes slightly longer too. The saturated vapour height around 60% heating power also confirms that the technical maximum height for solderable goods (60 mm—as reported by the datasheet of the oven [
23]) cannot be achieved with such power settings. It should be noted that 60 mm is only necessary for some electronics (e.g., power modules); classical surface mounted PCBA structures are 10–20 mm in height (being flat, as discussed before).
3.3. Effect of Heating Delay on the Vapour Pressure Inside the Workspace
For the next investigation, the heating power was fixed, and the heating delay parameter was varied between 10 s, 15 s, and 20 s. The delay enables longer dwell in the saturated vapour.
After the measurement of the temperature and pressure at three different heating delay settings (10–15–20 s), the curves in
Figure 8 show similar results in the phase of heating regarding temperature increase. It is also interesting to see that the characteristic pressure peaks are very similar. The results suggest appropriate repeatability, and that the measurement accuracy is reasonably acceptable. The common trend is changing at the solder “break” phase, while the ending of the process is successfully prolonged with the delay setting. The rapid pressure peaks also follow this delay, meaning the delay can be validated with pressure measurement graphs. The slight pressure peak differences at the break can appear due to vapour perturbance during the vertical lift movement in the oven. The overshoot amplitude of the peaks and the following relaxation might be affected by maintenance state of the oven, or actual oven workspace and load parameters (volume, geometry). This prevents generalized assumptions regarding the overshoot maximums at this state of the work.
3.4. Leakage Detection with the Gauge-Type Pressure Sensor Feedback
From the previous application, the following hypothesis emerged: the signal from the pressure sensor can be used to reveal leakage of the system. Leakage during actual manufacturing process could be hazardous for the operators of the oven, so a leakage scenario was induced in controlled conditions. The sealing ring was deliberately broken at a given point. For a thorough evaluation, the ring was removed completely; there was no barrier for the vapour to leak from the process zone to the outer atmosphere. The pressure probe and the thermocouple placed inside the oven were kept in the same position for each measurement. The experiment was executed under the heating power of 100%.
Figure 9 show a significant difference in the curves if the sealing is compromised. If the sealing of the workspace is damaged, the conditions of safe operation are also broken, while not only the hot vapours can leave the workspace, but harmful and difficult to sense VOCs (volatile organic compounds) as well (e.g., solder-flux gases).
Focusing on the heating,
Figure 9 is consequential with the previous cases in the sealed case. However, when the sealing is broken, the signal response becomes flat.
According to
Figure 9 and to Figure 11 (see below), the leakage can be identified with the applied pressure sensors. The pressure amplitude drops significantly to a near-zero level when the sealing fails, while the temperature sensors still read similar results to the standard programmed temperature profile. With temperature workspace monitoring, it is not possible to pinpoint slight changes in the sealing (see
Figure 10).
It is recommended to define a practical threshold for the pressure signal at heating power settings above 60%. Should the value does not reach the threshold during heating, the oven controls can warn about a leakage. In a real-life scenario, the hazard in the vicinity of the oven can be reported to the operator at the electronics manufacturing shop floor. In our investigated case, this threshold could be set to 5 Pa, which is sufficient, considering even an unfiltered raw signal, as shown in
Figure 11. The threshold setting should be set for each oven and data acquisition methodology.
4. Conclusions
This paper presents the versatile and novel application of gauge-type pressure sensors in heat-level—vapour phase soldering (HL-VPS) ovens. It was shown in a commercially available VPS oven that the gauge-type sensors could reveal the time point of vapour saturation at the PCB level and the state of the saturated vapour column precisely, improving the characterization of the VPS reflow process.
The current findings show that the usual measurement method with temperature sensors has limitations validating the process of HL-VPS. We showed that hydrostatic pressure measurement at the suggested vertical point of the PCB assembly could distinctively reveal the four phases of the heat-level VPS method. The pressure as a function of time is representing the state of the oven; the exact hydrostatic pressure value provides information about the build-up and exact height of the saturated vapour column. The following four phases are distinguishable in the pressure curves: immersion of PCB, heating, solder-break, and cooling. The pressure sensor readings can be used to validate the heating delay settings of the oven as well. The novel measurement opens new possibilities in smart HL-VPS oven control and more precise time usage of the oven. It was shown that a saturated vapour column for practical use is presently above 50–60% of the heating power, which is a practical lower limit for soldering profiles in the acceptable time window. Our suggestion is to combine the sensor types to enable better profile and peak control, and to reduce idle times of the oven.
It was shown that the high sensitivity gauge-type pressure sensor is applicable for leakage detection as well. The leakage on a VPS oven can cause slow but significant loss of the expensive heat transfer medium. In addition, the leakage can lead to harmful gas contamination of the surrounding working area around the oven. The presented results can not only improve current oven design principles, but they can be retrofitted for OSH (occupation safety and health) improvements in the wake of Industry 4.0 directives on the manufacturing shop floor. For future work, the application of the sensor in VPS ovens based on different heating principles (e.g., Soft-VPS [
7] or Vacuum VPS [
18]) is planned. Analysis of large PCBAs with increased height (e.g., power electronics) is also planned for future work. The current results can be improved with the upcoming generations of gauge sensors with narrower pressure ranges and improved sensitivity.


