Abstract
In this study, the cyclic responses of an offshore wind turbine with a tripod foundation installed on an actual site were evaluated in a centrifuge. To understand the behavior of the turbine at the site, the site soil conditions, environmental loads, and real offshore wind turbine structure installed at the actual site were modeled by considering the centrifuge scaling law. From a series of cyclic loading tests, the cyclic responses of the tripod foundation were evaluated in terms of temporary/permanent displacements and cyclic stiffness. Moreover, the long-term behavior of the tripod foundation was predicted from the experimental results. The test results showed that the initial stiffness of the soil–foundation system decreased as the loading amplitude increased and that the stiffness increased with the number of cycles due to soil densification. The findings revealed that the cyclic behaviors of the tripod were more affected by the load amplitude than the number of cycles. In addition, the permanent rotation increased logarithmically with the number of cycles. A simple method to predict the displacement and change in the foundation stiffness of the actual wind turbine is proposed based on the results of the model tests. The results of this study also provide key insights into the long-term cyclic behavior of tripod foundations for offshore wind turbines.
1. Introduction
Many countries are attempting to reduce environmental pollution due to fossil fuels by utilizing alternative renewable energy sources such as water, wind, solar, and tidal power. In particular, wind power—one of the cleanest energy sources—has shown potential in meeting international renewable energy targets [1,2,3]. Because the levelized cost of energy of wind power has steadily decreased, offshore wind turbines (OWTs) have attracted considerable attention [4]. To secure the competitiveness of offshore wind–energy production, a safe and economical OWT foundation design is crucial because the foundation-construction cost constitutes a large portion of the total OWT cost [5].
Monopiles are frequently used as conventional OWT foundations. In recent years, the suction bucket foundation has been regarded as a highly competitive alternative to the conventional monopile foundation owing to its convenient installation without heavy equipment for penetration and no hammer noise from driving and shorter installation and construction times, leading to reduced cost of the overall installation operation. Tripod foundations, which consist of three suction buckets placed in a triangular shape, can increase the bearing capacity and overturning resistance of the foundation for OWTs. Numerous studies have focused on the behaviors of monopiles and hybrid monopiles. However, very few studies have been conducted on tripod foundations, which have different mechanisms compared to conventional foundations (i.e., monopile and monopods). In addition, design guidelines for tripod foundations have not been established [6,7,8,9,10].
In the past, the evaluation of the ultimate bearing capacity of the offshore foundation based on the limit state design method was considered to be a key design issue. However, the following issues of the OWT design have been highlighted in recent years: (i) the structural natural frequency of the OWTs with respect to the soil–foundation interaction; (ii) the in-service performance under the application of numerous cycles of low-amplitude loads within a service limit state (SLS); (iii) the permanent displacement and variation in the stiffness of the soil–foundation system due to cyclic loading. Byrne et al. [11] suggested that the design should be based on the serviceability requirements rather than the ultimate conditions. The critical design criterion is that the permanent displacement must be lower than the service limit. In addition, the wind turbine system has high stiffness, and the blade and rotor eigenfrequencies provide only a small range of frequencies suitable for the design [12]. Arany et al. [13] proposed a 10-step design protocol for the foundation for OWTs, with emphasis on the necessity of the stability of natural frequency and long-term behavior of OWTs.
In this study, we evaluated the SLS and fatigue limit state (FLS) of a tripod foundation under cyclic loads at a low amplitude and its ultimate limit state (ULS) under cyclic loads at high amplitude. Then, we evaluate the resulting permanent displacement and variation in stiffness of the foundation system. The objective of this study is to guide the assessment of the in-service performance of bucket foundations under cyclic loading.
Recently, it has been declared that Korea plans to establish a 17 GW wind farm by 2030, in line with the government’s renewable-energy policy. Since 2014, the Korea Electric Power Research Institute (KEPRI) has been working on the SUCCESS project, which is aimed at verifying the stability and technical capability of the tripod foundation and at enhancing its applicability by installing a full-scale commercial 3 MW turbine in the western coast of Korea [14]. Three different methods were used to evaluate the natural frequency of the structure: (i) on-site impact load tests, (ii) numerical analysis, and (iii) centrifuge model tests. By comparing the natural frequencies obtained from the three methods, the reliability of the results was analyzed. We evaluated the cyclic behavior of the OWT structure, focusing on the permanent displacement and rotational stiffness. The ground condition was modeled using Semangeum sand, which has the elastic modulus (E) value and stress conditions similar to those of the site in the centrifuge. Further, the structure and environmental load are scaled down based on the centrifugal scaling law deduced by the dimensional analyses to simulate the actual behavior of the tripod foundation in the centrifuge [15].
2. Modeling of Offshore Wind Turbine (OWT)
2.1. Modeling of the Seabed
The testing seabed was prepared to simulate the ground conditions of the site where the OWT was installed. In the natural-frequency calculations, the ground condition was simplified as a rigid spring model. The dynamic behavior of the structure, based on the soil–foundation–structure interaction, depends on the stiffness of the soil–foundation system. Therefore, the aim was to ensure that the E of the soil model is close to the E at the site. Site ground modeling was conducted in three stages: (i) evaluation of soil elastic modulus of the site; (ii) assessment of the modulus value of the soil specimen; (iii) evaluation of the soil E of the soil model prepared for the centrifuge test.
The E of the soil at the site was evaluated based on the results of the two underwater cone penetration tests (CPTs) performed at the same location near the site. The shortest distance between the CPT locations was approximately 85 m. The results of the field CPTs confirmed that the ground had a three-layered structure consisting of silty sand (SM), clay, and SM, as shown in Figure 1.
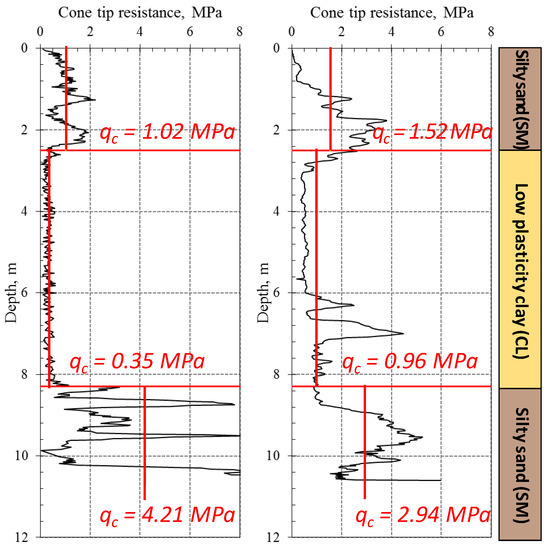
Figure 1.
Cone tip resistance (qc) profiles.
The cone tip resistance (qc) values obtained from the CPT tests were converted to the shear wave velocities using empirical equations for sand and clay. The maximum shear modulus of elasticity Gmax and the E of the soil were calculated as follows:
where , and are the density, shear wave velocity, Poisson’s ratio of soil, respectively. The soil properties of the site are summarized in Table 1. The maximum elastic modulus Emax value was selected as the representative E value.

Table 1.
Basic soil properties at the site.
The soil model was constructed to match the average target Emax values. Owing to the limitations of the model experiments in simulating a large-scale soil structure within a model soil box of 900 mm in diameter and 700 mm in height, the model ground is highly simplified relative to the actual site. The upper SM layer and the clay layer were simulated as one layer because they had similar E values. As a result, the model ground was designed as a double layer, with an upper E value of 18.0 MPa and a lower E value of 48.5 MPa. Figure 2 shows the cross-section of the actual site and soil model.
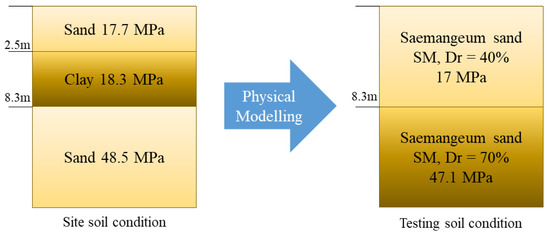
Figure 2.
Elastic modulus (E) of site and soil model.
For the model test, we used Semanguem sand, which is a type of very fine natural sand collected from the reclaimed site of Semanguem on the west coast of Korea, and it was classified as SM based on the unified soil classification system (USCS). The soil properties of Semangeum sand are listed in Table 2. Oedometer tests were performed to obtain the relative density (Dr) of the soil with the target stiffness based on the weight and initial volume of the soil in the cell. The Semangeum samples were compacted by altering the relative density values inside the cell, and a pair of bender elements were installed inside the cell. The upper confining pressure, which increased with depth, was simulated by weighting the upper cell, and in each case, the shear wave velocity (VS) of the soil specimen was measured through bender element tests. The tests were conducted at a Dr of approximately 40–80%. Each cell was tested under dry and saturated conditions and simulated as columnar phases by measuring the vs. under different confining conditions. It was observed that the upper layer, with a Dr of 40%, and the lower layer, with a Dr of approximately 80%, would most appropriately represent the soil stiffness condition of the actual site.

Table 2.
Basic soil properties of Semanguem sand.
A soil specimen was constructed based on the target density. A predetermined amount of a dry soil sample per sublayer was prepared and mixed with water to obtain a water content of 18.1% (the optimal moisture content). The soil specimens were prepared using the moist compaction method. Then, water was added dropwise into the soil surface to saturate the soil specimen until the water reached a depth of 30 mm from the soil surface. As the in situ soils are comprised of the depositional seabed, the model soil prepared by the moist compaction method cannot be fully representative of the field behavior. Mulilis et al. [16] and Polito and Martin [17] showed that the cyclic resistance of moist compacted specimens was higher than that of slurry-deposited specimens, although the initial Dr and E of the tamped sample are similar to those of the deposited specimens.
To measure the E of the soil, we used the beam-type centrifuge at the Geotechnical Centrifuge Testing Center in the Korea Advanced Institute of Science and Technology (KAIST). The centrifuge is a state-of-the-art device with a 5 m radius; its specifications are listed in the study of [18]. To measure the E of the soil model, we performed a centrifuge model test. The soil model was constructed in the soil box, and bender element arrays were installed at different depths, as shown in Figure 3. To accurately measure the shear wave velocity of the soil, structures and other experimental equipment was not installed in this test. Thereafter, the shear wave velocities were measured and converted to the Emax values, as shown in Figure 4. Table 3 lists the locations of the benders and the Emax values measured at different depths.
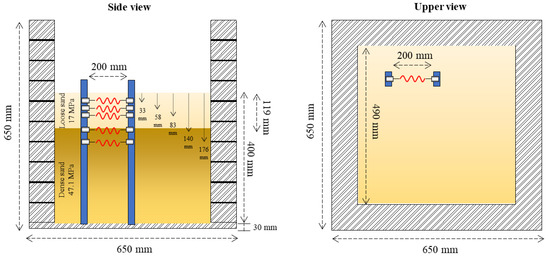
Figure 3.
Schematic of (left) side view and (right) upper view of bender element arrays.
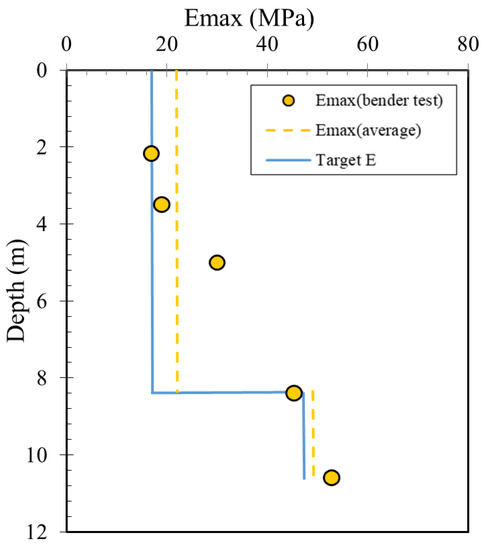
Figure 4.
Soil stiffness with depth calculated by the bender element test.

Table 3.
Depths of bender elements and measured Emax (in prototype).
2.2. Modeling of Wind Turbine Foundation
The small-scale wind turbine system was modeled based on the WinDS3000 3 MW wind turbine manufactured by Doosan Heavy Industries and Construction. As the centrifuge experiment was performed at a 70 g-level, the actual structure was scaled down considering an appropriate centrifuge scaling law [15]. Further, the mass of the structure was adjusted to ensure a natural period equal to that of the actual turbine. In this process, the upper turbine was simplified into a lumped mass, as shown in Figure 5a.
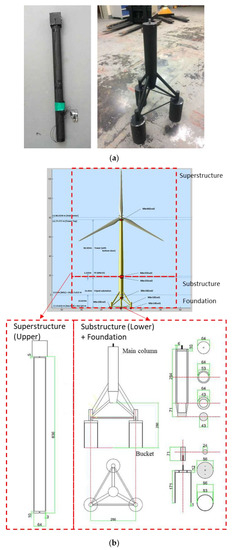
Figure 5.
(a) Photograph and (b) schematic cross-section of offshore wind turbine (OWT) model.
The turbine model was manufactured with steel (SS400) for high stability. The turbine model was divided into three parts—lumped mass, tower, and foundation—and the bolt connections at each end of the tower allowed convenient attachment to the lumped mass and the foundation. Table 4 lists the dimensions of the model and prototype. Conventionally, the ratio of the wall thickness to the diameter of the pile ranges from 0.3% to 0.6%. However, the ratio of the wall thickness to the diameter of the model bucket was 5.8%, owing to fabrication limitations and stability. Figure 5 shows a photograph and cross-section diagram of the turbine model.

Table 4.
Dimensions of the OWT model and prototype.
3. Evaluation of Cyclic Behavior of OWT Foundation under Cyclic Loads
3.1. Testing System and Procedure
The target load was selected as the design load of the OWT demonstration site. The ULS design load of 47,000 kN∙m at the center of the foundation (i.e., the intersection point of the tower and ground surface) was adopted in design load scenarios. The load was assumed to be directed windward with a bucket support, such that it was extremely vulnerable to displacement, as shown in Figure 6. Based on the ULS load, the load amplitudes to be used for each experiment were calculated by the limit state definition introduced in [19]. The testing loads applied in each test are listed in Table 5.
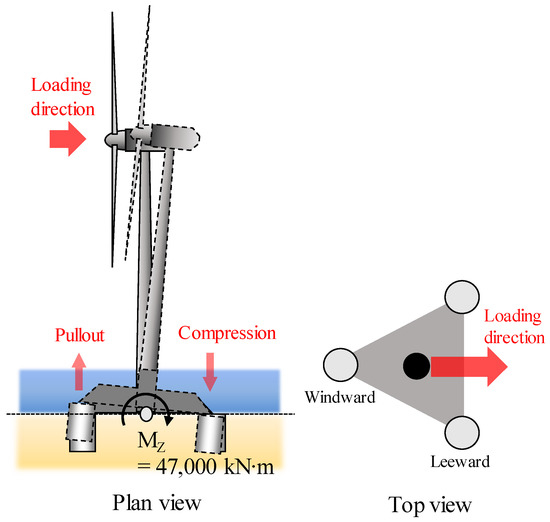
Figure 6.
Direction of loading during testing.

Table 5.
Cyclic loading tests program.
In these tests, the soil was set to be fully drained to exclude the effect of excess pore pressure on the foundation behavior during the loading tests. Although partially drained and undrained conditions may develop in reality, the main purpose of this study is to evaluate the interaction between the skirt and the soil in drained conditions. The OWT was inserted into the saturated soil by using the linear actuator at a constant rate of 0.1 mm/s, ensuring fully drained conditions during the installation process. The fully drained condition of the ground was confirmed based on the following criteria for the normalized penetration velocity (V):
where ν is the loading rate (0.1 mm/s in the model scale), d is the bucket diameter (64 mm in the model scale), and cv is the vertical coefficient of consolidation (3226 mm2/s in the model scale of [20]). In these experiments, is 0.002, which is lower than the maximum V for the drained conditions (i.e., < 0.01) suggested by [21]. Hence, it can be concluded that the monotonic and cyclic behaviors of the bucket observed in these tests indicate a fully drained scenario.
A 1-D horizontal actuator, operated with displacement control, was used to generate cyclic loadings at a centrifugal acceleration of 70 g. The loading actuator could apply the cyclic loading up to 50 cycles continuously. After 50 cycles, the loading sequence was paused for 2 s and then reapplied. To minimize the influence of the frequency, the loading frequencies of all the cyclic tests were maintained at 0.1 Hz. Laser sensors and linear variable differential transformers (LVDTs) were installed to measure the displacement of the tower and buckets of the tripod, respectively. In addition, a load cell was set up to quantify the load applied to each bucket. The data measured by the transducers were collected at a sampling rate of 10 Hz. Figure 7 shows a schematic of the test setup.
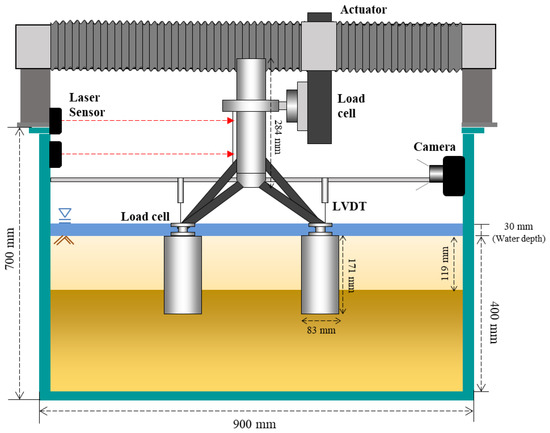
Figure 7.
Centrifuge testing setup for cyclic loading experiment.
The testing program consists of monotonic and cyclic tests. All testing conditions are listed in Table 5. Standard, O [19] proposed the following cyclic design loads: (1) the ULS based on the ultimate capacities, (2) the SLS that occurs approximately 102 times during the lifetime of the wind turbine, and (3) the FLS that occurs approximately 107 times during the lifetime of the wind turbine. The SLS and FLS are estimated to be 50% and 30% of the ULS, respectively [5].
3.2. Evaluation of Cyclic Behavior of OWT Foundation under Different Load Amplitudes
In all the graphs for the cyclic loading tests, the values in the positive direction indicate downward displacement of the bucket and compressive load. All the experiments were performed at a centrifugal acceleration of 70 g. According to the established centrifuge scaling laws based on dimensional analyses, all values recorded in this study are converted to the prototype scales (i.e., Fp = Fm ∙ N2, where Fp and Fm are the force in prototype and model scale, respectively, and N is the centrifugal acceleration relative to the Earth gravity (g)). The definitions of cyclic stiffness (rotational stiffness) and displacements (permanent, incremental, and temporary displacement) are presented in Figure 8.
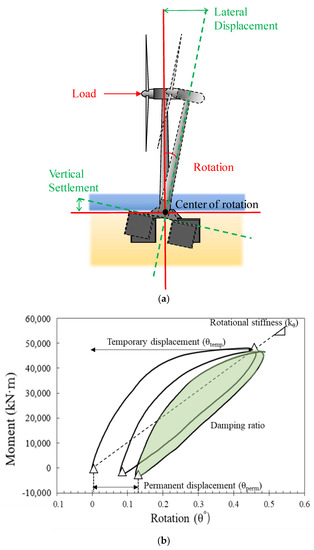
Figure 8.
Definitions of the cyclic stiffness and displacements: (a) schematic for the rotation behavior of tripod foundation and (b) plots of the cyclic characteristics.
Figure 9 shows the typical moment–rotation relationship for different loading levels. All the experiments were progressed from low to high loading level sequentially, ensuring that the pullout force was applied only to the windward bucket (i.e., one-way loading), which is the most vulnerable load condition on the tripod.
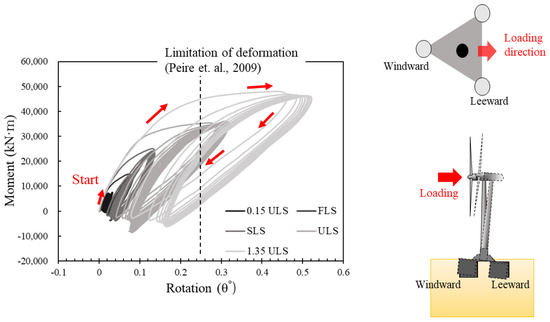
Figure 9.
Moment–rotation curve of cyclic loading tests.
From Figure 9, it can be seen that at each cyclic loading level, the first cycles followed the preceding moment–rotation curve until they reach the preceding maximum load. Thereafter, the slope of the curve dramatically decreased from the point beyond the preceding maximum load. The degree to which the slope decreases relative to the existing curve increases as the loading level increases. The slope of the curve changes significantly during the initial cycle and then changes depending on the number of cycles. In other words, soil–foundation interactions vary depending on the number of cycles as well as the loading level. To evaluate the effects of the load level and cycles in more detail, the loading stiffness and damping curves are plotted based on this moment–rotation curve.
Figure 10 shows the foundation stiffness measured with increasing load amplitude for all the experiments. From the figure, it can be seen that as the loading amplitude increases, the initial rotational stiffness (kL(0)) of the foundation tends to decrease relative to the loading magnitude due to the soil nonlinearity [22]. Hussain and Sachan [23] discussed the effect of the cyclic loading amplitude on the dynamic properties (i.e., shear modulus and damping ratio) of the SM from the results of extensive cyclic triaxial tests. They found that the strain amplitude significantly affects both the shear modulus and the damping ratio. This is consistent with the observation that the rigidity of the bucket foundation decreases as the loading level increases [20,24].
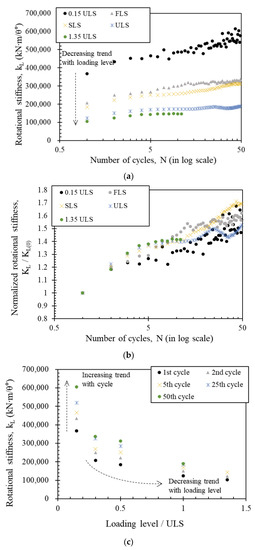
Figure 10.
Loading stiffness responses with loading amplitudes: (a) ground stiffness–number of cycles curve; (b) normalized stiffness with respect to first cycle stiffness; (c) ground stiffness–normalized loading level curve.
Furthermore, the stiffness changes the number of cycles and the loading amplitude. In the 0.15 ULS, FLS, and SLS test cases, where the load magnitudes were less than 50% of the ULS, the stiffness rapidly increased as the number of cycles increased. In other words, even with small loads, soil densification occurs substantially as the number of cycles increases, resulting in a significant increase in the ground stiffness. However, in the case of the large-amplitude loading tests (ULS and 1.35 ULS), the increase in stiffness is relatively small compared to that in the small-amplitude loading tests. Generally, fatigue failure may be one of the causes of the alleviation of the increase in cyclic stiffness. According to [25], fatigue failure may occur due to the accumulation of deformations. They found that the cyclic shear strain continuously increases with the ratio of the average shear stress to the cyclic shear stress, and fatigue failure occurs when the cumulative shear strain exceeds a limiting strain. Consequently, the number of cycles required to reach fatigue failure increases exponentially, and the fracture does not occur suddenly. In other words, fatigue failure may be one of the causes of the alleviation of the increase in cyclic stiffness. Another possible factor is the soil preparation method (i.e., the compaction method in this study), which affects the deformational behavior of the soil for the cyclic loadings [26,27]. Moreover, the loss of shear strength due to gaps between the foundation and the soil could be one of the reasons for the decrease in the resistance. When cyclic pullout loads act on the soil, the soil softens owing to ground disturbance and the gaps at the side of the bucket [28]. Additionally, the pullout loads with rotational force cause a decrease in the frictional contact resistance between the sand and steel [29]. As a result, the stiffness does not noticeably increase further, unlike in the case with smaller loads.
Figure 10b shows the increase in stiffness normalized to the initial stiffness. In contrast to the amount of increase in stiffness, the ratio of increase in stiffness to the initial stiffness does not depend on the load. Therefore, because the rate of stiffness change strongly depends on the initial stiffness, it important to predict the initial stiffness of the soil accurately.
Figure 10c shows the stiffness as a function of the loading level with different numbers of cyclic loads. The results show that the stiffness change decreased with the loading level and increased with the number of cycles. These findings are similar to the results of previous studies on the cyclic behavior of tripod foundation for the wind turbine [20,30].
The foundation stiffness is an indicator of the ability of the foundation to resist the temporary displacement when a load is applied to the structure (i.e., resistance to displacement). The damping ratio, which is determined by calculating the area under the load–displacement closed curve, indicating the degree of residual displacement caused by loading and unloading. In other words, the damping ratio generally matches the degree of permanent displacement due to cyclic loading and tends to be the opposite of the stiffness of the soil–foundation systems. Therefore, to understand the displacement induced by the external load, both the foundation stiffness as well as the damping ratio should be considered.
Figure 11 shows a plot of the damping ratio as a function of the temporary rotation per cycle. For the various load amplitudes, the damping ratio increases significantly with the load level, which is consistent with the increased displacement. Moreover, it can be seen that the damping ratio decreases owing to soil densification due to the cyclic loads. This decrease is large in the early cycle and then reduces, which agrees with the results of [23]. In particular, in the case of the large loading tests (ULS and 1.35ULS), there is a large difference in rotation displacement due to the change in damping ratio. In other words, when a large load is applied repeatedly, the difference in damping ratio, rather than the stiffness, has a significant influence on the displacement. This is because the stiffness does not differ much in the case of large loading tests.
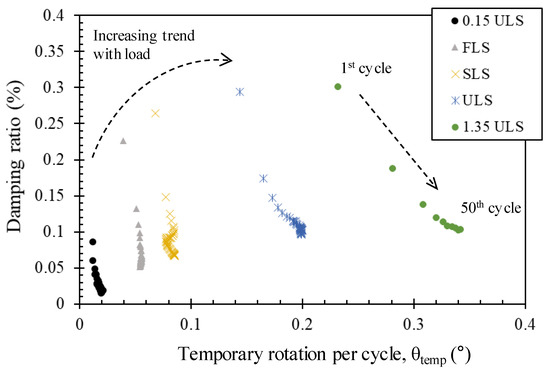
Figure 11.
Damping ratio–rotation curve under different load amplitudes.
Figure 12 shows a plot of the cyclic stiffness as a function of the temporary rotation per cycle with different loading amplitudes. It can be seen that the foundation stiffness exhibits a tendency opposite to that of the damping ratio. As the load level increases, the stiffness decreases, and soil densification occurs as the number of cycles increases. Further, the change in foundation stiffness in the initial cycle occurs rather prominently during the cycles, similar to the change in damping. Consequently, the displacement of the OWT foundation is affected by both stiffness and damping ratio, and these have various cyclic behaviors depending on the load level and cycles. Therefore, to accurately analyze the long-term behavior of the OWT, it is necessary to consider both the stiffness and the damping ratio.
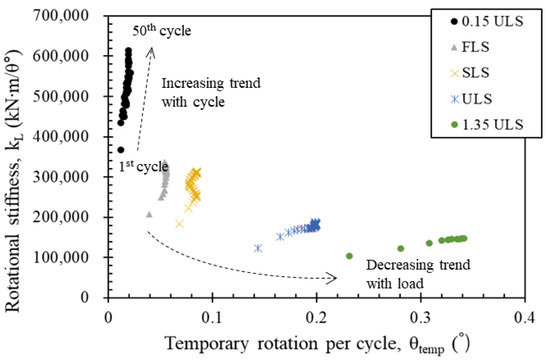
Figure 12.
Cyclic stiffness–rotation curve under different load amplitudes.
3.3. Estimation of Long-Term Behavior of OWT
For the design of the serviceability limit state of an OWT based on the load and resistance factor design, the evaluation and prediction of the permanent displacement must be ensured. According to [31], an offshore wind generator with a permanent displacement of 0.25° or more has very low-efficiency. In addition, the China Hydro and Water Research Institute [32] suggested that the displacement criterion should be less than 0.17°. In this study, as a part of the long-term behavior evaluation for the performance-based design of OWTs, the accumulated rotation of large-scale OWTs due to cyclic loads was experimentally analyzed and predicted. Figure 13 shows a permanent rotation trend with the load levels and cycles. It can be seen that the permanent rotation increases slightly with the number of cycles under the SLS, where the magnitude of the load is small, and the permanent displacement is large in the early cycles and gradually converges. Therefore, the evaluation of the permanent displacement in the early cycle is important to assess the safety of the long-term behavior. These results are to those of previous studies on the cyclic behavior of the tripod foundation [20,30].
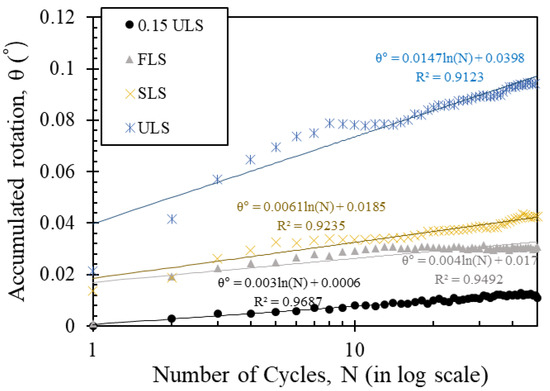
Figure 13.
Prediction curves of permanent displacement of on-site OWT.
Table 6 presents some predictions of the permanent rotation made using the trend curve for the SLS test in Figure 13. These results were obtained with an SLS load of 23,500 kN·m. In other words, based on the prediction method of permanent rotation, as shown in the example (i.e., Figure 13 and Table 6), it is possible to predict the long-term behavior of the offshore wind tower with respect to the loading levels and cycles.

Table 6.
Predictions of long-term permanent rotation of on-site OWT.
The prediction of the stiffness and permanent displacement (i.e., accumulated rotation) of the foundation is important to ensure stability because the stiffness affects the natural frequency of the OWT and the temporary displacement of the structure. In particular, the temporary displacement of the foundation is significantly larger than the permanent displacement even when the numbers of cycles and loading levels are small. Figure 14 shows a plot of the stiffness change of the foundation with respect to the number of cycles.
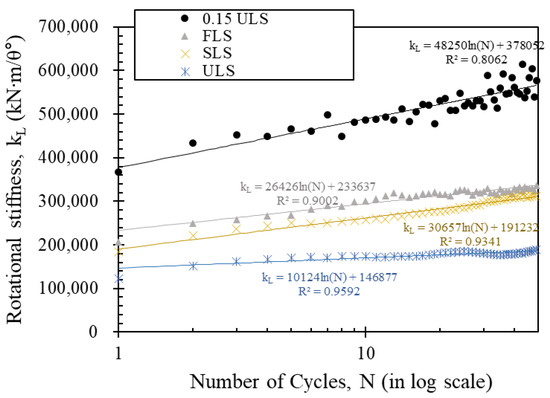
Figure 14.
Prediction curves of cyclic stiffness of site demonstration OWT.
Table 7 presents some results of the stiffness predicted when the FLS, SLS, and ULS loads are repeatedly applied. Based on the predicted stiffness, the temporary rotation of the foundation can be expected. Table 8 shows the results of the corresponding temporary rotation prediction. The estimated stiffness values can be predicted based on the loading level and cycles. In this state, the estimated stiffness values represent the temporary rotation corresponding to the application of a particular moment load. As shown in Table 8, when a moment load of 47,000 kN·m (ULS) is applied to the structure, the temporary rotation exceeds the OWT displacement criteria.

Table 7.
Example of estimation of long-term stiffness of on-site OWT.

Table 8.
Example of estimation of long-term stability of on-site OWT.
Additionally, the long-term natural frequency of the structure was evaluated based on the equivalent stiffness and mass of the system as follows [13]:
where , , and is the natural frequency, equivalent stiffness, and equivalent mass of the system, respectively. Table 8 shows the results of the natural frequency of the structure calculated based on the stiffness estimated from the cyclic loading tests. According to [33], the OWT structure is stable in the natural frequency range of 0.17–0.35 Hz. When this structure is loaded with the FLS load 107 times, the natural frequency is approximately 0.42 Hz, which does not comply with the stability criterion of the OWT. In other words, it can be concluded that the long-term stability of the structure is not ensured based on the natural frequency, and the structure is therefore unsafe in a long-term perspective.
This study has some limitations. Only 50 cycles were applied for each test. To accurately predict the long-term behavior, tests with more loading cycles (e.g., 100 cycles in the SLS state, 107 cycles in the FLS state) should be conducted. Nonetheless, Jeong et al. [5] found that the cyclic behaviors (i.e., permanent displacement; cyclic stiffness) are proportional to the number of cycles on a log scale. In other words, the trend of cyclic behavior mainly changes initially and tends to gradually converge as the number of cycles increases. In this study, we demonstrated the possibility of using centrifugal modeling research to predict long-term behaviors.
4. Conclusions
We investigated the cyclic behavior of a tripod foundation for OWT, particularly in terms of the permanent displacement and soil stiffness. Because it is difficult to predict the long-term cyclic behavior of on-site OWTs, centrifuge model tests were performed to assess the long-term stability of the structure under cyclic loading. To simulate the behavior of the demonstration turbine installed at the site using the centrifuge, a soil layer similar to that of the actual site was modeled, and the structure and environmental loads were simulated. The following conclusions were drawn based on the results of the tests:
- Large permanent displacement occurred when the first loading cycle was applied, and the amount of additional displacement gradually decreased as the load was reapplied. Moreover, it was found that the increase in permanent displacement was affected more by the loading level than the number of cycles;
- The initial rotational stiffness of the tripod foundation decreased as the cyclic loading amplitude increased. In addition, the soil stiffness mainly increased in the first cycles and tended to gradually converge as the number of cycles increases. Moreover, the rotational stiffness rapidly increased as the number of cycles increased with 0.15 ULS, FLS, and SLS loadings, where the load magnitude was less than 50% of the ULS. On the other hand, in the case of the large-amplitude loading tests (ULS and 1.35 ULS), the increase in stiffness was relatively small;
- The damping ratio also increased with the load level, which is consistent with the increased displacement. In particular, the damping ratio had a significant influence on the displacement;
- The permanent rotation and the variation in the foundation stiffness due to the cyclic load increased logarithmically with the number of cycles. Therefore, the long-term performance of the OWT depending on the loading level and cycles can be predicted based on the trend. The long-term natural frequency of the structure was evaluated based on the predicted stiffness and mass of the system, and it was found that the long-term stability of the structure was not ensured when the structure was loaded with an FLS load 107 times.
The long-term behavior of the OWT installed at the actual site was evaluated using centrifugal model tests. Although the actual OWT structure and in situ soil were properly modeled, the experimental results must be further verified because the actual OWT was simplified, and the soil preparation method cannot accurately simulate the on-site soils. Therefore, in the future, the results should be verified and expanded by comparing them with measurement results (change in the natural frequency and permanent rotational displacement) obtained from the on-site OWT. In addition, the experimental results with more loading cycles would be necessary to accurately predict the long-term behavior of the offshore wind turbine with a tripod foundation.
Author Contributions
Conceptualization, Y.-H.J. and J.-H.K.; data curation, Y.-H.J.; writing—original draft preparation, Y.-H.J.; writing—review and editing, J.-H.K.; supervision, J.-H.K.; project administration, S.-W.L.; Formal Analysis, Y.-H.J.; Investigation, Y.-H.J. All authors have read and agreed to the published version of the manuscript.
Funding
This work was supported by the National Research Foundation of Korea (NRF) Grant funded by the Korean Government (Ministry of Science and ICT) (2017R1A5A1014883).
Institutional Review Board Statement
Not applicable.
Informed Consent Statement
Not applicable.
Data Availability Statement
Not applicable.
Conflicts of Interest
The authors declare no conflict of interest.
References
- European Environment Agency. Renewable Energy in Europe 2016: Recent Growth and Knock-On Effects. EEA Report 4/2016. 2016. Available online: https://www.eea.europa.eu/publications/renewable-energy-in-europe-2016 (accessed on 13 February 2021).
- Igwemezie, V.; Mehmanparast, A.; Kolios, A. Current trend in offshore wind energy sector and material requirements for fatigue resistance improvement in large wind turbine support structures—A review. Renew. Sustain. Energy Rev. 2019, 101, 181–196. [Google Scholar] [CrossRef]
- McAuliffe, F.D.; Murphy, J.; Lynch, K.; Desmond, C.; Norbeck, J.; Nonås, L.M.; Attari, Y.; Doherty, P.; Sorensen, J.D.; Giebhardt, J.; et al. Driving Cost Reductions in Offshore Wind—The LEANWIND Project Final Publication. LEANWIND Proj. 2017. Available online: https://eletaen.gr/wp-content/uploads/2018/06/2017-11-27-leanwind-driving-cost-reductions-in-offshore.pdf (accessed on 13 February 2021).
- Lantz, E.; Hand, M.M.; Wiser, R. Past and future cost of wind energy. National Renewable Energy Lab. (NREL), Golden, CO (United States). 2012. Available online: https://www.nrel.gov/docs/fy12osti/54526.pdf (accessed on 13 February 2021).
- Jeong, Y.-H.; Kim, J.-H.; Park, H.-J.; Kim, D.-S. Cyclic behavior of unit bucket for tripod foundation system supporting offshore wind turbine via model tests. Wind. Energy 2019, 22, 257–268. [Google Scholar] [CrossRef]
- Leblanc, C.; Houlsby, G.T.; Byrne, B.W. Response of stiff piles in sand to long-term cyclic lateral loading. Géotechnique 2010, 60, 79–90. [Google Scholar] [CrossRef]
- Leblanc, C.; Byrne, B.W.; Houlsby, G.T. Response of stiff piles to random two-way lateral loading. Géotechnique 2010, 60, 715–721. [Google Scholar] [CrossRef]
- Choo, Y.W.; Kim, D.; Park, J.; Kwak, K.; Kim, J.; Kim, D. Lateral Response of Large-Diameter Monopiles for Offshore Wind Turbines from Centrifuge Model Tests. Geotech. Test. J. 2014, 37, 107–120. [Google Scholar] [CrossRef]
- Wang, X.; Zeng, X.; Yang, X.; Li, J. Feasibility study of offshore wind turbines with hybrid monopile foundation based on centrifuge modeling. Appl. Energy 2018, 209, 127–139. [Google Scholar] [CrossRef]
- Wang, X.; Zeng, X.; Li, J.; Yang, X. Lateral bearing capacity of hybrid monopile-friction wheel foundation for offshore wind turbines by centrifuge modelling. Ocean Eng. 2018, 148, 182–192. [Google Scholar] [CrossRef]
- Byrne, B.W.; Houlsby, G.T. Experimental Investigations of the Response of Suction Caissons to Transient Combined Loading. J. Geotech. Geoenviron. Eng. 2004, 130, 240–253. [Google Scholar] [CrossRef]
- Bienen, B.; Klinkvort, R.T.; O’Loughlin, C.D.; Zhu, F.; Byrne, B.W. Suction caissons in dense sand, part II: Vertical cyclic loading into tension. Géotechnique 2018, 68, 953–967. [Google Scholar] [CrossRef]
- Arany, L.; Bhattacharya, S.; Macdonald, J.; Hogan, S.J. Design of monopiles for offshore wind turbines in 10 steps. Soil Dyn. Earthq. Eng. 2017, 92, 126–152. [Google Scholar] [CrossRef]
- Korea Electric Power Research Institute. SUCCESS Project Report for Wind Farm Development Technology; Korea Electric Power Research Institute: Seoul, Korea, 2014. [Google Scholar]
- Garnier, J.; Gaudin, C.; Springman, S.M.; Culligan, P.J.; Goodings, D.; Konig, D.; Kutter, B.; Phillips, R.; Randolph, M.F.; Thorel, L. Catalogue of scaling laws and similitude questions in geotechnical centrifuge modelling. Int. J. Phys. Model. Geotech. 2007, 7, 1–23. [Google Scholar] [CrossRef]
- Mulilis, J.P.; Seed, H.B.; Chan, C.K.; Mitchell, J.K.; Arulanandan, K. Effects of Sample Preparation on Sand Liquefaction. J. Geotech. Eng. Div. 1977, 103, 91–108. [Google Scholar] [CrossRef]
- Polito, C.P.; Martin, J.R., II. Effects of nonplastic fines on the liquefaction resistance of sands. J. Geotech. Geoenviron. Eng. 2001, 127, 408–415. [Google Scholar] [CrossRef]
- Kim, D.-S.; Kim, N.-R.; Choo, Y.W.; Cho, G.-C. A newly developed state-of-the-art geotechnical centrifuge in Korea. KSCE J. Civ. Eng. 2013, 17, 77–84. [Google Scholar] [CrossRef]
- STANDARD, Offshore. Design of Offshore Wind Turbine Structures. DET NOR SKE VERITAS. 2007. Available online: http://huniv.hongik.ac.kr/~geotech/key%20reference/Offshore%20standard%20(DNV%20OS%20J101%202007).pdf (accessed on 13 February 2021).
- Kim, D.-J.; Choo, Y.W.; Kim, J.-H.; Kim, S.; Kim, N.-S. Investigation of Monotonic and Cyclic Behavior of Tripod Suction Bucket Foundations for Offshore Wind Towers Using Centrifuge Modeling. J. Geotech. Geoenviron. Eng. 2014, 140, 04014008. [Google Scholar] [CrossRef]
- Finnie, I.M.S.; Randolph, M. Punch-through and liquefaction induced failure of shallow foundations on calcareous sediments. In Punch-Through and Liquefaction Induced Failure of Shallow Foundations on Calcareous Sediments; Pergamon: Oxford, UK, 1994; pp. 217–230. [Google Scholar]
- Youn, J.-U.; Choo, Y.-W.; Kim, D.-S. Measurement of small-strain shear modulus Gmax of dry and saturated sands by bender element, resonant column, and torsional shear tests. Can. Geotech. J. 2008, 45, 1426–1438. [Google Scholar] [CrossRef]
- Hussain, M.; Sachan, A. Effect of loading conditions and stress history on cyclic behavior of Kutch soil. Géoméch. Geoengin. 2020, 15, 233–251. [Google Scholar] [CrossRef]
- Villalobos, J.F.A. Model Testing of Foundations for Offshore Wind Turbines. Ph.D. Thesis, University of Oxford, Oxford, UK, 2006. [Google Scholar]
- Goulois, A.; Whitman, R.; Hoeg, K. Effects of Sustained Shear Stresses on the Cyclic Degradation of Clay. In Strength Testing of Marine Sediments: Laboratory and In-Situ Measurements; ASTM International: West Conshohocken, PA, USA, 2008; p. 336. [Google Scholar]
- Stewart, J.P.; Bray, J.D.; McMahon, D.J.; Smith, P.M.; Kropp, A.L. Seismic Performance of Hillside Fills. J. Geotech. Geoenviron. Eng. 2001, 127, 905–919. [Google Scholar] [CrossRef]
- Hussain, M. Static and Cyclic Liquefaction Characteristics of Kutch Soils. Ph.D. Thesis, Indian Institute of Technology Gandhinagar, Palaj, India, 2019. [Google Scholar]
- Houlsby, G.T.; Kelly, R.B.; Huxtable, J.; Byrne, B.W. Field trials of suction caissons in sand for offshore wind turbine foundations. Géotechnique 2006, 56, 3–10. [Google Scholar] [CrossRef]
- Uesugi, M.; Kishida, H.; Tsubakihara, Y. Friction Between Sand and Steel Under Repeated Loading. Soils Found. 1989, 29, 127–137. [Google Scholar] [CrossRef]
- Jeong, Y.; Ko, K.; Kim, D.; Kim, J. Studies on cyclic behavior of tripod suction bucket foundation system supporting offshore wind turbine using centrifuge model test. Wind. Energy 2020, 1–15. [Google Scholar] [CrossRef]
- Peire, K.; Nonneman, H.; Bosschem, E. Gravity Base Foundations for the Thornton Bank Offshore Wind Farm. Terra et Aqua. 2009, pp. 19–29. Available online: https://pdfs.semanticscholar.org/590e/56c8e73f3562815926d15ffb62bf90a00ccc.pdf?_ga=2.98545951.1856222366.1613190767-1573885925.1595580422 (accessed on 13 February 2021).
- Hydropower and Water Resources Planning and Design General Institute. Design Regulations on Subgrade and Foundation for Wind Turbine Generator System; FD003-2007; China Water Power Press, Ministry of Water Resources of China: Beijing, China, 2008; Available online: https://www.codeofchina.com/standard/FD003-2007.html (accessed on 13 February 2021).
- Shadlou, M.; Bhattacharya, S. Dynamic stiffness of monopiles supporting offshore wind turbine generators. Soil Dyn. Earthq. Eng. 2016, 88, 15–32. [Google Scholar] [CrossRef]
Publisher’s Note: MDPI stays neutral with regard to jurisdictional claims in published maps and institutional affiliations. |
© 2021 by the authors. Licensee MDPI, Basel, Switzerland. This article is an open access article distributed under the terms and conditions of the Creative Commons Attribution (CC BY) license (http://creativecommons.org/licenses/by/4.0/).