Abstract
Cup-plant (Silphium perfoliatum L.) stalks were investigated as a potential wood-replacement in particleboards (PBs). Two types of PBs were produced—(1) single-layer and (2) three-layer boards. In the three-layer cup-plant PB, the core layer was made from cup-plant, while the surface layer consisted of spruce particles. The cup-plant as well as spruce control panels were produced with polymeric methylene diphenyl diisocyanate (pMDI) as the adhesive, with the physical and mechanical properties measured to meet class P1 of the European EN 312 standard. For the intrinsic morphology of the particleboards, scanning electron microscopy was applied. Wood-based and cup-plant-based particleboards indicated significant differences in morphology that affect the resulting properties of particleboards. Furthermore, an innovative approach was used in the determination of the pMDI bondline morphology. With a compact Time-of-Flight Secondary Ion Mass analyser, integrated in a multifunctional focused-ion beam scanning-electron-microscope, it was possible to show that the Ga+ ion source could be detect and visualize in 3D ion molecular clusters specific to pMDI adhesive and wood. Mechanical performance data showed that cup-plant particleboards performed well, even though their properties were below the spruce-made controls. Especially the modulus of rupture (MOR) of the cup-plant PB was lowered by 40%, as compared to the spruce-made control board. Likewise, thickness swelling of cup-plant made boards was higher than the control. Results were linked to the specific porous structure of the cup-plant material. In contrast, it was shown that three-layer cup-plant PB had a higher MOR and also a higher modulus of elasticity, along with lower thickness swelling, compared to its single-layer cup-plant counterpart. The industry relevant finding was that the three-layer PB made from cup-plant stalks fulfilled the EN 312 standard, class P1 (usage in dry conditions). It was shown that raw material mixtures could be useful to improve the mechanical panel performance, also with an altered vertical density profile.
1. Introduction
Wood is the traditional and prime raw material in particleboards production since 1887, and annual production volumes in Europa exceed 30 million m3 [1]. Considering the high production volumes, declining stocks of natural resources [2], i.e., possible future wood shortage situations, could play important roles. In addition, as the use of potentially contaminated waste wood in particleboards reaches 90% in some European countries, it could create environmental concerns, with a higher request for alternative non-contaminated materials.
Non-wood materials could also be utilized in particleboard (PB) production, which have the advantages of achieving higher resource-effectiveness, at ecologically and economically viable conditions. While agricultural crops are primarily cultivated for food, for various chemical products, or for biogas production [3], unutilized plant parts could be potentially processed to PBs. Using agricultural residues for PBs might have economic benefits for manufacturers, as the expenses for residues and wastes might be below market prices for wood [4]. Likewise, the utilization of waste materials in industrial production is also reducing environmental burdens, as residues such as stalks, husks, or straw are often left on the fields, or even burned.
Cup-plants seem to be a reasonable candidate for replacing wood in PBs. Dry mass yield between 11 t/ha and 20 t/ha per harvest is high and might compete with the yield achieved in forests, which can be ~16 t/ha per harvest [5]. Cup-plant (Silphium perfoliatum L.) originates in Eastern North America [6], but is now well-established across Central Europe. Although it was grown in gardens as an ornamental plant during the 18th century, today it is widely cultivated for energy production [7]. Cup-plant characteristics, including aspects of cultivation and utilization, including particleboard manufacturing have been demonstrated [8].
Particleboards from rice straw or rice husks [9,10,11,12], wheat straw [13], sunflower stalks [14,15,16,17], from vine prunings [18], cotton stalks [19], apple and plum orchard prunings [20], or even teal oil camellia [21], were already shown, i.e., produced. Balducci et al. [22] and Dix et al. [23] introduced residues of several Central European agricultural plants as a raw material for low density PBs, and Selinger and Wimmer [24] introduced light-weight sandwich PBs from hemp shives and fibers. It is obvious that agricultural resources could provide materials to replace wood in PBs, even if their property profiles are generally below conventional PBs. As the mechanical properties of PBs made with alternative materials are lowered, the anatomical structure and morphology of the utilized particles are of ultimate importance due to the close connections to the relevant properties [25].
Various microscopic techniques were applied to describe the anatomical and structural composition of wood-based composites. As an example, scanning electron microscopy was used for describing anatomical structures in PBs [26]. However, due to the lignocellulosic nature of the samples, there is insufficient compositional contrast to distinguish clearly between wood fractions, and adhesive bondlines [27]. To this end, elemental mapping by means of electron dispersive X-rays might be a feasible method. However, Electron Dispersive X-rays (EDX) techniques are also limited by their spatial resolution, sensitivity, or the ability to detect and map molecules that are indicative of wood-adhesive bondlines, particularly when wood and the used adhesive are both represented by the same chemical elements, albeit different molecular clusters. Here, the alternative method Time-of-Flight Secondary Ion Mass Spectrometry (TOF-SIMS) is suggested. Lately, TOF-SIMS was integrated into focused-ion-beam scanning-electron-microscope (FIB-SEM) TESCAN instruments [28], which brings additional advantages such as high spatial resolution (>5 nm) to elemental mapping, as well as simultaneous ion and SEM imaging. It was shown that TOF-SIMS (single instrument) can describe the distribution of molecules in biological systems [29] and also in wood tissues [30,31,32,33], but the use of TOF-SIMS for mapping the molecular distribution in adhesive-wood phases was not demonstrated so far. Consequently, the following hypotheses are stated:
Hypothesis 1 (H1).
Compact time-of-flight ion mass analyser (C-TOF) is capable of detecting elements and molecules specific to pMDI adhesion status.
Hypothesis 2 (H2).
The penetration of the adhesive can be visualized in 3D using TOF-SIMS data.
Hypothesis 3 (H3).
The mechanical properties of PBs made from the cup-plant fulfil industrial standards (EN 312, class 1).
Hypothesis 4 (H4).
A three-layer PB made from cup-plant particles in the core layer, and spruce particles in the surface layer, could show improved properties over a single-layer produced panel.
2. Materials and Methods
Single-layer as well as three-layer particleboards (PBs) were produced using cup-plant stalk particles (Silphium perfoliatum L.). Stalks were 1.8 m long and square-sized with 25 × 25 mm2. As a control, single-layer and three-layers PBs were also produced using spruce particles (Picea abies [L.] Karst). The material was first chipped in a Klöckner chipper 120 × 400 H2W.T (Klöckner Maschinenfabrik, Lauenburg, Germany), at a cutting speed of 725 rpm, and a feeding speed of 1 m/s. The obtained chips approximately sized 20 × 10 × 5 mm3 were then milled in a Condux-Werk HS 350 (Condux Maschinenbau GmbH & Co. KG, Hanau—Wolfgang, Germany) hammer mill. Afterwards, the particles were screened in the cascade vertical drum screener Allgaier D7336 (Allgaier-Werke GmbH, Uhingen, Germany). The sieve screens had mesh size openings of 5.0 mm, 3.15 mm, 1.24 mm, and 0.60 mm, respectively. Particles used to manufacture PBs were taken from the sieves with openings between >3.15 mm and <5 mm, which were then manually mixed at a weight ratio of 50:50. Afterwards, the particles were oven-dried at 74 °C for 4 days, reaching moisture contents between 5% and 7%. For the three-layer PBs, spruce particles at dimensions <1.24 mm were used for the surface layers, while cup-plant particles formed the core layer (3LCP). Same procedure was done for the three-layer PB, with both the core layer and the surface layers made from spruce (3LSP). For both three-layer PB types, the shelling ratio, which is the ratio of the surface layer thickness to the total thickness of the panel, was set at 0.3.
All PBs were produced with the target density of 600 kg/m3, and a panel thickness of 12 mm, and bonded with polymeric methylene diphenyl diisocyanate (pMDI) resin (Huntsman I-BOND® PM4390, Huntsman GmbH, Hamburg, Germany). Two resin dosages were applied—pMDI was applied in amounts of 4% (MDI4), and 6% (MDI6), respectively. Particles were resinated in a drum blender for 5 min, using a pneumatic spraying nozzle. Consequently, the resonated particles were manually distributed in a wooden forming box (550 × 550 mm2), and pre-pressed. The pre-pressed mat was then hot-pressed at 200 °C, at 3.2 MPa for 100 s, using a hydraulic Siempelkamp press (Siempelkamp Ma-schinen und Anlagenbau GmbH, Krefeld, Germany). The target thickness of the panels was checked at random positions. In total, one PB per type was manufactured (Figure 1).
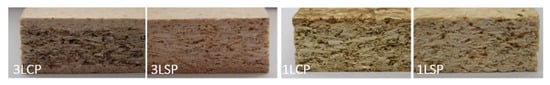
Figure 1.
Cross-sectional views of the produced particleboards. 3LCP—three-layer particleboard (PB) with a cup-plant core layer, and spruce surface layers; 3LSP—three-layer spruce PB, 1LCP—single layer cup-plant PB, and 1LSP—single layer spruce PB.
For scanning electron microscopy (SEM), a Tescan S8000 (Tescan Brno, s.r.o., Brno, Czech Republic) was used to study the surface morphology of the various PB types. Likewise, morphology and interactions between cup-plant particles and wood particles were observed as well. The ultra-high-resolution mode was used, by means of an Everhart Thornley secondary electron detector. Low accelerating voltages (between 500 V—1 kV) were used to avoid surface charging. Sample surface was cut with a sliding microtome [34].
The multifunctional focused-ion beam SEM, TESCAN LYRA3 (Tescan Brno, s.r.o., Brno, Czech Republic), was used, which also had an integrated compact time of flight secondary ion mass analyser (C-TOF-SIMS) (TofWerk AG, Thun, Switzerland). An area of interest (AOI) of 50 × 50 µm2 was scanned with a focused Ga+ ion beam (4092 pA, 30,000 V), while time-of-flight of secondary ions, and their clusters (molecules) were continuously analysed by C-TOF-SIMS. C-TOF was operated at 10 µs dwell time, which provided the mass range of 0–170 m/Q. In parallel with the AOI scanning using focused ion beam (FIB), C-TOF was used to record spectra at negative ion polarity and to capture elemental distribution maps at resolution of 1024 × 1024 pixels, by always binning 4 × 4 pixels. Data were derived from 100 scanned frames, which resulted in a crater with 1.7 µm depth in the sample (Figure 2, particularly B and D). With TOF-SIMS, the distribution of typical elements in wood, along with molecules indicating pMDI adhesives, were possible to visualize. Here, the distribution of carbon (C), oxygen (O), hydrogen (H), and hydroxyl (OH) groups were displayed to indicate wood, while CNO, CNH, and CN ion clusters were taken to display the pMDI adhesive distributions. Sample surfaces were coated with platinum in a sputter coater, prior to measurements, which avoided charging of the sample when exposed to the primary ion beam.
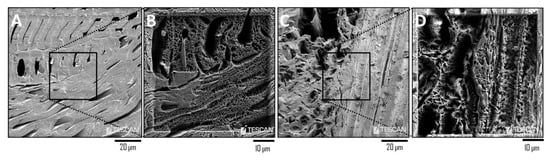
Figure 2.
Selected area of interest (AOI) SEM of a spruce particle interphase prior (A), and crater-formations due to the TOF-SIMS analysis (B). AOI of a cup-plant particle interphase prior (C) and crater formations due to the TOF-SIMS analysis (D).
Mechanical testing was carried out on a Zwick® 1474 universal testing machine using the testXpert II software (Zwick GmbH & Co. kg, Ulm, Germany). Three-point bending tests according to EN 310 [35] were employed for the bending properties. Samples sized 12 × 50 × 290 mm3 were subjected to a loading rate of 7 mm·min−1, until failure. Internal bonding (IB) strength following EN 319 [36] was measured with squared samples (50 × 50 mm2). Prior to testing the samples were sanded and then glued to the stainless-steel blocks. The blocks were then positioned in gimbal-mounted holders and pre-loaded with 5 N in tension. Subsequently, a loading rate of 1 mm/min was applied until failure was reached.
Thickness swelling was determined according to EN 317, with conditioned samples sized 12 × 50 × 50 mm2 fully immersed in 20 °C distilled water. Thickness swelling was determined at two-time intervals, i.e., after 2 and 24 h. After the immersion time had elapsed, the test samples were removed from the water and excess water was removed with a paper cloth. Then, the thickness swelling was measured manually, using a thickness gauge, at the center of the samples. Vertical density profiles (VDP) were measured with the x-ray density analyzer GreCon RG44 (GreCon, Germany). Five samples were measured from each type, with samples sized 12 × 50 × 50 mm2. The obtained data were processed with Statistica v.12 (StatSoft, inc., Tulsa, OK, USA) software. Normality of the data were checked by the Shapiro-Wilk test. The Statistical significance was set at p < 0.05 for the analysis of variance (ANOVA), with Scheffé post-hoc tests.
3. Results and Discussion
3.1. Scanning Electron Microscopy
SEM images indicate that spruce fines located in the surface layer of a particleboard (PB) have a better adherence with each other than the core-layer particles (Figure 3A). Further, an apparent porosity was seen at the transition of the spruce surface layer migrating into the cup-plant core layer (Figure 3D), a fact that potentially affected the mechanical properties. The anatomical structure of the core layer vs. surface layer was clearly different. While the wood showed a rather regular and compact cellular structure dominated by the tracheids (Figure 3B,C), the cup-plant structure was more diverse, showing annular thickenings (Figure 3E) and pitted perforations (Figure 3F), constituting a wider range of pore sizes, all potentially influencing resulting properties.
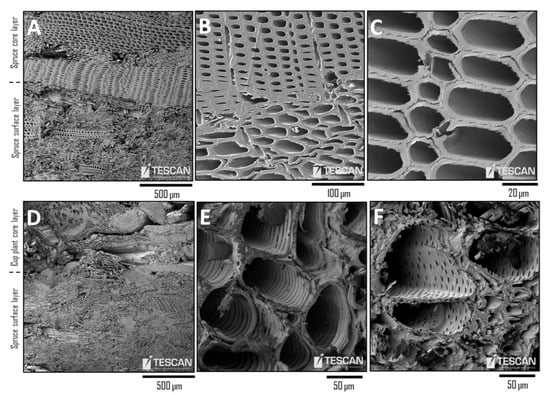
Figure 3.
Cross-sectional SEM images of the spruce (A–C) and cup-plant core layer—spruce surface layer (D–F) PBs.
3.2. TOF-SIMS Analysis
For the spruce wood (Figure 4) and the cup-plant PB (Figure 5), cross-sections were prepared for the detection of carbon at mass-to-charge m/Q of 12, hydrogen at a m/Q of 1, oxygen at a m/Q of 16, and hydroxyl ion cluster OH at a m/Q of 17. Secondary ion molecular clusters typical for pMDI adhesives were also detected. The cyanide ion anion (CN) was identified at the m/Q peak of 26, hydrogen isocyanide (CNH) at the m/Q peak 27, while cyanate (CNO) was detected at a m/Q of 42. Due to the detection of molecules associated with pMDI (CN, CNH, and CNO), the resin distribution within the composite could be displayed. Results showed that in the pMDI-bonded PB, the pMDI-wood bondlines were not spot-like, but appeared rather even and non-regular, with a penetration deep into the wood structure. This finding corresponded to data presented by Mahrdt et al. [37]. We are showing that C-TOF attached to FIB-SEM with Ga+ ion source could detect ion molecular clusters specific to pMDI adhesive and wood. Additionally, with the Ga+ ion source, it should be possible to detect G-lignin at peak Q/m 137 [30], however, the applied C-TOF setup delivered only a low secondary ion signal (although visible), which did not allow an elemental mapping. This could be further elaborated in a future study. The relevance of CN, CNH, CNO being related to the pMDI distribution in the wooden structure was also confirmed by the FIB-SEM image (Figure 4 and Figure 5).
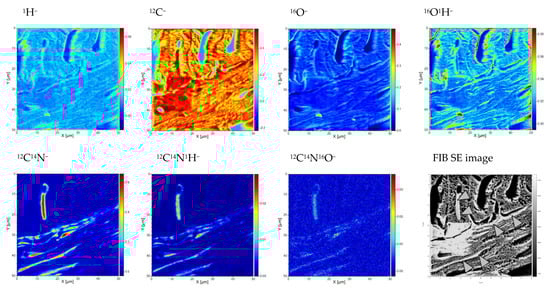
Figure 4.
Elemental distribution maps of the selected isotopes and their molecular clusters for a spruce particle. The element exponent indicates a detected mass of ions or their clusters used for displaying the maps. Brighter regions in the FIB SE image refers to pMDI (marked); see Figure 2B for the selected area of interest SEM.
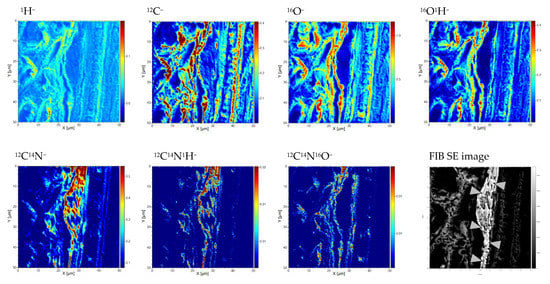
Figure 5.
Elemental distribution maps of the selected isotopes and their molecular clusters for a cup-plant particle. The element exponent indicates a detected mass of ions or their clusters used for displaying of maps. Brighter regions in the FIB SE image refers to pMDI (marked); see Figure 2D for the selected area of interest SEM.
Particle–particle bondlines for both PB types were visualized by TOF-SIMS. The Q/m 12 peak (carbon) was adopted to represent the genuine wood structure, while for the particle–particle bondline, the molecular cluster CN (Q/m 26) was taken. The results showed that the pMDI adhesive was more dispersed in the cup-plant PB than in the spruce PB (Figure 6 and Figure 7). While the spruce PB showed very narrow particle–particle bondlines, with penetration in non-compressed cell lumina regions (Figure 6), the adhesive in cup-plant PBs appeared to be more spread-out (Figure 7). This could be related to the greater and more dispersed porosity present in the cup-plant. An essential and novel outcome of this research was also that individual particle–particle bondlines could be visualized through molecular C-TOF SIMS identification. Here, no additional sample preparation such as staining was required, with the samples not getting modified in any way, as it is the case with other bondline identification methods [27]. With C-TOF, it is possible to visualize bondlines in 3D, different to regular electron or light microscopy imaging. The capability of 3D imaging also approved Hypothesis 2. The obtained approach delivered data for in-depth analysis of bondline mechanics and substrate interaction, since the dataset could be transformed into the finite element model, with the stress and strain distributions of the structural components to be further assessed [38].
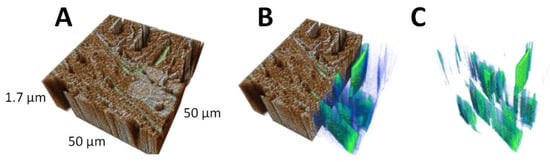
Figure 6.
3D-visualisation of the spruce particle–particle bondlines, using TOF SIMS data, reconstructed by the ORS software (Object Research Systems, Montreal, QC, Canada); (A,B) spruce PB with visible particle–particle bondline, (C) pMDI bondline imaging (Q/m 26).
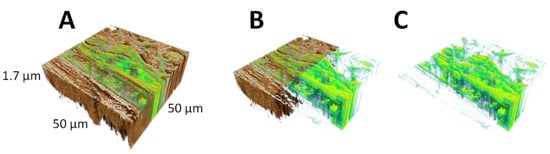
Figure 7.
3D-visualisation of cup-plant particle–particle bondlines, TOF SIMS data reconstructed by the ORS software (Object Research Systems, QC, Canada); (A,B) cup-plant PB with visible particle–particle bondline, and (C) the pMDI bondline imaging (Q/m 26).
3.3. Mechanical Properties
The results showed that the mean MOR values of the cup-plant PBs (3LCP, 1LCP) were below the mean measured for spruce PBs. Further, mean MOR of the three-layer cup-plant PB (3LCP) was above the one-layer cup-plant PB (1LCP), although not statistically significant. Additionally, MOR of three-layer cup-plant PB (3LCP) was not different to the one-layer spruce PB (1LSP, p > 0.05; Figure 8). The spruce PB types and the three-layer cup-plant PB did meet the EN312 class P1 standard [39], which is for general use in dry conditions. In contrast, average MOR of the one-layer cup-plant PB did not reach the P1 standard.
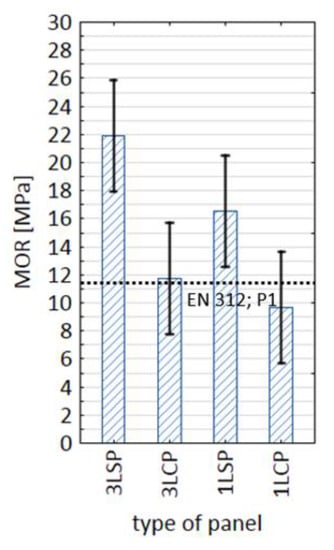
Figure 8.
Modulus of rupture (MOR) of measured particleboards (PBs). 3LCP—three-layer cup-plant PB, 3LSP—three-layer spruce PB, 1LCP—single-layer cup-plant PB, and 1LSP—single-layer spruce PB (n = 10).
Average MOE measured for both cup-plant PBs types (3LCP, 1LCP) did not differ, (p > 0.05), and were also not statistically different from the one-layer spruce PB (1LSP, Figure 9). In addition, MOE of both cup-plant PBs were significantly (p < 0.05) lower than the three-layer spruce PB. Even with all seen MOE variability (Figure 9), the cup-plant PBs could be classified as P1 of EN 312, which refers to PBs used in dry conditions for interior fitments, including furniture.
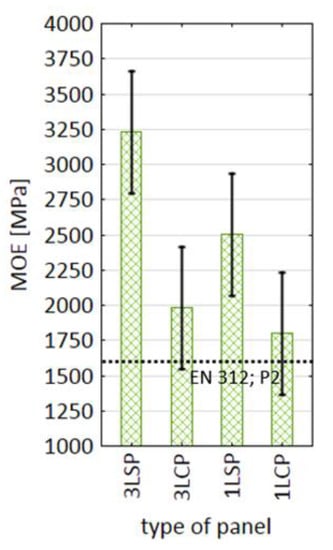
Figure 9.
Modulus of elasticity (MOE) of measured particleboards (PBs). 3LCP—three-layer cup-plant PB, 3LSP—three-layer spruce PB, 1LCP—single-layer cup-plant PB, and 1LSP—single-layer spruce PB (n = 10).
The measured MOR and MOE of the one-layer spruce PB, and the three-layer spruce PB were consistent with data reported by Rofii et al. [40]. It was also documented that MOE and MOR of three-layer PBs were above the one-layer PBs [41]. MOE and MOR were both affected by particle alignments, surface layer density, as well as by the nature of the used raw material [42]. As cup-plant particles differ in their anatomical structure [8] and sizes when compared to spruce particles, this has evidently an effect on the properties of the produced PBs. Juliana et al. [43] reported a rise in MOE and MOR of three-layer PB made from Kenaf stalk cores, when the surface layers were made of rubberwood. MOR and MOE of the produced one-layer cup-plant PB showed similar values than PBs made from waste tea leaves [44], bleached straw [13], eggplant stalks [45], or rice straw [9].
Internal bonding values (IB) of the cup-plant PBs (3LCP, 1LCP) were also below the spruce PB types (Figure 10). One-layer cup-plant PB showed an average IB of 0.30 MPa, which was not significantly different from the IB of the three-layer cup-plant PB (0.34 MPa). Overall, the PBs made from cup-plant were again found suitable as general usage panels in dry conditions, as defined in EN 312 P1 [39]. In PBs, the core layers strongly determine the internal bonding, which explains why there are no significant differences for IB between single-layer and three-layer PBs. Rofii et al. [40] reported that surface layer characteristics of PBs have no significant effect on the IB. Additionally, Balducci et al. [22] showed that the surface layer of three-layer Miscanthus PBs had no significant influence on the measured IB. A reduced IB was found for rice husks PBs [46], hazelnut husks [47], or waste tea leaves [36]. An IB lower than 0.2 MPa was measured for rice straw [9], and for waste grass clipping PBs [48].
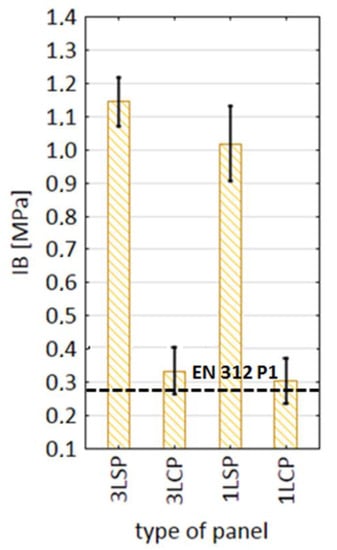
Figure 10.
Internal bonding strength (IB) of the measured particleboards (PBs). 3LCP—three-layer cup-plant PBs, 3LSP—three-layer spruce PB, 1LCP—single-layer cup-plant PB, and 1LSP—single-layer spruce PB (n = 20).
3.4. Thickness Swelling and Water Uptake
The three-layers PBs made from cup-plant, and the three-layer PB made from spruce wood, both showed similar thickness swelling after 2 h (TS2h, Figure 11). Data also show that the spruce particles in the surface layer did significantly lower TS2h, as it is the case with the cup-plant PBs (3LCP). The TS2h of single-layer cup-plant PB was almost twice the TS2h of the three-layer cup-plant PB. No TS2h difference was found between 3LSP and 3LCP. A lower thickness swelling of three-layer PB than single-layer PB was also measured by [22], where Miscanthus or topinambour stalks were utilized for the core layer in three-layer PB.
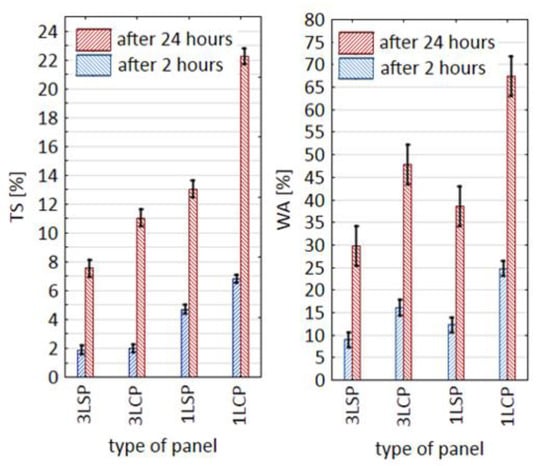
Figure 11.
Thickness swelling (TS) and water absorption (WA) of produced particleboards (PBs). 3LCP—three-layer cup-plant PB, 3LSP—three-layer spruce PB, 1LCP—single-layer cup-plant PB, and 1LSP—single-layer spruce PB.
It is further shown that TS24h of both cup-plant PBs were significantly higher than the three-layer spruce comparison. It can be noted that in the 3LCP the spruce surface layer has a positive effect on TS24h. In addition, TS24h of the three-layer cup-plant PB was significantly lower (p < 0.05) than the TS24h measured for the single-layer cup-plant PB.
Water uptake results after 24 h were different in a way with the three-layer spruce particleboards absorbing the least water, while the single-layer cup-plant had the highest water uptake. Spruce particles as the surface layer is reducing the water-uptake, meaning that these particles seemingly reduce water access. This could be linked to a less accessible pore structure in spruce, compared to cup-plant particles (see Figure 3).
3.5. Vertical Density Profile
As seen in Figure 12, vertical density profiles of the cup-plant PB and the spruce PB were quite different. Single-layer cup-plant PB showed a flat density profile without distinct surface peaks. With spruce particles present in the surface layers, in an otherwise cup-plant PB, the density profile was also altered. It was found that the core layer density of the three-layer cup-plant PB was higher than that in the surface layers. It was evident that the density profile altered the mechanical performance of the cup-plant PBs. In Wong et al. [49] it was found that the density profile was like the one measured for spruce PBs, which is beneficial to MOE and MOR. Likewise, a flat density profile measured for the single-layer cup-plant PB was commonly connected to reduced bending properties, as shown with own data. The three-layer cup-plant PB had a higher density in the core layer, which at first glance should provide better IB for the three-layer cup-plant PB. Interestingly, this is not shown with our data. It must be noted that commonly not only the core layer, but the transition zone (TZ) between the surface and core layer is more prone to fail during an internal bonding test [50] (Figure 6). As seen in Figure 3, the three-layer cup-plant PB’s transition zone had a higher proportion of pores and could be seen as a “weak layer”, with a density similar to the core layer of the single-layer cup-plant PB. Thus, internal bonding of the 3LCP did not improve over the other panel types. The three-layer spruce particleboard had the highest surface layer density, which explains the high MOR and MOE values of this PB type.
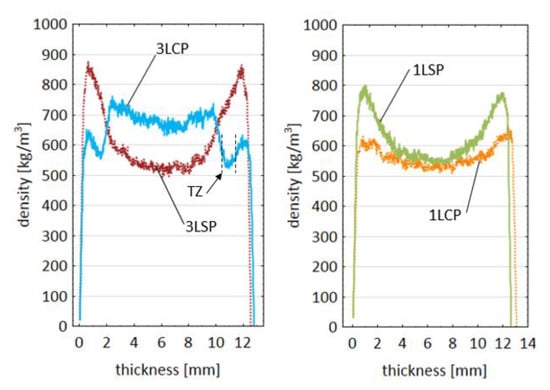
Figure 12.
Vertical density profile of the produced particleboards (PBs). 3LCP—three layer-cup-plant PB, 3LSP—three-layer spruce PB, 1LCP—single-layer cup-plant PB, and1LSP—single-layer spruce PB; TZ—transition zone between surface and core layer.
4. Conclusions
In this research, we successfully produced single-layer as well as three-layer cup-plant particleboards (PBs). We approved Hypothesis 1, as such that C-TOF and a combination of SEM-FIB with Ga+ ion source was able to detect ion molecular clusters specific to pMDI adhesive and wood. The actual setup of the primary beam did not provide enough secondary ion signals to capture G-lignin cluster, although a specific peak at m/Q 137 was visible. This needs to be further elaborated. Mechanical and physical properties of PBs were compared with spruce-made particleboards. Hypothesis 2 was also confirmed, as the bondline was visualized in 3D with datasets acquired by C-TOF. Hypothesis 3 was only partly approved, as the three-layer cup-plant PBs fulfilled the requirement for a general usage panel (EN312, P1). However, MOR of the single-layer cup-plant PB needs to be increased to meet EN 312, P1 requirements. Hypothesis 4 was proven with the restriction that the IB of the cup-plant three-layer PB was not statistically different from the cup-plant single-layer PB. Nevertheless, three-layer cup-plant PBs delivered better MOE and MOR values than the single-layer cup-plant PBs. Raw material mixtures with spruce might be useful to raise MOR and MOE values. The density profile of the three-layer cup-plant PB has been altered in a way the core layer had higher densities than the surface layer.
Author Contributions
Conceptualization, P.K. and R.W.; methodology, P.K. and P.M..; software, P.K.; validation, P.K., R.W. and P.M.; writing-original draft preparation, P.K. and R.W.; writing-review and editing, R.W. and P.M.; visualization, P.K. All authors have read and agreed to the published version of the manuscript.
Funding
This work was supported by Tescan Orsay Holding a.s., 62300 Brno, by providing the relevant analytical resources. Further, the Fraunhofer-Institut für Holzforschung—Wilhelm-Klauditz-Institut provided all material characterisations.
Institutional Review Board Statement
Not applicable.
Informed Consent Statement
Not applicable.
Data Availability Statement
Not applicable.
Conflicts of Interest
The authors declare no conflict of interest.
References
- European Panel Federation. European Padixnel Federation—Annual Report 2013/2014; EPF: Brussels, Belgium, 2014. [Google Scholar]
- Giljum, S.; Martin, H.F.B.; Burger, E.; Frühmann, J.; Lutter, S.; Elke, P.; Christine, P.; Hannes, W.; Lisa, K.; Michael, W. Overcosumption? Our Use of the World’s Natural Resources. 2009. Available online: https://www.foe.co.uk/sites/default/files/downloads/overconsumption.pdf (accessed on 5 January 2021).
- Mast, B.; Lemmer, A.; Oechsner, H.; Reinhardt-Hanisch, A.; Claupein, W.; Graeff-Hönninger, S. Methane yield potential of novel perennial biogas crops influenced by harvest date. Ind. Crops Prod. 2014, 58, 194–203. [Google Scholar] [CrossRef]
- Khachatryan, H.; Casavant, K.; Jessup, E. Waste to Fuels Technology: Evaluating Three Technology Options and the Economics for Converting Biomass to Fuels; Final Report; Ecology Publication Number 09-07-058; Washington State University: Pullman, WA, USA, 2009; 203p. [Google Scholar]
- Pretzsch, H. Forest Dynamics, Growth and Yield: From Measurement to Model; Springer: Berlin, Germany, 2009; ISBN 978-3-540-88306-7. [Google Scholar]
- Stanford, G. Silphium perfoliatum (cup-plant) as a new forage. In Proceedings of the Twelfth North American Prairie Conference, Cedar Falls, IA, USA, 5–9 August 1990; Volume 1, pp. 33–37. [Google Scholar]
- Haag, N.L.; Nägele, H.-J.; Reiss, K.; Biertümpfel, A.; Oechsner, H. Methane formation potential of cup plant (Silphium perfoliatum). Biomass Bioenergy 2015, 75, 126–133. [Google Scholar] [CrossRef]
- Gansberger, M.; Montgomery, L.F.R.; Liebhard, P. Botanical characteristics, crop management and potential of Silphium perfoliatum L. as a renewable resource for biogas production: A review. Ind. Crops Prod. 2015, 63, 362–372. [Google Scholar] [CrossRef]
- Li, X.; Cai, Z.; Winandy, J.E.; Basta, A.H. Selected properties of particleboard panels manufactured from rice straws of different geometries. Bioresour. Technol. 2010, 101, 4662–4666. [Google Scholar] [CrossRef]
- Gerardi, V.; Minelli, F.; Viggiano, D. Steam treated rice industry residues as an alternative feedstock for the wood based particleboard industry in Italy. Biomass Bioenergy 1998, 14, 295–299. [Google Scholar] [CrossRef]
- Yasin, M.; Waheed, A.; Ahmed, A.; Karim, S. Efficient Utilization of Rice-wheat Straw to Produce Value—Added Composite Products. Int. J. Chem. Enviromental Eng. 2010, 1, 136–143. [Google Scholar]
- Kariuki, S.W.; Wachira, J.; Kawira, M.; Murithi, G. Crop residues used as lignocellulose materials for particleboards formulation. Heliyon 2020, 6, e05025. [Google Scholar] [CrossRef] [PubMed]
- Mo, X.; Cheng, E.; Wang, D.; Sun, X.S. Physical properties of medium-density wheat straw particleboard using different adhesives. Ind. Crops Prod. 2003, 18, 47–53. [Google Scholar] [CrossRef]
- Khristova, P.; Yossifov, N.; Gabir, S. Particle Board from Sunflower Stalks: Preliminary Trials. Bioresour. Technol. 1996, 58, 319–321. [Google Scholar] [CrossRef]
- Mati-Baouche, N.; De Baynast, H.; Lebert, A.; Sun, S.; Lopez-Mingo, C.J.S.; Leclaire, P.; Michaud, P. Mechanical, thermal and acoustical characterizations of an insulating bio-based composite made from sunflower stalks particles and chitosan. Ind. Crops Prod. 2014, 58, 244–250. [Google Scholar] [CrossRef]
- Bektas, I. The Manufacture of Particleboards using Sunflower Stalks (helianthus annuus l.) and Poplar Wood (Populus alba L.). J. Compos. Mater. 2005, 39, 467–473. [Google Scholar] [CrossRef]
- Guler, C.; Bektas, I.; Kalaycioglu, H. The experimental particleboard manufacture from sunflower stalks (Helianthus annuus L.) and Calabrian pine (Pinus brutia Ten). For. Prod. J. 2006, 56, 56–60. [Google Scholar]
- Ferrandez-Villena, M.; Ferrandez-Garcia, C.E.; Garcia-Ortuño, T.; Ferrandez-Garcia, A.; Ferrandez-Garcia, M.T. Analysis of the thermal insulation and fire-resistance capacity of particleboards made from vine (Vitis vinifera l.) prunings. Polymers 2020, 12, 1147. [Google Scholar] [CrossRef] [PubMed]
- Guler, C.; Ozen, R. Some properties of particleboards made from cotton stalks (Gossypium hirsitum L.). Holz als Roh- und Werkst. 2004, 62, 40–43. [Google Scholar] [CrossRef]
- Kowaluk, G.; Szymanowski, K.; Kozlowski, P.; Kukula, W.; Sala, C.; Robles, E.; Czarniak, P. Functional assessment of particleboards made of apple and plum orchard pruning. Waste Biomass Valoriz. 2020, 11, 2877–2886. [Google Scholar] [CrossRef]
- Chaydarreh, K.C.; Lin, X.; Guan, L.; Yun, H.; Gu, J.; Hu, C. Utilization of tea oil camellia (Camellia oleifera Abel.) shells as alternative raw materials for manufacturing particleboard. Ind. Crop Prod. 2021, 161, 113221. [Google Scholar] [CrossRef]
- Balducci, F.; Harper, C.; Meinlschmidt, P.; Dix, B.; Sanasi, A. Development of Innovative Particleboard Panels. Drv. Ind. 2008, 59, 131–136. [Google Scholar]
- Dix, B.; Meinlschmidt, P.; Van De Flierdt, A.; Thole, V. Leichte Spanplatten für den Möbelbau aus Rückständen der landwirtschaftlichen Produktion—T.1: Verfügbarkeit der Rohstoffe. Holztechnologie 2009, 50, 5–10. [Google Scholar]
- Selinger, J.; Wimmer, R. A novel low-density sandwich panel made from hemp. In Proceedings of the InWood2015: Innovations in Wood Materials and Processes, Brno, Czech Republic, 19–22 May 2015; Volume 19, pp. 29–31. [Google Scholar]
- Klímek, P.; Meinlschmidt, P.; Wimmer, R.; Plinke, B.; Schirp, A. Using sunflower (Helianthus annuus L.), topinambour (Helianthus tuberosus L.) and cup-plant (Silphium perfoliatum L.) stalks as alternative raw materials for particleboards. Ind. Crops Prod. 2016, 92, 157–164. [Google Scholar]
- Klímek, P.; Morávek, T.; Ráhel, J.; Stupavská, M.; Děcký, D.; Král, P.; Kúdela, J.; Wimmer, R. Utilization of air-plasma treated waste polyethylene terephthalate particles as a raw material for particleboard production. Compos. Part B Eng. 2016, 90, 188–194. [Google Scholar] [CrossRef]
- Kamke, F.A.; Lee, J.N. Adhesive penetration in wood: A review. Wood Fiber Sci. 2007, 39, 205–220. [Google Scholar]
- Whitby, J.A.; Östlund, F.; Horvath, P.; Gabureac, M.; Riesterer, J.L.; Utke, I.; Hohl, M.; Sedláček, L.; Jiruše, J.; Friedli, V.; et al. High Spatial Resolution Time-of-Flight Secondary Ion Mass Spectrometry for the Masses: A Novel Orthogonal ToF FIB-SIMS Instrument. Adv. Mater. Sci. Eng. 2012, 2012, 180437. [Google Scholar] [CrossRef]
- Singh, A.V.; Jungnickel, H.; Leibrock, L.; Tentschert, J.; Reichardt, P.; Katz, A.; Luch, A. ToF-SIMS 3D imaging unveils important insights on the cellular microenvironment during biomineralization of gold nanostructures. Sci. Rep. 2020, 10, 1–11. [Google Scholar] [CrossRef] [PubMed]
- Saito, K.; Kato, T.; Takamori, H.; Kishimoto, T.; Yamamoto, A.; Fukushima, K. A new analysis of the depolymerized fragments of lignin polymer in the plant cell walls using ToF-SIMS. Appl. Surf. Sci. 2006, 252, 6734–6737. [Google Scholar] [CrossRef]
- Tokareva, E.N.; Fardim, P.; Pranovich, A.V.; Fagerholm, H.; Daniel, G.; Holmbom, B. Imaging of wood tissue by ToF-SIMS: Critical evaluation and development of sample preparation techniques. Appl. Surf. Sci. 2007, 253, 7569–7577. [Google Scholar] [CrossRef]
- Fardim, P.; Dura, N. Modification of fibre surfaces during pulping and refining as analysed by SEM, XPS and ToF-SIMS. Colloids Surf. A Physicochem. Eng. Asp. 2003, 223, 263–276. [Google Scholar] [CrossRef]
- Kuroda, K.; Imai, T.; Saito, K.; Kato, T.; Fukushima, K. Applied Surface Science Application of ToF-SIMS to the study on heartwood formation in Cryptomeria japonica trees. Appl. Surf. Sci. 2008, 255, 1143–1147. [Google Scholar] [CrossRef]
- Gärtner, H.; Nievergelt, D. The core-microtome: A new tool for surface preparation on cores and time series analysis of varying cell parameters. Dendrochronologia 2010, 28, 85–92. [Google Scholar] [CrossRef]
- European Committee for Standardization. EN 310, Wood-Based Panels—Determination of Modulus of Elasticity in Bending and of Bending Strength; European Committee for Standardization: London, UK, 1993. [Google Scholar]
- European Committee for Standardization, EN 319, Particleboards and Fibreboards—Determination of Tensile Strength Perpendicular to the Plane of the Board; European Committee for Standardization: London, UK, 1993.
- Mahrdt, E.; Stöckel, F.; Van Herwijnen, H.W.G.; Müller, U.; Kantner, W.; Moser, J.; Gindl-Altmutter, W. Light microscopic detection of UF adhesive in industrial particle board. Wood Sci. Technol. 2015, 49, 517–526. [Google Scholar] [CrossRef]
- Klímek, P. Focused ion beam tomography as a tool for bio-inspired structural design. In Proceedings of the XVI International Conference on Electron Microscopy, Jachranka, Poland, 10–13 September 2017; pp. 37–39. [Google Scholar]
- European Committee for Standardization. EN 312, Particleboards. Specifications—Requirements for Flat-Pressed or Calendar-Pressed Unfaced Particleboards; European Committee for Standardization: London, UK, 2010. [Google Scholar]
- Rofii, M.N.; Yumigeta, S.; Suzuki, S.; Prayitno, T.A. Mechanical properties of three-layered particleboards made from different wood species. In Proceedings of the 3rd International Symposium of Indonesian Wood Research Society (IWoRS), Yogykarta, Indonesia, 3–4 November 2011; pp. 152–161. [Google Scholar]
- Geimer, R.L.; Lehmann, W.F. Effects of Layer Characteristics on the Properties Of Three-Layer Particleboards. For. Prod. J. 1975, 25, 19–29. [Google Scholar]
- Nasser, R.A. Physical and Mechanical Properties of Three-Layer Particleboard Manufactured from the Tree Pruning of Seven Wood Species. World Appl. Sci. J. 2012, 19, 741–753. [Google Scholar] [CrossRef]
- Juliana, A.H.; Paridah, M.T.; Rahim, S.; Nor Azowa, I.; Anwar, U.M.K. Properties of particleboard made from kenaf (Hibiscus cannabinus L.) as function of particle geometry. Mater. Des. 2012, 34, 406–411. [Google Scholar] [CrossRef]
- Yalinkilic, K.M.; Imamuraa, Y.; Takahashi, M.; Kalaycioglub, H.; Nemlib, G.; Demircib, Z.; Ozdemirb, T. Physical and mechanical properties of particleboard manufactured from waste tea leaves. Int. Biodeterior. Biodegrad. 1998, 41, 75–84. [Google Scholar] [CrossRef]
- Guntekin, E.; Karakus, B. Feasibility of using eggplant (Solanum melongena) stalks in the production of experimental particleboard. Ind. Crops Prod. 2008, 27, 354–358. [Google Scholar] [CrossRef]
- Suleiman, I.Y.; Aigbodion, V.S.; Shuaibu, L.; Shangalo, M.; Workshop, M.E.; Umaru, W.; Polytechnic, F. Development of eco-friendly particleboard composites using rice husk particles and gum arabic. J. Mater. Sci. Eng. Adv. Technol. 2013, 7, 75–91. [Google Scholar]
- Çöpür, Y.; Güler, C.; Akgül, M.; Taşçıoğlu, C. Some chemical properties of hazelnut husk and its suitability for particleboard production. Build. Environ. 2007, 42, 2568–2572. [Google Scholar] [CrossRef]
- Nemli, G.; Demirel, S.; Gümüşkaya, E.; Aslan, M.; Acar, C. Feasibility of incorporating waste grass clippings (Lolium perenne L.) in particleboard composites. Waste Manag. 2009, 29, 1129–1131. [Google Scholar] [CrossRef]
- Wong, E.-D.; Yang, P.; Zhang, M.; Wang, Q.; Nakao, T.; Li, K.-F.; Kawai, S. Analysis of the effects of density profile on the bending properties of particleboard using finite element method (FEM). Holz als Roh- und Werkst. 2003, 61, 66–72. [Google Scholar] [CrossRef]
- Schulte, M.; Frühwald, A. Some investigations concerning density profile, internal bond and relating failure position of particleboard. Holz als Roh- und Werkst. 1996, 289–294. [Google Scholar] [CrossRef]
Publisher’s Note: MDPI stays neutral with regard to jurisdictional claims in published maps and institutional affiliations. |
© 2021 by the authors. Licensee MDPI, Basel, Switzerland. This article is an open access article distributed under the terms and conditions of the Creative Commons Attribution (CC BY) license (http://creativecommons.org/licenses/by/4.0/).