Article

Research on Measuring Thermal Conductivity of Quartz and Sapphire Glass Using Rear-Side Photothermal Deflection Method

Department of Mechanical Engineering, Ajou University, Suwon 16499, Korea
*
Author to whom correspondence should be addressed.
Appl. Sci. 2021, 11(4), 1535; https://doi.org/10.3390/app11041535
Submission received: 28 December 2020 / Revised: 27 January 2021 / Accepted: 4 February 2021 / Published: 8 February 2021
(This article belongs to the Special Issue New Materials for Nanophotonics)

Abstract

:
As the display industry continues to advance, various new materials are being developed for utilizing microtechnology and nanotechnology in display panels. Among these, transparent materials have been widely applied to the internal wiring of displays and flexible substrates, owing to their high optical transmittance, isotropy, and anisotropy. Thus, measurement of the thermophysical properties of various transparent materials is important. This study measured thermal conductivity by selecting quartz, a transparent isotropic material, and sapphire glass, a transparent anisotropic material, as measurement target materials using a rear-side photothermal deflection method. Measurements were made via a three-dimensional unsteady heat conduction equation, to which complex transformation was applied and numerically analyzed using COMSOL Multiphysics. Phase delays for a pump beam and a probe beam for a relative position were derived through a deflection analysis. From the derived phase delays between the numerical analysis and experimental result with optical alignment, the absolute and relative errors of quartz were appropriately confirmed to be 0.069 W/m-K and 5%, respectively, while those of the sapphire glass were likewise confirmed to be 0.55 W/m-K and 1.5%, respectively.

1. Introduction

With the advancement of the display industry in recent years, a wide variety of new materials are being developed for use in microtechnology and nanotechnology in display panels. A great deal of research on the internal wiring of transparent displays is being performed to increase screen scale and improve visibility [1]. Specifically, research on transparent electrodes and flexible substrates is showing active progress [2]. Since transparent materials with high optical transmittance generally tend to have low electrical conductivity in the internal wiring of the display, extensive research on anisotropic materials whose optical transmittance and electrical conductivity vary with crystal orientation is being conducted [3]. Therefore, accurate information on the thermophysical properties of transparent materials is necessary for the production of an efficient and flexible display and display panel. However, not only is the thermophysical information insufficient, but existing measurement methods cannot often be applied due to the characteristics of transparent materials [4].
The measurement of thermophysical properties is primarily conducted via analysis of the temperature change of the material using a heat input. The measurement of thermophysical properties can be categorized as either contact or non-contact according to the heat input and temperature measurement methods. The applications and limitations of contact and non-contact thermophysical measurement technologies are summarized in Table 1 below [5,6,7,8,9,10,11,12,13,14]. The contact method inputs heat and measures temperature via direct contact with the materials, resulting in a relatively large error due to the contact resistance. Furthermore, in cases where devices and materials requiring airtightness are used as measurement targets, it is difficult to attach a sensor. Particularly, materials with low electrical conductivity may yield inaccurate measurements for the DC (Direct Current) heating method or be damaged during the measurement process. In contrast, non-contact methods have the advantages of low contact resistance, easy sensor attachment, and low material damage compared to the contact methods. Research on various non-contact methods has been conducted to explore such advantages. Among these methods, a thermophysical property measurement scheme using the photothermal effect is the most advanced, with measurement reliability demonstrated by the studies of Salazar [15], Spear [16], Murphy [17], Jackson [18,19], and Bertolotti [20,21].
This scheme using the photothermal effect consists of a pump beam for the heat input and a probe beam for the temperature change measurement. It is subdivided into a displacement method, a mirage deflection method, and a collinear method according to the characteristics of the target materials and the alignment states of the pump beam and the probe beam, as shown in Figure 1.
The photothermal displacement method was established by Olmstead et al. [22] with one-dimensional and three-dimensional theoretical analyses for surface temperature and thermoelastic deformation conducted by Opsal [23,24] and Jeon [25] et al. A thermal diffusion coefficient was experimentally measured by Lee [22] and Jeon [23]. Photothermal mirage deflection is a measurement method for mono-layer isotropic materials, established by Salazar et al. [15]. Measurement of thermophysical properties for mono-layer anisotropic materials was conducted by Jeon et al. [26,27]. For the photothermal collinear deflection method, research on materials with mono-layer/multi-layer structures was conducted by Salazar [28,29], Spear [16,30], and Kim et al. [31]. The photothermal effect is used to measure thermophysical properties by thermoelastically deforming a specimen via periodically modulated heating, changing the refractive index of an air layer or that of the specimen’s interior. The displacement and mirage deflection method utilize thermoelastic deformation and change in the refractive index of the air layer, making them suitable for opaque metal materials that can sufficiently absorb the energy of the pump beam. In the case of the displacement and mirage deflection method, the probe and pump beams are irradiated at the same side of the air-layer. Therefore, the part of the reflected pump beam can be detected by the sensor and may cause an error. Conversely, the collinear deflection method determines thermophysical properties by using the change in the refractive index of the air layer and the change in thermoelastic deformation inside the specimen, making it a suitable measurement method for transparent materials [16].
As shown in Figure 1c, the collinear deflection method uses the change in both the refractive indices and thermoelastic deformation by irradiating the probe beam horizontal to the pump beam to measure the thermophysical properties of materials with low absorptivity (high optical transmittance) of the pump beam energy. Furthermore, this method has the limitation of generating a phase delay error because of mutual laser interference where the pump beam and the probe beam intersect. Moreover, in the case of the collinear method, a part of the pump beam can transmit and arrive at the sensor. Although the pump beam is blocked by a bandwidth filter that is equipped in front of the sensor, the pump beam cannot be completely filtered; it causes an error for the phase delay measurement [31]. As stated above, because materials with high optical transmittance generally tend to have low thermal conductivity, it is difficult to secure the necessary change in the refractive index for measurements.
To overcome such a limitation, a light absorption thin film comprised of copper and having a thickness of 20 μm was applied for energy absorption of the pump beam, and the probe beam was irradiated parallel to the rear side of the specimen. Through this mechanism, mutual interference between the two laser beams can be avoided. In this study, the measurement using the rear-side photothermal deflection method was carried out to determine whether thermal conductivity can be measured for a transparent isotropic material (quartz) and anisotropic material (sapphire glass). Since copper has a high optical absorption coefficient, a film with a thickness of 20 μm can sufficiently absorb the energy of the pump beam. This means that the thermophysical properties can be measured through the light absorption film regardless of the optical characteristics of the target materials. A three-dimensional unsteady heat conduction equation was used to calculate phase delay. This equation was applied to a double-layered structure, which included both the thin light absorption film and the target material. The calculated phase delays were compared with the phase delay signal measured from the experimental through optical alignment.

2. Background Theory and Methods

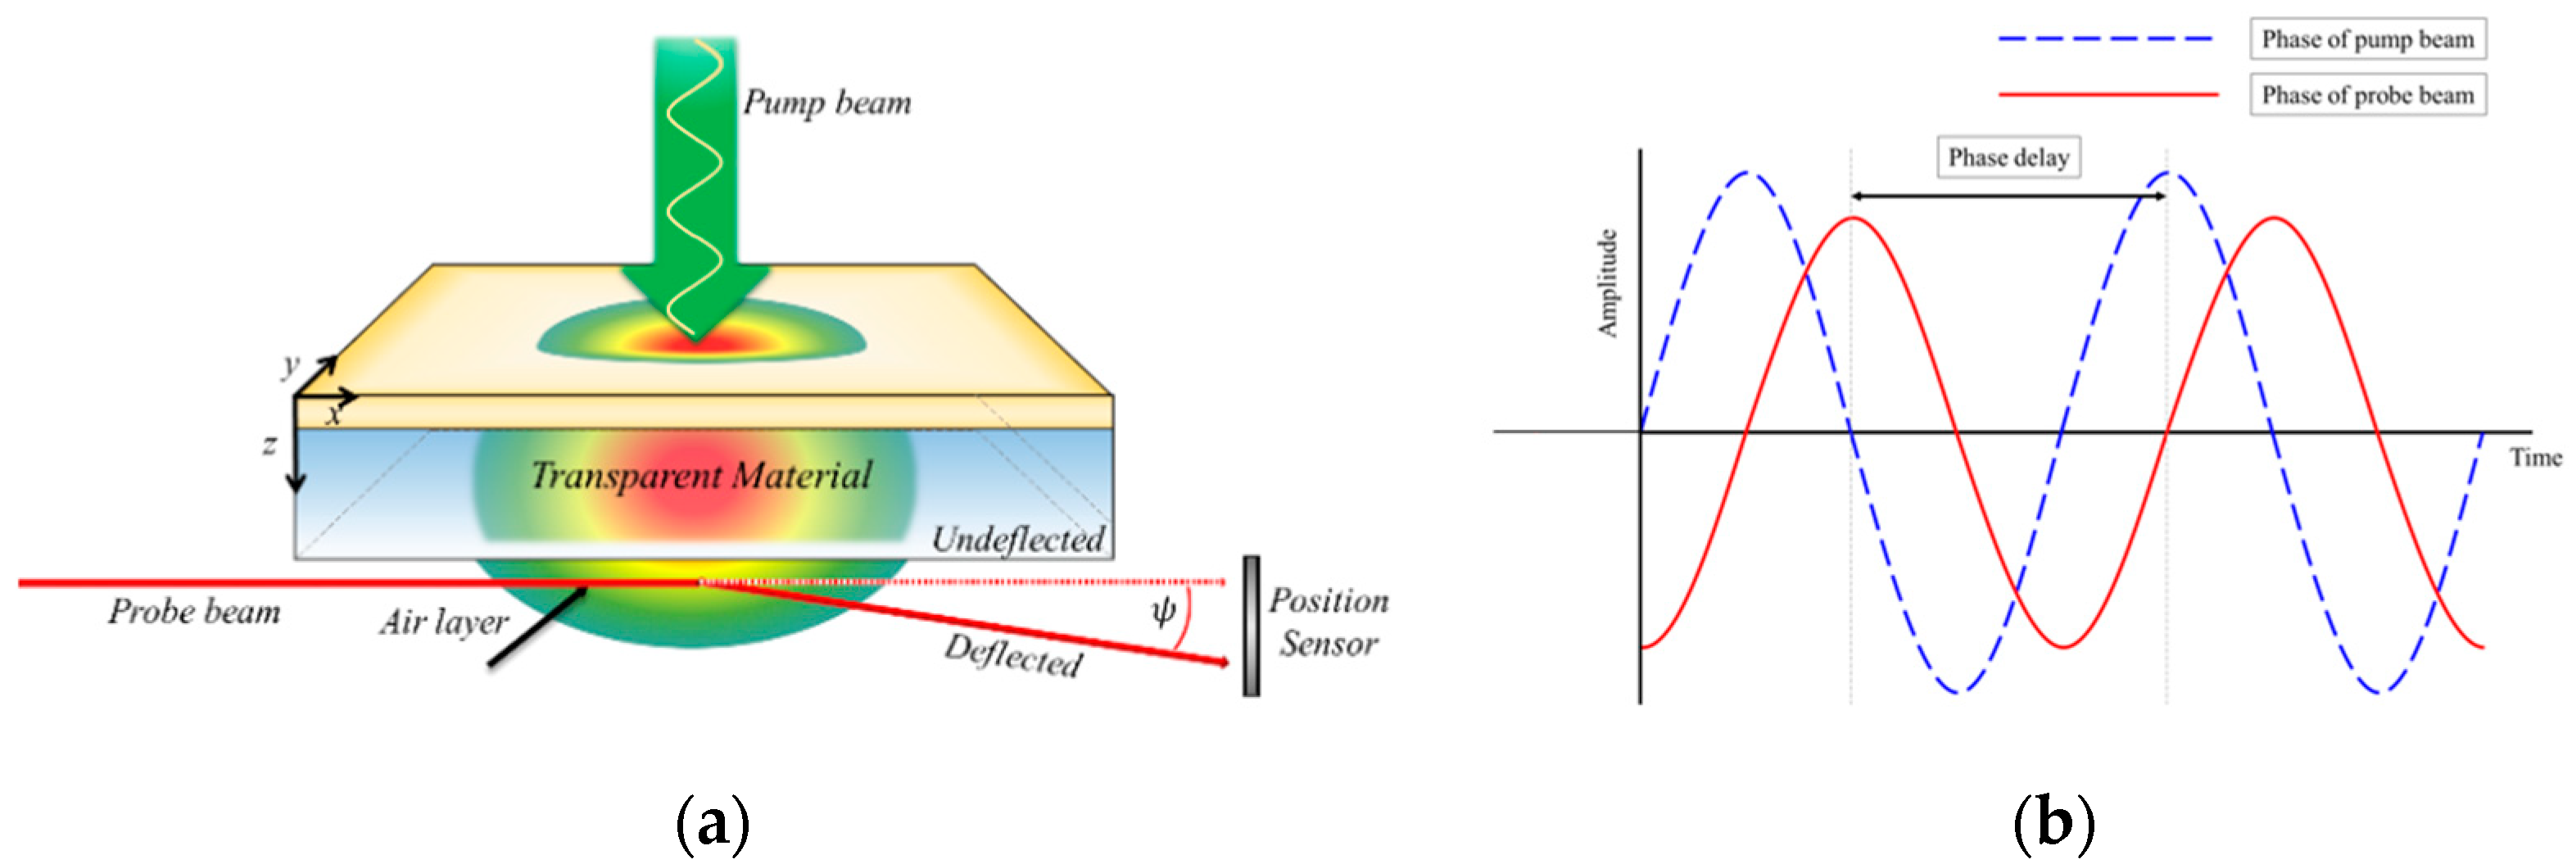
2.1. Rear-Side Photothermal Deflection Method

The photothermal effect describes the phenomenon by which optical energy is converted into thermal energy. The energy level of a material’s surface is increased by collision with photons. The rear-side photothermal deflection method is configured to overcome the limitations of conventional technologies. As shown in Figure 2, the specimen consists of two layers: the thin light absorption film and the target materials. The probe beam was adapted to pass through an air layer at the rear part of the specimen to avoid mutual interference between the pump and probe beam. The light film sufficiently absorbs the energy of the pump beam regardless of the optical and thermal characteristics of the target materials. This was achieved by using copper, which is known to have an optical absorption coefficient of 6.1310 × 10 5   cm 1 [32]. Using Equation (1), the optical absorption length was determined to be as short as 16.31 nm, implying that the entire energy of the pump beam could be absorbed by the surface of the metal film. Furthermore, all the absorbed energy was converted to heat. The conduction causes a periodic temperature gradient in the target materials and in the layers of air at the top and bottom. When the probe beam passes through the temperature gradient of the bottom air layer of the specimen, deflection is generated accordingly. The deflection angle (Φ) for the orientation of the irradiating probe beam can be expressed by Equation (2) below.
L =   1 λ
Φ = p a t h 1 n ( n T ) n T ( x , y , z , t ) d s
Here, n denotes the refractive index, n / T the temperature coefficient of the refractive index, and n T the temperature gradient perpendicular to the path of the probe beam.
Since the method uses a pump beam modulated on a regular cycle, the temperature gradient of the bottom part of the specimen has repeating increases (heating) and decreases (cooling) according to the period of the pump beam. A temporal delay is generated between the bottom temperature gradient and the pump beam according to the thermophysical properties of the target materials. As a result, the deflection period of the probe beam through the bottom temperature gradient is delayed in comparison to the period of the pump beam, as illustrated in Figure 2. This is called a phase delay. The phase delay increases as the relative position between the pump beam and probe beam increases, which is dependent on the thermophysical properties of the materials. The thermal conductivity of the target materials can be derived by analyzing the phase delay according to the relative position between the pump beam and probe beam to the x-axis when using this principle.

2.2. Temperature Distribution and Phase Delay Analysis

The phase delay between the pump beam and probe beam was measured experimentally by the rear-side photothermal deflection method. Temperature distribution information is required to obtain the phase delay through theoretical analysis. To acquire this information, we performed a numerical analysis of a three-dimensional unsteady heat conduction equation with periodic thermal sources shown in Equation (3). Since the increase in specimen temperature due to the pump beam was small, the effects of convection and radiation generated on the front and rear surfaces of the specimen were ignored [33]. Figure 3 shows a schematic diagram including the target materials with the thin light absorption film. The axis perpendicular to the surface of the specimen was set to be the z-axis. Regions 0 and 3 are the air layer around the specimen, which are regions with insufficient optical absorption. Region 1 represents the thin light absorption film and region 2 holds the target materials.
2 T i 1 α i T i t = Q i k i   ( i = front   air   [ 0 ] ,   light   absorption   thin   film   [ 1 ] ,   target   matarial   [ 2 ] ,   rear   air   [ 3 ] )
Q 1 ( x , y , z , t ) = λ 1 P 0 ( 1 R 1 ) 4 π a 2 e ( x 2 + y 2 ) a 2 λ 1 z [ 1 + cos ( ω t ) ]
Q 2 ( x , y , z , t ) = λ 2 P 0 ( 1 R 1 ) ( 1 R 2 ) 4 π a 2 e ( x 2 + y 2 ) a 2 λ 2 ( z L 1 ) λ 1 L 1 [ 1 + cos ( ω t ) ] = 0
P 1 = P 0 ( 1 R 1 )
P 2 = P 0 ( 1 R 1 ) ( 1 R 2 )
Q 1 ( x , y , z , t ) and Q 2 ( x , y , z , t ) represent the heat fluxes of regions 1 and 2, respectively, while λ 1 and λ 2 denote the optical absorption coefficients of the respective regions. R1 and R2 represent the reflexibility of the boundary between regions 0 and 1 and the boundary between regions 1 and 2, respectively. Since the heat flux of the laser is absorbed entirely by the light absorption film, the heat flux of region 2 can be regarded as 0. Equations (8)–(11) summarizes the equations by substituting the heat flux of the region where the optical absorption occurs.
2 T 0 1 α 0 T 0 t = Q 0 k 0 = 0
2 T 1 1 α 1 T 1 t = Q 1 k 1 = λ 1 P 1 4 π k 1 a 2 e r 2 a 2 λ 1 z [ 1 + cos ( ω t ) ]
2 T 2 1 α 2 T 2 t = Q 2 k 2 = 0
2 T 3 1 α 3 T 3 t = Q 3 k 3 = 0
As shown in Equations (12)–(14), boundary conditions with the same temperature and heat flux are applied to the boundaries of each region.
T 0 | z = 0 = T 1 | z = 0   q 0 | z = 0 = q 1 | z = 0
T 1 | z = L 1 = T 2 | z = L 1   q 1 | z = L 1 = q 2 | z = L 2
T 2 | z = L 1 + L 2 = T 3 | z = L 1 + L 2   q 2 | z = L 1 + L 2 = q 3 | z = L 1 + L 2
q 2 = ( k 11 T x + k 22 T y + k 33 T z )
q i = k i T x ( i = 0 , 1 , 2 )
To determine an unsteady heat conduction equation with periodic heat flux to a steady state, complex transformation is applied to Equation (8) using Equation (17), thereby converting it into Equations (18)–(20).
T ( x , y , z , t ) = T ˜ ( x , y , z ) e i ω t
k 1 ( 2 T ˜ 1 x 2 + 2 T ˜ 1 y 2 + 2 T ˜ 1 z 2 ) i ω ρ 1 c p , 1 T ˜ 1   =   P 1 4 π a 2 e ( x 2 + y 2 ) a 2 λ 1 z
k 11 2 T ˜ 2 x 2 + k 22 2 T ˜ 2 y 2 + k 33 2 T ˜ 2 z 2 + ( k 12 + k 21 ) 2 T ˜ 2 x y + ( k 13 + k 31 ) 2 T ˜ 2 x z + ( k 23 + k 32 ) 2 T ˜ 2 y z = i ω ρ 2 c p , 2 T ˜ 2 P 2 4 π a 2 e ( x 2 + y 2 ) a 2 λ 2 ( z L 1 ) λ 1 L 1
k i ( 2 T ˜ i x 2 + 2 T ˜ i y 2 + 2 T ˜ i z 2 ) i ω ρ i c p , i T ˜ i   = 0   ( i = 0 , 3 )
The deflection analysis of the probe beam was performed using the temperature gradient for the path of the probe beam, as described in Equations (1) and (2). Since it is difficult to understand exactly the main crystal orientation of the anisotropic material, a conversion process is needed to make the crystalline coordinates of the anisotropic material consistent with those of an experimental apparatus. Equation (21) was employed to match the crystalline coordinates used in the numerical analysis and the coordinates of the experimental device. When the main crystal orientation of the anisotropic material is known, the effective thermal conductivity coefficient is derived as shown in Figure 4b and Equation (22).
x = X cos θ + Y sin θ y = Y cos θ + X sin θ z = Z
k 1 x 2 + k 2 y 2 + k 3 z 2 = 1 k = k 1 cos 2 θ + k 2 cos 2 φ + k 3 cos 2 σ
where k 11 , k 22 and k 33 are the main thermal conductivity for each main crystal direction, and θ , φ , and σ are the direction cosines for the x-, y-, and z-axis, respectively.
The deflection analysis of the probe beam was conducted using Equation (23), with the beam oriented perpendicular to the specimen and using the temperature gradient derived from numerical analysis after matching the coordinates. The change in the refractive index was generated due to the temperature gradient and refractive index of air.
Φ = 1 n 3 ( n 3 T 3 ) T 3 z d x
Since the deflection analysis result contains complex numbers, the phase delay (ψ) between the probe and pump beam can be expressed as in Equation (24).
ψ = tan 1 ( Im ( Φ ) Re ( Φ ) )

2.3. Numerical Verification

The three-dimensional unsteady heat conduction equation, shown in Equations (18)–(20), was set as a governing equation. It was analyzed in a three-dimensional orthogonal coordinate system as shown in Figure 5, using COMSOL Multiphysics 5.2, a commercial numerical analysis program. The specimen in the numerical analysis model was 25 mm long and 25 mm wide, containing the thin light absorption film with a thickness of 20 μm and a measurement target material with a thickness of 250 μm. The numerical analysis was conducted by using the boundary conditions mentioned in Equations (12)–(14) as the input.
Table 2 presents the results of the mesh dependency evaluation. The value of the phase delay was calculated at the coordinates x = 0, y = 0, and z = −150 µm, and was confirmed to converge at approximately four million meshes. In this study, the value of the phase delay was derived using approximately 6250 thousand meshes.
The relative position phase delay results of the numerical analysis were verified through cross-validation with the same quantity as derived from the theoretical analysis conducted by Jeon et al. [27]. The surface temperature of the pure material combined with the single copper layer was compared with the value calculated when inputting the material properties of copper (as shown in Table 3) for the light absorption film and target material. Comparison of the analytical and numerical results, as shown in Figure 6, demonstrated that the temperature distribution tendencies relative to the position were 99.84% consistent with each other using the least-squares method.

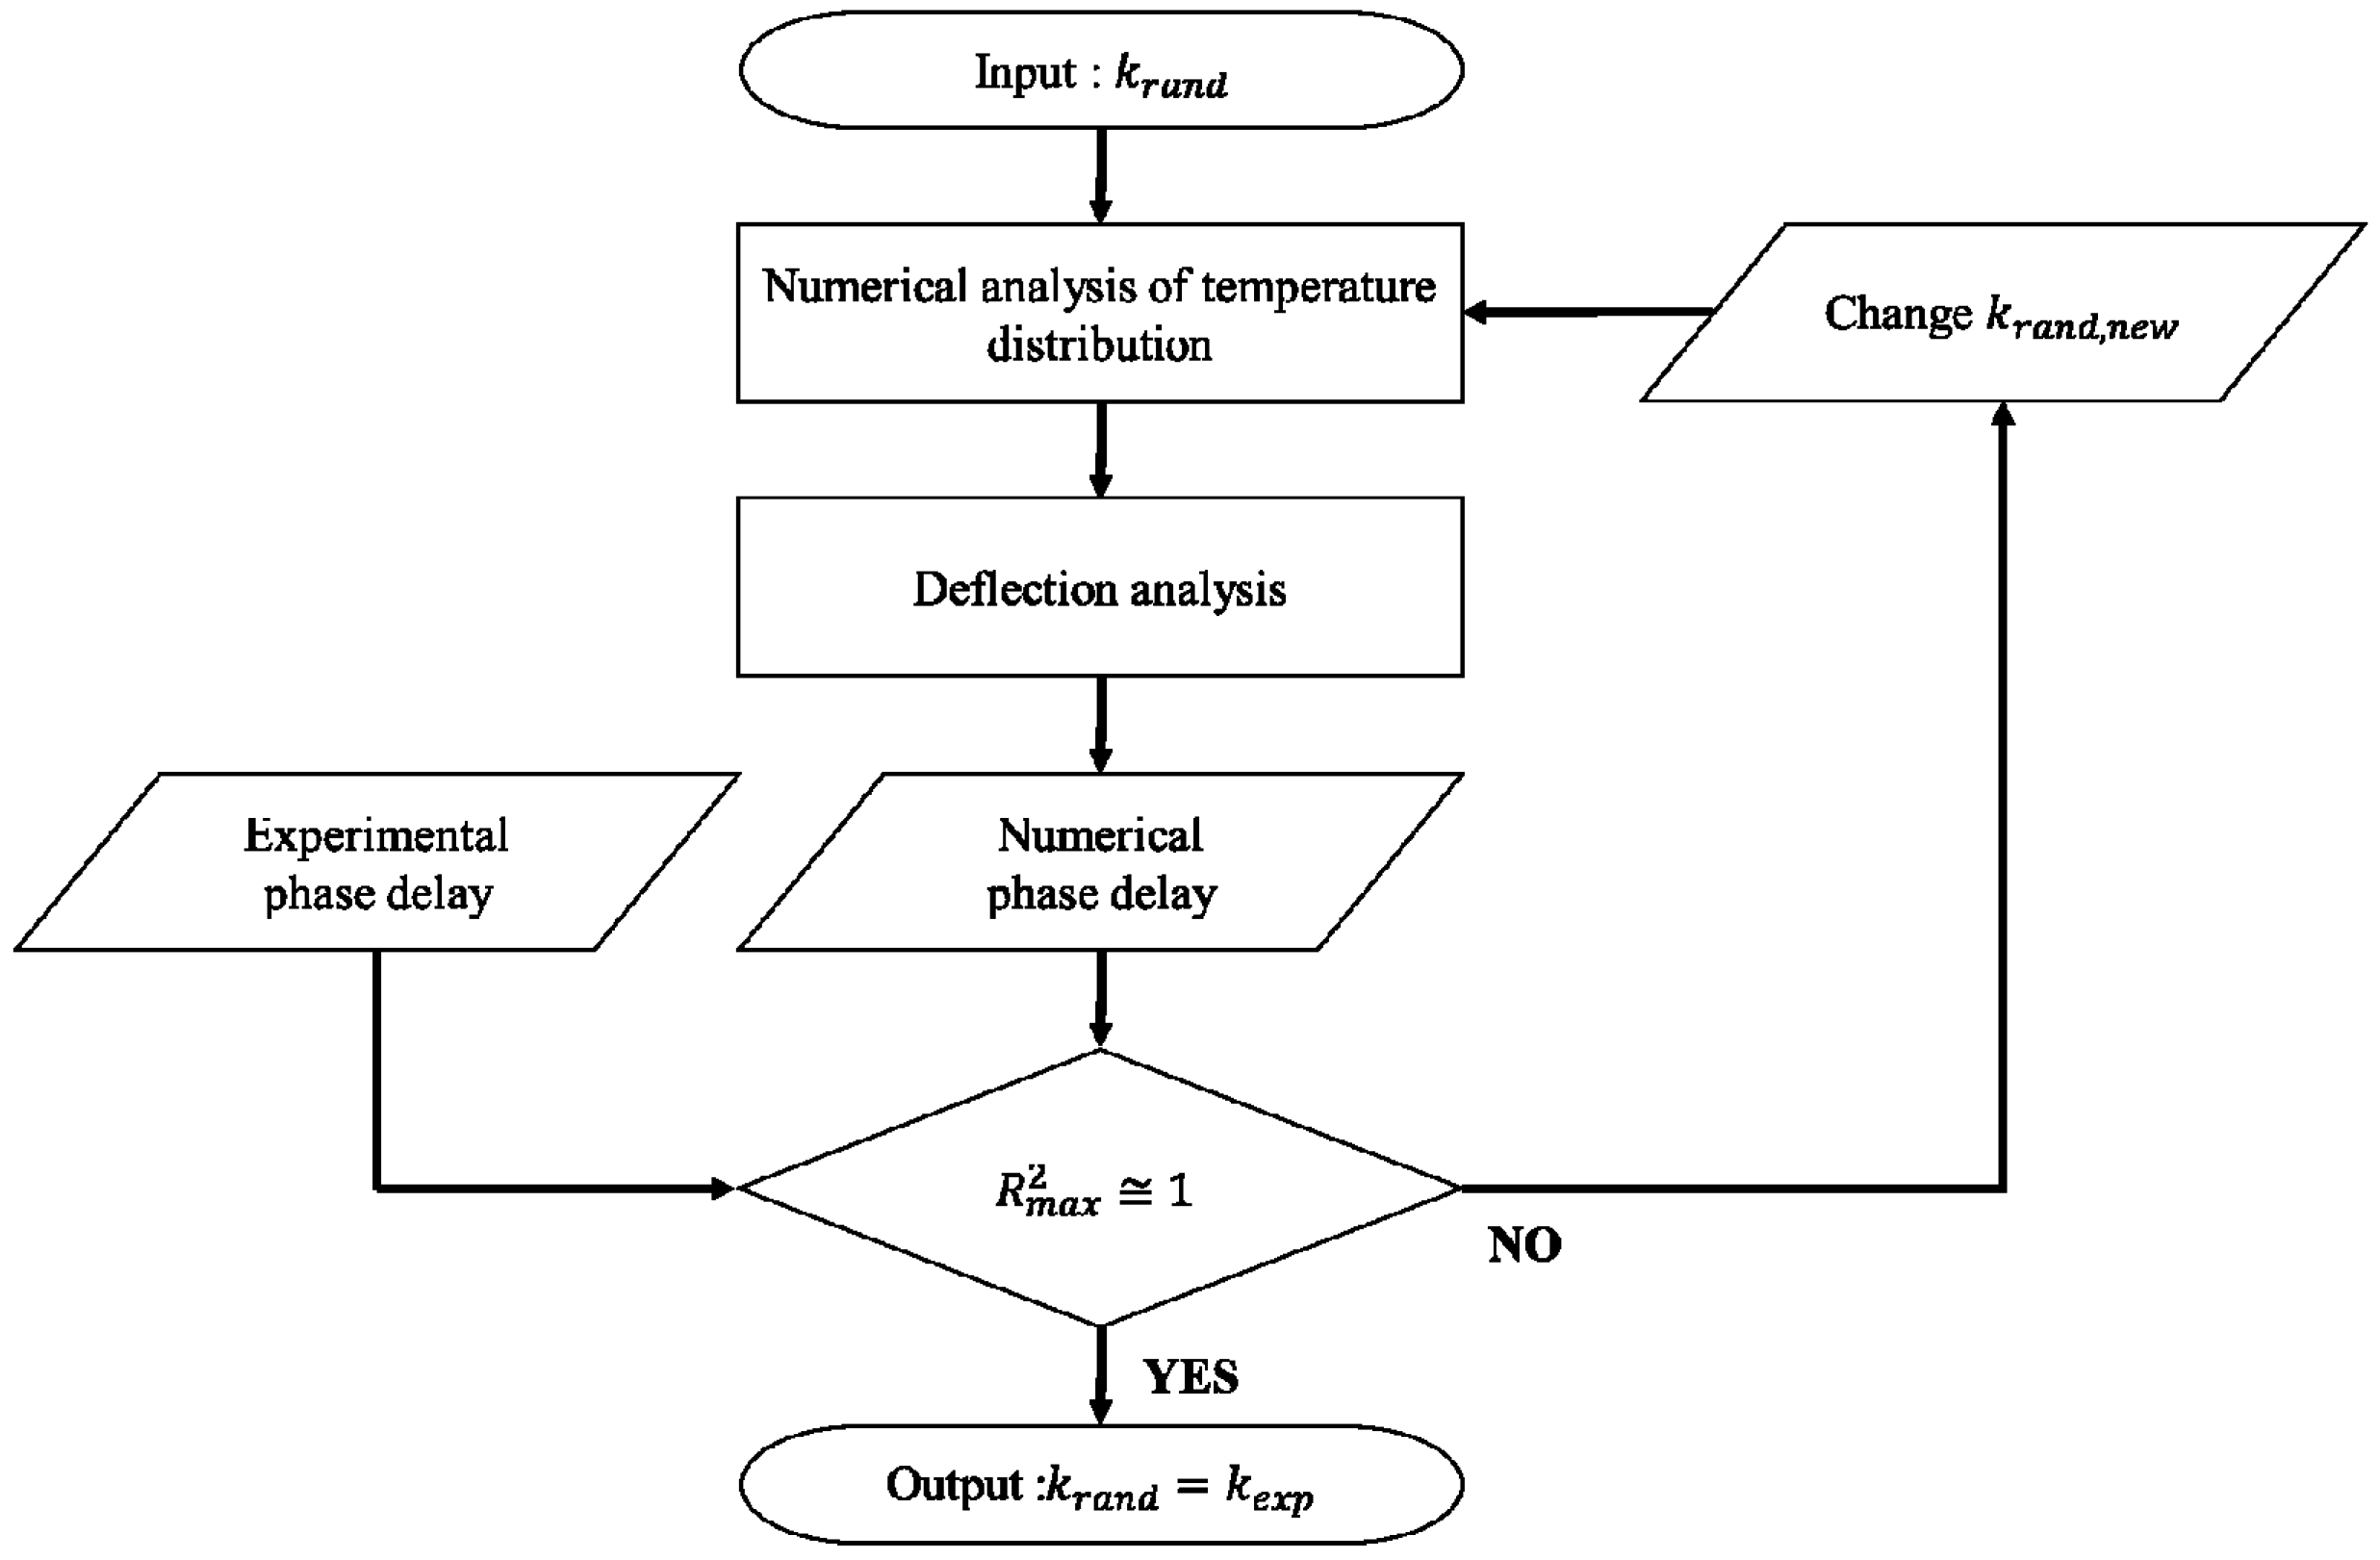
2.4. Algorithm for Determining Thermal Conductivity

The thermal conductivity in the rear-side photothermal deflection method can be examined by comparing the phase delay values from the numerical analysis (measured by inputting a random thermal conductivity) and those from the experiment at various relative positions. When the difference between the numerical results and experimental results are minimal, the thermal conductivity value from the numerical analysis is designated as the thermal conductivity of the measurement target material. Representative methods include a phase gradient method, a zero-crossing method, and a phase curve method. This study used a thermal conductivity determination algorithm based on the phase curve method, as shown in Figure 7.

3. Experimental Investigation

3.1. Specimens for Experiment

The aim of this study was to use the rear-side photothermal deflection method to measure the thermal conductivity of high-optical transmittance transparent materials. Quartz and sapphire glass were selected as the target materials, being respectively isotropic and anisotropic. The target materials were measured in conjunction with a 20 µm-thick copper light absorption film on their surface, added through electroplating. Since the thermophysical properties of the light-absorbing thin-film need to be exactly known to derive the phase delay through numerical analysis, its composition was analyzed using X-ray fluorescence (XRF) of ZSX Primus from Rigaku. The light absorption film was confirmed to have a copper content of 99.95% or more, as shown in Table 4. Through composition analysis, the thermophysical properties of the light absorption thin film were set to match those of copper used in the numerical analysis, as shown in Table 3.
The quartz and sapphire glass were selected as reference transparent materials to verify the rear-side photothermal deflection method. Furthermore, the thermal properties of quartz and sapphire glass, the targets for the measurement of the thermal conductivity, are summarized in Table 5. The target materials have a wafer shape with a thickness of 250 µm and a diameter of 50.8 mm. The product of COMA Technology Co., Ltd. in Republic of Korea was used for quartz, and MTIKorea’s a-plane was used for sapphire glass.

3.2. Experimental Apparatus

Figure 8 shows a schematic diagram of the experimental apparatus and optical arrangement. The pump beam was a continuous-wave, diode-pumped solid-state (DPSS) source with a 532 nm wavelength laser in Gaussian distribution, owned by Sprout-G. For implementing periodic heating, a sine-wave modulated frequency was formed using a mechanical chopper of Stanford Research Systems (SRS). In addition, a New port He–Ne laser with 633 nm wavelength and 5 mW intensity was used as the probe beam. The relative position between the pump beam and the probe beam was adjusted every 100 μm using a Newport M-TS50DC.5 motorized-stage. The phase difference of the probe beam generated by the temperature gradient of the air layer was measured using a Hamamatsu Photonics C100443-01 photoelectric position sensor. The phase delay was derived using the deflection angle of the probe beam, measured in the position sensor and an AMETEK 7270 DSP lock-in amplifier with respect to the modulated frequency of the mechanical chopper.
The detailed alignments of the specimen, pump beam, and probe beam are illustrated in Figure 3, and the intensity of the pump beam, the diameter of the pump beam, the height of the probe beam, the relative position between the pump and probe beam, and the modulated frequency of the pump beam were set as shown in Table 6. The thermophysical measurement technique using the photothermal effect cannot use a section between 0 mm and 0.15 mm owing to the interference between the pump and the probe beam [31]. However, because the technique used in this study has no interference owing to the characteristics of the optical alignment, it can use the entire section between 0 mm and 0.6 mm to obtain the phase delay. After obtaining approximately 300 results for 30 s in one relative position, the phase delay used an arithmetic mean of the data as a representative value with a 95% confidence level.

4. Results

Figure 9a shows that there is a clear maximum point in the coefficient of determination, both in measurements of the phase delay according to the relative position of quartz and the measurements through numerical analysis. The same thermal conductivity used for the numerical analysis was set as the thermal conductivity of the measurement target material. The resulting measurements of the designated thermal conductivity along with the experimental delay results are shown in Figure 9b. The phase delay measurement used the mean of the 300 result values measured for 30 s with an interval of 0.1 s in each relative position, with a 95% confidence level. The phase delay of the point of each graph was used the three repeated measurements to the average value, and the standard deviation us represented through an error bar. As mentioned previously, the rear-side mirage deflection method, applying a light absorption thin film, physically prevented mutual interference between the pump and the probe beam, as compared to the collinear deflection method [31], which is one of the existing measurement methods for transparent materials. Thus, the relative position at 0 mm can be accurately measured for the phase delay signal. That is typically applied to quartz and sapphire glass as shown in the figures.
Upon comparing the experimental results with the reference value of the thermal conductivity of the target materials shown in Table 5, the absolute error was confirmed to be 0.069 W/m-K, as shown in Table 7.
Figure 10 shows that there is a clear maximum point of the coefficient of determination through comparison of the measured phase delay results at a relative position according to the crystal orientation of sapphire glass and the phase delay calculated through numerical analysis with the material properties shown in Table 5. The thermal conductivity to the maximum coefficient of determination input into the numerical analysis was designated as the thermal conductivity of the measurement target material. The phase delay measurement was conducted at crystal orientations between 0° and 90° with an interval of 30°.
Upon comparing the experimental results with the reference values of the thermal conductivity of sapphire glass shown in Table 5, the maximum absolute error was confirmed to be 0.25 W/m-K. The results of the thermal conductivity determination according to the crystal orientations ( θ = 0 ° ,   30 ° ,   60 ° ,   90 ° ) of sapphire glass as the transparent anisotropic material are summarized in Figure 11 and Table 8.

5. Conclusions

This study aimed to measure the thermal conductivity of transparent materials by using the rear-side photothermal deflection method, selecting quartz as a transparent isotropic material and sapphire glass as a transparent anisotropic material. The existing methods were incapable of measuring the thermal conductivity of the transparent material with a low absorption rate or were limited in using the conventional photothermal effect with a large error. However, this study significantly improved the limitations, and the results were obtained as follows:
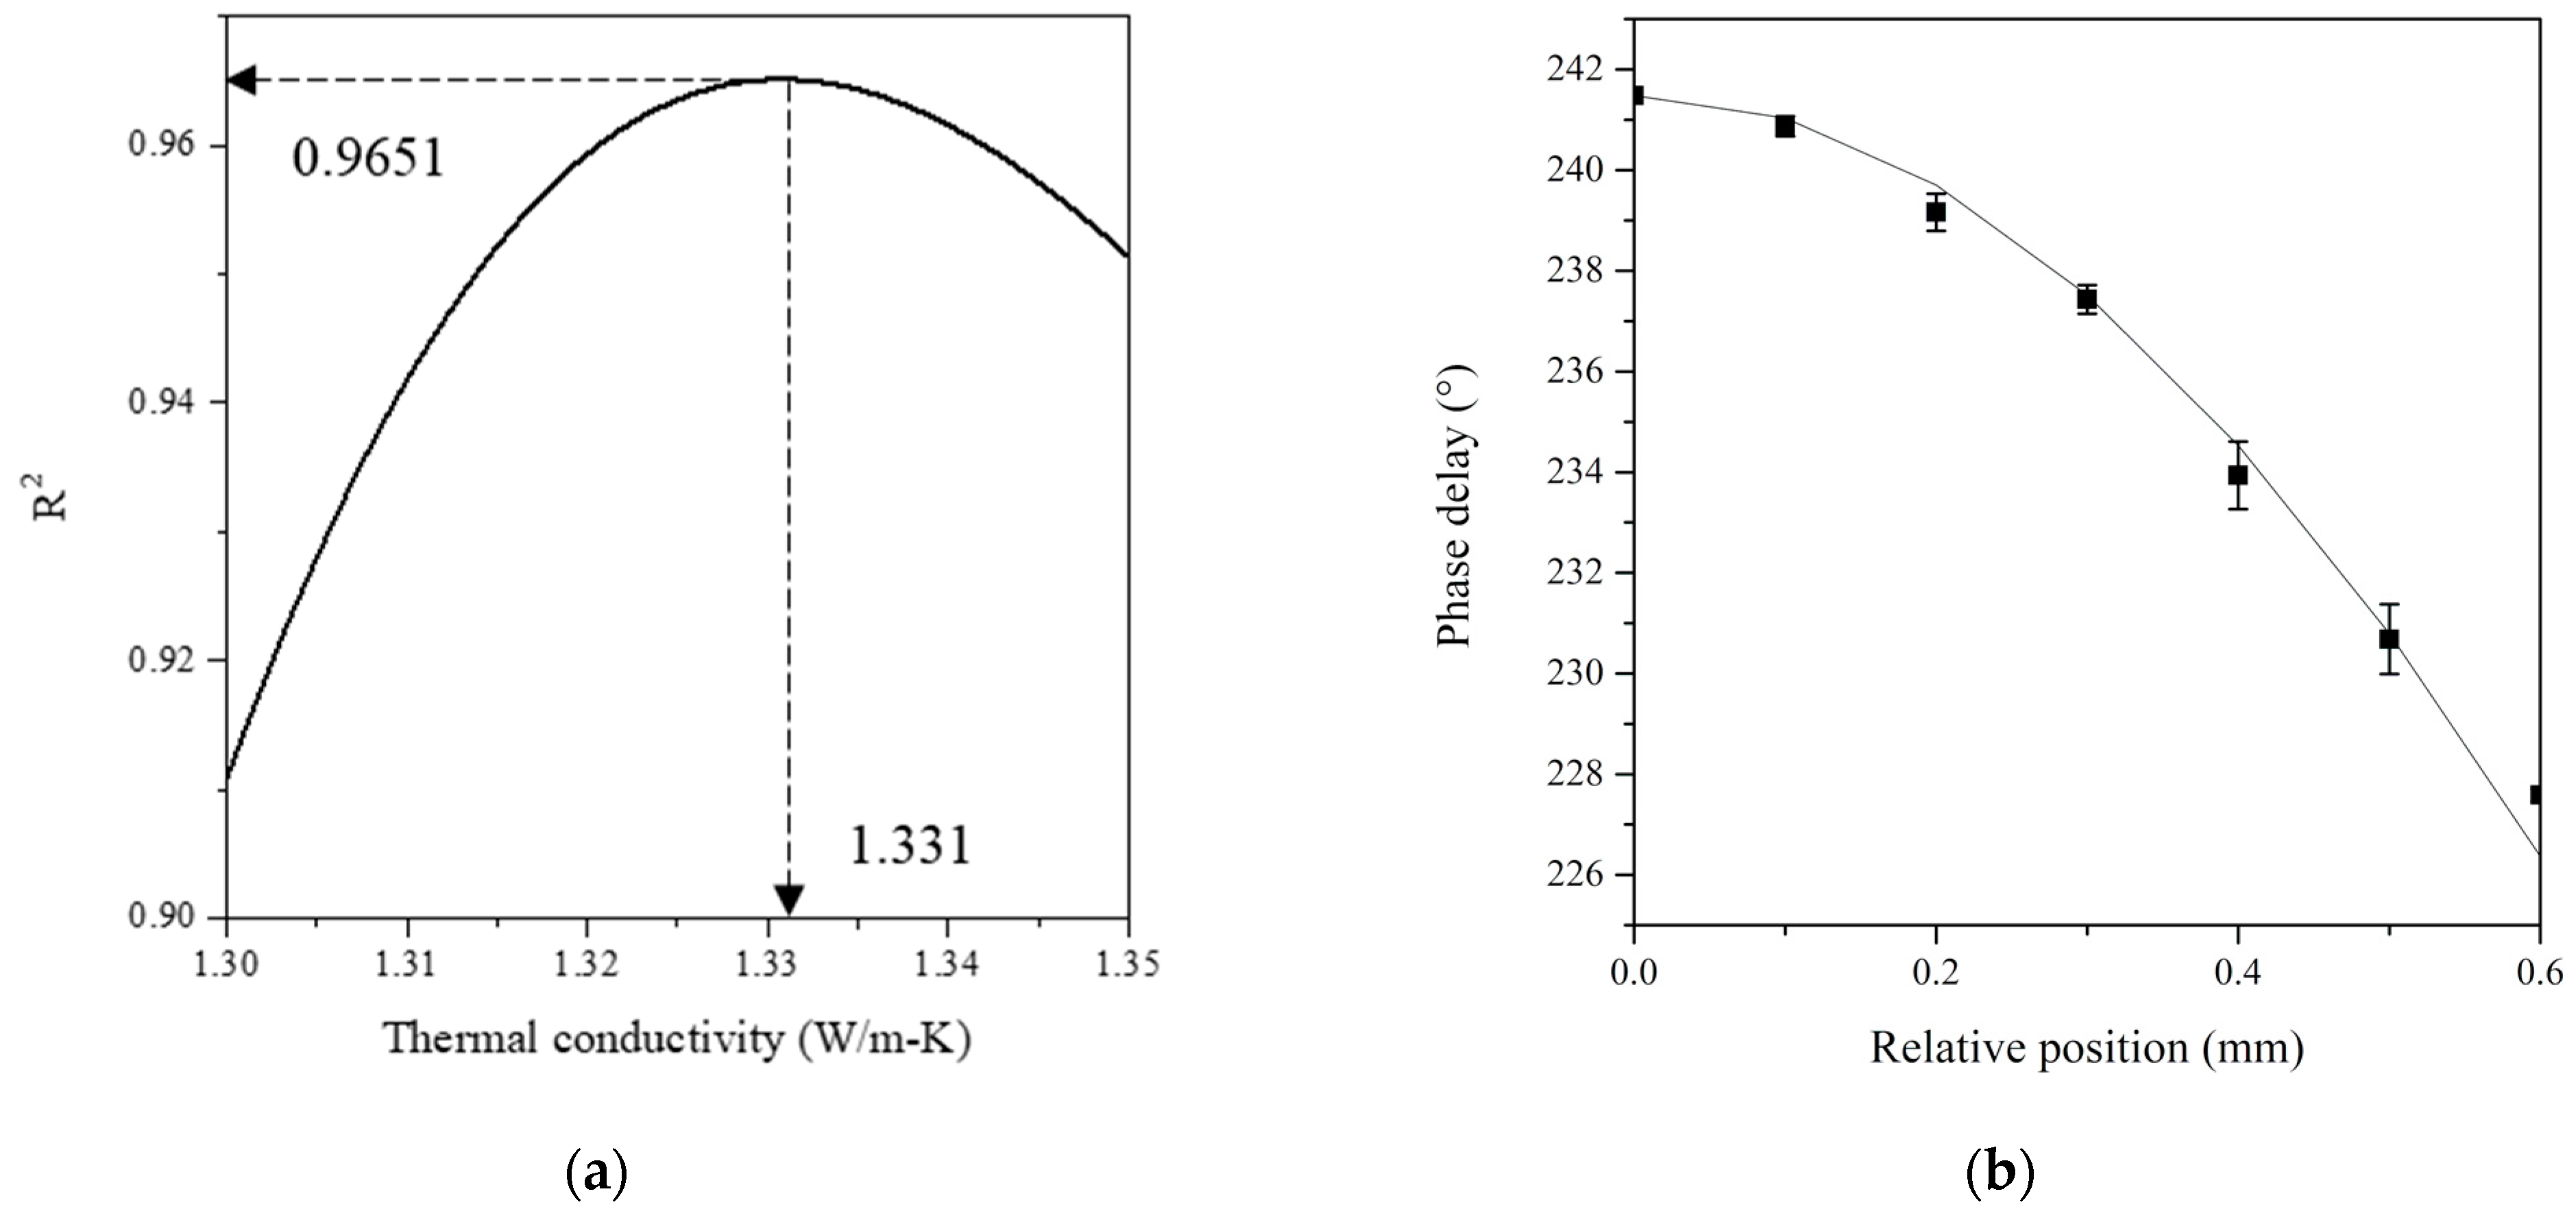
  • By applying the phase delay derived through the numerical analysis of quartz and the phase delay measured through the optical alignment to the thermal conductivity determination algorithm, the absolute error and the relative error of the thermal conductivity were derived to be 0.2 W/m-K and 5%, respectively.
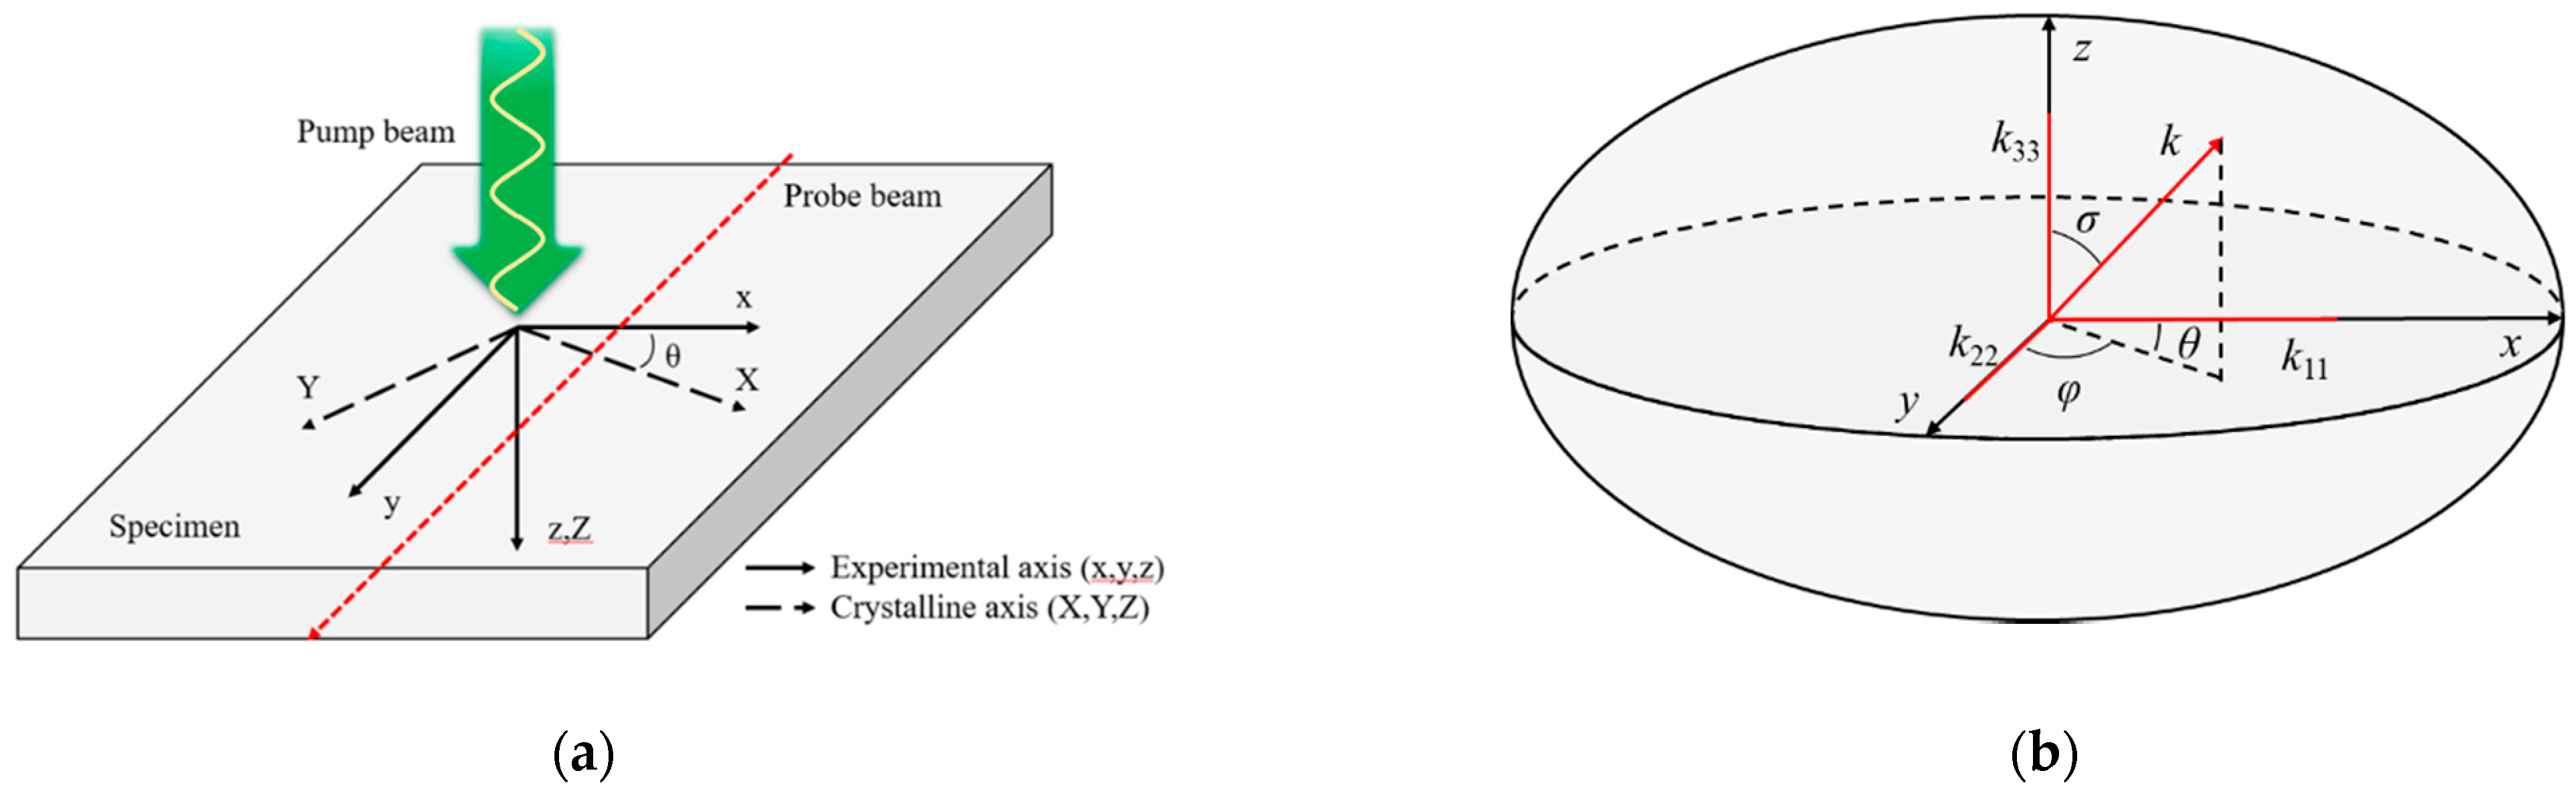
  • For sapphire glass, which is an orthogonal anisotropic material, valid thermal conductivity for crystal orientations of 0 ° ,   30 ° ,   60 ° ,   and   90 ° was derived and confirmed from the theoretical value. The sapphire glass used for the measurement is a plane having k11, k22, and k33, respectively known to be 36.1 W/m-K, 27.1 W/m-K, and 36.1 W/m-K.
  • As a result of determining the thermal conductivity by applying the phase delay derived through the experiment with respect to each crystal orientation of sapphire glass and the phase delay measured through the numerical analysis of the thermal conductivity determination algorithm, the maximum absolute error and relative error were derived to be 0.55 W/m-K and 1.5%, respectively.
  • The limitation of anisotropic materials is that they must be measured in a situation where the main crystal orientation can be known. This limitation may be overcome in the future by experimentally developing a mechanism that can determine this information.

Author Contributions

Conceptualization, G.K. and J.Y.; methodology, G.K.; software, S.K.; validation, G.K., D.K., and S.K.; formal analysis, H.K.; investigation, D.K.; resources, S.K.; data curation, S.K.; Writing—Original draft preparation, G.K.; Writing—Review and editing, H.K.; visualization, D.K.; supervision, H.K.; project administration, J.Y.; funding acquisition, J.Y. and H.K. All authors have read and agreed to the published version of the manuscript.

Funding

This work was supported by the National Research Foundation of Korea (NRF) grant funded by the Korean government (MSIT), grant number NRF-2018R1A2B2001082. This research was also supported by the Basic Science Research Program through the National Research Foundation of Korea (NRF) funded by the Ministry of Education, grant number NRF-2015R1D1A1A01060704.

Institutional Review Board Statement

Not applicable.

Informed Consent Statement

Not applicable.

Conflicts of Interest

The authors declare no conflict of interest.

References

  1. Takatori, H.; Hiraiwa, M.; Yano, H.; Iwata, H. Large-scale projection-based immersive display: The design and implementation of largespace. In Proceedings of the 2019 IEEE Conference on Virtual Reality and 3D User Interfaces (VR), Osaka, Japan, 23–27 March 2019; pp. 557–565. [Google Scholar]
  2. Kwon, J.; Suh, Y.D.; Lee, J.; Lee, P.; Han, S.; Hong, S.; Yeo, J.; Lee, H.; Ko, S.H. Recent progress in silver nanowire based flexible/wearable optoelectronics. J. Mater. Chem. C 2018, 6, 7445–7461. [Google Scholar] [CrossRef]
  3. Krupka, J.; Geyer, R.G.; Kuhn, M.; Hinken, J.H. Dielectric properties of single crystals of Al/sub 2/O/sub 3/, LaAlO/sub 3/, NdGaO/sub 3/, SrTiO/sub 3/, and MgO at cryogenic temperatures. IEEE Trans. Microw. Theory Tech. 1994, 42, 1886–1890. [Google Scholar] [CrossRef]
  4. Zhao, D.; Qian, X.; Gu, X.; Jajja, S.A.; Yang, R. Measurement techniques for thermal conductivity and interfacial thermal conductance of bulk and thin film materials. J. Electron. Packag. 2016, 138, 040802. [Google Scholar] [CrossRef] [Green Version]
  5. Powell, R.; Taylor, R. Multi-Property Apparatus and Procedure for High Temperature Determinations; Purdue University: Lafayette, IN, USA, 1970. [Google Scholar]
  6. Taylor, R.; Kimbrough, W.; Powell, R. Thermophysical properties of tantalum, tungsten, and tantalum-10 wt. per cent tungsten at high temperatures. J. Less Common Met. 1971, 24, 369–382. [Google Scholar] [CrossRef]
  7. Cahill, D.G.; Katiyar, M.; Abelson, J.R. Thermal conductivity ofa-Si:H thin films. Phys. Rev. B 1994, 50, 6077–6081. [Google Scholar] [CrossRef]
  8. Cezairliyan, A. Design and operational characteristics of a high-speed (millisecond) system for the measurement of thermophysical properties at high temperatures. J. Res. Natl. Bur. Stand. Sect. C: Eng. Instrum. 1971, 75, 7. [Google Scholar] [CrossRef]
  9. Cezairliyan, A.; Miiller, A.P. Specific heat capacity and electrical resistivity of a carbon-carbon composite in the range 1500–3000 K by a pulse heating method. Int. J. Thermophys. 1980, 1, 317–326. [Google Scholar] [CrossRef]
  10. Cezairliyan, A.; Morse, M.; Beckett, C. Measurement of melting point and electrical resistivity (above 2,840 deg K) of molybdenum by a pulse heating method. Revue Internationale des Hautes Températures et des Refractaires 1970, 7, 382–388. [Google Scholar]
  11. Sell, J. Photothermal Investigations of Solids and Fluids; Elsevier: Amsterdam, The Netherlands, 2012. [Google Scholar]
  12. Taylor, R. Determination of thermophysical properties by direct electric heating. High. Temp. High. Press. 1981, 13, 9–22. [Google Scholar]
  13. Arai, T.; Baba, T.; Ono, A. Thermographic investigation of laser flash diffusivity measurement. High. Temp. High. Press. 1987, 19, 269–273. [Google Scholar]
  14. Deem, H.W.; Wood, W.D. Flash Thermal-Diffusivity Measurements Using a Laser. Rev. Sci. Instrum. 1962, 33, 1107. [Google Scholar] [CrossRef]
  15. Salazar, A.; Sánchez-Lavega, A.; Fernandez, J. Thermal diffusivity measurements in solids by the “mirage” technique: Experimental results. J. Appl. Phys. 1991, 69, 1216–1223. [Google Scholar] [CrossRef]
  16. Spear, J.D.; Russo, R.E.; Silva, R.J. Collinear photothermal deflection spectroscopy with light-scattering samples. Appl. Opt. 1990, 29, 4225–4234. [Google Scholar] [CrossRef] [PubMed]
  17. Murphy, J.C.; Aamodt, L.C. Photothermal spectroscopy using optical beam probing: Mirage effect. J. Appl. Phys. 1980, 51, 4580. [Google Scholar] [CrossRef]
  18. Jackson, W.B.; Amer, N.M. Direct measurement of gap-state absorption in hydrogenated amorphous silicon by photothermal deflection spectroscopy. Phys. Rev. B 1982, 25, 5559–5562. [Google Scholar] [CrossRef] [Green Version]
  19. Jackson, W.B.; Amer, N.M.; Boccara, A.C.; Fournier, D. Photothermal deflection spectroscopy and detection. Appl. Opt. 1981, 20, 1333–1344. [Google Scholar] [CrossRef]
  20. Bertolotti, M.; Voti, R.L.; Liakhou, G.; Sibilia, C. On the photodeflection method applied to low thermal diffusivity measurements. Rev. Sci. Instrum. 1993, 64, 1576–1583. [Google Scholar] [CrossRef]
  21. Bertolotti, M.; Liakhou, G.L.; Ferrari, A.; Ralchenko, V.G.; Smolin, A.A.; Obraztsova, E.D.; Korotoushenko, K.G.; Pimenov, S.; Konov, V. Measurements of thermal conductivity of diamond films by photothermal deflection technique. J. Appl. Phys. 1994, 75, 7795–7798. [Google Scholar] [CrossRef]
  22. Olmstead, M.A.; Amer, N.M.; Kohn, S.; Fournier, D.; Boccara, A.C. Photothermal displacement spectroscopy: An optical probe for solids and surfaces. Appl. Phys. A 1983, 32, 141–154. [Google Scholar] [CrossRef]
  23. Opsal, J.; Rosencwaig, A. Thermal-wave depth profiling: Theory. J. Appl. Phys. 1982, 53, 4240–4246. [Google Scholar] [CrossRef]
  24. Opsal, J.; Rosencwaig, A.; Willenborg, D.L. Thermal-wave detection and thin-film thickness measurements with laser beam deflection. Appl. Opt. 1983, 22, 3169–3176. [Google Scholar] [CrossRef] [PubMed]
  25. Jeon, P.; Lee, K.; Yoo, J.; Park, Y.; Lee, J. The theoretical study of the measuring thermal diffusivity of semi-infinite solid using the photothermal displacement. KSME Int. J. 2004, 18, 1712–1721. [Google Scholar] [CrossRef]
  26. Jeon, P.; Kim, J.; Kim, H.; Yoo, J. Thermal conductivity measurement of anisotropic material using photothermal deflection method. Thermochim. Acta 2008, 477, 32–37. [Google Scholar] [CrossRef]
  27. Jeon, P.; Lee, E.; Lee, K.; Yoo, J. A theoretical study for the thermal diffusivity measurement using photothermal deflection scheme. Energy Eng. J. 2001, 10, 63–70. [Google Scholar]
  28. Salazar, A.; Sanchez-Lavega, A.; Fernández, J. Thermal diffusivity measurements on solids using collinear mirage detection. J. Appl. Phys. 1993, 74, 1539–1547. [Google Scholar] [CrossRef]
  29. Salazar, A.; Sanchez-Lavega, A.; Ocáriz, A.; Guitonny, J.; Pandey, J.C.; Fournier, D.; Boccara, A.C.; Sanchez-Lavega, A. Novel results on thermal diffusivity measurements on anisotropic materials using photothermal methods. Appl. Phys. Lett. 1995, 67, 626–628. [Google Scholar] [CrossRef]
  30. Spear, J.D.; Silva, R.J.; Klunder, G.L.; Russo, R.E. Collinear photothermal deflection spectroscopy of liquid samples at varying temperature. Appl. Spectrosc. 1993, 47, 1580–1584. [Google Scholar] [CrossRef]
  31. Kim, M.; Park, K.; Kim, G.; Yoo, J.; Kim, D.-K.; Kim, H. Collinear deflection method for the measurement of thermal conductivity of transparent single layer anisotropic material. Appl. Sci. 2019, 9, 1522. [Google Scholar] [CrossRef] [Green Version]
  32. Johnson, P.B.; Christy, R.W. Optical constants of the noble metals. Phys. Rev. B 1972, 6, 4370–4379. [Google Scholar] [CrossRef]
  33. Yang, W.; Guo, X.; Guo, Q. A high-cycle fatigue energy dissipation accurate estimation method considering natural convection and radiation heat transfer. Int. J. Fatigue 2020, 138, 105717. [Google Scholar] [CrossRef]
  34. Lide, D.R. CRC Handbook of Chemistry and Physics; CRC Press: Boca Raton, FL, USA, 2004; Volume 85. [Google Scholar]
  35. Incropera, F.P. Convection Heat Transfer in Electronic Equipment Cooling. J. Heat Transf. 1988, 110, 1097–1111. [Google Scholar] [CrossRef]
Figure 1. Methods of measuring thermal conductivity using photothermal effect: (a) displacement method; (b) mirage deflection method; (c) collinear deflection method.
Applsci 11 01535 g001
Figure 2. (a) Schematic diagram of a rear-side photothermal deflection method; (b) an example of phase difference derivation.
Applsci 11 01535 g002
Figure 3. Schematic of rear-side photothermal deflection method.
Applsci 11 01535 g003
Figure 4. (a) Crystalline coordinates of anisotropic material and coordinates of experimental apparatus; (b) effective thermal conductivity of anisotropic material.
Applsci 11 01535 g004
Figure 5. Double-layer structure model and boundary conditions.
Applsci 11 01535 g005
Figure 6. Theoretical [27] and numerical analysis of temperature distribution on a specimen surface.
Applsci 11 01535 g006
Figure 7. Schematic diagram for determining thermal conductivity algorithm for rear-side photothermal deflection method.
Applsci 11 01535 g007
Figure 8. Schematic diagram of optical align of rear-side photothermal deflection method.
Applsci 11 01535 g008
Figure 9. (a) Thermal conductivity showing a maximum coefficient of determination for quartz; (b) phase delay experiment analysis results according to the relative position.
Applsci 11 01535 g009
Figure 10. (ad) Thermal conductivity curves of sapphire glass, showing a maximum coefficient of determination; (eh) phase delay experiment and analysis results according to the relative position.
Applsci 11 01535 g010aApplsci 11 01535 g010b
Figure 11. Results of thermal conductivity determination for sapphire glass.
Applsci 11 01535 g011
Table 1. Limitations of contact and non-contact thermophysical property measurement technologies.
MethodLimitation
ContactDC heating [5,6,7]Conductive materials only
Pulse heating [8,9,10]Conductive materials only
Laser calorimetry [11]Large amount of heat loss
3ω Method [12]Complexity damage of specimen
Non-ContactPhoto Acoustic [11]Low accuracy
Laser Flash [13,14]Damage of specimen and limitation of shape/size
Photothermal radiometry [11]Problem of emissivity factor
Photothermal reflection [11]Standardization of roughness on surface of specimen
Photothermal displacement [11]Surface treatment of specimen
Photothermal deflection [11]Increase of S/N
Table 2. Mesh dependency evaluation.
Number of MeshPhase Delay (°)
125,375145.6057
784,036147.5570
1,434,175148.1252
2,873,162148.0972
4,000,894147.5738
6,254,729147.5345
7,345,315147.5596
8,732,682147.5505
Table 3. Input material properties used for analysis model verification (copper and air).
Copper [34]Air [35]
Density(kg/m3)89301.161
Specific Heat(J/kg-K)3851007
Thermal Conductivity(W/m-K)3850.0263
Table 4. Results of analysis of the composition of light absorption thin film.
MaterialRate (Mass%)
Cu99.9461
S0.0223
P0.0316
Table 5. Properties of materials used in the experiment.
Thermal Conductivity
(W/m-K)
Specific Heat
(J/kg-°C)
Density
(kg/m3)
Quartz1.47102650
Sapphire glass k 11 36.17613980
k 22 27.1
k 33 36.1
Table 6. Optical Conditions used in the experiment.
ConditionValue
Intensity of pump beam (W)1
Radius of pump beam (μm)75
Distance to probe beam from rear side surface (μm)150
Relative position (mm)0 to 0.6 (interval 0.1)
Modulated frequency (Hz)20
Table 7. Result of thermal conductivity determination for quartz.
Thermal Conductivity Reference Value
(W/m-K)
Thermal Conductivity Experimental Value
(W/m-K)
Absolute Error
(W/m-K)
Relative Error
(%)
Quartz1.41.3310.0695
Table 8. Result thermal conductivity determination according to the crystal orientation of sapphire glass.
Crystal Orientation
(°)
Thermal Conductivity
Reference Value
(W/m-K)
Thermal Conductivity
Experimental Value (W/m-K)
Absolute Error
(W/m-K)
Relative Error
(%)
027.1026.870.230.8
3029.4029.330.070.2
6033.8534.060.210.6
9036.1036.650.551.5
Publisher’s Note: MDPI stays neutral with regard to jurisdictional claims in published maps and institutional affiliations.

