1. Introduction
Recently, skin cancer incidence is rising due to the increase in UV exposure. Skin cancer is largely divided into three types such as basal cell carcinoma, squamous cell carcinoma and malignant melanoma. Among them, malignant melanoma, which is known to be the most dangerous, is caused by malignant changes in melanocytes in the skin or mucous membrane. Over time, melanoma metastasizes to surrounding tissues through lymphatic vessels or blood vessels, and the probability of recurrence is high even if treated with the excision of the affected area. Treatment through excision causes bleeding in the affected area and surrounding tissues, and there is a risk of secondary infection in the incision [
1,
2,
3,
4]. To overcome this, photothermal therapy is drawing attention as an alternative treatment to conventional surgical methods [
5,
6]. Photothermal therapy is a treatment technique that kills tumor tissue through heat using the photothermal effect. Being non-invasive, it has the advantage of less risk of secondary infection and faster recovery after treatment compared to conventional surgical methods [
7,
8]. However, photothermal therapy has the limitation that penetration depth of the optical excitation radiation required for sub-tissue heat generation is relatively short (up to about 5 mm) due to light absorption and scattering of biological tissues [
9].
Photothermal therapy uses the heat energy generated through various methods such as microwave, electromagnetic pulse, and so on. Among them, the lasers in the near-infrared spectral range are widely used because of their ease in controlling the heating intensity and heating range [
10,
11,
12]. However, in general tissues, as shown in
Figure 1, light absorption occurs less in the near-infrared range than in the visible range. Therefore, by injecting a light absorption enhancer into the tumor tissue, the light absorption coefficient is increased only in the tumor tissues, thereby causing the death of the tumor cells due to temperature elevation [
13]. Among various light absorption enhancers, gold nanoparticles (GNPs) are widely used because of their harmlessness to the human body and their facile synthesis and surface modification, as well as their strongly enhanced and tunable optical properties [
14,
15,
16,
17].
Depending on the temperature, various types of cell death exist in tissues including cancer cells [
19,
20,
21]. If a cancer cell death happens in the form of necrosis, there is a possibility of cancer recurrence and metastasis by affecting surrounding tissues; thus, inducing cancer cell deaths by apoptosis is critical. Generally, a cell undergoes necrosis if the temperature of the cell is higher than 50 °C and apoptosis if it is between 43 and 50 °C [
19,
20,
21]. In photothermal therapy, when the intensity of laser irradiation on the tissue increases and the amount of GNPs in tumor tissues increases, this leads to the excessive temperature rise of tumor tissues, thereby causing thermal damage to surrounding tissues and necrosis of the tumor tissue. Conversely, when the intensity of laser irradiation on the tumor is too low or the amount of GNPs input into tumor cells is too little, temperature elevation in tumor cells is not sufficient, thereby causing incomplete removal of tumor cells. Therefore, in photothermal therapy, it is critical to maintain the therapeutic temperature range in which apoptosis incurs but does not cause excessive heating and damage to the surrounding tissues [
22].
Based on these conditions, various studies on photothermal therapy are being conducted. Rengan et al. [
23] studied LiposAu nanoparticles, which can kill cancer cells by photothermal therapy. Through in situ experiments performed on small animals, they confirmed that hepatocytes were degraded, and particles were removed through the hepatobiliary and kidney pathways. Additionally, a 750 nm wavelength NIR laser was used to completely remove the tumor implanted in the mouse, thereby confirming the possibility of photothermal therapy. Wang et al. [
24] developed a numerical analysis model on the tumors injected with GNPs and confirmed the temperature distribution of tumors located on the skin surface and the surrounding tissues through the Monte Carlo method. The temperature in the medium for the size of various tumors, the intensity of the irradiated laser, and the volume fraction of GNPs in the tumor over time were evaluated, and thermal damage to the tumor and surrounding tissues was confirmed through the Arrhenius equation. Sazgarnia et al. [
25] confirmed the effect on the gold/gold sulfide (GGS) nanoshells in the NIR laser in photothermal therapy through numerical analysis and experiments. In their study, the intensity and period of the laser were adjusted, and the temperature distribution of the medium was confirmed according to whether GGS was injected or not. In summarizing the studies through experiments and numerical analysis, it was confirmed that the tumor was killed by irradiating a laser to the tumor injected with the light absorption enhancer, and the temperature distribution in the medium according to various conditions was confirmed. Further, the thermal damage of the medium was confirmed through the Arrhenius equation. Although the Arrhenius damage integral is an appropriate indicator for quantifying thermal damage, this equation represents the thermal damage of tissues over time. It is challenging to quantitatively express the stages of various thermal damages to tissues determined by the level of temperature. Therefore, it is challenging to find the area corresponding to the apoptosis targeted in this study. It was also not possible to quantitatively present the results of apoptosis according to the size of the tumor, the intensity of the laser, the volume fraction of GNPs in the tumor, and the amount of thermal damage to surrounding normal tissues. In addition, skin cancer tumors exist at various depths from the skin surface, and the skin layer consists of several layers with different physical properties. There is insufficient research on the treatment of tumors located at various depths while considering the physical properties of each skin layer. Lastly, even if the temperature in the tumor reaches between 43 and 50 °C, which corresponds to the temperature range of apoptosis, whether apoptosis proceeds immediately or begins to proceed after a certain period has not been clearly investigated.
Accordingly, in this study, the absorbed heat quantity and temperature distribution in the steady-state situation were evaluated according to changes in the various intensities of lasers, tumor location, size, and volume fraction of GNPs through numerical analysis, targeting skin cancer tumors at a certain depth from the skin surface to the reticular dermis layer. Therefore, this study attempted to estimate the apoptosis of the tumor, the thermal damage on the tumor, and surrounding normal tissues. To this end, we present the optimal laser intensity and the volume fraction of GNPs that produce the optimal photothermal therapy using the four variables proposed in our previous work.
2. Materials and Methods
2.1. Monte Carlo Method and Heat Transfer Model
When a laser is irradiated on a tissue, the laser is absorbed in the vicinity of the irradiation, and scattering occurs simultaneously by the medium. To analyze these behaviors, the Monte Carlo method is used in the field of bioheat transfer [
26]. This technique probabilistically calculates the behavior of photons irradiated through a number selected at random, considering not only photons absorbed by the medium but also photons scattered at the same time.
Variables computed through random numbers are the distance and angle that the photon travels. A photon’s moving distance per 1 step is determined as in Equation (1) through the attenuation coefficient, which is the sum of absorption coefficient and scattering coefficient, where
S is the photon’s moving distance per 1 step,
is the random number generated between 0 and 1, and
are the attenuation coefficient, absorption coefficient, and scattering coefficient of the medium, respectively.
When a photon travels 1 step, the energy of the photon decreases due to absorption in the medium. The energy reduction of a photon is determined by the ratio of the absorption coefficient and the attenuation coefficient of the medium as shown in Equation (2). Here,
W is the energy weight of the photon.
In the case of the angle in which photon travels, the deflection angle and the azimuthal angle are calculated as Equations (3) and (4), respectively, by the anisotropy coefficient, where
is the anisotropy coefficient,
represents deflection angle, and
is the azimuthal angle.
Once deflection angle and azimuthal angle are determined, angles the photon travels in the Cartesian coordinate system can be determined as in Equations (5)–(7), where,
,
,
are the directional cosines for each axis.
If the photon travels at an angle that is perpendicular to the tissue surface, the movements are expressed as shown in the Equations (8)–(10).
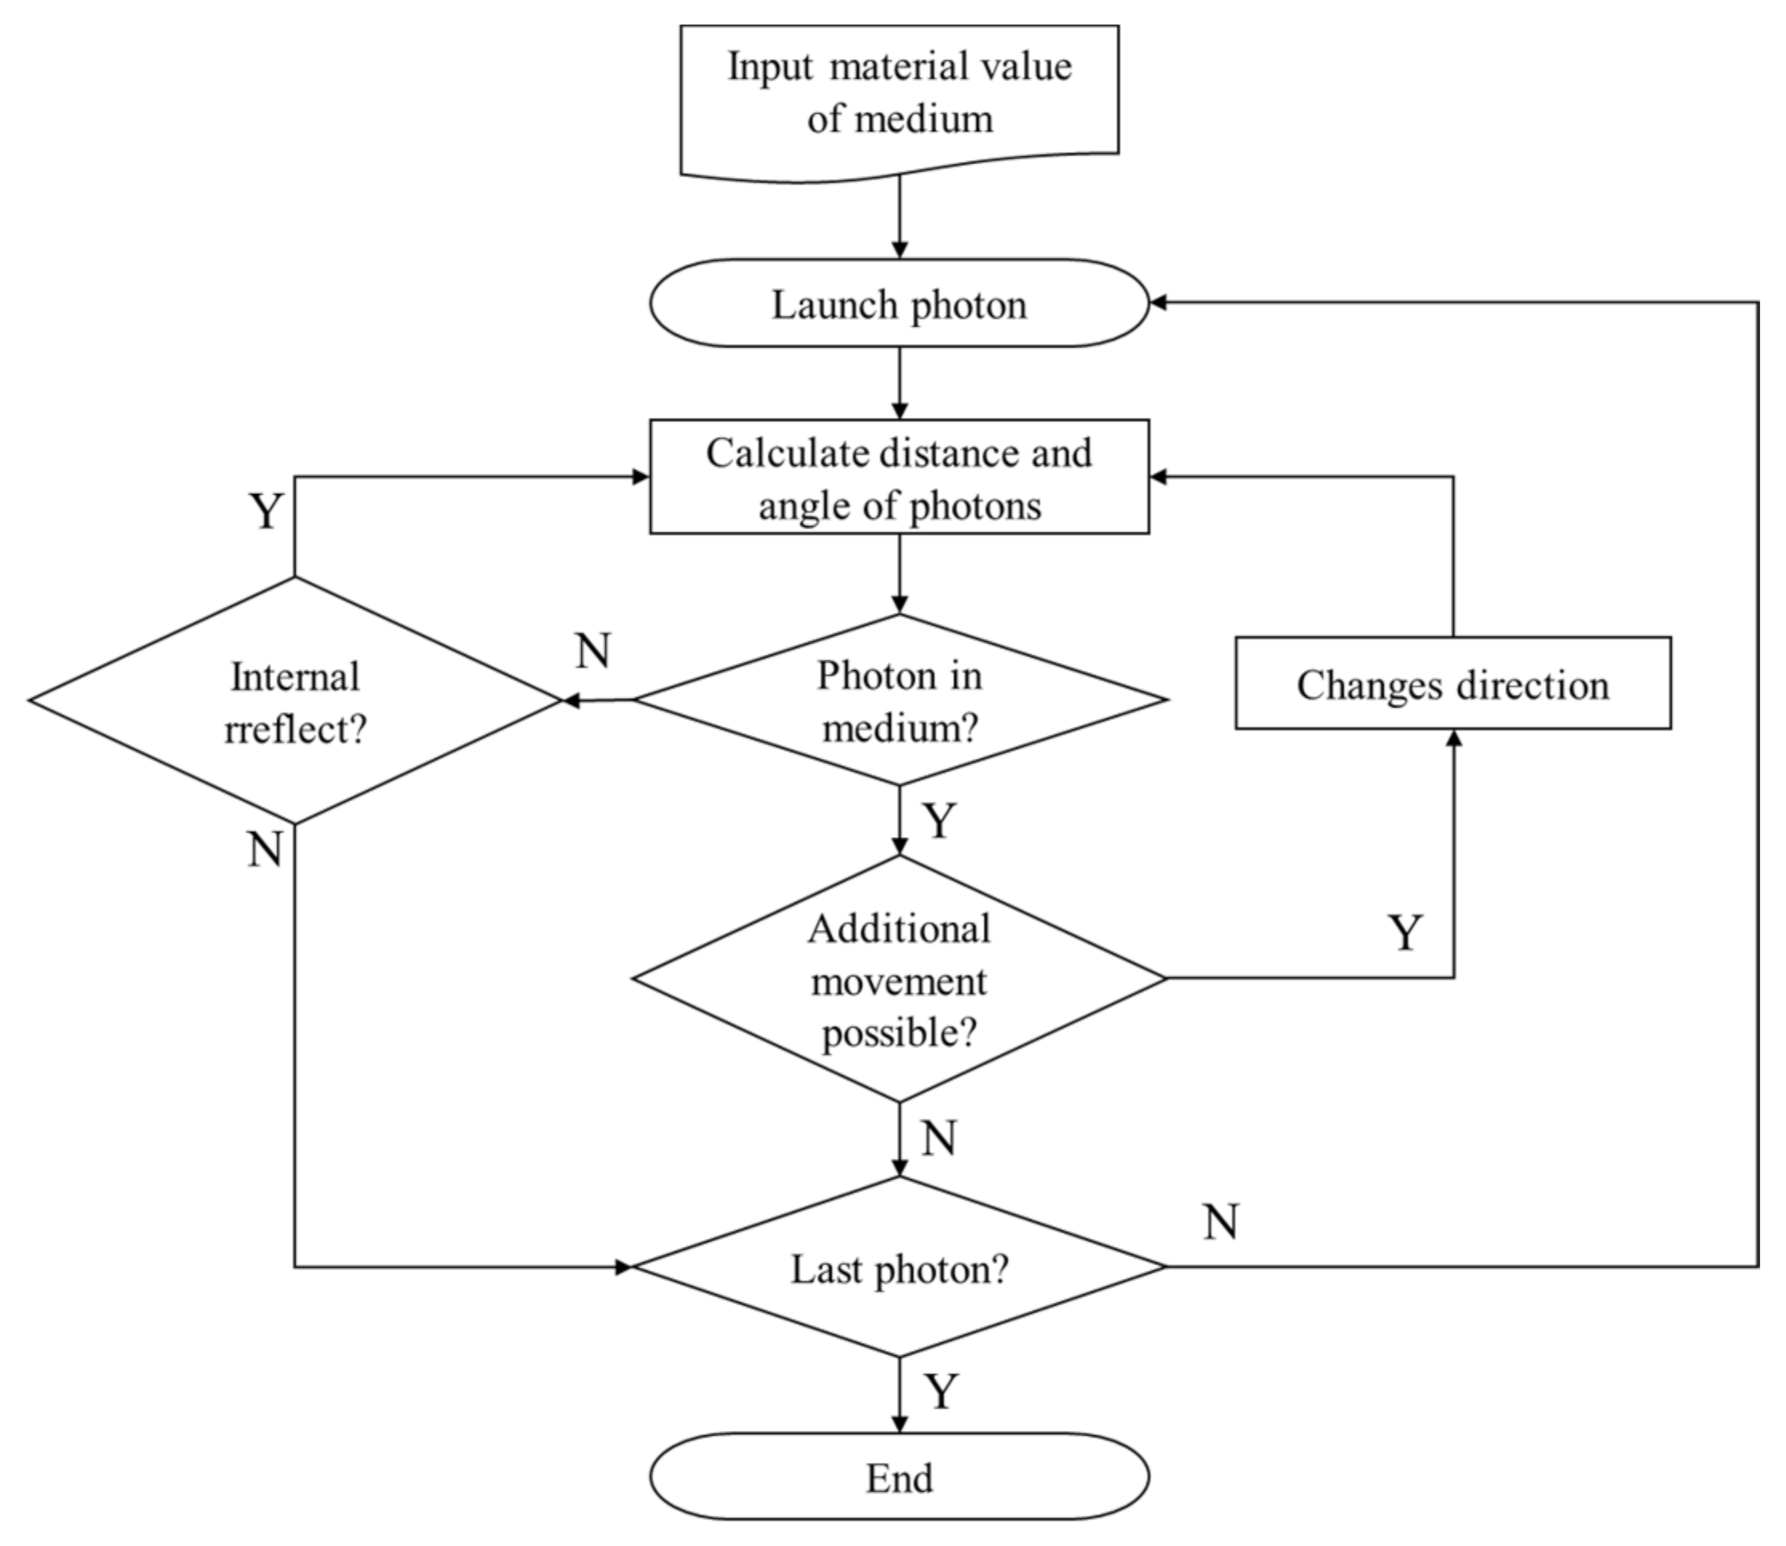
Finally, when the distance and angle of the photon are determined, it moves until the energy is exhausted. In
Figure 2, the process of calculating the distance and angle of photons travel using the Monte Carlo method is summarized. In this study, the code proposed by Marti et al. [
27] was used.
When the final path of photon movement is determined, the absorption distribution of heat in the medium is determined according to the intensity of the irradiated laser per unit area and the absorption coefficient of the medium. This allows the temperature distribution of the medium to be calculated. The temperature distribution is calculated using the thermal diffusion equation as shown in Equation (11), qhere
is the volumetric heat source,
is the thermal conductivity of the medium,
is the density, and
is the heat capacity.
The equation is calculated through the explicit finite element method as shown in Equation (11) below, where
is the intensity of the laser,
is Fluence rate, and
are infinitesimal length for each axis [
27].
2.2. Apoptotic Variable
As described earlier, in photothermal therapy, it is very important not to cause thermal damage to the surrounding normal tissues by maintaining a temperature range in which apoptosis occurs when laser irradiation on a tumor. Therefore, this study employed four variables related to apoptosis proposed by Kim et al. [
28].
First, the apoptosis ratio (
), which is a variable indicating how much apoptosis occurs in the tumor tissue, is determined as the ratio of the volume corresponding to the temperature range of 43–50 °C, where apoptosis occurs to the total tumor volume. The apoptosis ratio has a value of 1 when apoptosis occurs in all parts of the tumor and a value of 0 when vice versa.
The Thermal Hazard Value, which represents the degree of thermal damage to normal and tumor tissues, is determined as in Equation (12) by assigning weights to each phenomenon that appears in the tissue according to temperature. The phenomenon in biological tissues appearing according to each temperature band is shown in
Table 1 [
29].
For the tumor tissue, cell death occurs between 43 and 50 °C, but because it is apoptosis, which this study wants to establish, the weight is given as 1. For the normal tissue, under the same condition, apoptosis occurs as the death of normal cells; therefore, the weight was given as 2.
However, as shown in Equation (12), even if the volume of the tumor and the temperature distribution of the tumor and surrounding normal tissues are the same, the degree of thermal damage varies depending on the volume of the normal tissue. Therefore, in this study, the distance from the end of the tumor to the normal tissue, which is 50% of the length of the tumor tissue, was set as the area included in the analysis, and the thermal risk was evaluated.
Lastly, the effective apoptosis ratio (
), which simultaneously evaluates thermal damage to normal tissues and apoptosis of tumor tissues, is determined by the ratio of
and
as calculated earlier. Since the effective apoptosis ratio (
) in Equation (13) represents the relative value of the degree of thermal damage to normal tissue and the degree to which apoptosis is induced in tumor tissue, it can be said that the greater the effective apoptosis ratio (
), the more effective photothermal therapy was induced. By using this criterion, it is possible to derive the optimal conditions in which apoptosis occurred in as many locations as possible in the tumor tissue, and at the same time, thermal damage to the surrounding normal tissue is minimized.
2.3. Validation of Monte Carlo Method
To validate the Monte Carlo method used in this study, the results of this study were compared to those of Ren et al. [
30] and Soni et al. [
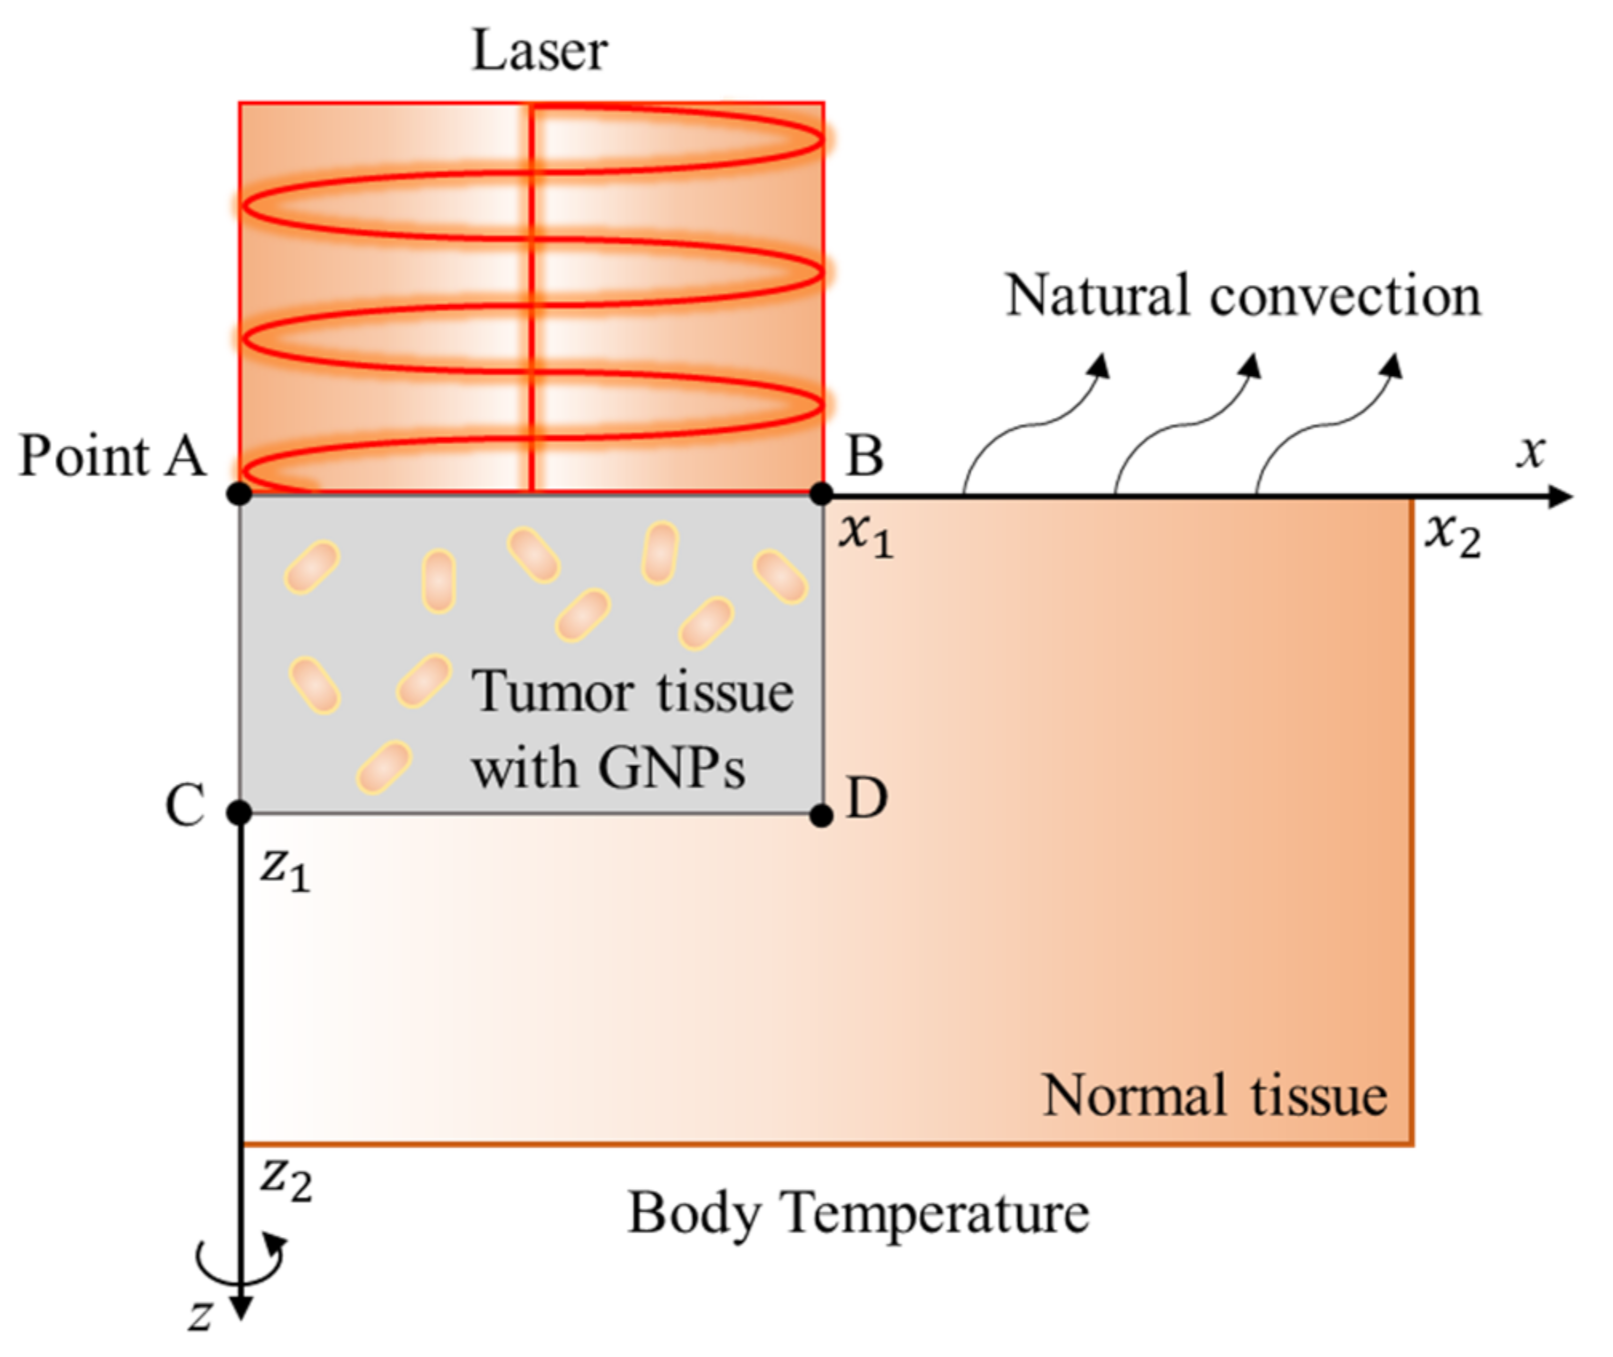
31] under the same conditions. The schematic diagram of the numerical analysis model is shown in
Figure 3. The physical properties of the tumor tissue existing from the surface were uniformly mixed according to the concentration of GNPs, and the temperature distribution between the tumor tissue and the surrounding normal tissue was evaluated. Here,
,
,
,
, the intensity of the irradiated laser is
, and the radius of the laser is the same as that of the tumor. In addition, natural convection occurs on the skin surface, and the initial temperature of normal tissues and tumor tissues is assumed to be normal human body temperature, 37 °C. The thermal/optical properties used in the calculation are shown in
Table 2.
Comparison with relevant studies is listed in
Figure 4.
Figure 4a shows the temperature change over time at the center of the tumor (point A) when the intensity of the irradiated laser is
;
Figure 4b shows the change in the
x direction of temperature with respect to the depth of the tumor tissue at
. Under the same study conditions, the results of this study showed an error within 1.7% when compared with those of existing studies. This confirmed that the numerical analysis model using the Monte Carlo method used in this study is in good agreement with the previous studies.
2.4. Numerical Investigation
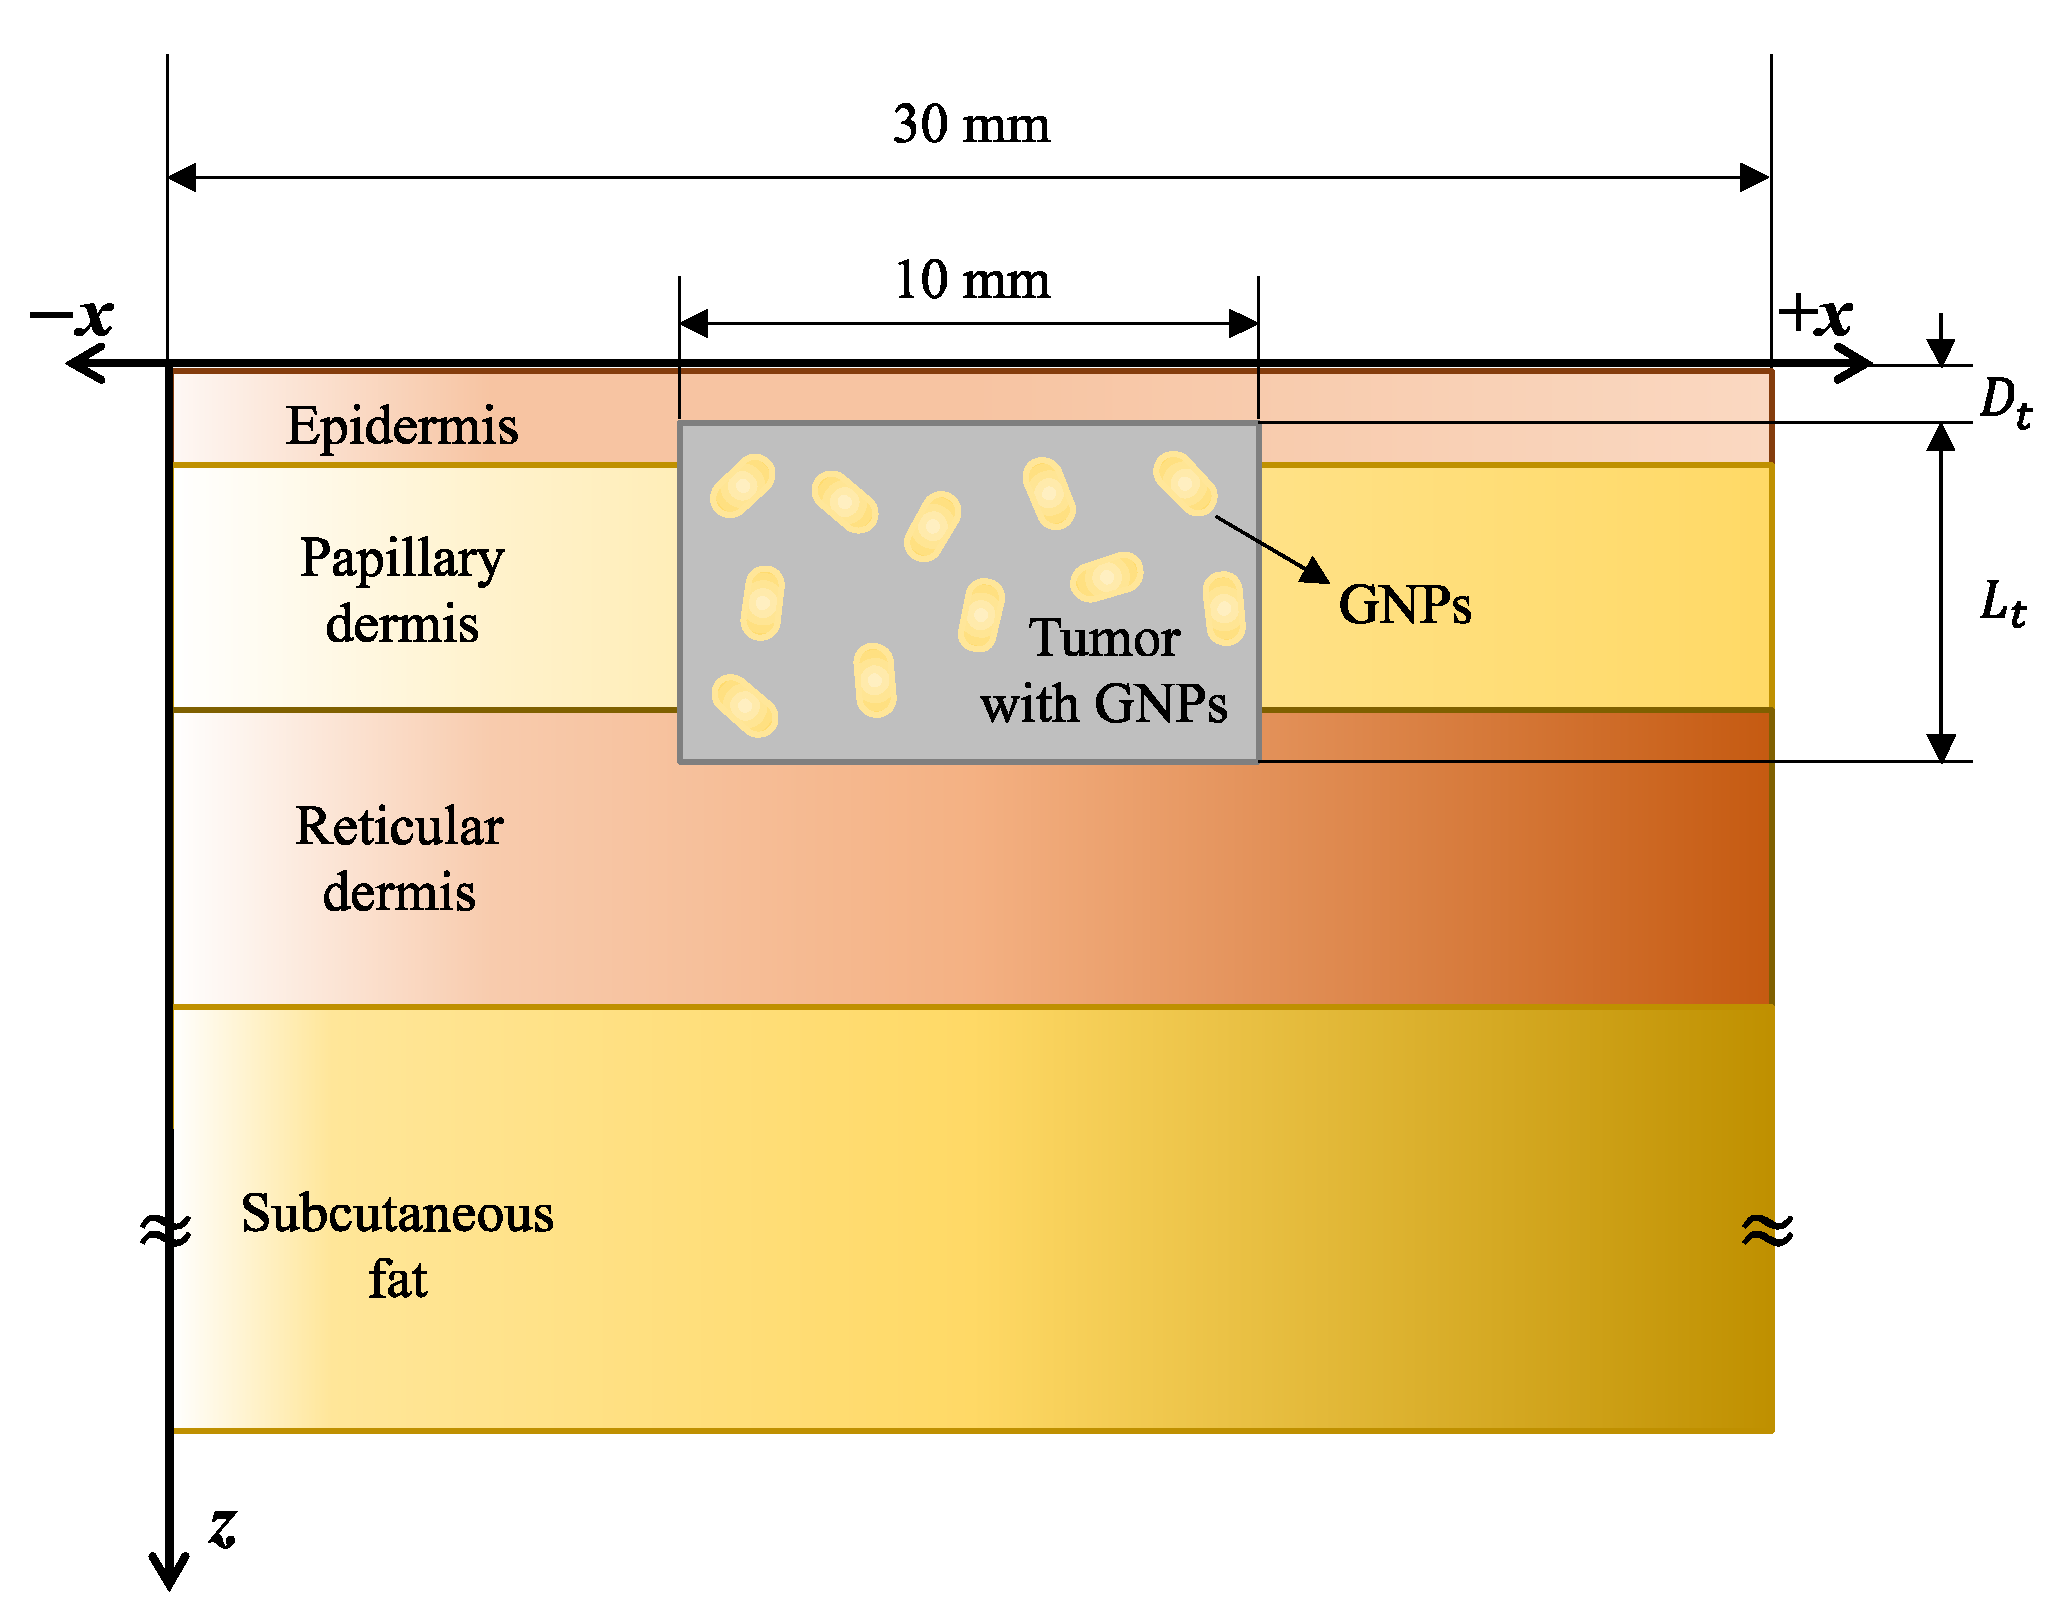
The study subject is a skin cancer tumor located near the skin surface as shown in
Figure 5. The simulation in this study is a 3D model that contains a cylindrical tumor tissue within the cubic shape of the normal tissue. It was assumed that the laser was irradiated in a circle, and the size of normal tissue was set large enough to maintain a radial directional symmetry of the tumor.
Figure 5 shows the result of one x–z plane of the numerical model for better understanding. The skin is composed of a total of four layers. The diameter of the normal tissue is 30 mm, and the diameter of the tumor is 10 mm. The wavelength of the light source was 1064 nm, and the thickness of each skin layer and thermal/optical properties of the tumor and skin layers are shown in
Table 3.
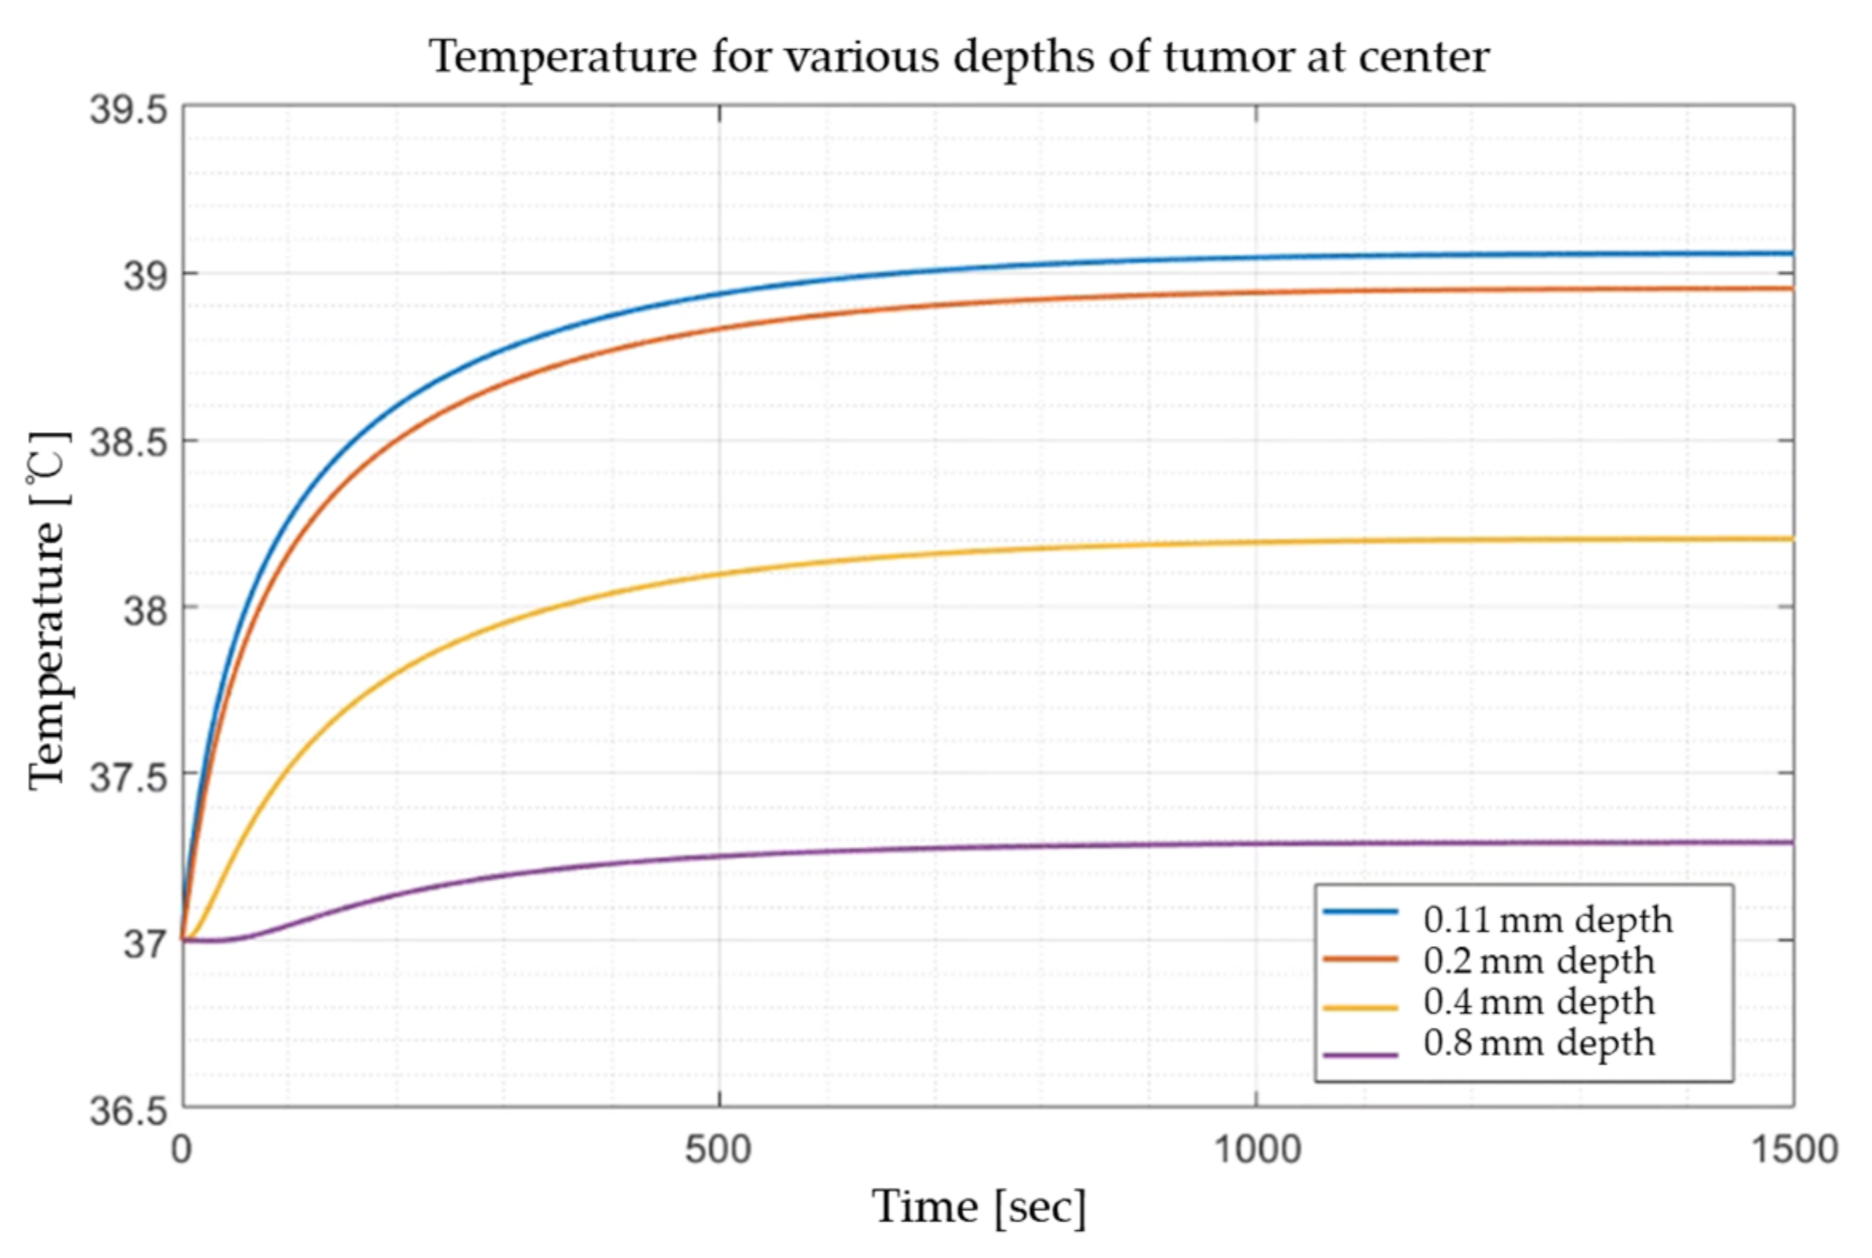
The thermal damage of tissue depends on the duration of temperature impulse. To validate this, after fixing the laser intensity to 0.02 W, the temperature variation for various depths at the center was checked, as shown in
Figure 6. It is evident that the temperature of the medium constantly rises and then converges. Accordingly, in this study, the laser irradiation time was fixed at 1000 s, and the effect of photothermal treatment was investigated through the results in the steady state.
In addition, thermal behavior was confirmed for the depth (depth of the tumor) and length, laser intensity, and volume fraction of the injected GNPs from the surface of the tumor, and the conditions are shown in
Table 4.
For the depth and length of the tumor, the penetration depth of the tumor that satisfies all stages of Breslow’s depth was considered [
40]. The profile of the irradiated laser was assumed to be a top-hat distribution, and the laser diameter was set to be 10 mm, which is the same as the tumor diameter. The laser intensity (P) was set from 0 W to 0.2 W at 0.01 W intervals, and the volume fraction of GNP in the tumor to be checked in this study was divided into seven steps from
to
, and the temperature distribution was accordingly confirmed.
The optical properties of GNPs are determined through the volume fraction (
) of GNPs in the tumor, the effective light absorption area (
), and the absorption efficiency (
) as shown in Equation (14) [
41]. In this study, gold nanorods (GNRs), which have a high efficiency compared to other shapes, such as the sphere, cage, and shell, with a diameter of 10 nm and a length of 67 nm were used [
42], and the light absorption efficiency of GNRs was calculated using the discrete-dipole approximation (DDA) technique [
43]. It was assumed that the input GNRs were uniformly distributed in the medium.
Finally, the optical properties of the tumor injected with GNRs can be calculated through the sum of the optical properties of the tumor itself and the optical properties of GNRs as shown in Equation (16) [
44].
Table 5 shows the optical properties according to the volume fraction of the injected GNR.
In this study, based on the above conditions, the amount of heat absorbed and the temperature distribution was evaluated according to various conditions in photothermal therapy for skin cancer tumors located 1 mm deep from the skin surface. Through the identified temperature distribution, four apoptotic variables were used to minimize damage to surrounding normal tissues and, at the same time, derive the conditions that produce the optimal therapeutic effect in which apoptosis of tumor tissues occurs at the maximum.
3. Numerical Results & Discussion
3.1. Absorbed Power and Temperature Distribution
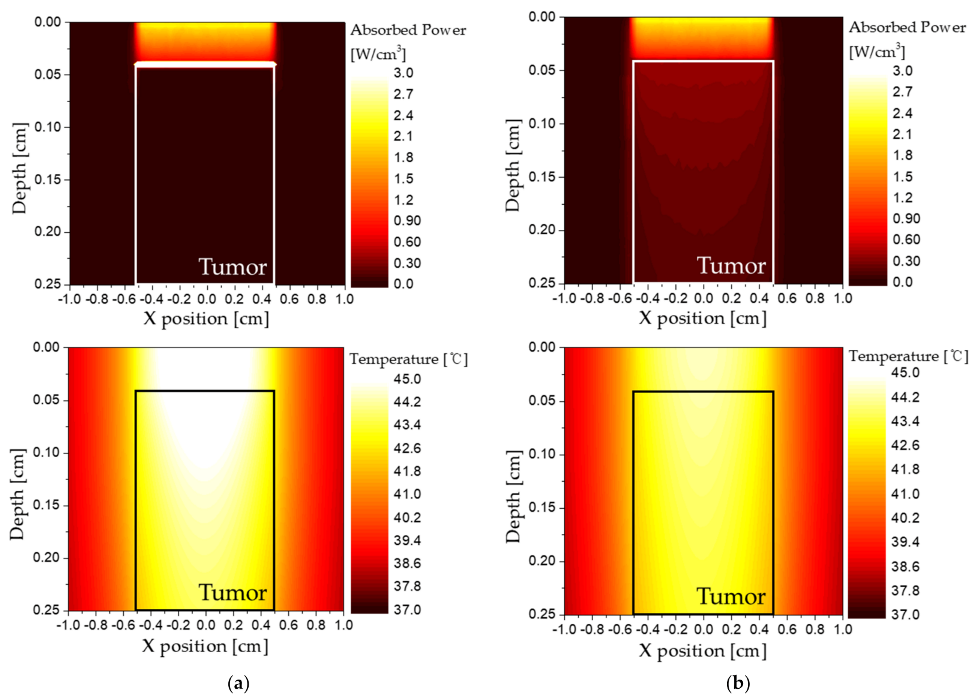
Figure 7 presents the graphs showing the distribution of temperature and power absorbed by the medium according to the volume fraction of the injected GNRs when the length of the tumor is 2.5 mm and the depth of the tumor is 0.4 mm. If the volume fraction of GNRs in the tumor is high (
Figure 7a), the absorption coefficient of the tumor increases; accordingly, most of the heat of the laser is absorbed near the tumor surface. Consequently, it is assumed that the temperature increase inside the tumor is mainly caused by heat conduction from the surface. On the other hand, if the volume fraction of GNRs in the tumor is low (
Figure 7b), the absorption coefficient of the tumor decreases and the depth at which the laser can penetrate becomes longer. In addition, since a small amount of laser heat is absorbed over a wide range, it is shown that an increase in temperature occurs in the entire tumor tissue, and the peak of the temperature is low. For this reason, the temperature distribution of the tumor and surrounding normal tissues occurs differently depending on the volume fraction of GNRs injected into the tumor. Therefore, it is necessary to check the temperature distribution according to the volume fraction of various GNRs and to check the temperature band where apoptosis occurs.
There are a total of four parameters to be changed in the results derived later: length of the tumor (), depth of the tumor (), variable related to laser power (), and volume fraction of GNRs (). All graphs illustrate results for various , and the x-axis is fixed as the intensity of the irradiated laser. To check various results, varying and , and the results were checked for various .
3.2. Apoptosis Ratio
In photothermal therapy, it is very important to maintain the temperature at which apoptosis occurs in the tumor tissue, i.e., 43–50 °C, so that tumor metastasis does not occur in surrounding normal tissues when irradiating laser on tumor tissue. In addition, to achieve a higher therapeutic effect, apoptosis must occur in the entire tumor. Therefore, in this study, the rate of apoptosis occurring according to the volume fraction of GNRs at various tumor tissue sizes and depths was confirmed through the apoptosis ratio.
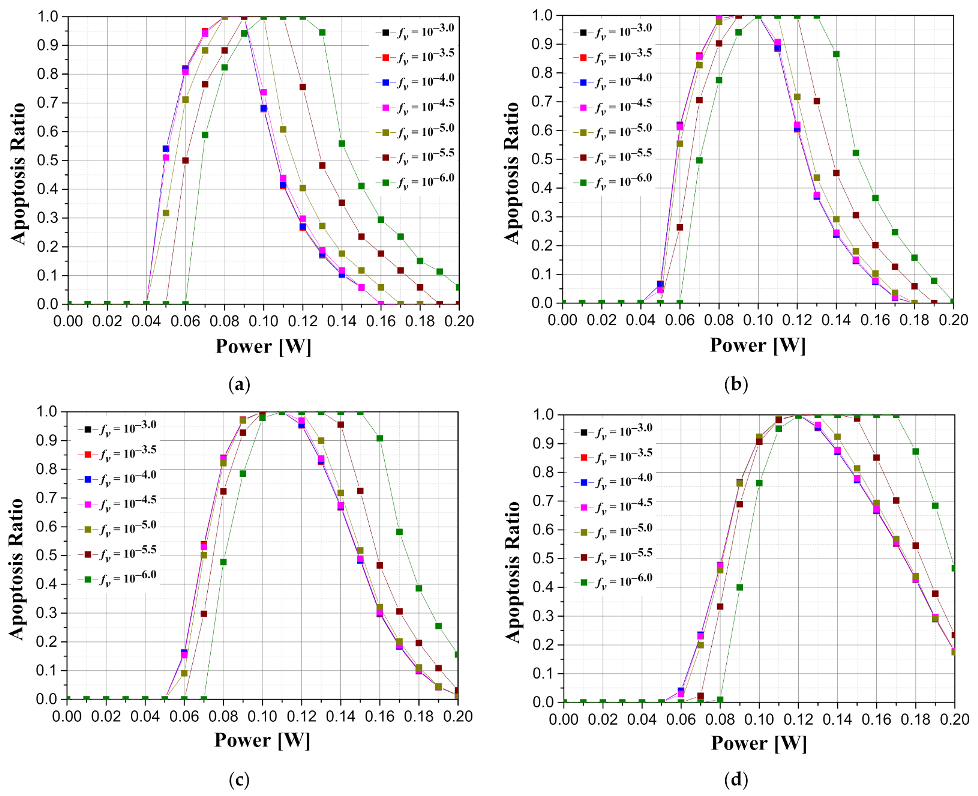
Figure 8 is a graph showing how the intensity of the irradiated laser affects the apoptosis ratio according to the various length of tumors and the volume fraction of the injected GNRs when the tumor depth is 0.1 mm. As shown in
Figure 8, it was confirmed that the laser intensity that maximizes the apoptosis ratio exists in all tumor lengths. In addition, as the length of the tumor increases, the intensity of the laser at which the apoptosis ratio is maximized increases. This is because the lengthier the tumors are, the higher the laser intensity required to cause a temperature rise in a wider range of tumors. In terms of the volume fraction of GNRs, the intensity of the laser that satisfies the maximum apoptosis ratio decreases as the volume fraction of GNRs in the tumor increases. This is because as the volume fraction of the injected GNRs increases, the amount of heat absorbed from the tumor tissue increases, and thus the intensity of the laser for maintaining the temperature range in which apoptosis occurs decreases. In addition, it was possible to find the condition at which the apoptosis ratio became 1 by appropriately controlling the laser intensity according to the volume fraction of various GNRs, and it was confirmed that the lower the volume fraction of GNRs, the wider the range of laser intensity that caused the apoptosis ratio to become 1.
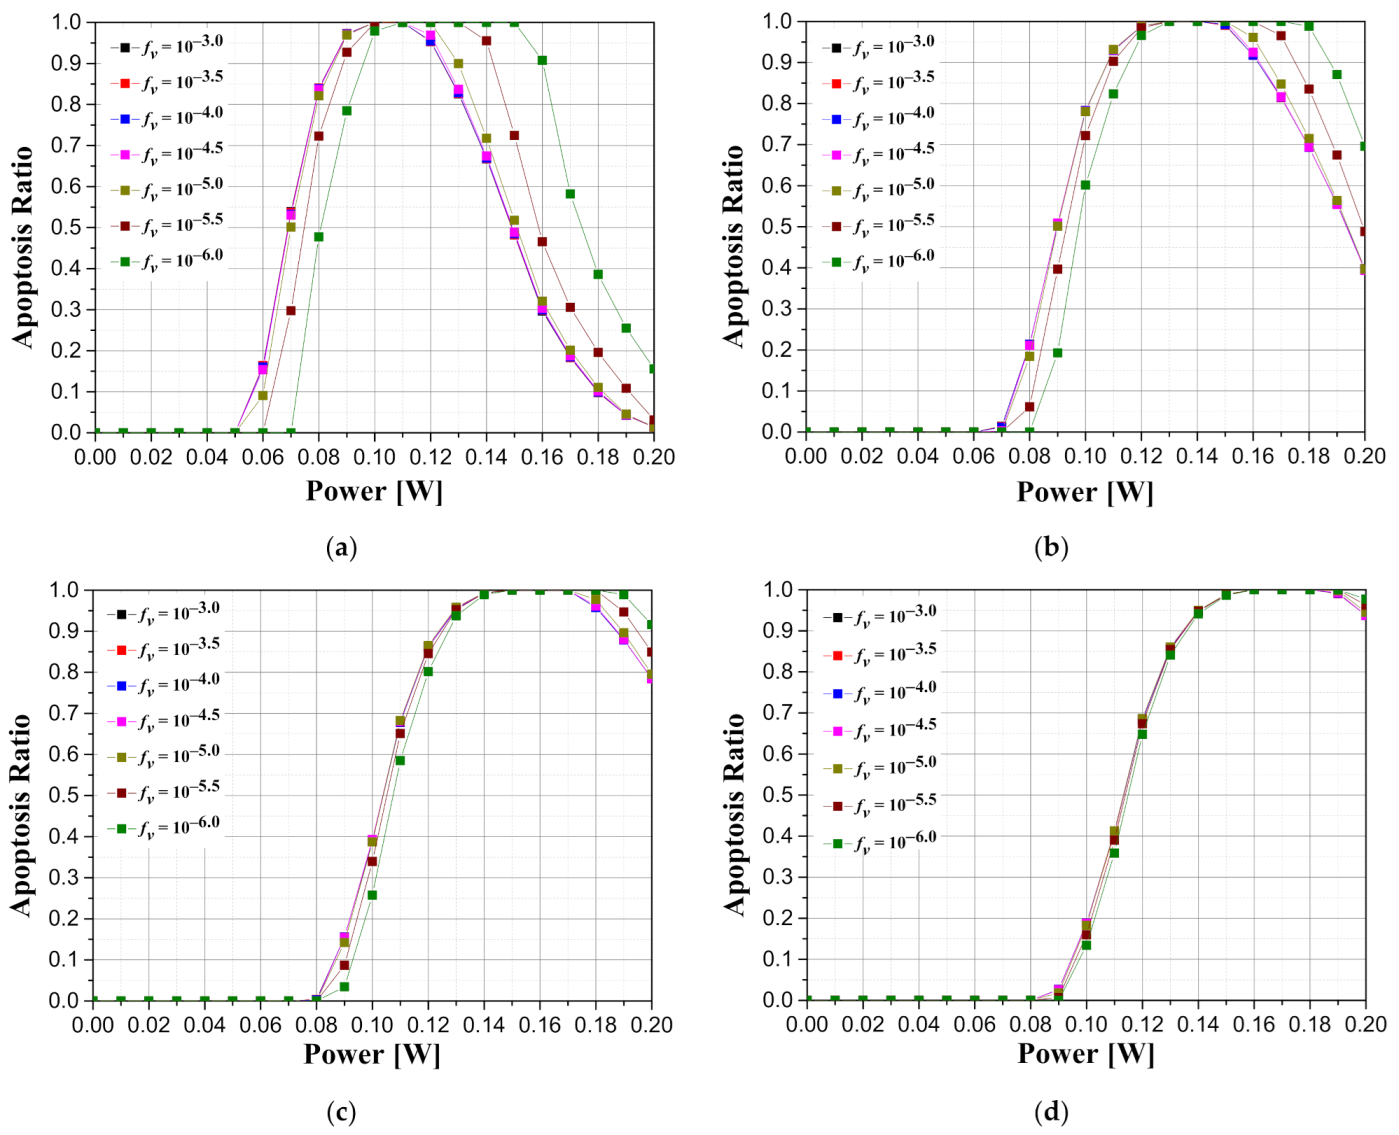
Figure 9 illustrates graphs showing the apoptosis ratio for the intensity of the irradiated laser according to the depth of the tumor and the volume fraction of the injected GNRs when the length of the tumor is 2.5 mm. From the graphs, it is demonstrated that as the tumor is located deeper in the skin surface (as
increases), the intensity of the laser at which the apoptosis ratio is maximally derived increases. This is because as the depth of the tumor increases, the distance to reach the tumor tissue increases and, in turn, the amount of heat absorbed by the normal tissue portion above the tumor tissue increases according to the distance. In addition, when the depth
of the tumor tissue becomes 1 mm, a significant portion of the laser power is absorbed by the normal tissue, indicating that the difference in apoptosis ratio according to the volume fraction of GNRs is small (
Figure 9d).
3.3. Thermal Hazard Value of Normal Tissue
When a laser is irradiated to the tumor tissue for treatment, the temperature rises not only in the tumor tissue but also in the surrounding normal tissue by heat conduction. Accordingly, there is a possibility of thermal damage to surrounding normal tissues. The thermal damage to the tumor tissue can be inferred by checking the apoptosis ratio, but the thermal damage to the surrounding normal tissues cannot be confirmed. Thus, it is necessary to minimize thermal damage by quantitatively evaluating the thermal damage occurring in the surrounding normal tissue through new parameters. Accordingly, in this study, the thermal hazard value was used to derive the degree of thermal damage to the surrounding normal tissue.
Since the thermal hazard value is defined as the weighted sum of the volume ratios in each temperature range, the value varies depending on the range that serves as the standard. Therefore, the results were derived after selecting the distance from the end of the tumor tissue to 50% of the length of the tumor tissue as the standard range for normal tissue.
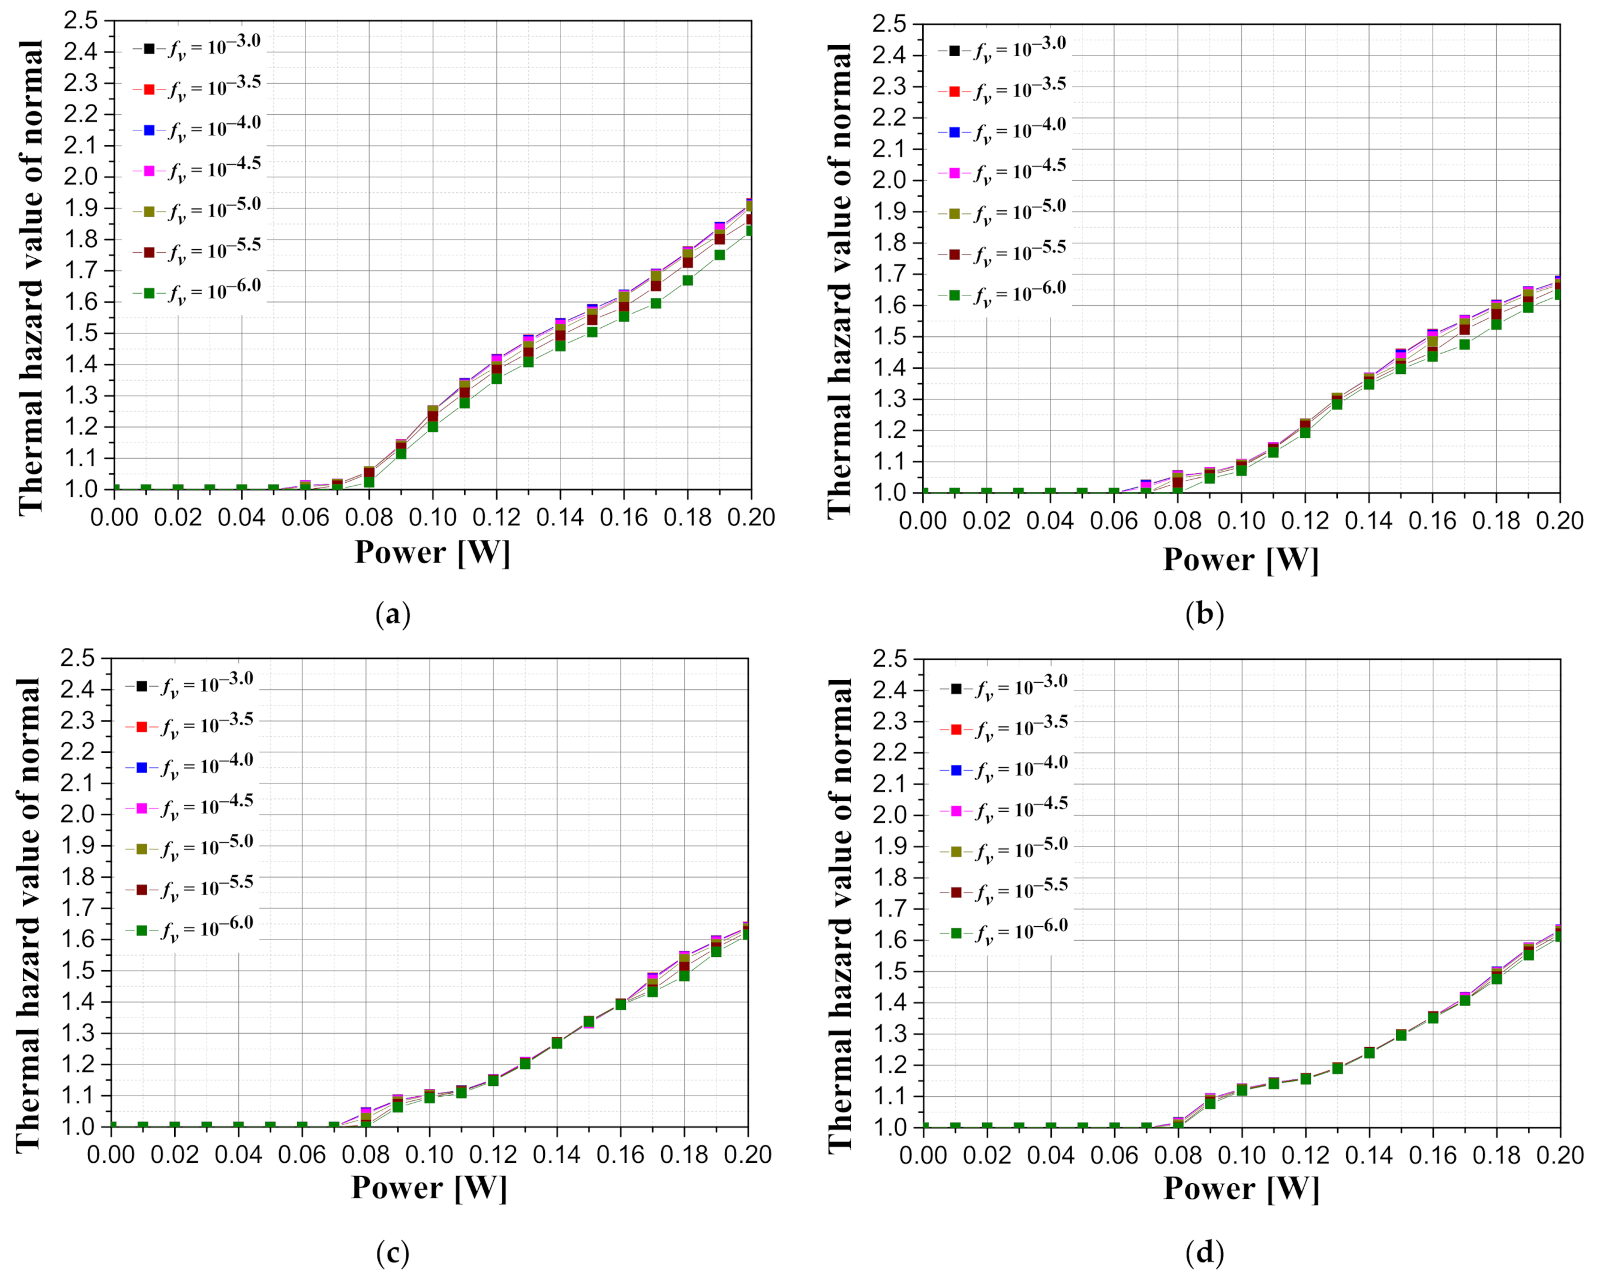
Figure 10 illustrates graphs showing the thermal hazard value of the surrounding normal tissue with respect to the intensity of the irradiated laser according to the tumor length and the volume fraction of the injected GNRs when the tumor depth is 0.1 mm. As shown in
Figure 10, it is demonstrated that, as the volume fraction of GNRs in the tumor increases, the intensity of the laser should be lowered to a certain level or lower for reducing the thermal risk. In addition, in the case where the intensity of the irradiated laser is the same, the thermal risk of the normal tissue decreases as the length of the tumor increases; therefore, the degree of the irradiating laser intensity can be increased. This is because as the length of the tumor increases, the amount of heat delivered to the bottom of the tumor decreases, resulting in less temperature rise in the region corresponding to the normal tissue at the bottom of the tumor. However, it can also decrease the apoptosis ratio; therefore, the condition should be optimized after considering all the factors such as thermal risk and apoptosis ratio. This will be further discussed later in the results of the effective apoptosis ratio.
Figure 11 illustrates graphs showing the thermal hazard value of the surrounding normal tissue with respect to the intensity of the irradiated laser according to the tumor depth and the volume fraction of the injected GNRs when the length of the tumor is 2.5 mm. It is shown that the thermal hazard value of the normal tissue decreases as the depth of the tumor increases in the case of the same tumor length. This is because, in the same way as the apoptosis ratio varies according to depth, as the depth increases, the amount of heat from the laser reaching the tumor tissue decreases; in turn, the effect on the surrounding normal tissue decreases. However, since the decrease in the amount of laser power reaching the tumor tissue is accompanied by a decrease in the apoptosis ratio, the effective apoptosis ratio must also be considered.
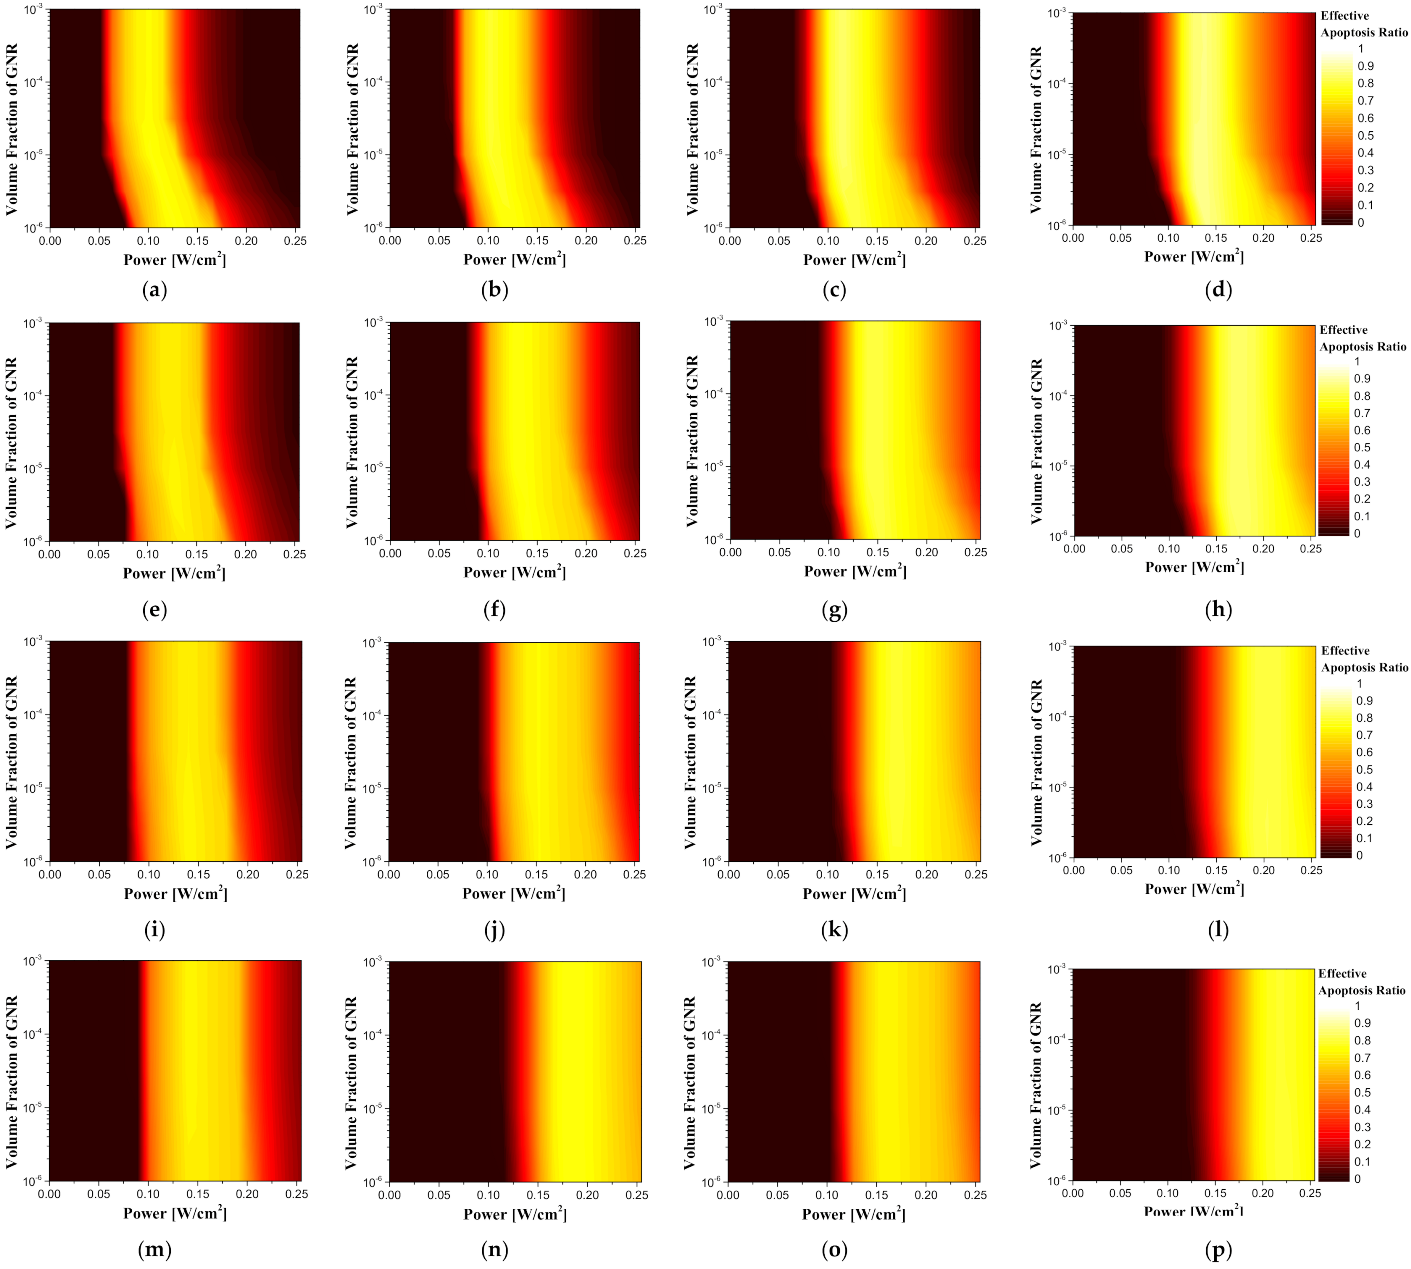
3.4. Effective Apoptosis Ratio
As described earlier, photothermal therapy needs to maximize apoptosis in tumors and minimize thermal damage to surrounding normal tissues. Therefore, the effective apoptosis ratio was evaluated by simultaneously considering the apoptosis ratio, which represents the rate at which apoptosis occurs in the tumor, and the thermal hazard value of the normal tissue, which represents the degree of thermal damage to the surrounding normal tissue.
Figure 12 shows contour graphs of the effective apoptosis ratio according to the volume fraction of the injected GNRs and the intensity of the irradiated laser per unit area for various tumor lengths and depths.
Depending on the geometry of the tumor, the length and depth of the tumor increase, and the intensity of the laser resulting in the maximum effective apoptosis ratio increases. As described earlier, as the length of the tumor increases, a higher laser intensity is required to cause a wider range of temperature rise, and as the depth of the tumor increases, the distance from the surface to the tumor tissue becomes longer. This is because normal tissue absorbs the energy of the laser; hence, higher laser intensity is required to maintain the temperature range where apoptosis occurs in deep tumors.
In the case of the intensity of the irradiated laser and the volume fraction of the injected GNRs, the apoptosis ratio and the thermal hazard value of the normal tissue show a tendency to constantly increase or decrease; however, in the case of the effective apoptosis ratio, there was a condition in which the maximum value was derived. This indicates that, although the thermal damage to the surrounding normal tissue can increase if the focus is only on maintaining the temperature range in which apoptosis occurs in the tumor, there is a certain condition that minimizes thermal damage to surrounding normal tissue while inducing apoptosis in as many regions as possible within the tumor.
Table 6 summarizes the laser intensity and the volume fraction of the injected GNRs for the length and depth of all tumors.
4. Conclusions
This study applied the use of properties of actual skin layers and the Monte Carlo method and derived quantitative information on the volume fraction of the GNRs injected into the tumor and the intensity of the laser that produces the optimal photothermal therapeutic effect according to the various locations of the tumor.
First, the apoptosis ratio () was defined as the volume ratio corresponding to the temperature range of 43–50 °C, where apoptosis occurs in the tumor, to the total volume of the tumor tissue. It was confirmed that there is an intensity of the laser that yields the maximized apoptosis ratio according to the volume fraction of GNRs injected into the tumor. In addition, the intensity of the laser to maximize the apoptosis ratio was derived for the cases in which depth and length of the tumor increase or the volume fraction of GNRs decreases.
The thermal hazard value (), which is the degree of thermal damage to surrounding normal tissues, was defined as a weighted sum of the volumes in which the phenomena occur, giving weights to the biological phenomena occurring according to each temperature range. In the case of the thermal hazard value of normal tissue, the result value varies depending on the volume of the normal tissue. Thus, in this study, a distance of 50% of the length of the tumor tissue from the boundary of the tumor tissue was determined as the standard for the normal tissue. From the results, it was confirmed that the higher the volume fraction of GNRs injected into the tumor, the higher the thermal risk of surrounding normal tissues. It was also confirmed that as the length and depth of the tumor increased, the thermal risk of normal tissues decreased.
Lastly, to find conditions that maximize apoptosis in tumor tissue while minimizing thermal damage to surrounding normal tissues, which is the key purpose of photothermal therapy, the optimal therapeutic effect was confirmed according to the intensity of the laser and the volume fraction of GNRs by using an effective apoptosis ratio () that simultaneously considers the apoptosis ratio and the thermal hazard value of surrounding normal tissues for various tumor depths and lengths.
Through the wide parametric study of the results of this study, it is expected that the effective apoptosis ratio derived through the correlation among the various locations of tumors, the dose of GNRs, and the intensity of the laser can be used as the optimal conditions for improving treatment during photothermal therapy. In addition, it is expected that future studies will be able to confirm the characteristics of each nanoparticle by using various materials of light absorption enhancer and will be able to determine the accumulation and stability of GNPs through collaboration with clinicians.


