1. Introduction
Anchor support is the most common, fastest, and cheapest support method in mining roadway [
1,
2,
3]. In recent years, with the degradation of mining environment, the adaptability of existing anchor support technology has become weaker and weaker. The strong time-dependent properties of deep rock masses have led to frequent occurrences of high-energy and large-scale deep engineering disasters, and the disaster mechanism is unclear and difficult to predict and effectively control [
4,
5,
6,
7,
8]. The main reason is that the bearing capacity of a single anchor structure is limited and cannot provide sufficient support resistance. The nature of surrounding rock support is mechanical balance [
7]; if the anchors cannot provide sufficient support resistance, the surrounding rock cannot maintain stability. Prestressed anchor support is the most direct way to provide support resistance. From the perspective of mechanical balance alone, a substantial increase in support resistance will help the long-term stability of the surrounding rock.
The existing anchor bolt support theory and technology are not perfect, and there are still many problems in field application [
9,
10,
11]. As shown in
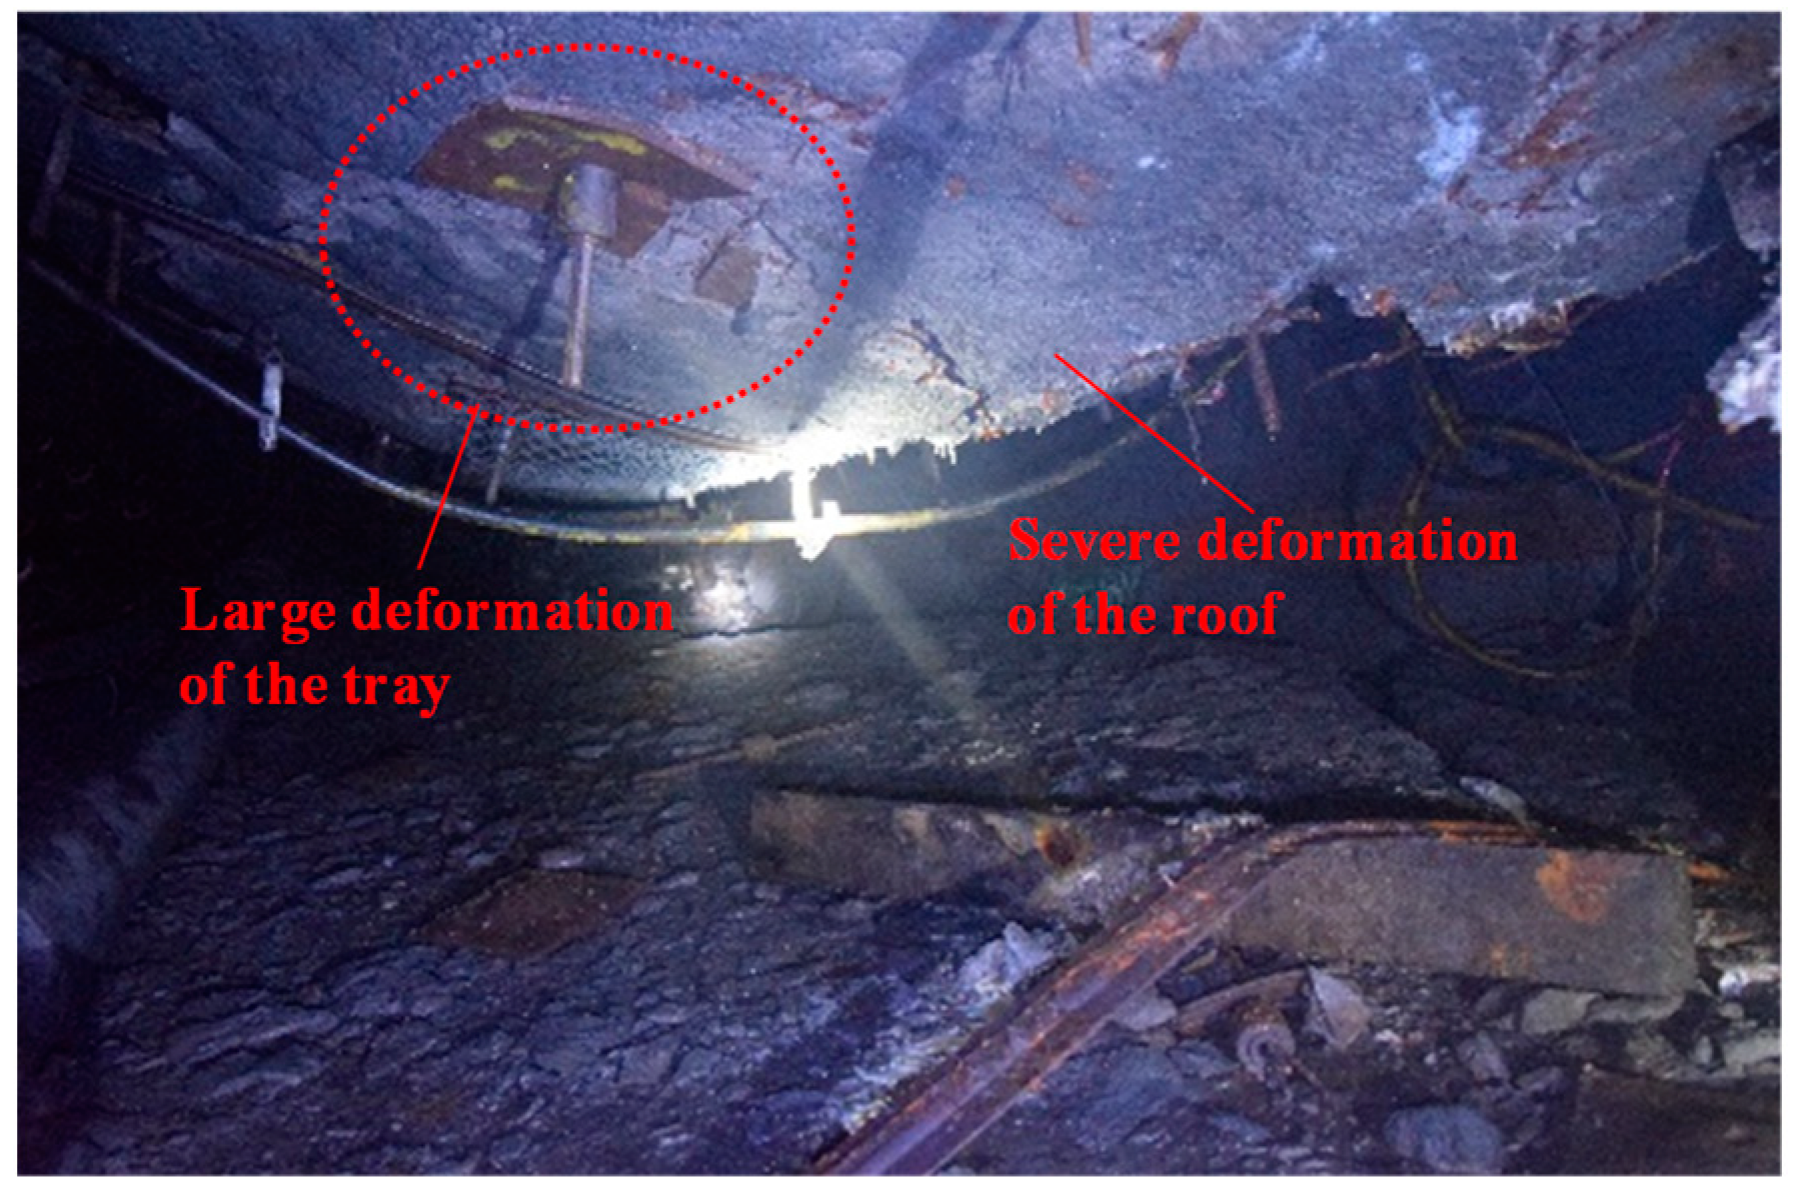
Figure 1, the roof sinks violently and the tray deforms greatly in the roadway of anchor support. Although the design value of the anchor prestress in the coal mine has reached 200 kN; however, the 200 kN anchor still cannot meet the support requirements of deep high-stress, strong mining, and soft rock roadways. There is an urgent need to develop new anchor support technologies to meet the needs of safe and efficient mining of coal resources in China for a long period of time in the future.
In the fields of rock soil and slopes, the support technology of the 1000 kN-level pre-stressed anchor and cable has been mature [
12,
13,
14]. However, this technology is restricted by time and space and cannot be directly used in coal mines. Researching and designing new structures is very necessary for the realization of super pre-stress of coal mine anchors. Compared with other fields, coal mine anchors are characterized by short length, fast installation speed, and strong anti-disturbance ability. These three characteristics hinder the realization of super anchors for mines. Fortunately, the short service cycle of coal mine anchors is a positive feature. There are two reasons for the short length of coal mine anchors. On the one hand, it is to save support costs, on the other hand, it is restricted by the construction space and construction speed. The narrow construction space of coal mine roadways is not conducive to the construction of ultra-long anchors. The construction speed of long anchors is slower than that of short anchors, which is not conducive to the rapid excavation of roadways. The installation speed of the anchor is not only restricted by the length of the anchor, but also by the solidification time of the anchoring agent. In the field of geotechnical anchorage, the solidification time of grouting material can be as long as several hours to several weeks, while for mineral anchorage, it is generally required to reach the solidification strength and complete the installation of anchor rod within a few minutes. Coal mine anchors need strong anti-interference ability because they are frequently affected by engineering disturbances, which accelerate the weakening process of anchors. All these factors restrict the application of super prestress in coal mine support [
15,
16,
17].
This paper proposes a group structure to realize higher prestressed anchor support and solve the problem of deep roadway support. At present, the group anchor structure has not been used in coal mine roadway support, which is a new topic. For the new topic, the design method and basis of the group anchor support are lacking. The paper studies the mechanical properties and failure characteristics of the group anchors through physical tests and numerical simulations, aiming to provide a theoretical basis for the group anchor’s support design of deep roadways in complex environment.
2. Proposal of Group Anchor
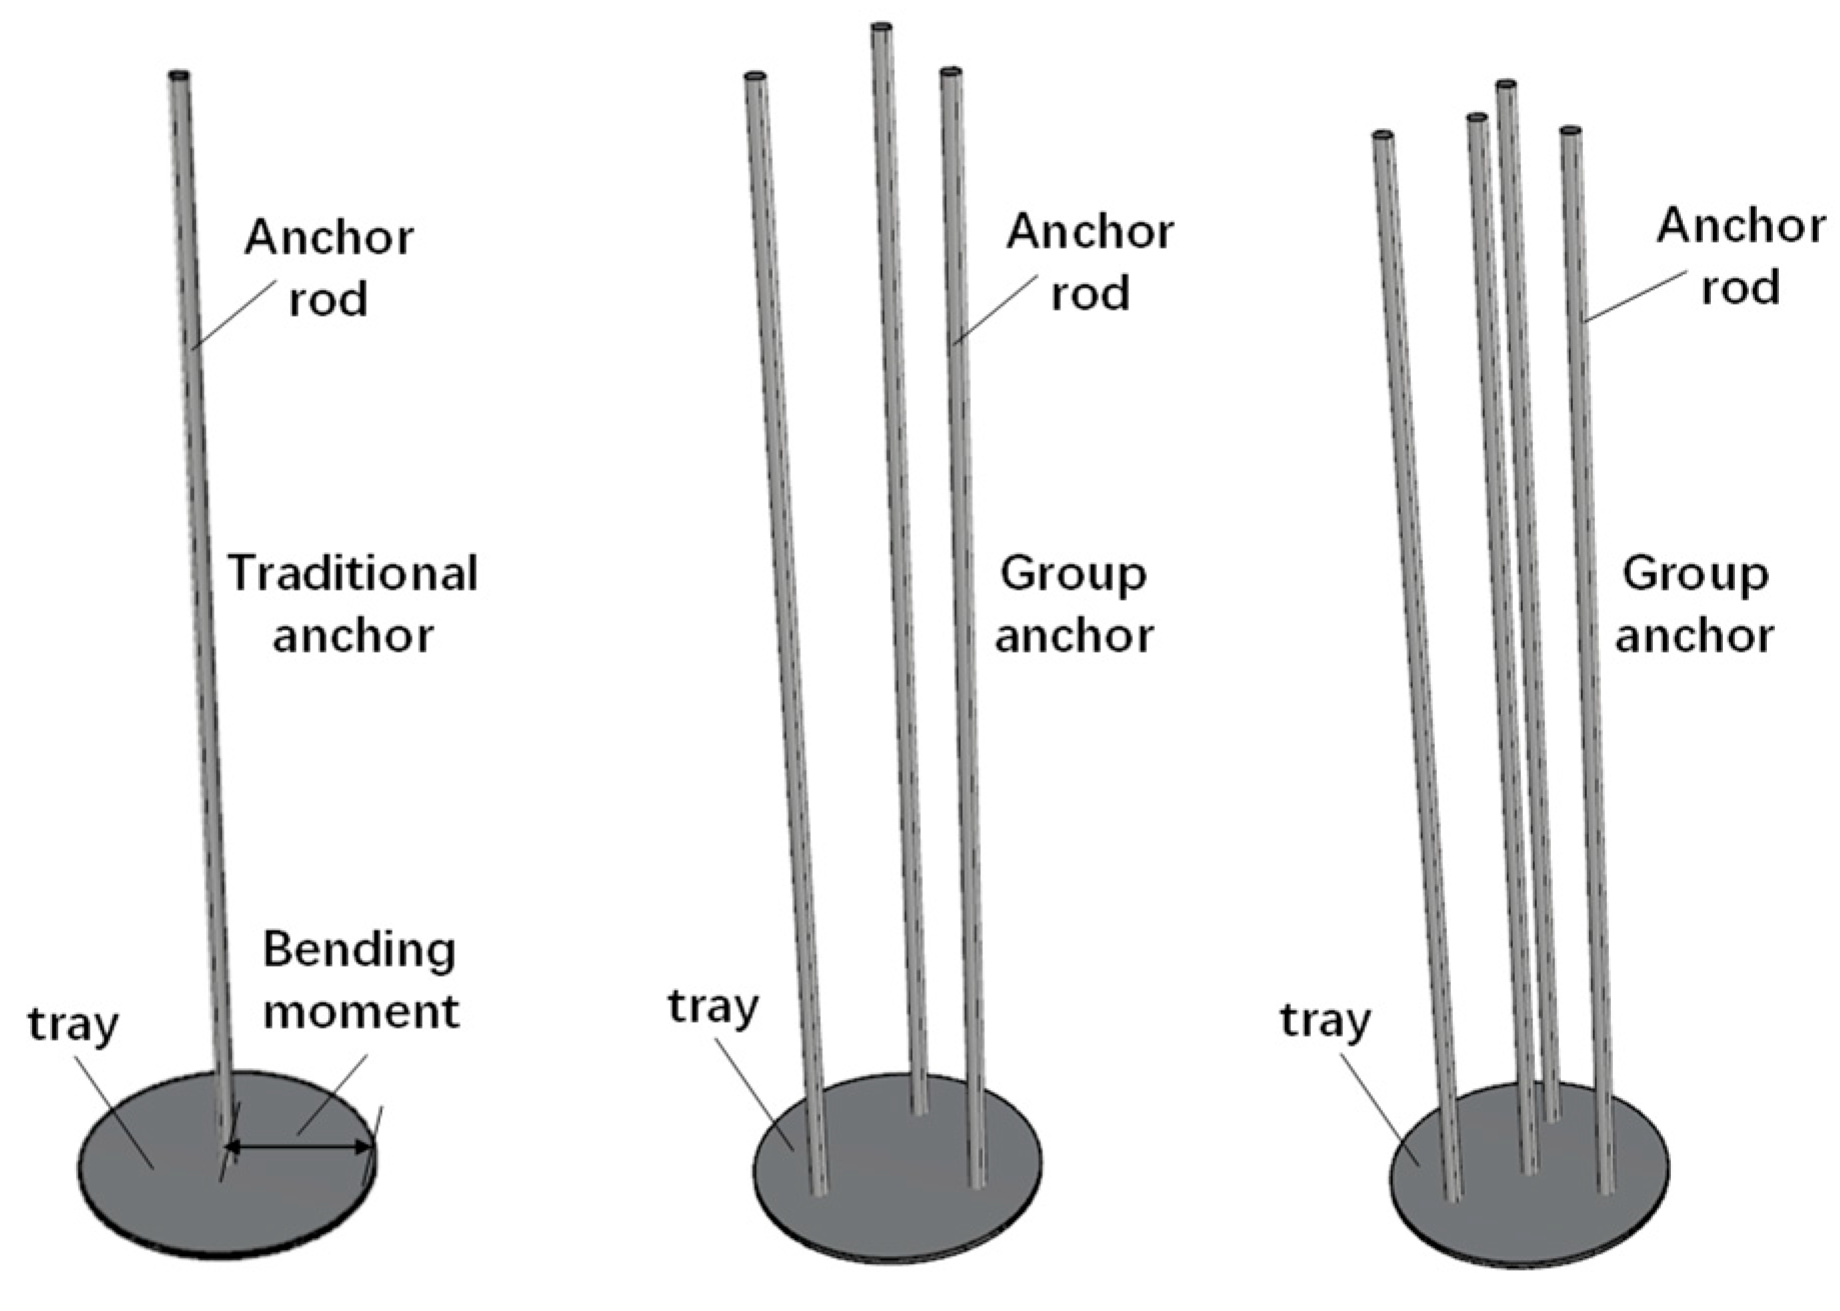
Based on the characteristics of coal mine anchors, this paper proposes a group anchor structure, as shown in
Figure 2, which provides ideas for the rapid realization of the super pre-stressed anchor technology [
14]. The group anchor rod structure is to install multiple anchor rods on a pallet, and evenly arrange the anchor rods near the edge of the tray. Compared with the traditional anchor rod structure, the pre-stress and anchoring strength of the group anchor rods will be doubled. In addition, transferring the position of the anchor rod from the center of the tray to the edge is beneficial to improve the stress distribution of the tray and is beneficial to the long-term maintenance of the prestress of the tray.
Compared with the traditional anchor and steel belt, the difference of the group anchor rods structure is that the bearing rigidity of the tray is higher, the time of the prestress maintenance is longer, and the super prestress can be realized on the same tray. The group anchor structure changes the traditional single one into a group, but does not affect that the group anchor also has the properties of a single anchor; for example, the group anchor can also be used with steel belts (beam). At present, the breaking strength of high-strength anchor cables with a diameter of 28.6 mm used in coal mines can reach 890 kN, if a group anchor structure with the three-anchor is used, its overall breaking strength exceeds 2000 kN, and a super prestress of 1000 kN can be achieved. The group anchor structure in theoretically realizes the supporting function of the super pre-stress; and the real force characteristics of the group anchor will be compared and analyzed through the following physical pull-out test and numerical simulation.
3. Physical Test
3.1. Design of Test Tool for Group Anchor
The pull-out test of a single anchor is simple in operation and reliable in results. It is often used by the majority of scientific researchers to study the bearing performance of the anchor. However, the operation of the group anchor pull-out test is complicated, and is limited by the experimental conditions and experimental equipment, resulting in synchronous loading is a problem in the group anchor experiment. In response to this problem, this experiment designed a drawing tool for matching group anchor, as shown in
Figure 3. The testing tool is mainly composed of top chuck, upper box body, lower box body, tie rod, lower chuck, nut, concrete matrix, and anchor. The pull test is carried out on the MTS electro-hydraulic servo universal testing machine. When testing, the upper jaw of the testing machine clamps the upper chuck, and the lower jaw of the testing machine clamps the lower chuck. The pull-out load is transferred from the lower chuck to the anchor and the concrete matrix, and the pull-out test is completed.
3.2. Model Parameters and Test Process
In the test, the concrete matrix is poured in a cube acrylic mold, the size is 250 mm × 250 mm × 160 mm. The center distance between each rod in the group anchor is 70 mm, placed in the middle of the matrix. The anchor diameter is 20 mm, the anchoring length is 160 mm, and the anchor is exposed 200 mm. The test model is divided into three types, traditional anchor with one rod (single anchor), the group anchor with two rods (the two-group anchors), and the group anchor with three rods (the three-group anchors), three models for each type, total 9, as shown in
Figure 4a. The test matrix compressive strength is about 30 MPa, the shear strength is about 4 MPa, and the breaking load of a single anchor is 215 kN. The weight of the test model is 25 kg, the weight of the tooling is 75 kg, and the total weight is 100 kg. At the beginning of the test, the test model and tooling are assembled first, and then installed in the MTS (mechanical test simulation) testing machine, as shown in
Figure 4b. In the test, the acrylic mold on the matrix of the model was not removed, which was used to restrain the lateral deformation of the matrix and approximate the horizontal confined pressure. The test loading method is displacement loading, loading 0.2 mm per minute.
Figure 4c shows the failure characteristics of the anchor model after test.
3.3. Analysis of Test Results
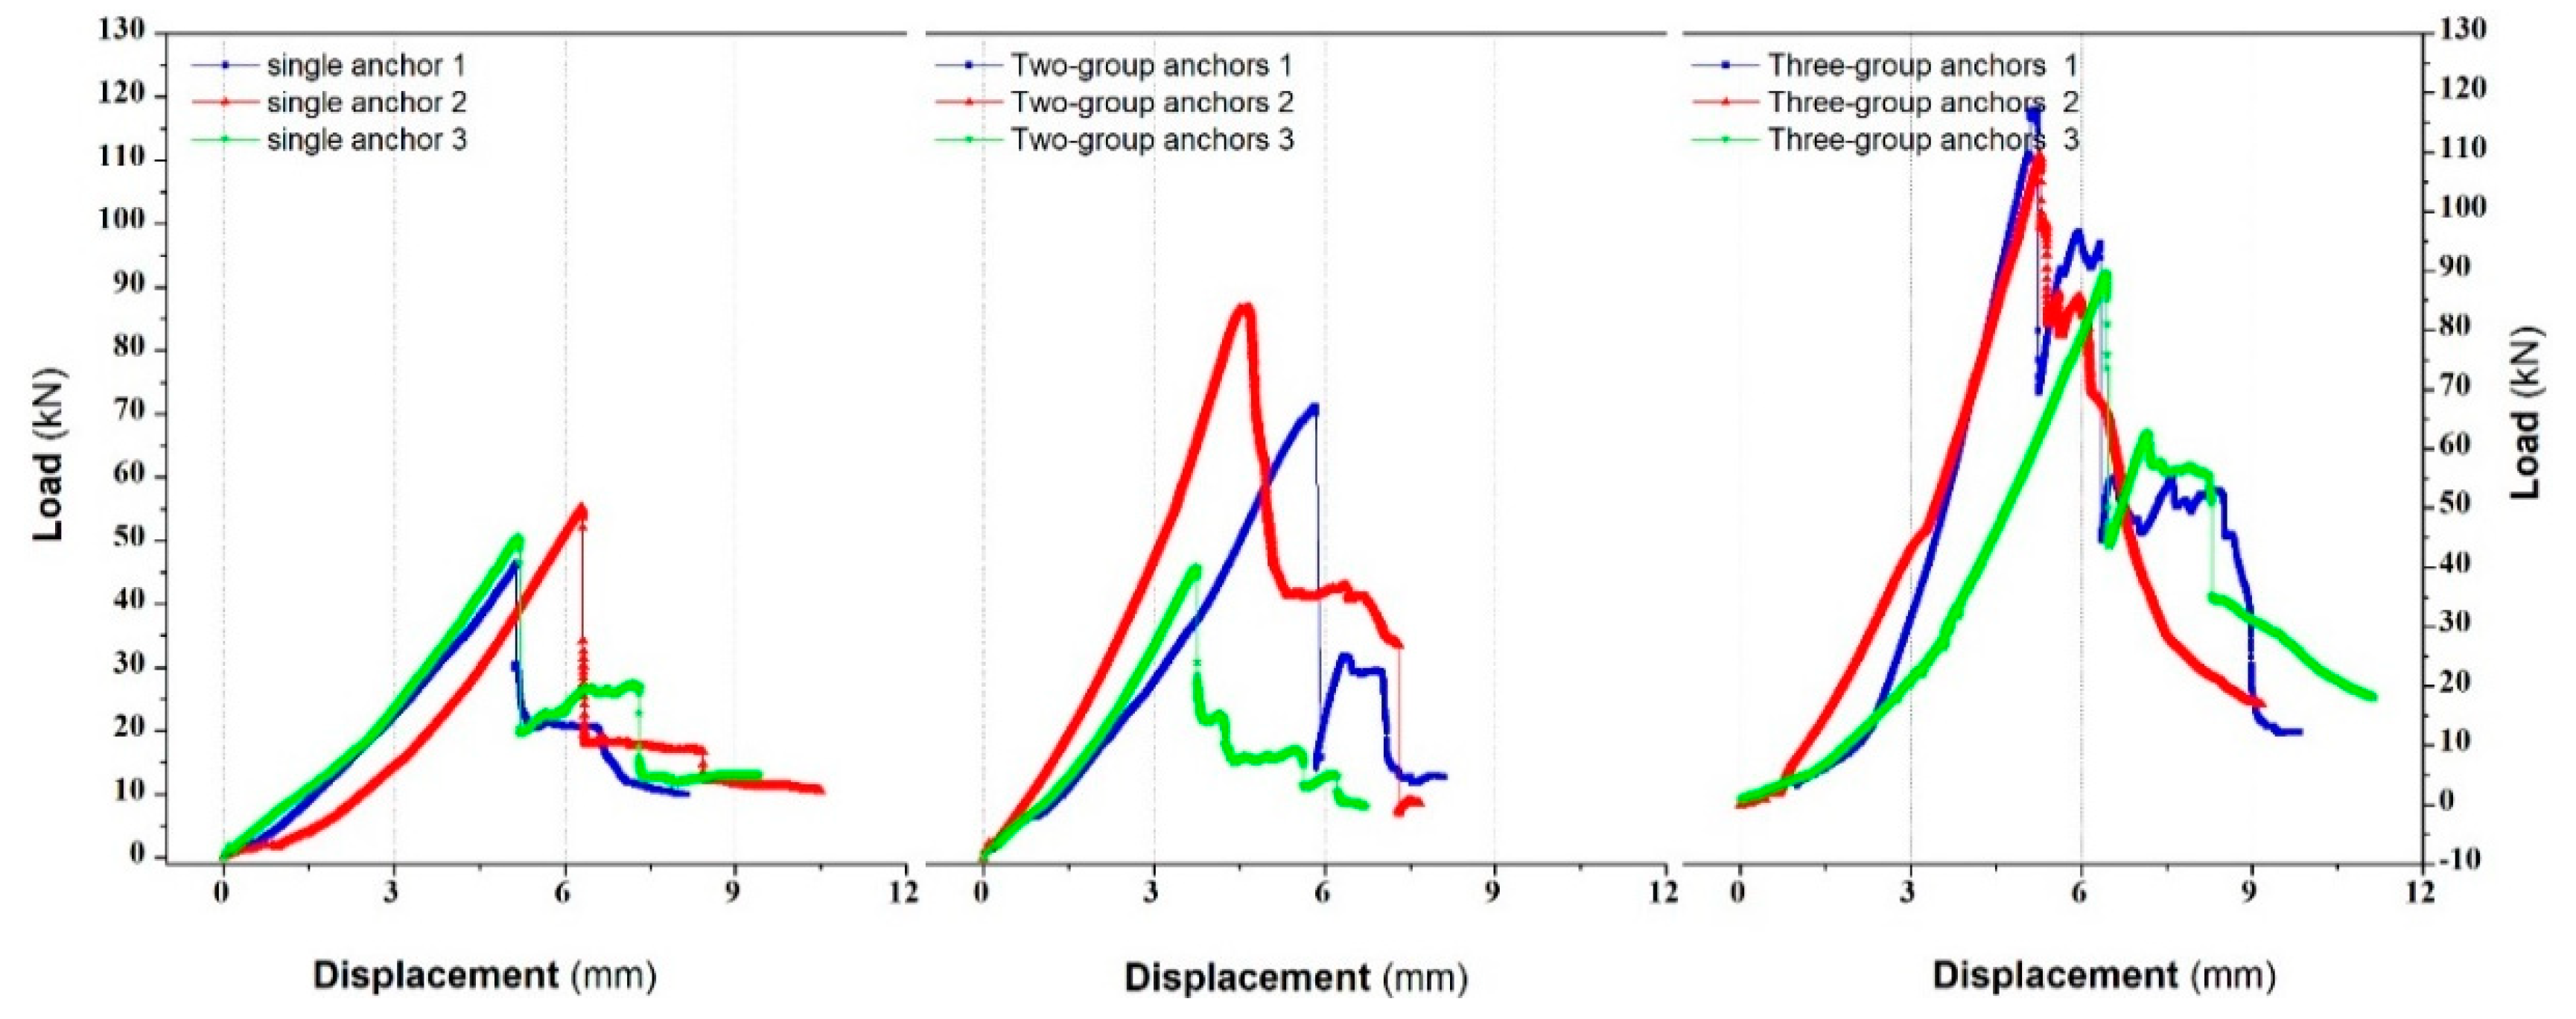
Figure 5 shows the load-displacement curve of the group anchor test. Comparing the
Figure 4c, it can be found that, the more obvious the coupling failure, the higher the ultimate pulling force for the same type; and the more the number of anchor rod in the group anchors, the more obvious the stress concentration near the anchoring area for the same loading. On the whole, the nine concrete models all cracked after test. For the three-group anchor 1, 2, and 3, all models have a triangular failure area in the middle of the three-group anchors, which was caused by the coupling stress under the simultaneous action of the three rods. For the two-group anchors 1, 2, and 3, only the model 2 suffered severe coupling force failure, and the maximum pull-out force of the model 2 is greater than 1 and 3. For the single anchor 1, 2, and 3, there is no coupling force in the models.
Careful observation can reveal some rules and characteristics. In the first half of loading, the anchor model is approximately in the elastic stage, and the curve is relatively smooth, indicating that the anchoring interface bonding performance is good at this stage and there is no damage; in this process, the average curve slope of the three-group anchors is greater than that of the two, and the two-group anchors are larger than that of single anchor. This shows that the pulling force of the three-group anchor increases the fastest, that of the single anchor is the slowest, and that of the two-group anchors are between the one and the three. After the number of the anchor rod increases, the overall rigidity of the group anchor increases accordingly, the maximum pulling force also increases. With the increase of the load, when the displacement load reaches around 5 mm, the three types of anchor all reach the peak of the pulling force. In the test, the maximum pull-out force of a single anchor is 55 kN, the maximum pull-out force of the two-group anchors is 86 kN, and the maximum pull-out force of the three-group anchors is 117 kN. In contrast, the maximum pulling force of the two-group anchors is 1.56 times that of a single anchor, and the maximum of the three-group anchors is 2.13 times that of a single anchor; the performance of the two-group anchors is only 78% (86 kN:2 × 55 kN) of the single anchor, and the performance of the three-group anchors is only 70% (117 kN:3 × 55 kN) of the single anchor. Due to factors such as uneven force and coupling force between the anchors, the performance of the group anchor is difficult to achieve 100%. The performance of the group anchors can be better played when the stress value of each rod is close in the group anchor.
4. Numerical Simulation
At present, the physical test conditions of the anchors are difficult to directly observe the internal stress, displacement, and fracture evolution process of the model, and numerical simulation can better reveal the whole process of the model fracture evolution. In this section, the whole process of the group anchor test is studied through numerical simulation. The size and loading conditions of the numerical model are the same as the above physical test.
In this section, RFPA-3D software is used to study the evolution law of the anchor drawing fracture process. The matrix size of the numerical model concrete is 250 mm × 250 mm × 160 mm, the calculation cell is divided into 125 × 125 × 100, the diameter of the anchor is 20 mm, the length is 200 mm, the exposure is 40 mm. The loading mode takes displacement as a variable, and the loading step is 0.02 mm. The strength of the rock matrix is 50 MPa and the elastic modulus is 10,000 MPa. The strength and elastic modulus of the anchor are 1400 MPa and 210,000 MPa.
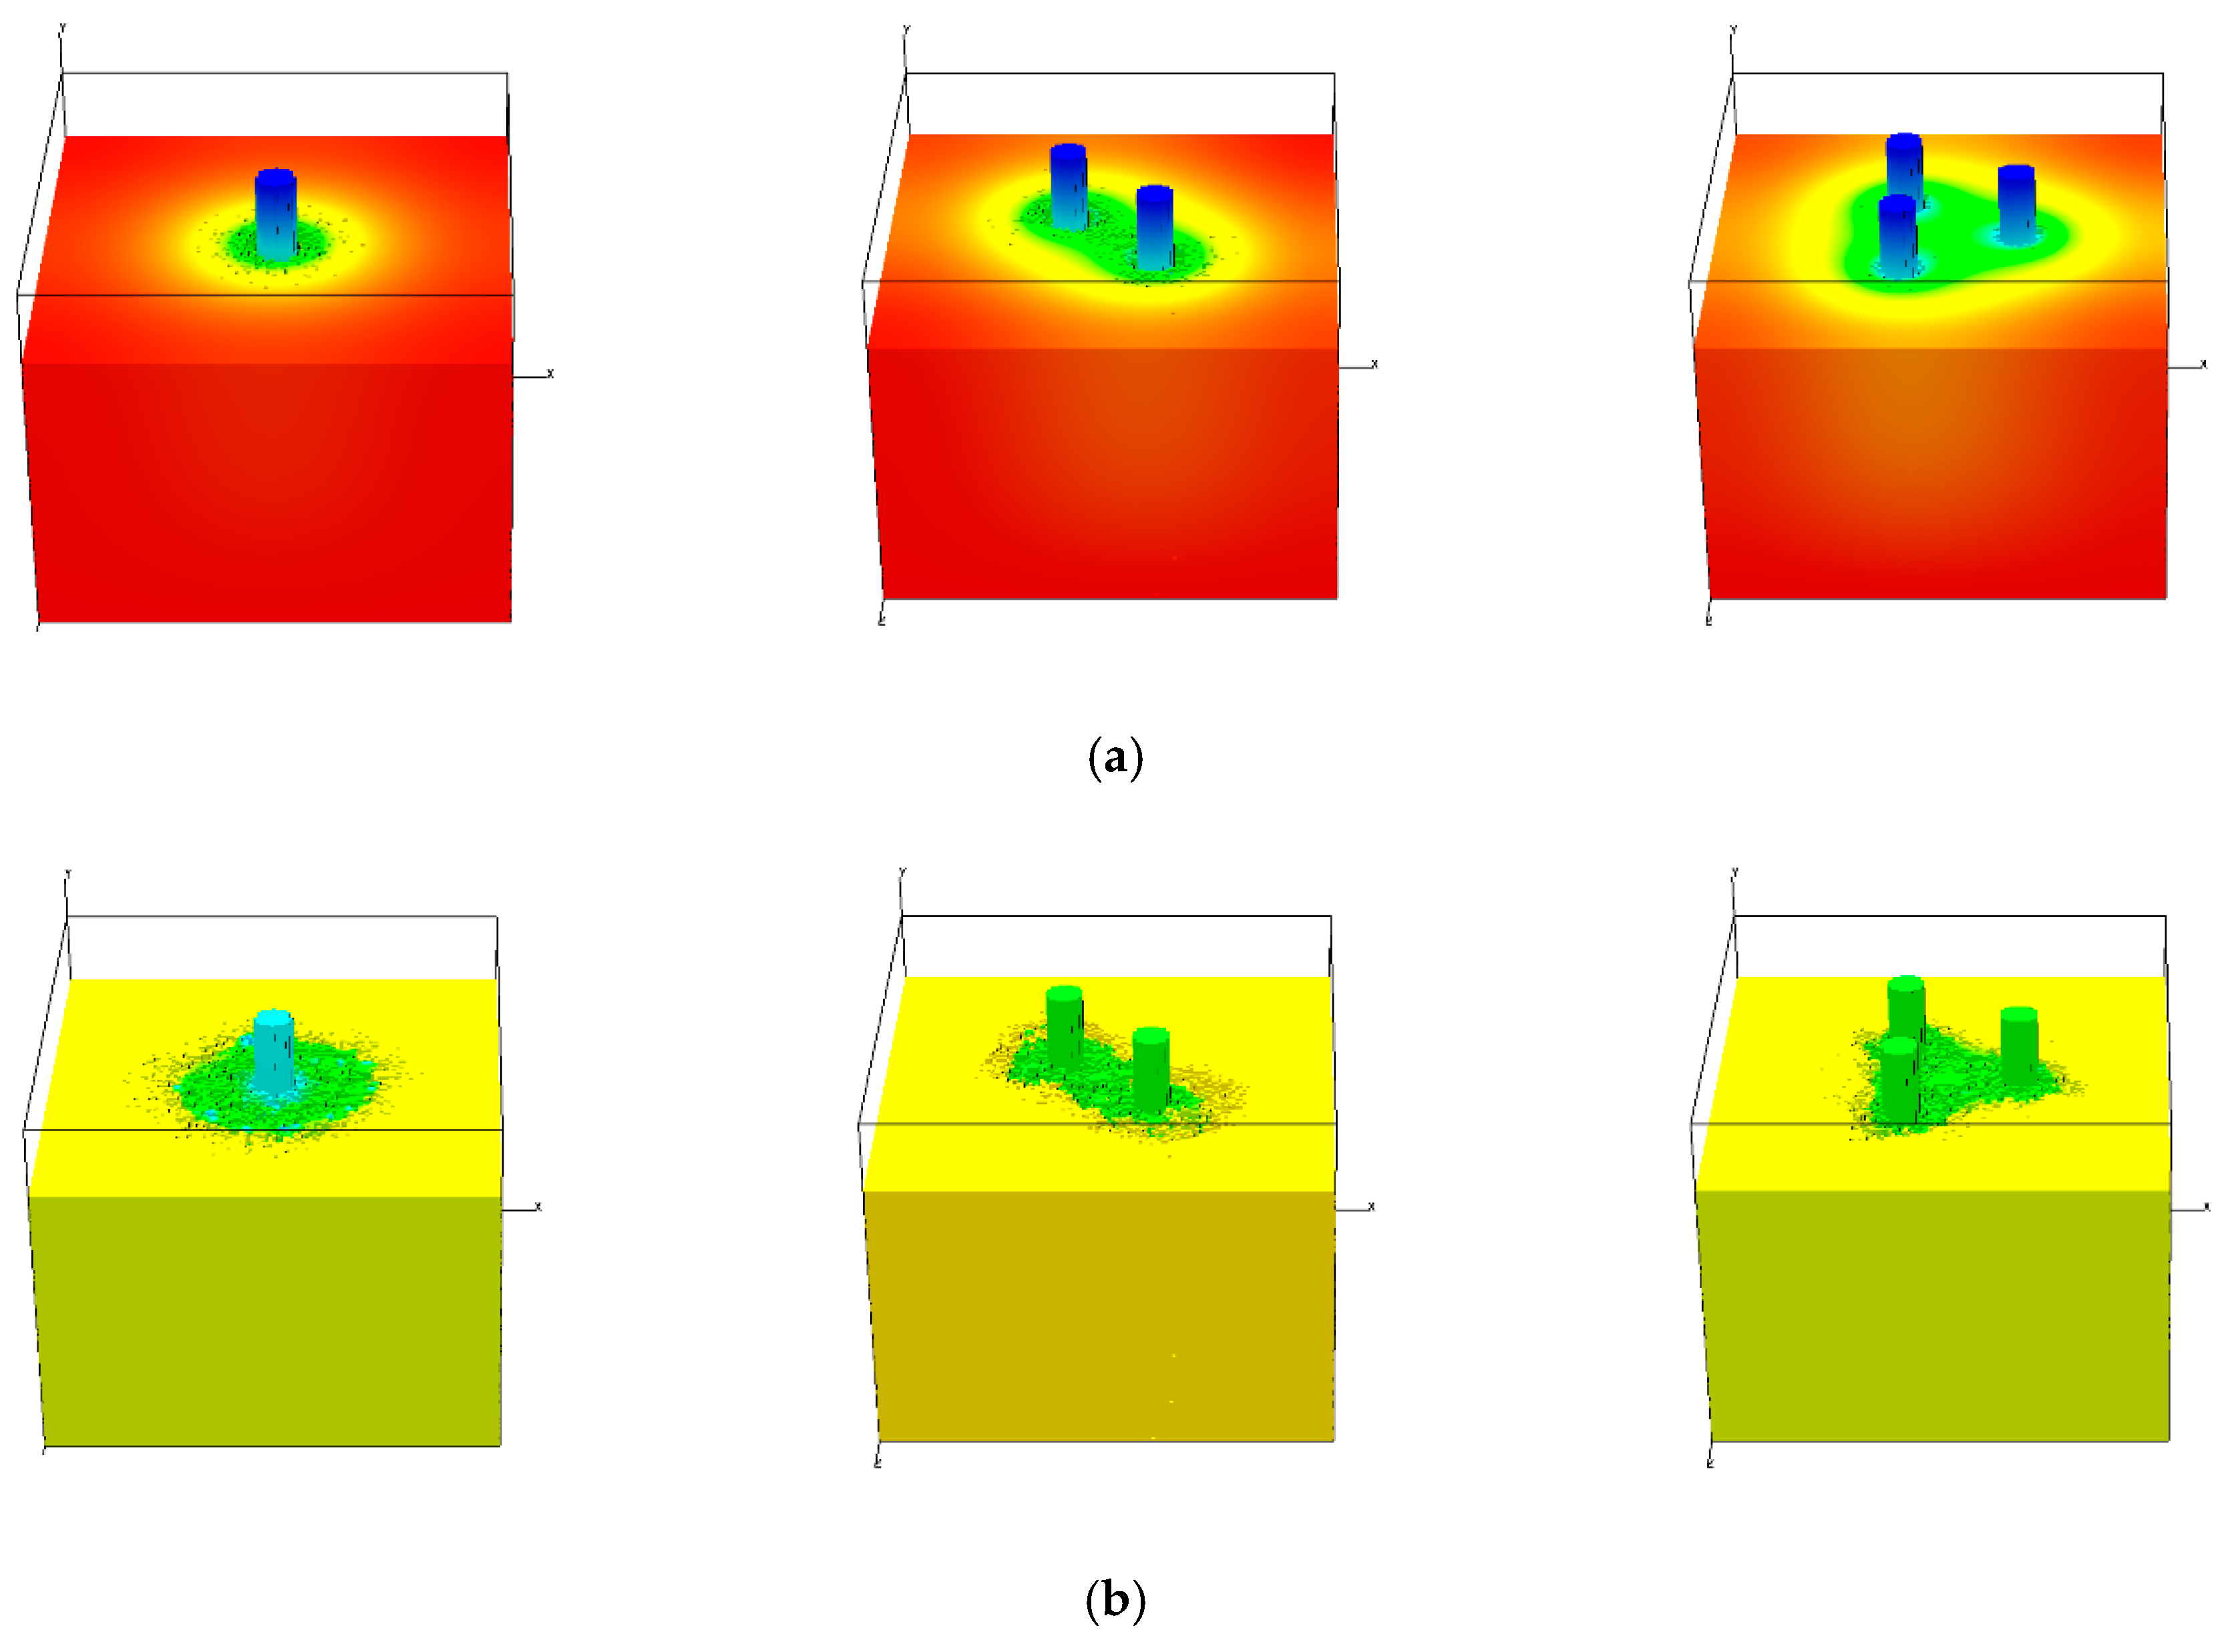
Figure 6 shows the failure process of the test models, the failure process of the group anchor and the single anchor has both similarities and differences. The similarities is that the three types are progressive damage from the surface to the inside as the load increases. The differences are that the model surface of the single anchor forms a circular displacement concentration area at the initial stage of loading, the model surface of the two-group anchors forms an elliptical displacement concentration area, and the model surface of the three-group anchors forms a triangular displacement concentration area, as shown in
Figure 6a. For the range size of the displacement concentration zone, the three-group anchor is greater than the two, and the two is greater than a single, which means that the group anchor has a larger influence range. With the continuous increase of displacement loading, the damage on the surface of the models is intensified, and the damage is transferred to the inside of the models, and the displacement concentration on the surface of the models is obviously weakened. When the displacement load is 50 mm, the damage on the surface of the three types is transformed into a complete failure, and all models form a failure area, and the shape of the failure area is the same as the displacement concentration area. The characteristics of the failure area are consistent with the above physical model test. This is in good agreement with the results of the above physical test, as shown in
Figure 4c and
Figure 6b.
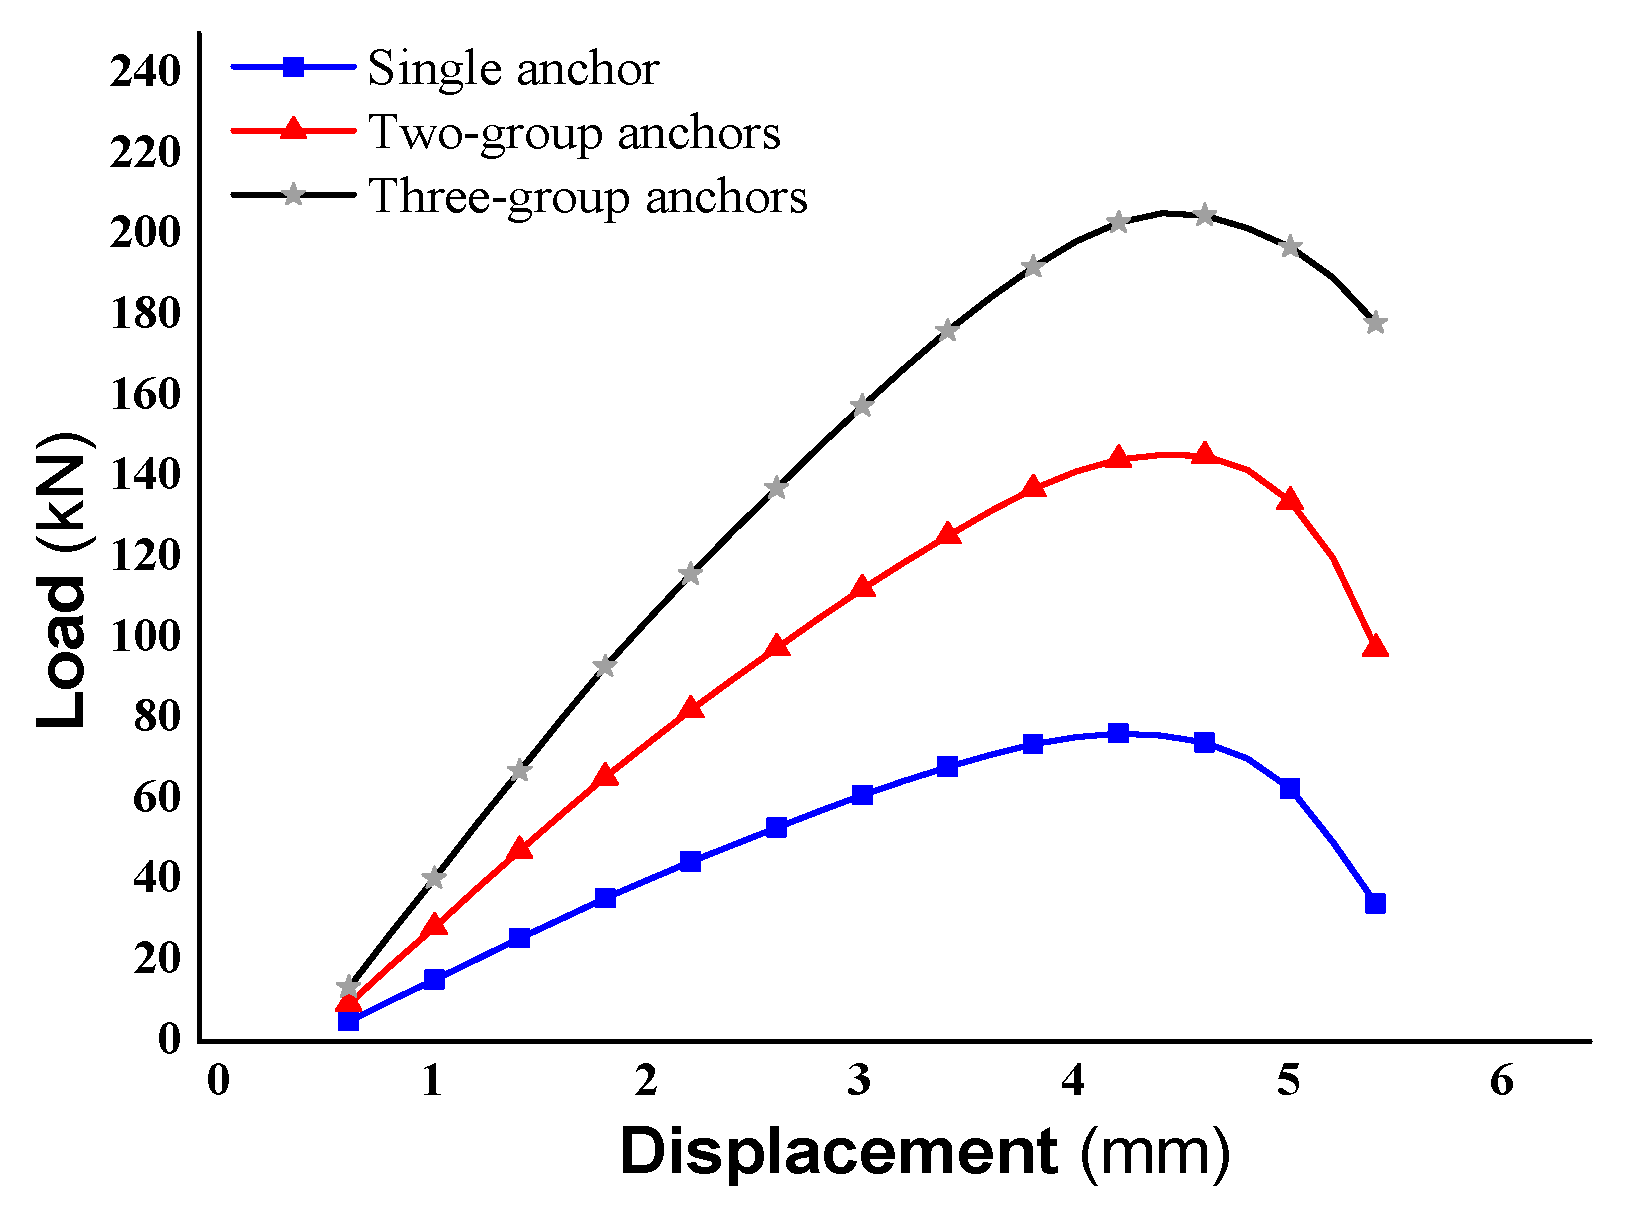
Figure 7 shows the relationship curve between the load and displacement of three different types of test models. Numerical results show that the maximum pulling force of a single anchor is 76 kN, the maximum pulling force of the two-group anchors is 145 kN, and the maximum pulling force of the three-group anchors is 205 kN. In contrast, the maximum pulling force of the two-group anchor is 1.9 times that of a single anchor, and the three-group anchor is 2.7 times that of a single anchor. Compared with physical test, the performance of the two-group anchor change from 78% to 95% (145 kN:2 × 76 kN), and the performance of the three-group anchor changes from 70% to 90% (205 kN:3 × 76 kN).
Figure 8 shows that the debonding failure process and characteristics of the anchors. Intuitively, the debonding failure process of the group anchor is almost the same as that of the traditional single anchor, which is a process of gradual debonding from the surface to the inside. Careful observation reveals that the debonding failure of the group anchor has some characteristics of its own. One of the characteristics is that the debonding length of the inner side of the rods is lower than that of the outer side; for example, when the two-group anchors is in step-24, the inner side of the rod is de-bonded by 40 mm, while the outer side is de-bonded by 50 mm. This shows that the group anchors and the concrete matrix in the middle of the group anchors jointly participate in carrying the pulling force, and this characteristic improves the toughness of bearing system for the anchors.
5. Discussion
5.1. The Test of Group Anchor
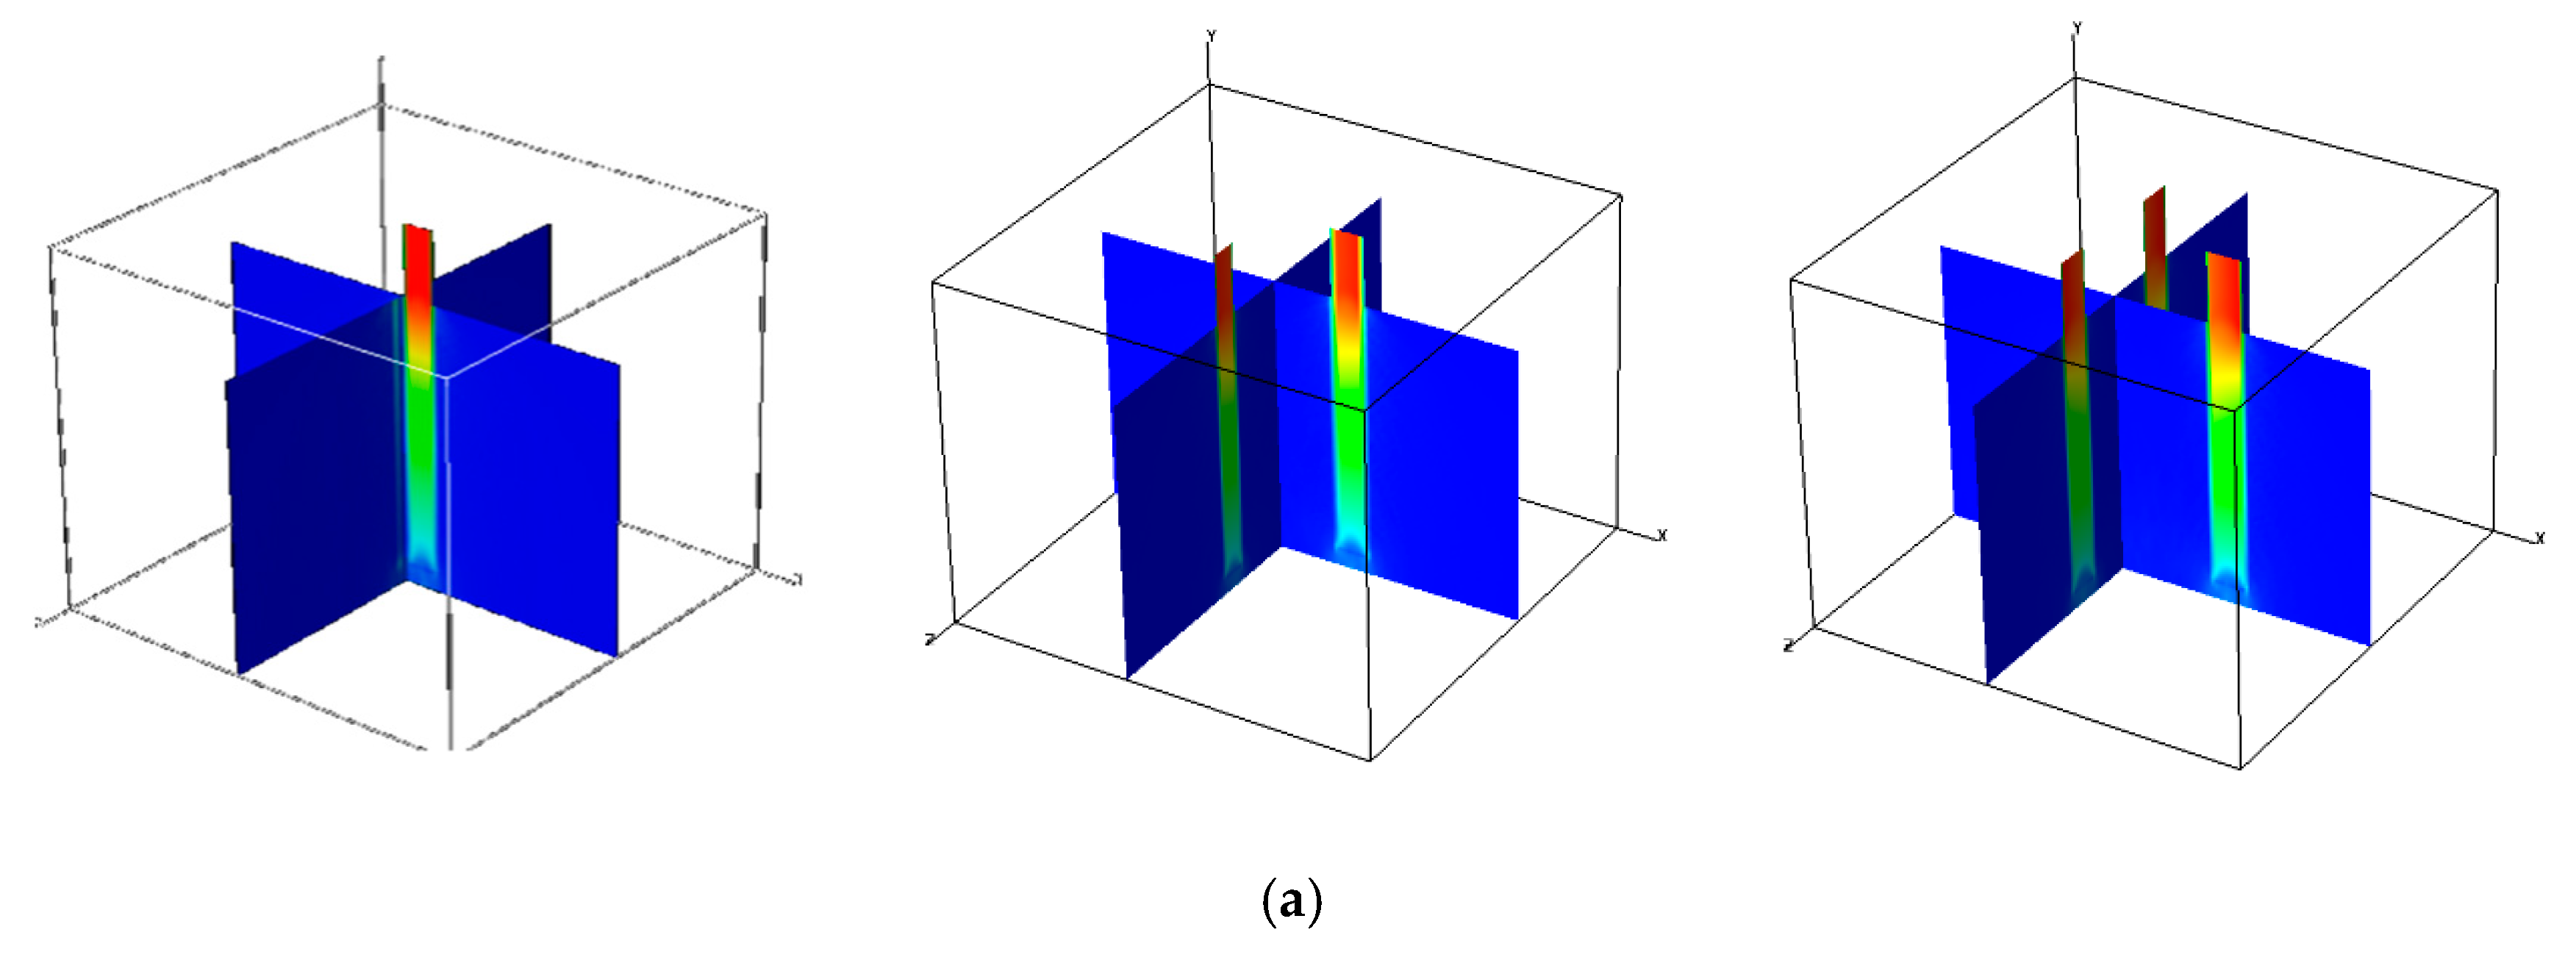
This paper designs a test tool for pulling multiple anchor rods, and studies the ultimate bearing capacity of single, double and three anchor rods through the MTS testing machine. Multiple anchor rods are combined together called group anchors. The above research results show that the group anchor can improve the ultimate bearing capacity and bearing stiffness, and reduce the stress concentration. The reason for the increase in ultimate bearing capacity and bearing stiffness is that the cross-sectional area is increased after the number of anchor rods is increased. With the same pull-out force, a single anchor rod has a small force area, obvious stress concentration, easy to damage, and has a small bearing capacity; while multiple anchor rods have a large force area, the stress concentration is weakened, and it is not easy to damage, and has a large bearing capacity. As shown in
Figure 9, under the same loading condition, the anchoring area of single anchor is destroyed first, then the group anchor, and the group anchor is relatively safe and stable. The traditional higher prestressed anchor will produce significant stress concentration in the anchoring area, which will cause the rock mass near the anchoring area to break or separate [
14]. The stress concentration is not conducive to the long-term stability of the surrounding rock of roadway.
The ultimate pulling force of the bolt is a key parameter of the bolt support design. The greater the ultimate pulling force, the better the support. Facundo Isla [
18] did a series of experimental pull-out tests consisting of different types of steel fibers with different inclinations extracted from various types of matrix. Georgiadi-SK [
19] deals with the numerical modelling of hooked steel rods embedded in high-strength cementitious matrix, and the model’s results show the steel rods having a doubly bended shape have a superior behavior compared to rods having a single bended part. Tieliang AN [
20] studied the pull-out bearing performance of anchor rods under cyclic loading. These studies are consistent with the research results of this paper, as far as the pull-out load curve is concerned. The traditional pull-out test of anchor rods is based on a single rod, the research in this paper focuses on the pull-out of multiple anchor rods (group anchor). The ultimate pull-out force of the group anchor is related to many factors, including the spacing between the anchor rods, the uniformity of the force of each rod and anchoring length, etc. When the ultimate pulling force is much smaller than the average value in the above test, there may be three reasons: (1) The force of member anchors in the group anchors is different. At the same time, some anchors are destroyed first because of greater force, and some anchors are destroyed later, in the group anchors. As a result, the overall ultimate pulling force is low. (2) The installation angle of the anchor is not vertical or the anchoring length of the anchor is less than the design value, resulting in a lower overall ultimate pulling force. (3) Due to the defects in the production and maintenance of the concrete models, the matrix strength of part test model is lower, resulting in a low ultimate pulling force of the anchor. In this test, the reason for the abnormal value of the third model of the two-group anchors may be (2) and (3), and the reason for the abnormal value of the third model of the three-group anchors should be (1).
5.2. The Support of Group Anchor
With the increase of mining depth, the supporting capacity of coal mine anchors has reached its limit; for some difficult roadways, the existing anchor supporting performance can no longer meet the production requirements, and the development of higher prestressed anchors suitable for mining engineering is very necessary.
The group anchor is a very simple combination structure of anchor rods, which can quickly realize the super prestressed anchor support technology without major reforms to the existing anchor construction technology. Moreover, the group anchor can form a common bearing structure with the rock mass in the group anchor rods to improve the rigidity and toughness of the anchors. The advantages of the group anchor are that the group anchor can be used for centralized support, save support space, can match intelligent excavation with scarce space resources, and can solve difficult support problems in specific locations in specific environments.
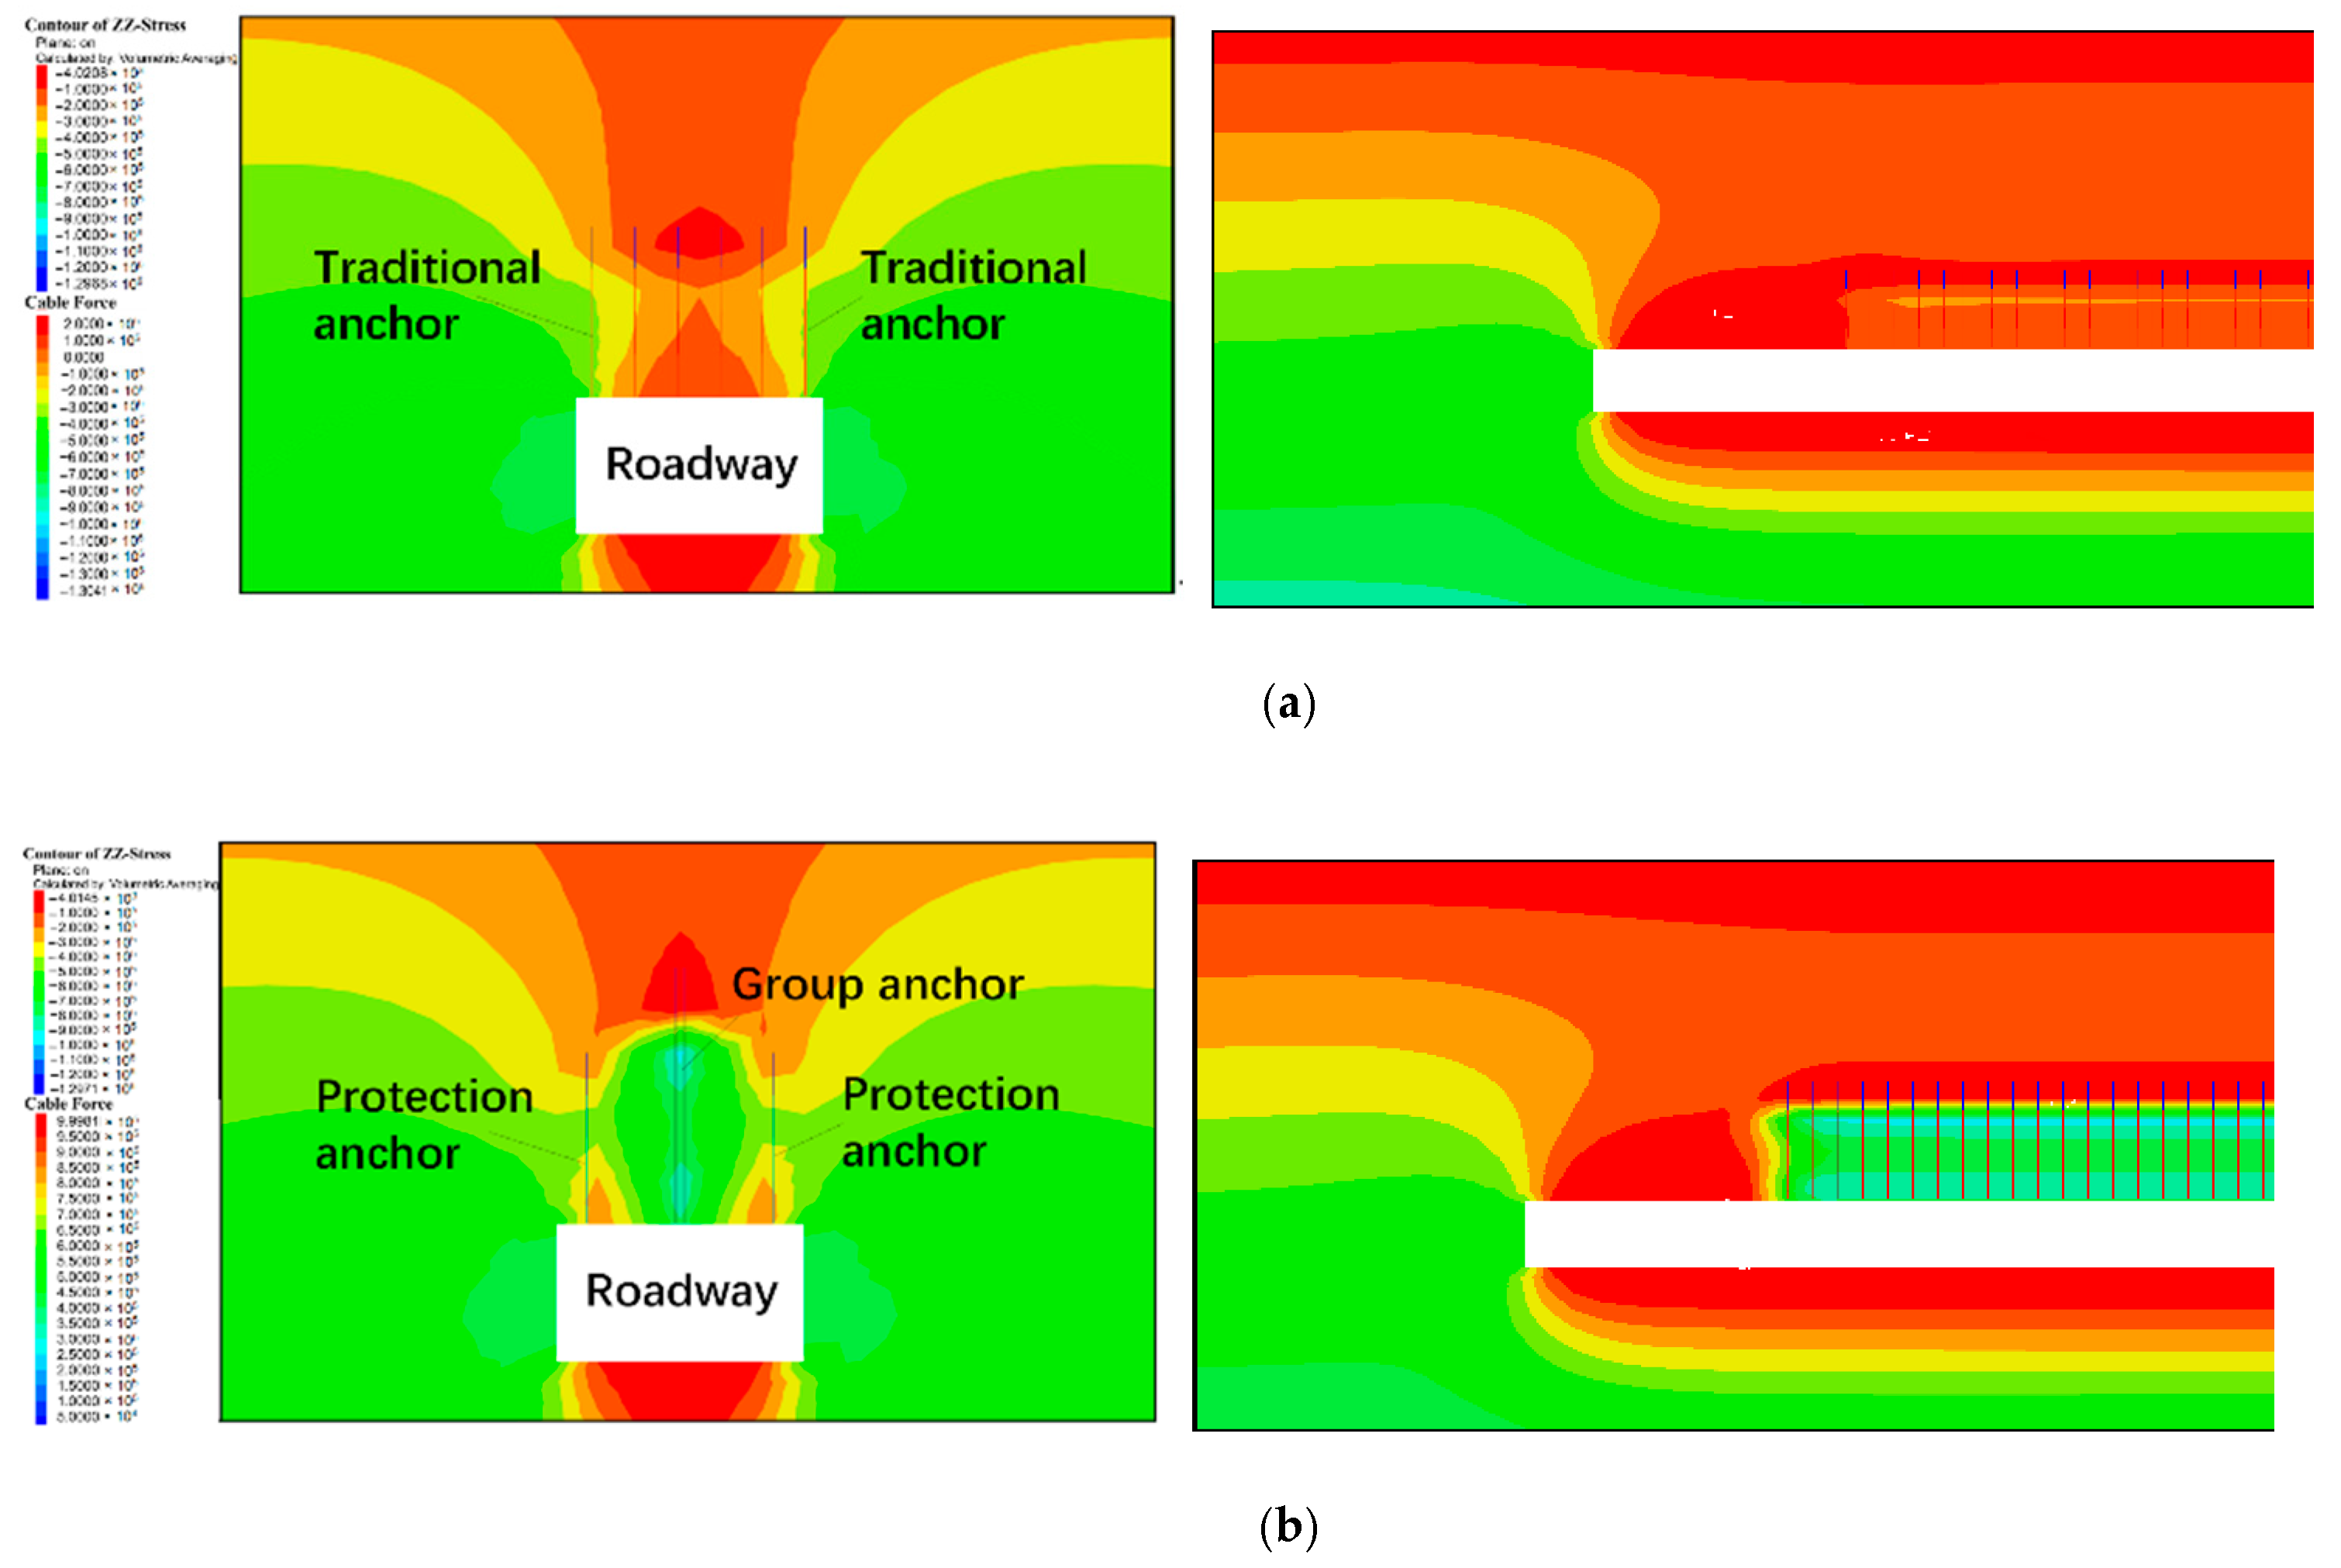
Figure 10 shows the comparison results of group anchors and traditional anchors in roadway support. The traditional anchor support scheme is six anchors, length 4 m, prestress 200 kN (
Figure 10a); the group anchor support scheme is: a two-group anchor is placed at the center of the roadway, prestress 1000 kN, the length is 6 m, accompanied by two surface protection anchors, the prestress 100 kN (
Figure 10b). The results show that the stress distribution on the roof of the group anchors is more uniform than that of the traditional anchors, which is beneficial to support. When the prestress of the group anchor is much larger than that of the ordinary anchor to protect the surface, the improving of the supporting bearing capacity is obvious. The advantage of group anchors lies in the ability to concentrate support and save support space. The group anchors are helpful to solve difficult support problems in specific environments and specific locations. The group anchors structure increases the number of the rods and also increases the cost. However, the group anchors support technology can further optimize the support parameters to make up for the increased cost. In addition, the use of recyclable anchors is also a way to reduce support costs.
6. Conclusions
In this study, a group anchor structure is proposed, and laboratory tests and numerical simulations were performed to investigate the stress states of the group anchors under various loading conditions. We came to the following conclusion:
- (1)
The group anchor is a simple combination structure of anchors, which can quickly realize the anchor support of super prestress in a same tray, without major upgrades to the existing anchor construction technology. The group anchors can not only distribute the higher prestress to multiple anchor rods to reduce the stress concentration, but also form a common bearing structure with the rock mass to improve the bearing capacity and bearing toughness of the anchor.
- (2)
Under the same conditions, the more the number of the rod in the group anchor, the greater the ultimate pulling force. The group anchor structure can weaken the bending moment on the edge of the tray and help to maintain the long-term super prestress, and the group anchors are helpful to solve difficult support problems in specific environments and specific locations. The advantage of group anchors lies in the ability to concentrate support and save support space.
- (3)
The coupling effect of the group anchor rods has an adverse effect on the supporting performance, the more the number of the rod, the lower the efficiency of supporting performance for the group anchor. In the physical test, the efficiency of the two-group anchor is 78% of that of a single anchor; the efficiency of the three-group anchor is 70% of that of a single anchor. In the numerical test, the efficiency of the two-group anchor is 95% of that of a single anchor; the efficiency of the three-group anchor is 90% of that of a single anchor.
- (4)
The support technology of the group anchor can further optimize the support parameters to improve the bearing capacity of the surrounding rock. The group anchor can be used as the main bearing structure of anchor support, and other ordinary anchors only need to protect the surface of the shallow surrounding rock.
Author Contributions
All of the authors contributed extensively to the work. C.J. and Z.N. proposed key ideas. W.Q. designed the experiment schemes. W.S. directed this article. analyzed the data. Q.W. wrote the paper. X.F. and J.C. modified the manuscript. All authors have read and agreed to the published version of the manuscript.
Funding
This work was financially supported by the supported by “the Fundamental Research Funds for the Central Universities” (2020ZDPYZD02), and the National Natural Science Foundation of China (52034007).
Institutional Review Board Statement
Not applicable.
Informed Consent Statement
Not applicable.
Data Availability Statement
Not applicable.
Acknowledgments
We are very grateful to reviewers, editors and all the people who helped our paper.
Conflicts of Interest
The authors declare no conflict of interest.
References
- Nemcik, J.; Ma, S.; Aziz, N.; Ren, T.; Geng, X. Numerical modelling of failure propagation in fully grouted rock bolts subjected to tensile load. Int. J. Rock Mech. Min. Sci. 2014, 71, 293–300. [Google Scholar] [CrossRef]
- Peng, S.S.; Tang, D.H.Y. Roof bolting in underground mining: A state-of-the-art review. Int. J. Min. Eng. 1984, 2, 1–42. [Google Scholar] [CrossRef]
- Kang, H.-P.; Lin, J.; Wu, Y.-Z. Development of high pretensioned and intensive supporting system and its application in coal mine roadways. Procedia Earth Planet. Sci. 2009, 1, 479–485. [Google Scholar] [CrossRef]
- Xie, H. Research progress on deep rock mechanics and mining theory. J. China Coal Soc. 2019, 44, 1283–1305. [Google Scholar]
- Kang, Y.S.; Liu, Q.S.; Gong, G.Q.; Wang, H. Application of a combined support system to the weak floor reinforcement in deep underground coal mine. Int. J. Rock Mech. Min. Sci. 2014, 71, 143–150. [Google Scholar] [CrossRef]
- He, M.C. Latest progress of soft rock mechanics and engineering in China. J. Rock Mech. Geotech. Eng. 2014, 6, 165–179. [Google Scholar] [CrossRef]
- Li, C.C. Field Observations of Rock Bolts in High Stress Rock Masses. Rock Mech. Rock Eng. 2010, 43, 491–496. [Google Scholar] [CrossRef]
- Zhu, S.Y.; Jiang, Z.Q.; Zhou, K.J.; Peng, G.; Yang, C. The characteristics of deformation and failure of coal seam floor due to mining in Xinmi coal field in China. Bull. Eng. Geol. Environ. 2014, 73, 1151–1163. [Google Scholar] [CrossRef]
- Zhang, S.F.; Zhang, L.; Li, L.; Song, X. Guang Study on the Interfacial Shear Stress Distribution Characteristics of Geotechnical Prestressed Anchorage Structure. Adv. Mater. Res. 2014, 919–921, 773–776. [Google Scholar] [CrossRef]
- Ding, W.T.; Liu, J.H.; Li, S.C. Discussion on Anchor Structures Deterioration Analysis Parameter Caused by Reinforcement Corrosion under Erosion Environment Condition. Appl. Mech. Mater. 2013, 268–270, 827–830. [Google Scholar] [CrossRef]
- Li, C.C. A practical problem with threaded rebar bolts in reinforcing largely deformed rock masses. Rock Mech. Rock Eng. 2007, 40, 519–524. [Google Scholar] [CrossRef]
- Guo, R.Q.; Chen, Q.M.; Hu, W. 1000 kN Prestressed Anchor Test. J. Yangtze River Sci. Res. Inst. 1996, S1, 60–62. [Google Scholar]
- Li, X.P.; He, S.M.; Wu, Y. Limit analysis of the stability of slopes reinforced with anchors. Int. J. Numer. Anal. Methods Geomech. 2012, 36, 1898–1908. [Google Scholar] [CrossRef]
- Cao, J.; Zhang, N.; Wang, S.; Qian, D.; Xie, Z. Physical Model Test Study on Support of Super Pre-stressed Anchor in the Mining Engineering. Eng. Fail. Anal. 2020, 118, 104833. [Google Scholar] [CrossRef]
- Zhang, K.; Zhang, G.; Hou, R.; Wu, Y.; Zhou, H. Stress evolution in roadway rock bolts during mining in a fully mechanized longwall face, and an evaluation of rock bolt support design. Rock Mech. Rock Eng. 2015, 48, 333–344. [Google Scholar] [CrossRef]
- Zhang, Y.K.; Yu, W.J. Parameter Optimization on Bolt Supporting of Deep Roadway Surrounding Rock. Adv. Mater. Res. 2013, 721, 387–391. [Google Scholar] [CrossRef]
- Li, H.; Liu, W.J.; Qiao, W.G. Study on High Prestressed Anchor Beam Supporting Optimization Technology in Deep Roadway. Appl. Mech. Mater. 2013, 353, 1675–1679. [Google Scholar] [CrossRef]
- Isla, F.; Ruano, G.; Luccioni, B. Analysis of steel fibers pull-out. Experimental study. Constr. Build. Mater. 2015, 183–193. [Google Scholar] [CrossRef]
- Georgiadi, S.K.; Mistakidis, E.; Pantousa, D.; Zygomalas, M. Numerical modeling of the pull-out of hooked steel fibres from high-strengh cementitious matrix, supplemented by experimental results. Constr. Build. Mater. 2010, 24, 2489–2506. [Google Scholar] [CrossRef]
- An, T.; Zheng, X.; Zhu, D.; Qian, D.; Guo, Y.; Cao, J. Experimental investigation of pretensioned bolts under cyclic loading: Damage assessment using acoustic emission. Int. Distrib. Sens. Netw. 2019, 15. [Google Scholar] [CrossRef]
| Publisher’s Note: MDPI stays neutral with regard to jurisdictional claims in published maps and institutional affiliations. |
© 2021 by the authors. Licensee MDPI, Basel, Switzerland. This article is an open access article distributed under the terms and conditions of the Creative Commons Attribution (CC BY) license (http://creativecommons.org/licenses/by/4.0/).
