Article

Tunability of the Nonlinear Interferometer Method for Anchoring Constructive Interference Patterns on the ITU-T Grid

Department of physics, Pohang University of Science and Technology (POSTECH), Pohang 37673, Korea
*
Author to whom correspondence should be addressed.
Appl. Sci. 2021, 11(4), 1429; https://doi.org/10.3390/app11041429
Submission received: 7 January 2021 / Revised: 30 January 2021 / Accepted: 1 February 2021 / Published: 5 February 2021
(This article belongs to the Special Issue Basics and Applications in Quantum Optics)

Abstract

:
Recently, a method of engineering the quantum states with a nonlinear interferometer was proposed to achieve precise state engineering for near-ideal single-mode operation and near-unity efficiency (L. Cui et al., Phys. Rev. A 102, 033718 (2020)), and the high-purity bi-photon states can be created without degrading brightness and collection efficiency. Here, we study the coarse or fine tunability of the nonlinear interference method to match constructive interference patterns into a transmission window of standard 100-GHz DWDM channels. The joint spectral intensity spectrum is measured for various conditions of the nonlinear interference effects. We show that the method has coarse- and fine-tuning ability while maintaining its high spectral purity. We expect that our results expand the usefulness of the nonlinear interference method. The photon-pair generation engineered via this method will be an excellent practical source of the quantum information process.

1. Introduction

Modal purity or indistinguishability is an essential factor in achieving high visibility of quantum interference for quantum photonic applications such as quantum teleportation [1] and linear optical quantum computing [2]. High visibility yields high operation fidelity and a high probability of success in quantum information processing using non-classical states of single photons. Among many approaches to obtain non-classical states of photons, spontaneous four-wave mixing (SFWM) has been intensively investigated for the frequency correlated photon-pair generation and heralded single-photon states [3]. However, frequency-correlated photon pairs by the spontaneous parametric process have complicated two-photon states and have a multi-mode nature [4,5]. The multi-mode nature makes photons distinguishable, degrading the quantum interference’s visibility. Therefore, spectrally uncorrelated photon pairs with a factorable joint spectral amplitude (JSA) can induce high visibility of quantum interference [4,6] with high indistinguishability and high spectral purity.
The simplest way to obtain spectrally uncorrelated photon-pair is the spectral filtering method with narrow-band filters, but this method can degrade the brightness and photon-number purity due to the optical loss by the filters [7]. The other ways for spectrally uncorrelated photons comes from engineering the dispersion of a parametric medium [8,9]. In spontaneous parametric down-conversion, near unity spectral purity can be achieved with a periodically poled structure [10,11,12], and SFWM has been tested as well with similar techniques [8,13,14,15,16,17]. While most of the methods are successful to some extent, many sources are expensive to make, not easy to implement, or limited to a specific wavelength range of operation due to strict requirements for dispersion and phase matching [18].
Recently, a new method of engineering the quantum states with nonlinear interference (NLI) is proposed and demonstrated [18,19,20]. The NLI system consists of two identical nonlinear media and one linear dispersive medium, which is placed in between them. Due to the phase shift induced by the linear dispersive medium, the joint spectral intensity (JSI) function of bi-photons shows oscillating interference patterns. By adjusting the NLI properties, the authors demonstrated the improved quantum properties of single-photon, spectral correlation, and Hong-Ou-Mandel interference using commercially available optical fibers [19,20]. The author used programmable and tunable filters as the signal and idler filters to reduce noise photons other than the generated photon pair and to have high spectral purity.
Optical fiber systems can guarantee the interoperability between systems and improve their price competitiveness through the standardization of optical communications technology. The standardization of optical frequency channels is necessary for wavelength division multiplexing and is defined by the International Telecommunication Union-Telecommunication standardization sector (ITU-T). Note that the use of customized filters or optical devices raises the entire system’s price and makes system development difficult. Using photons on the ITU-T grids makes quantum technologies simple, as most optical devices in current telecommunication systems have frequency channels specified on the ITU-T grids and are commercially available with a reasonable price, high transmittance, narrow bandwidth, well-defined wavelength, etc. The center wavelength of the constructive interference is mainly determined by the length of the linear medium of an NLI system [18,19,20]. A carefully selected linear medium can make one of the constructive interference modes in a transmission window of DWDM filters without degrading brightness and collection efficiency to obtain high spectral purity. For the case of using single-mode fiber (SMF) as a dispersive medium, only one constructive island can be matched on the ITU grid as Δ k S M F of SMF is quadratically dependent on the detuning of pairs from the pump frequency ( Δ ω s ( i ) =   | ω p ω s ( i ) | ) [18,21]. In order to match all islands on the ITU grids, Δ k S M F should be linearly proportional to the detuning, and this requires the replacement of SMF with a device having linear Δ k S M F on the detuning [18]. Having pairs over the several ITU-T grids would be helpful for complex multi-photon interference experiments or multi-wavelength channel QKD.
A simple NLI system consists of two dispersion-shifted fiber (DSF) segments as a nonlinear pair generation medium and a section of standard SMF (Corning SMF-28), which is placed between two DSF segments as a linear dispersive medium. The NLI system can be extended by repeatedly adding additional sections of SMF and DSF, and the number of stage (N) is the number of DSF sections in the NLI system. For the case of pumping in the C-band (1530–1560 nm) and using a sufficiently long fiber, C-band photon-pair generation in SMF is negligible for a signal and idler detuning of 400 GHz (~3.2 nm) [21]. Ignoring the propagation loss of fibers and pump chirping, the bi-photon state amplitude through an N-stage NLI system can be calculated by [18],
F NLI ( ω s ,   ω i ) = F DSF ( ω s , ω i ) × [   n = 1 N exp { i ( n 1 ) ( Δ k DSF L DSF + Δ k SMF L SMF ) } ]
where F DSF ( ω s , ω i ) is the JSA at the signal ( ω s ) and idler ( ω i ) frequency generated by SFWM in a single DSF section, Δ k DSF ( Δ k SMF ) is the phase mismatch between signal, idler, and two pump fields in DSF (SMF), L DSF ( L SMF ) is the length of DSF (SMF), respectively. Each n-th segment of DSF generates an identical bi-photon state to each other, and the phase shift of Δ k DSF L DSF + Δ k SMF L SMF induces the quantum interference in the bi-photon state [18]. From Equation (1), the center wavelength of a constructive interference pattern is tunable by changing Δ k DSF , Δ k SMF , L DSF , L SMF , and N. The physical parameters such as L DSF , L SMF , and N are variable by changing the length of DSF and SMF and the number of DSF and SMF sections in the NLI system. The optical parameters of Δ k DSF and Δ k SMF are controllable with the pump wavelength, types of fiber, and temperature.
Here, we investigate the coarse and fine tunability of the nonlinear interference method for creating bi-photon states with high spectral purity. The stimulated-emission-based JSI, which is the absolute square of JSA, measurement technique [22] is used for fast measurements of the JSI spectra, and the measured results are compared to the theoretical prediction, which is calculated using Equation (1). We change the pump wavelength, length of DSF and SMF sections, number of stages, and temperature. The coarse and fine tunability of the NLI method is experimentally demonstrated to control a bright JSI pattern to enter into one of the 100-GHz DWDM filters with the ITU-T channel grid. These results prove that the study in this paper enriches the usefulness and practicality of the NLI method for the efficient photon-pair generation with high spectral purity.

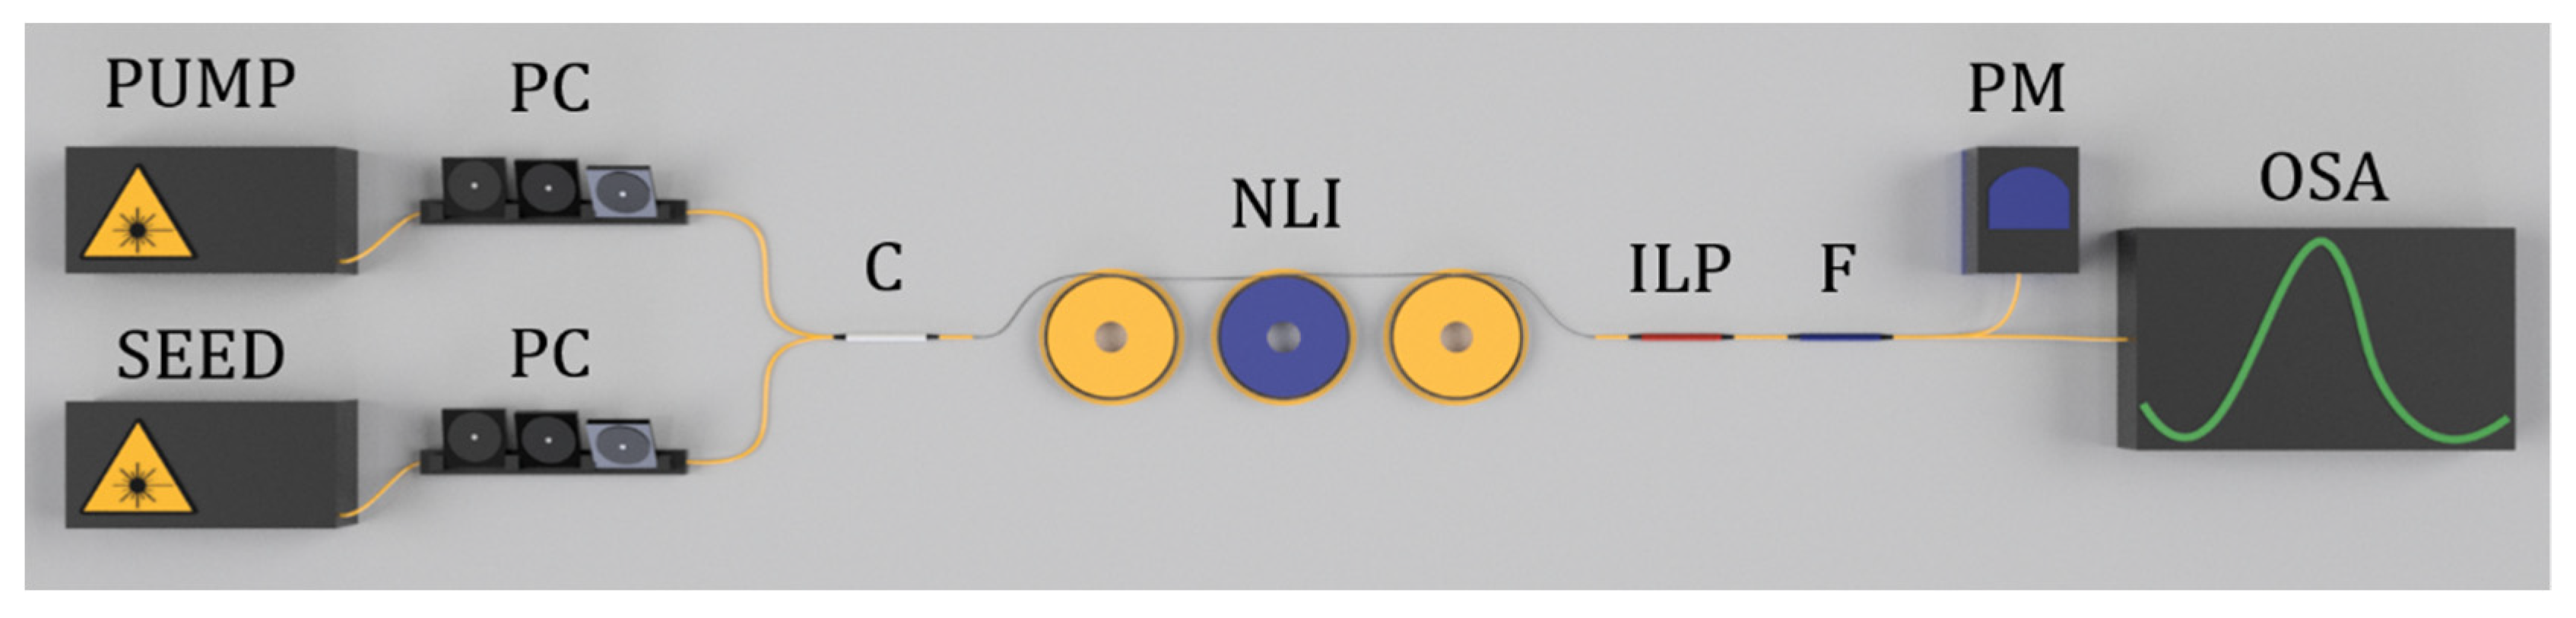
2. Measurement Setup

Figure 1 shows the experimental setup for the stimulated-emission-based JSI measurements. The pump laser is a mode-locked femtosecond (fs) pulse laser (CALMAR FPL-02CTF) with a repetition rate of 18 MHz. Femtosecond pulses are spectrally filtered by a 100-GHz DWDM filter, which has a flat-top spectral shape with about 0.6-nm full-width at half-maximum (FWHM) bandwidth. After filtering, pulses are amplified by an Erbium-Doped Fiber Amplifier (EDFA) and filtered again by DWDM filter to reduce amplified spontaneous emission (ASE) noise from EDFA (not included in Figure 1). The final pump pulse width is about 15 ps and effective bandwidth is about 0.5 nm. The pump peak power ( P p ) is about 500 mW, and the seed (or signal) laser is a continuous wave laser with a power of about 10 mW. The lights from the pump and seed lasers are combined by a 200-GHz DWDM filter and injected into an NLI sample. The NLI samples consist of N sections of DSF and N-1 sections of SMF. The length of the DSF and SMF sections is measured using the time-of-flight measurement technique [23]. The polarization states of the pump and seed lights are matched using a polarization controller and an in-line polarizer. The pump light is filtered via a 200-GHz DWDM filter and monitored using an optical power meter to maximize the transmitted power through the in-line polarizer. We discretely vary the wavelength of the seed light while measuring the power of the seed, and generated idler lights using an optical spectrum analyzer. To clearly observe the trend in the shape and position of the JSI spectrum while changing several experimental conditions, we show the normalized spectra. The generated idler power is divided by the input signal power to compensate the system’s wavelength-dependent transmittance, and then we normalize it to the maximum value from each measurement’s spectrum.
The spectral purity of bi-photons might be changed according to the pump bandwidth ( σ p ), but under our experimental conditions, the FWHM pump bandwidth is fixed. Since the pump bandwidth is narrower than that of 100-GHz DWDM filters, we selected the 100-GHz DWDM filters as the target filters of signal/idler photons. In addition, since Raman noise photons increase further away from the pump frequency [24], we decided that 100-GHz DWDM filters, whose center frequency spacing from the pump is ±400 GHz, were the target filters for reducing the Raman noise through the NLI optical fiber system.

3. Results

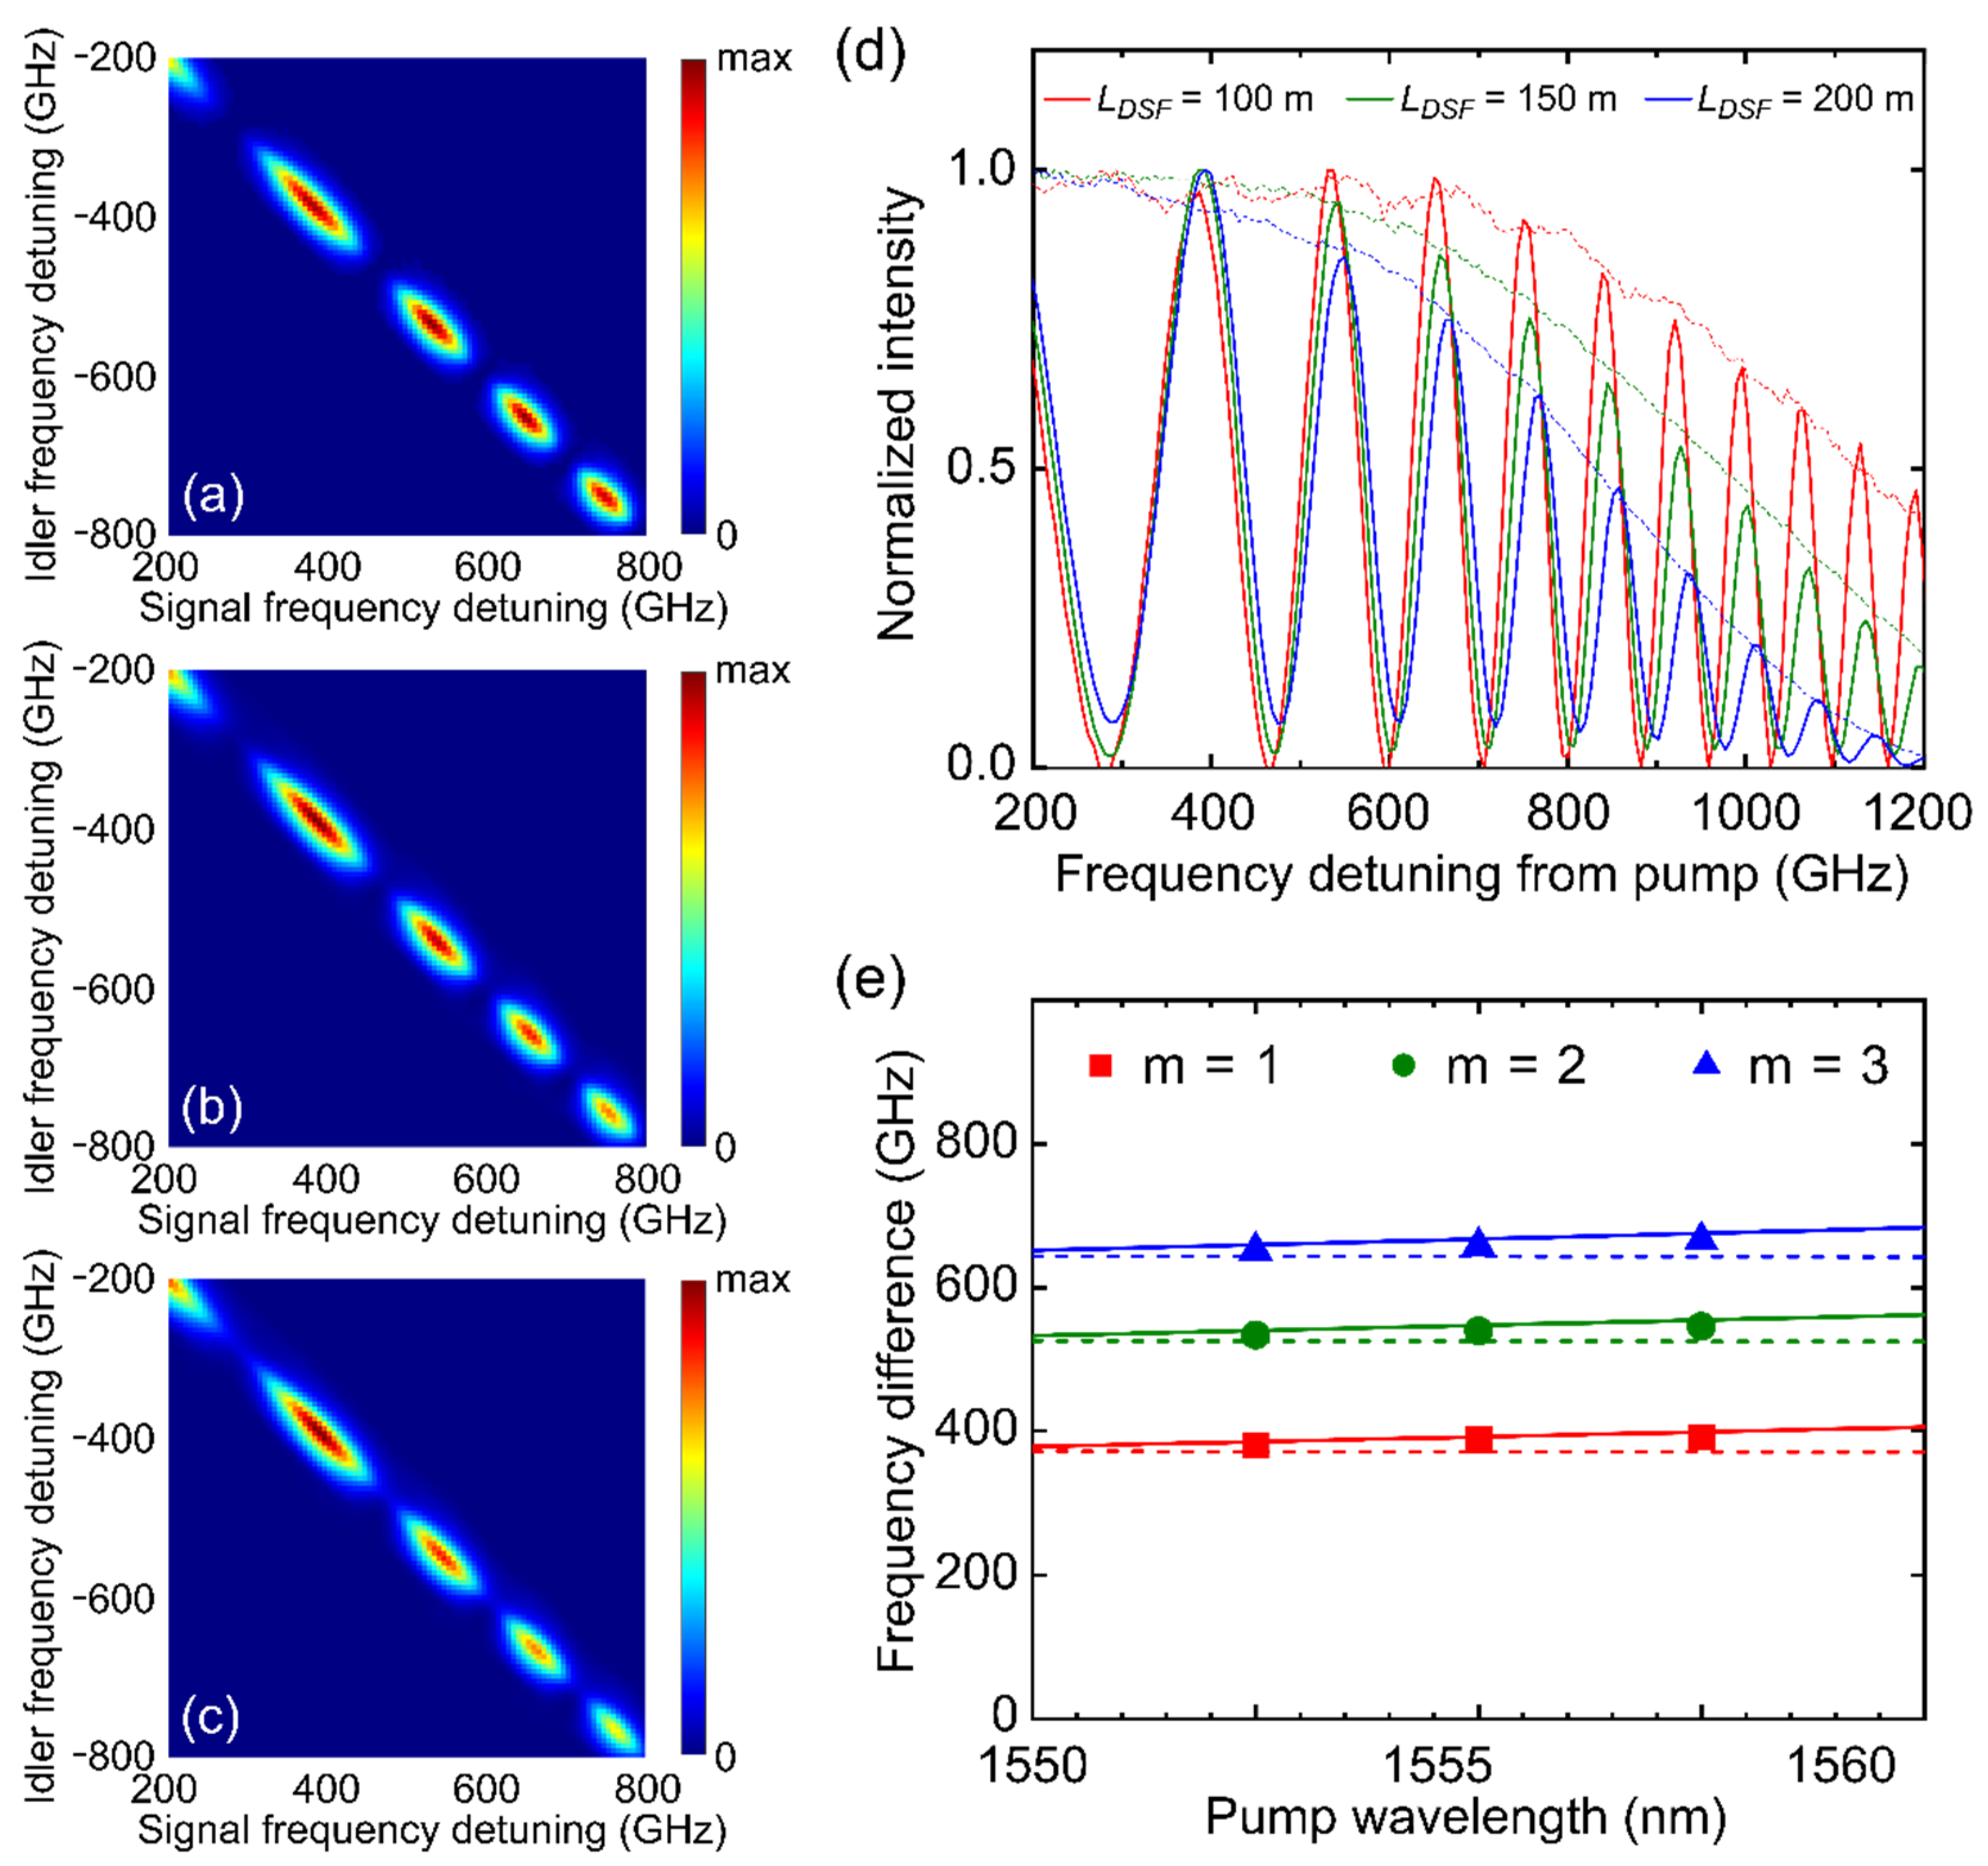
3.1. Pump Wavelength

First, we test the effect of the pump wavelength ( λ p ) on the NLI patterns. When we change the pump wavelength, Δ k DSF and Δ k SMF are varied, simultaneously. The NLI system under this test consists of two 100-m DSF sections and a 50-m SMF section located between two DSF sections. Figure 2a–c show the measured JSIs for various pump wavelengths, λ p = [(a) 1550.92 nm (ITU ch.33), (b) 1555.75 nm (ITU ch.27), (c) 1560.61 nm (ITU ch.21)]. The patterns show the constructive and destructive interference patterns as an island arc along the diagonal dashed white line as seen in Figure 2a, and the first bright island (m = 1) is about 400 GHz away from the pump frequency. The JSI spectrum in Figure 2a–c looks very similar to each other for various λ p ’s, but as seen in Figure 2d, the normalized diagonal JSI spectrum (like the dotted white line in Figure 2a) against the frequency detuning from the pump frequency shows the slow JSI shift towards λ p as λ p increases.
Figure 2e shows the difference between the pump center frequency and the peak frequency of the first, second, and third islands (m = 1, 2, and 3, respectively) against λ p . The lines are the theoretical predictions extracted from the calculated JSI using Equation (1). In the JSI calculation, the zero group-velocity-dispersion (GVD) wavelength of DSF ( λ 0 , DSF ) is 1555.5 nm, and its dispersion slope is 71.5 s/m3. The zero GVD wavelength of SMF ( λ 0 , SMF ) is known to be about 1300 nm, and the dispersion of SMF at 1550 nm used in the calculation is 18 × 10 6   s / m 2 with a dispersion slope of 53.3 s/m3. As seen in Figure 2e, the measured peak shift rates with increasing λ p are approximately −2.5 GHz/nm, −3.6 GHz/nm, and −4.3 GHz/nm for the interference mode number m = 1, 2, and 3, respectively. As the mode number, m, increases, the peak frequency moves faster towards the pump frequency with increasing λ p , and the measured results match well with the theoretical predictions. This slow frequency shift yields the fine tunability of the center frequency of islands.

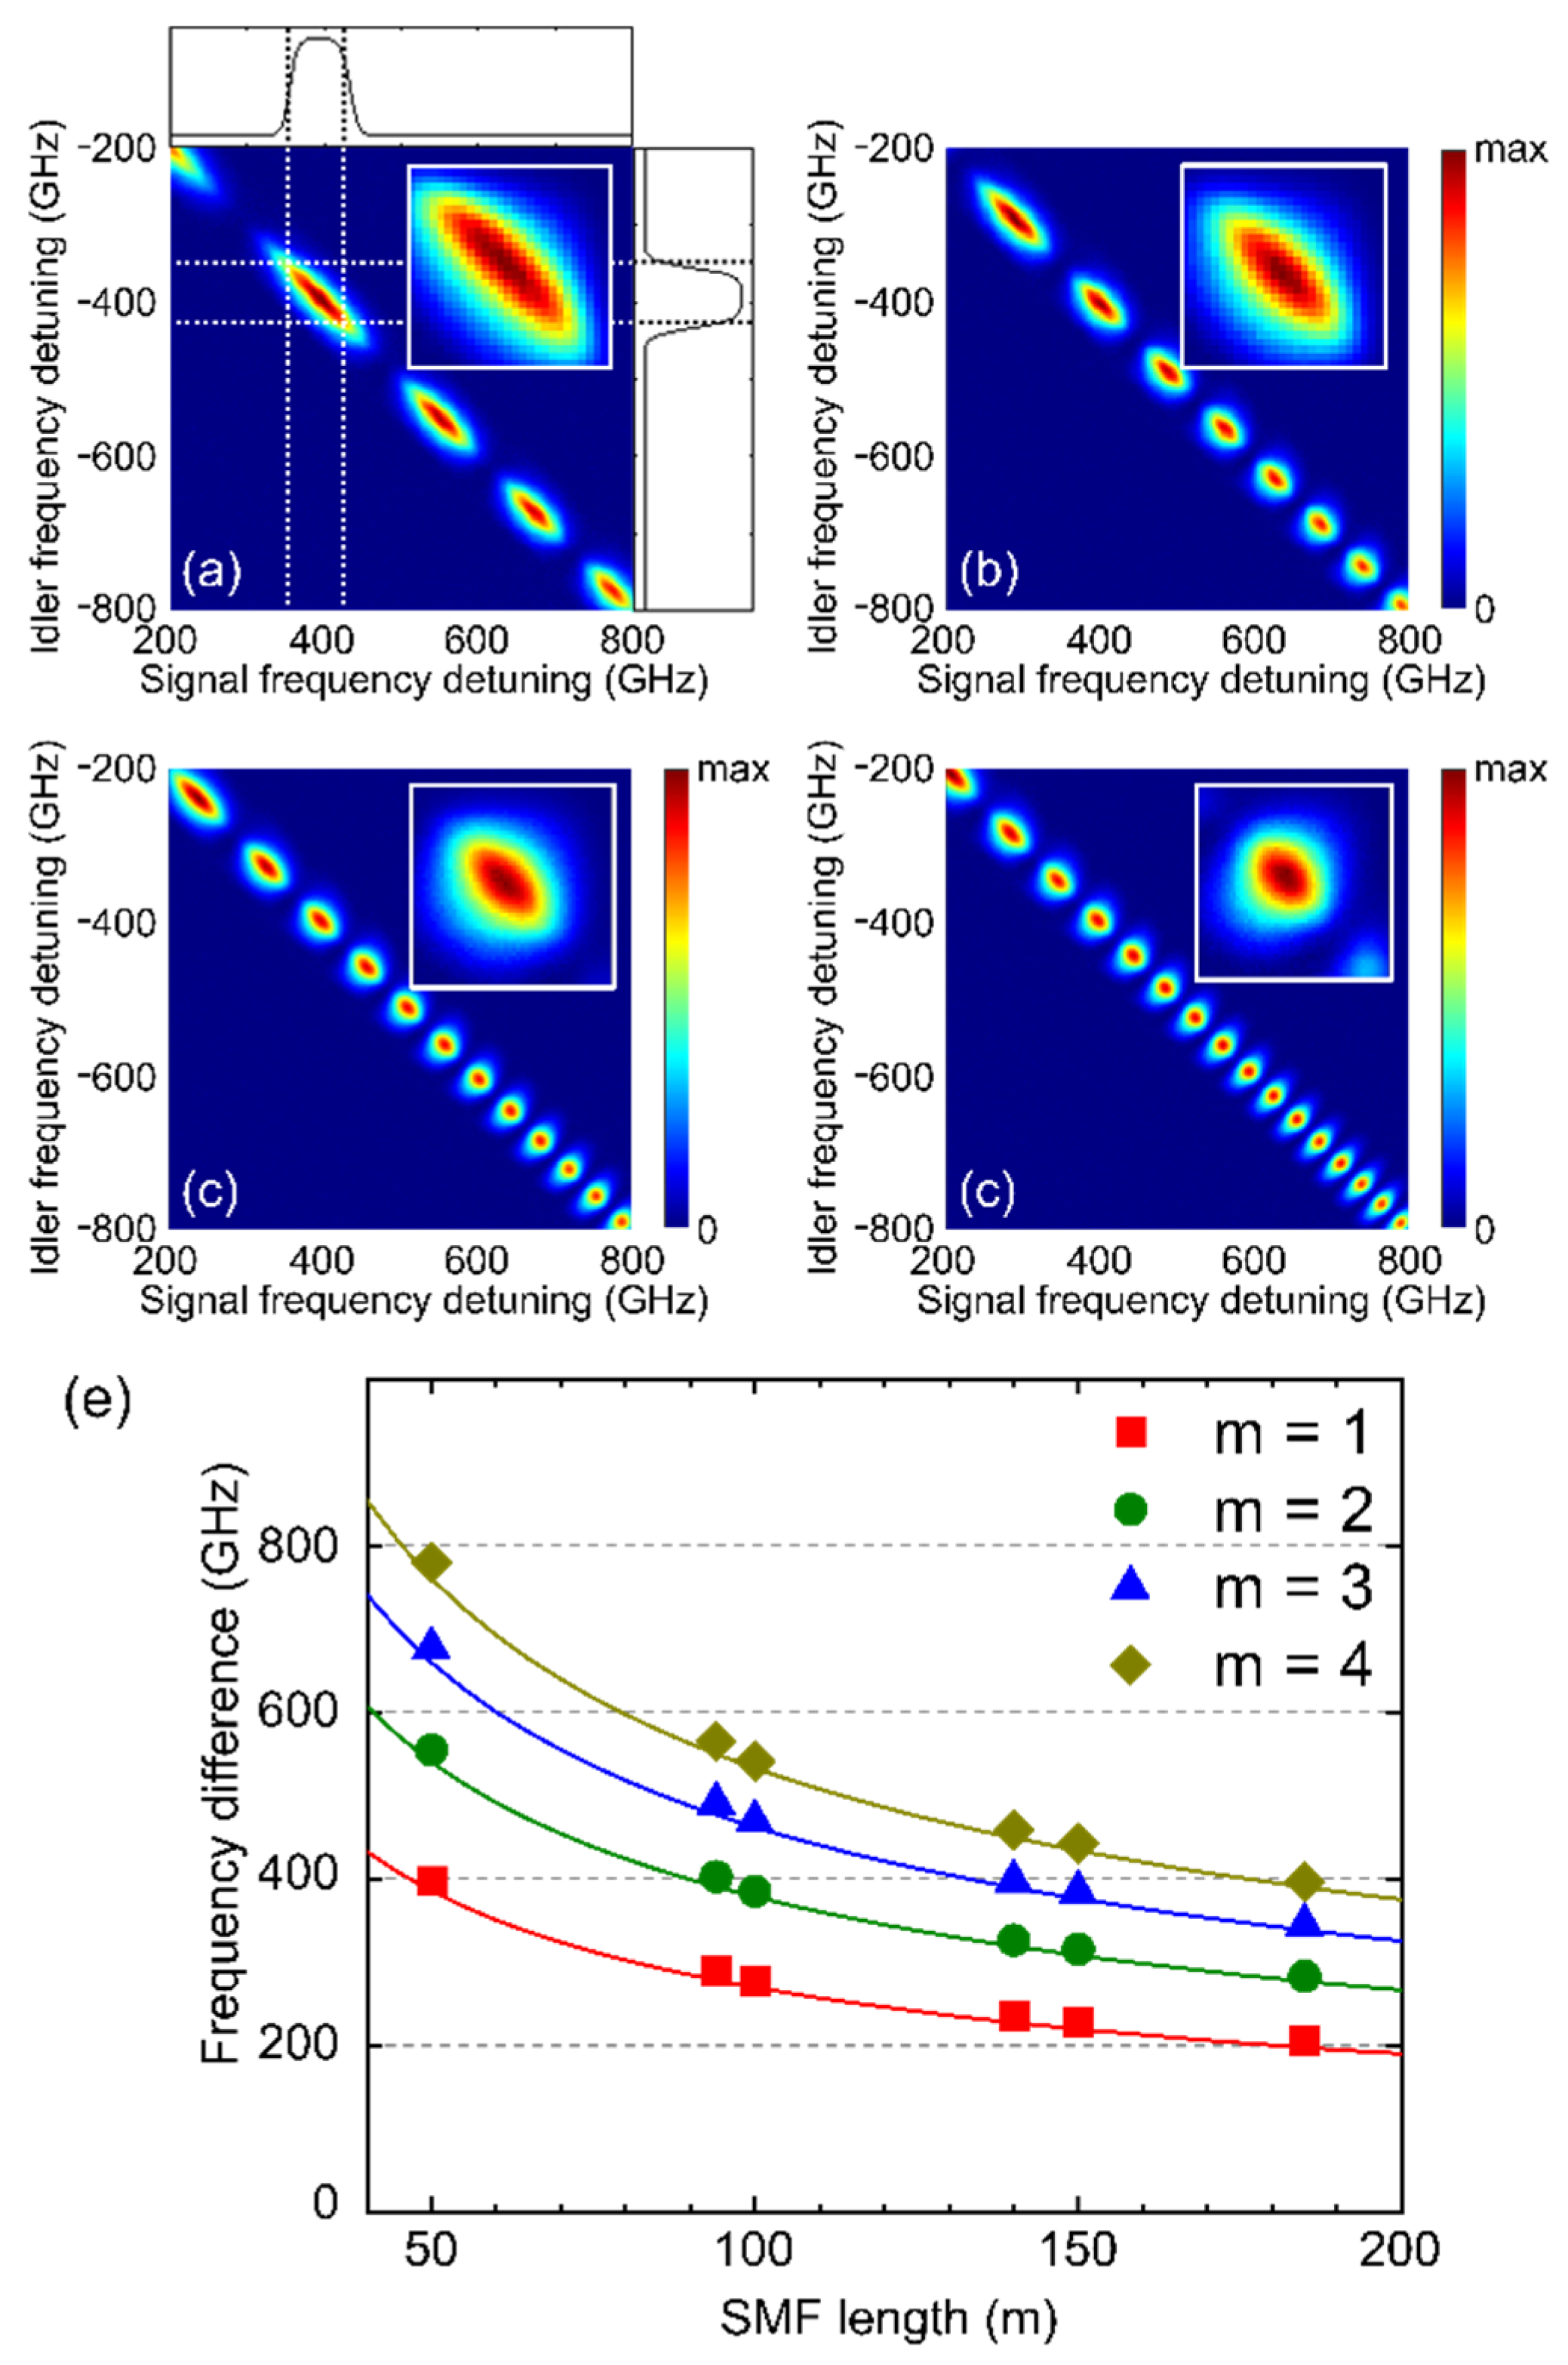
3.2. Length of Nonlinear Pair Generation Medium

Second, we test the effect of the DSF length on the NLI patterns. In references [18,19,20], the authors assume that the wave vector mismatch goes to zero to ensure the satisfaction of the phase matching conditions. This study, however, considers the case where the wave vector mismatch is small but not negligible. In this case, we expect fine changes in NLI with varying the DSF length.
The NLI system in this test consists of two equal-length DSF sections of various lengths and a 50-m SMF section located between two DSF sections, and λ p is fixed at 1550.92 nm. Figure 3a–c show the measured JSIs for various DSF lengths ( L DSF ), and Figure 3d is the normalized diagonal JSI spectra for various DSF lengths against the frequency detuning from the pump frequency. As seen in Figure 3d, the peak frequency gets away from the pump frequency as L DSF becomes longer. Figure 3e is the difference between the pump center frequency and the peak frequency of the first, second, and third islands (m = 1, 2, and 3, respectively) against the DSF length. The frequency shift rates with increasing L D S F are approximately 0.11322 GHz/m, 0.11953 GHz/m, and 0.14266 GHz/m for m = 1, 2, and 3, respectively. The lines are the theoretical predictions using the identical parameters as in Section 3.1 except the DSF lengths and the pump wavelength. The frequency difference slowly grows as increasing L D S F if we consider the phase shift induced in DSF ( Δ k DSF L DSF ) (solid lines in Figure 3e), meanwhile, the difference is constant if we neglect the DSF phase shift (dashed lines). The measured results match well with the theoretical predictions with the phase shift in DSF. This slow frequency shift may induce the fine-tuning ability of the center frequency of islands.
In addition, Figure 3d shows the envelope changes of the pair-generation spectrum for different DSF lengths. It is known that the pair-generation rate is proportional to the square of the SFWM medium length. Recently, we investigate the length dependence of the pair-generation bandwidth, showing that the longer the SFWM length is, the narrower the spectrum bandwidth is [21]. Therefore, a long DSF nonlinear medium can have a large maximum generation rate but a rapidly degraded generation rate at a frequency away from the pump frequency, as seen in Figure 3d. We should carefully select the DSF length for balancing both the bandwidth and pair-generation rate even though the L DSF is the selectable parameter for the fine-tuning of peak frequency.

3.3. Length of Linear Dispersive Medium

The change of L SMF causes dramatic effects on the NLI patterns. In this test, λ p is fixed (1550.92 nm), and L DSF is 100 m. Figure 4a–d show the measured JSI for various SMF lengths. The spectra right and above the JSI in Figure 4a indicate the transmittance spectra of idler and signal filters, respectively. The filter type used in this study is the DWDM filters whose center frequencies are detuned by 400 GHz from the pump frequency, and its 3-dB bandwidth is about 0.6 nm (~75 GHz). Insets in Figure 4a–d show the JSI islands after passing through the signal/idler filters for m = 1, 2, 3, and 4, respectively. Note that the m = 0 islands in Figure 4b–d is not shown as the m = 0 islands end before 200 GHz. Figure 4e shows the differences between the pump center frequency and the peak frequency for m = 1, 2, 3, and 4 islands against the SMF length. The maximum island frequency gets closer as the SMF length becomes longer. The solid curved lines are the theoretical predictions using the identical parameters as in Section 3.1 except the DSF lengths and SMF lengths with the phase shift induced in DSF. The frequency difference decreases rapidly as increasing L SMF . The measured results match well with the theoretical predictions. This fast frequency shift yields the coarse-tuning ability of the center frequency of islands.
The maximum island frequency can be centered at the center of the 100-GHz DWDM filter frequency detuned by 400 GHz from the pump frequency if the condition, Δ k DSF L DSF + Δ k SMF L SMF = 2 m π , can be satisfied [18]. The first, second, third, and fourth islands can be within the signal/idler filter transmittance bandwidth if the SMF length is about 50 m, 90 m, 135 m, and 180 m, respectively. The m = 1 island in Figure 4a is elongated diagonally. The JSI bandwidth is wider than the filter bandwidth so that the brightness and collection efficiency, i.e., heralding efficiency, will be degraded. The m = 4 island in Figure 4d, however, is almost round, indicating high spectral purity. The spectral purity (P) can be extracted from the measured data using the Schmidt decomposition method [22]. The extracted p values from the data are p = 0.74, 0.85, 0.95, and 0.91 for inset of (a), (b), (c), and (d), respectively. Therefore, we could obtain the photon pairs with high spectral purity by choosing the proper length of SMF.

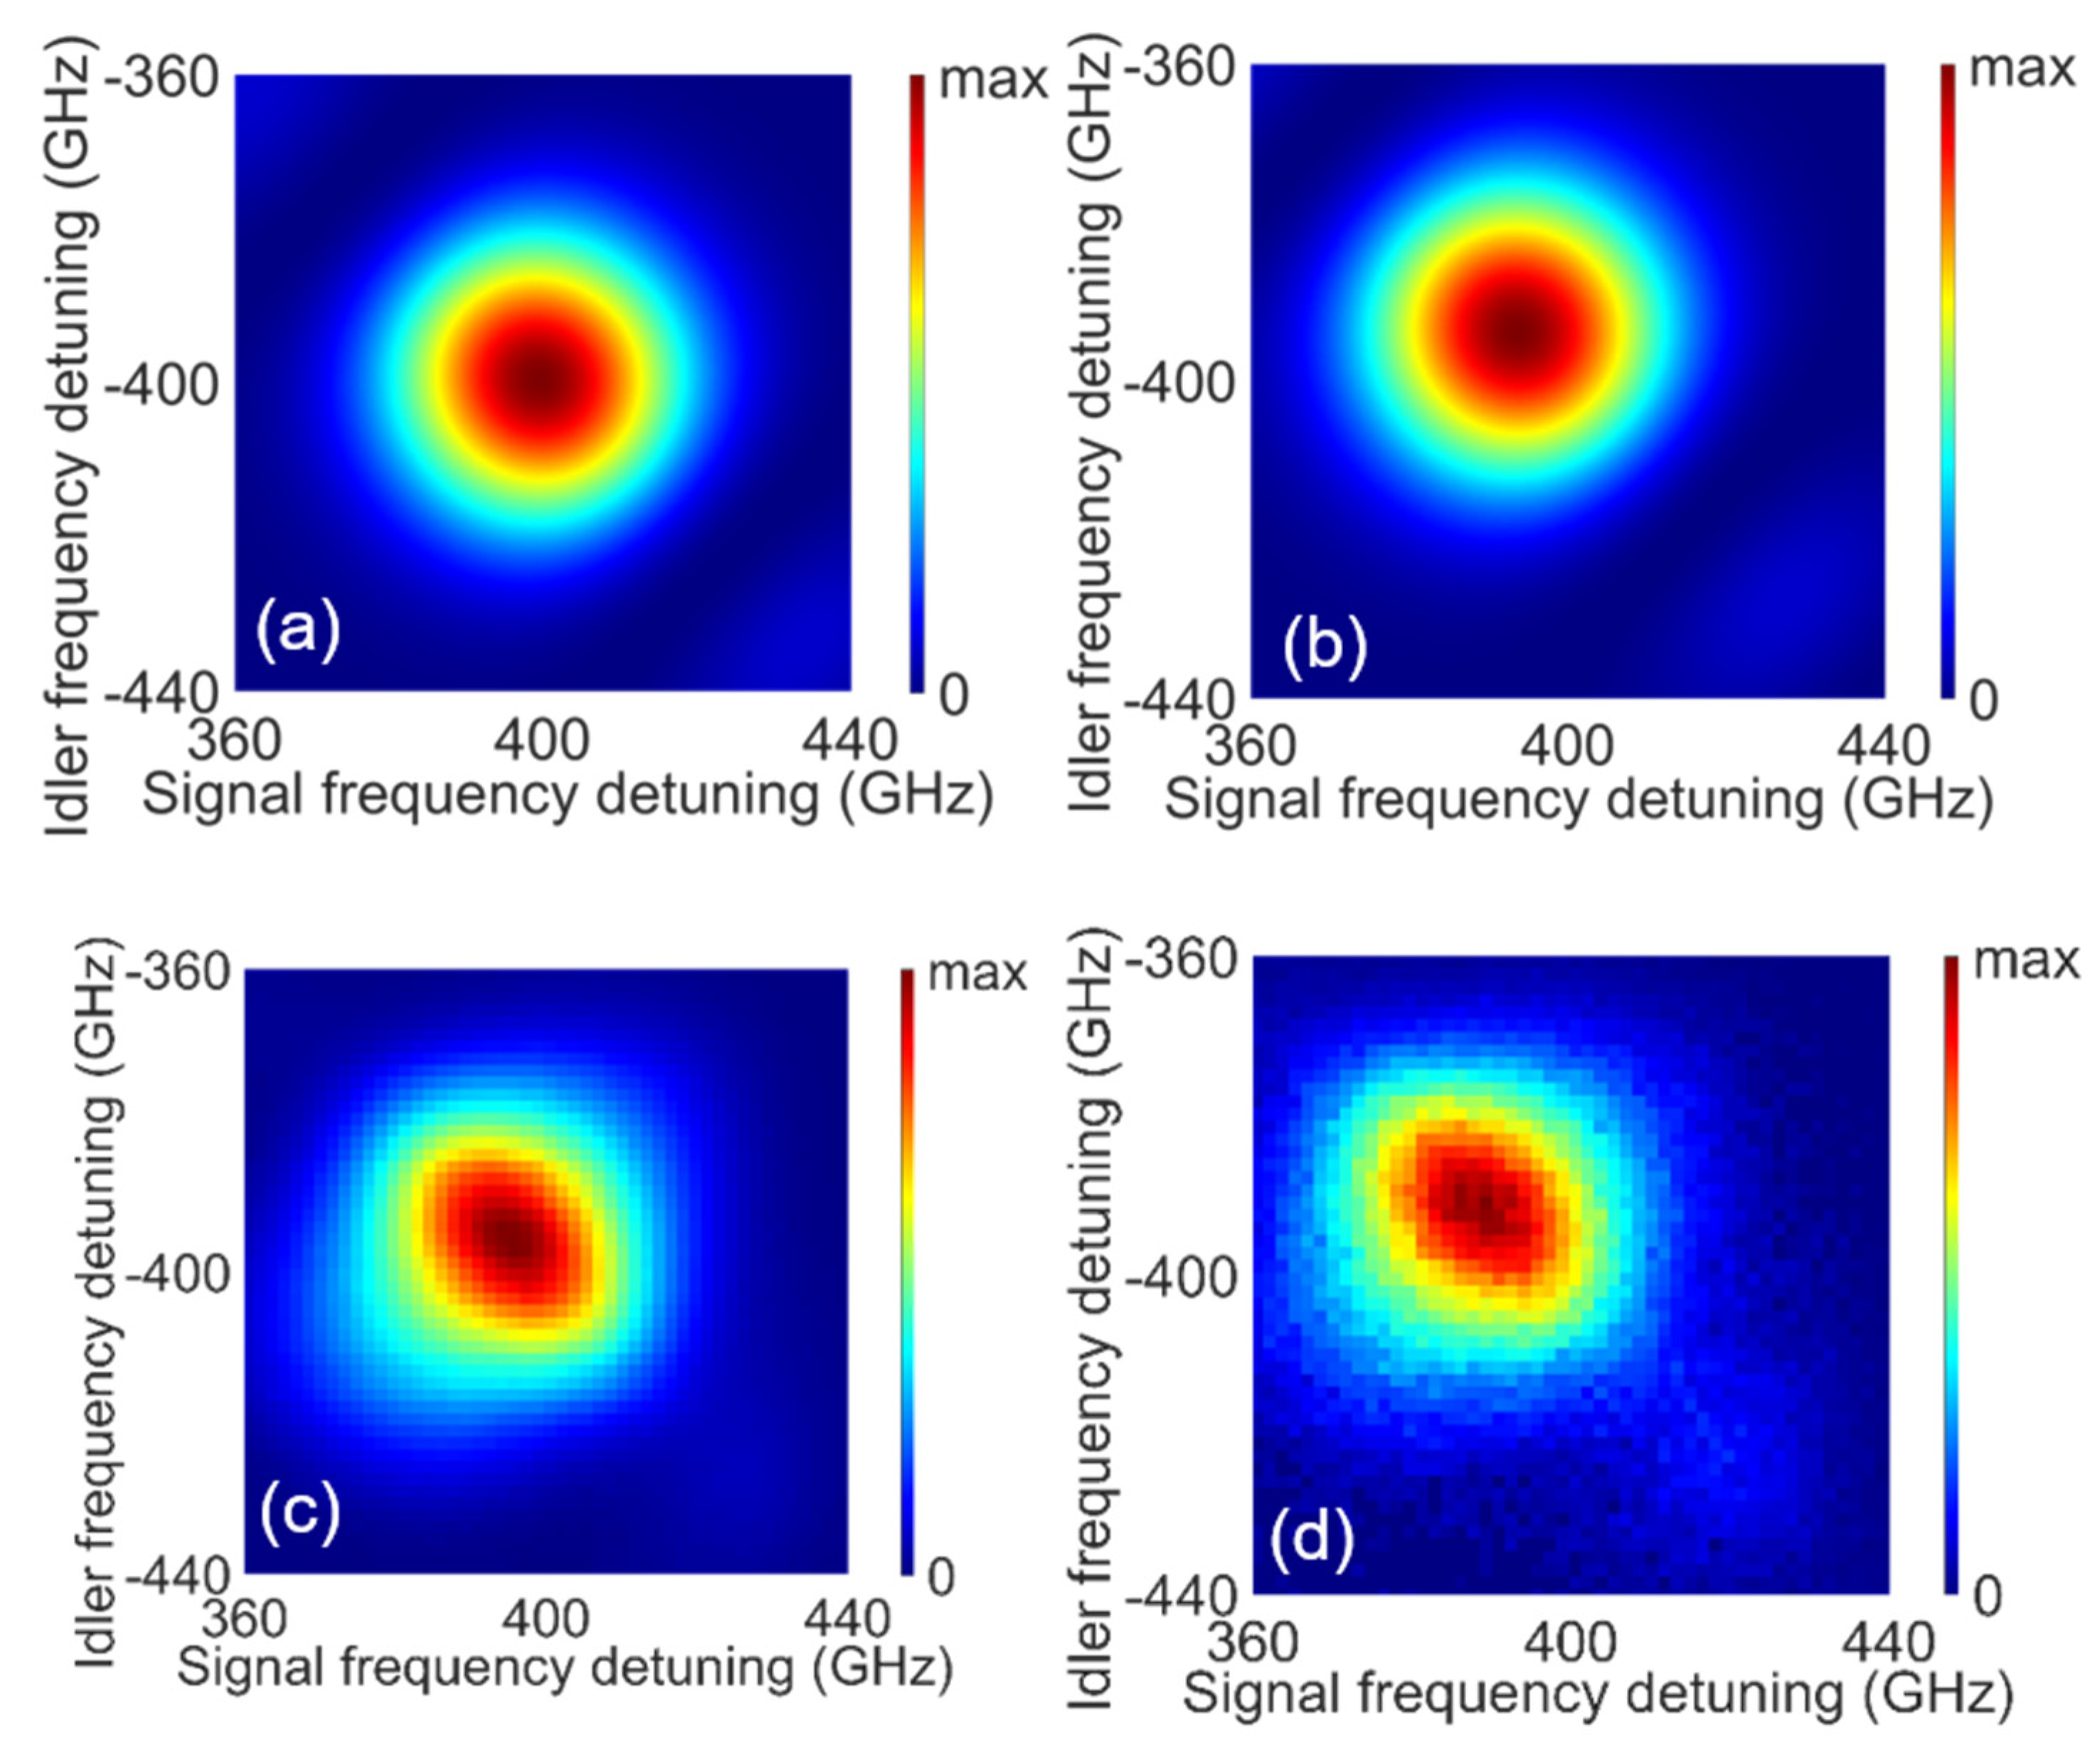
3.4. Number of Stages

The change in the number of NLI stages (N) has been demonstrated in reference 18 (N = 2) and 19 (N = 3) under different NLI conditions, such as the DSF and SMF lengths. Here, we increase the stage number under identical NLI conditions and measure the JSI spectrum and its bandwidth. As seen in Figure 5a–d, varying the stage number does not change the maximum island frequency but the FWHM bandwidth of islands. λ p is fixed at 1550.92 nm, L DSF is 100 m, and L SMF is 94 m. This condition makes the second island away from the pump frequency by 400 GHz, as seen in Figure 4b. Figure 5a–d are the measured JSI for various Ns. Insets show the JSI filtered by the signal/idler filters. Note that the second island is anchored at the center of the signal and idler DWDM filters even if we change the stage number from N = 2 to N = 5.
Figure 5e is the normalized diagonal JSI spectra for various stage numbers against the frequency detuning from the pump frequency. The black dashed line indicates the signal filter spectrum, and the m = 2 island is centered on the filter spectrum. The normalized diagonal JSI spectra in Figure 5e show that the bandwidth of each island gets narrower as the stage number increases, but the peak frequency is stationary. Figure 5f shows the FWHM bandwidth of each island against the stage number. The curved lines are the theoretical predictions with considering the DSF phase shift. The FWHM bandwidth decreases as the stage number increases. The measured data matches well with the theoretical predictions except for the N = 5 case. We believe that the non-uniformity of the DSF sections causes this discrepancy, but further study is necessary. The measured p values are 0.82, 0.96 0.98, and 0.97 for N = 2, 3, 4, and 5, respectively. Therefore, we could obtain the photon pairs with high spectral purity by adding the proper NLI stages.

3.5. Cooling

Finally, we test the temperature effects on the NLI method with the NLI system of N = 4 in Section 3.4. Since the silica material of optical fibers can generate noise photons by the Spontaneous Raman Scattering (SpRS) process, the SFWM photon generation medium needs cooling to suppress SpRS. The lower the temperature, the less SpRS occurs [25,26], but cooling the fiber system down to liquid nitrogen temperature is the best cost-effective way. When the optical fiber is cooled down, some properties of optical fibers, such as the zero GVD wavelength, are changed. For the DSF case, λ 0 , DSF is changed by −4 nm at liquid nitrogen temperature [26], and we assume that λ 0 , SMF also shifts by −4 nm as the DSF and SMF are made of silica. The dispersion slopes of DSF and SMF are not changed. Figure 6a,b are the theoretical predictions of the JSI at the signal/idler filter frequencies detuned by 400 GHz from the pump frequency, and (c), (d) are the measured JSI. Figure 6a,c are the cases at room temperature with λ p = 1550.92 nm. The peak center is placed at around 399.5 GHz in the simulation results and 396 GHz in the experimental results. This peak center shifts if we cool down the temperature to liquid nitrogen temperature. λ 0 , DSF and λ 0 , SMF are changed from 1555.5 nm to 1551.5 nm and from 1314 nm to 1310 nm, respectively, without changing the dispersion slope. As seen in Figure 6b,d, the peak center shifts to around 393.5 GHz (−6 GHz changed) in the simulation and 390.5 GHz (−5.5 GHz) in the experiment, respectively. As the shifted island due to cooling is within the signal/idler filter bandwidth and the shape of JSI is almost identical, the spectral purities in the simulation and experiment have almost no change.

4. Conclusions

Here, we investigate the coarse and fine tunability and cooling effect of the nonlinear interferometer method. The constructive interference islands are controllable by changing the properties of the nonlinear pair generation medium and linear dispersive medium, such as Δ k DSF , Δ k SMF , L DSF , L SMF , and the number of stages (N). We succeed in adjusting the peak frequency of constructive interference patterns into a transmission window of commercial 100-GHz DWDM filters. As demonstrated in reference 18, 19, and 20, the dominant parameter is L SMF . The peak frequency of a constructive interference island can be coarsely placed near a target wavelength by adjusting the length of SMF. In addition, the pump wavelength and length of DSF can be used for fine-tuning. To match the peak frequency with a DWDM filter center frequency, we should consider the phase shift induced in DSF ( Δ k DSF L DSF ). The selection of L DSF should be carefully considered as not only the peak frequency but also the pair-generation rate and pair-generation spectral bandwidth are also related to L DSF .
Finally, we achieved high spectral purity by selecting an appropriate number of stages (N) and interference mode number (m). The demonstrated methods show the coarse- and fine-tuning ability to match the peak frequency of a constructive interference island and the center frequency of a commercial filter while maintaining high spectral purity. We think that the demonstrated methods in this study expand the usefulness of the NLI method. The generated photon pairs with the engineered quantum state can be an excellent practical source of quantum information processing involving quantum interference.

Author Contributions

Conceptualization, K.P. and H.S.; measurement, K.P.; calculation, D.L.; validation, K.P., D.L. and H.S.; formal analysis, K.P., D.L., and H.S.; writing—original draft preparation, K.P.; writing—review and editing, K.P., D.L. and H.S.; supervision, H.S.; All authors have read and agreed to the published version of the manuscript.

Funding

This research was funded by National Research Foundation of Korea, NRF-2019M3E4A1079780; Korea Institute of Science and Technology’s Open Research Program, 2E30620-20-052; Institute for Information & communications Technology Promotion (IITP), No. 2020-0-00947; Affiliated Institute of Electronics and Telecommunications Research Institute (ETRI), 2020-080.

Institutional Review Board Statement

Not applicable.

Informed Consent Statement

Not applicable.

Data Availability Statement

The data presented in this study are available on request from the corresponding author.

Conflicts of Interest

The authors declare no conflict of interest.

References

  1. Bouwmeester, D.; Pan, J.; Klaus, M.; Manfred, E.; Harald, W.; Anton, Z. Experimental quantum teleportation. Nature 1997, 403, 575–579. [Google Scholar] [CrossRef] [Green Version]
  2. Knill, E.; Laflamme, R.; Milburn, G.J. A scheme for efficient quantum computation with linear optics. Nature 2001, 409, 46–52. [Google Scholar] [CrossRef]
  3. Hong, C.; Mandel, L. Experimental realization of a localized one-photon state. Phys. Rev. Lett. 1986, 56, 58–60. [Google Scholar] [CrossRef]
  4. Grice, W.P.; Walmsley, I.A. Spectral information and distinguishability in type-II down-conversion with a broadband pump. Phys. Rev. A 1997, 56, 1627. [Google Scholar] [CrossRef] [Green Version]
  5. Grice, W.P.; U’Ren, A.B.; Walmsley, I.A. Eliminating frequency and space-time correlations in multiphoton states. Phys. Rev. A 2001, 64, 063815. [Google Scholar] [CrossRef] [Green Version]
  6. Ou, Z.Y.; Rhee, J.K.; Wang, L.J. Photon bunching and multiphoton interference in parametric down-conversion. Phys. Rev. A 1999, 60, 593. [Google Scholar] [CrossRef]
  7. Brańczyk, A.M.; Ralph, T.C.; Helwig, W.; Silberhorn, C. Optimized generation of heralded Fock states using parametric down-conversion. New J. Phys. 2010, 12, 063001. [Google Scholar] [CrossRef]
  8. Garay-Palmett, K.; McGuinness, H.J.; Cohen, O.; Lundeen, J.S.; Rangel-Rojo, R.; U’Ren, A.B.; Raymer, M.G.; McKinstrie, C.J.; Radic, S.; Walmsley, I.A. Photon pair-state preparation with tailored spectral properties by spontaneous four-wave mixing in photonic-crystal fiber. Opt. Express 2007, 15, 14870–14886. [Google Scholar] [CrossRef] [PubMed] [Green Version]
  9. Mosley, P.J.; Lundeen, J.S.; Smith, B.J.; Wasylczyk, P.; U’Ren, A.B.; Silberhorn, C.; Walmsley, I.A. Heralded generation of ultrafast single photons in pure quantum states. Phys. Rev. Lett. 2008, 100, 133601. [Google Scholar] [CrossRef] [Green Version]
  10. Brańczyk, A.M.; Fedrizzi, A.; Stace, T.M.; Ralph, T.C.; White, A.G. Engineered optical nonlinearity for quantum light sources. Opt. Express 2011, 19, 55–65. [Google Scholar] [CrossRef] [Green Version]
  11. Dosseva, A.; Cincio, Ł.; Brańczyk, A.M. Shaping the joint spectrum of down-converted photons through optimized custom poling. Phys. Rev. A 2016, 93, 013801. [Google Scholar] [CrossRef] [Green Version]
  12. Chen, C.; Bo, C.; Niu, M.Y.; Xu, F.; Zhang, Z.; Shapiro, J.H.; Wong, F.N.C. Efficient generation and characterization of spectrally factorable biphotons. Opt. Express 2017, 25, 7300–7312. [Google Scholar] [CrossRef] [Green Version]
  13. Halder, M.; Fulconis, J.; Cemlyn, C.; Clark, A.; Xiong, C.; Wadsworth, W.J.; Rarity, J.G. Nonclassical 2-photon interference with separate intrinsically narrowband fibre sources. Opt. Express 2009, 17, 4670–4676. [Google Scholar] [CrossRef] [Green Version]
  14. Cohen, O.; Lundeen, J.S.; Smith, B.J.; Puentes, G.; Mosley, P.J.; Walmsley, I.A. Tailored photon-pair generation in optical fibers. Phys. Rev. Lett. 2009, 102, 123603. [Google Scholar] [CrossRef] [Green Version]
  15. Smith, B.J.; Mahou, P.; Cohen, O.; Lundeen, J.S.; Walmsley, I.A. Photon pair generation in birefringent optical fibers. Opt. Express 2009, 17, 23589–23602. [Google Scholar] [CrossRef]
  16. Cui, L.; Li, X.; Zhao, N. Minimizing the frequency correlation of photon pairs in photonic crystal fibers. New J. Phys. 2012, 14, 123001. [Google Scholar] [CrossRef] [Green Version]
  17. Fang, B.; Cohen, O.; Moreno, J.B.; Lorenz, V.O. State engineering of photon pairs produced through dual-pump spontaneous four-wave mixing. Opt. Express 2013, 21, 2707–2717. [Google Scholar] [CrossRef] [PubMed]
  18. Cui, L.; Su, J.; Li, J.; Liu, Y.; Li, X.; Ou, Z.Y. Quantum state engineering by nonlinear quantum interference. Phys. Rev. A 2020, 102, 033718. [Google Scholar] [CrossRef]
  19. Su, J.; Cui, L.; Li, J.; Liu, Y.; Li, X.; Ou, Z.Y. Versatile and precise quantum state engineering by using nonlinear interferometers. Opt. Express 2019, 27, 20479–20492. [Google Scholar] [CrossRef] [PubMed]
  20. Li, J.; Su, J.; Cui, L.; Xie, T.; Ou, Z.Y.; Li, X. Generation of pure-state single photons with high heralding efficiency by using a three-stage nonlinear interferometer. Appl. Phy. Lett. 2020, 116, 204002. [Google Scholar] [CrossRef]
  21. Park, K.; Lee, D.; Boyd, R.W.; Shin, H. Telecom C-band Photon-Pair Generation using Standard SMF-28 Fiber. Opt. Commun. 2021, 484, 126692. [Google Scholar] [CrossRef]
  22. Zielnicki, K.; Garay-Palmett, K.; Cruz-Delgado, D.; Cruz-Ramirez, H.; O’Boyle, M.F.; Fang, B.; Lorenz, V.O.; U’Ren, A.B.; Kwiat, P.G. Joint spectral characterization of photon-pair sources. J. Mod. Opt. 2018, 65, 1141–1160. [Google Scholar] [CrossRef] [Green Version]
  23. Berkovic, G.; Shafir, E. Optical methods for distance and displacement measurements. Adv. Opt. Photonics 2012, 4, 441–471. [Google Scholar] [CrossRef]
  24. Park, K.; Lee, D.; Ihn, Y.S.; Kim, Y.-H.; Shin, H. Observation of photon-pair generation in the normal group-velocity-dispersion regime with slight detuning from the pump wavelength. New J. Phys. 2018, 20, 103004. [Google Scholar] [CrossRef]
  25. Takesue, H.; Inoue, K. 1.5-μm band quantum-correlated photon pair generation in dispersion-shifted fiber: Suppression of noise photons by cooling fiber. Opt. Express 2005, 13, 7832. [Google Scholar] [CrossRef] [PubMed]
  26. Dyer, S.D.; Stevens, M.J.; Baek, B.; Nam, S.W. High-efficiency, ultra low-noise all-fiber photon-pair source. Opt. Express 2008, 16, 9966–9977. [Google Scholar] [CrossRef]
Figure 1. Experimental setup for stimulated-emission-based joint spectral intensity measurement. PUMP: A 15-ps pulse laser with a repetition rate of 18 MHz, PROBE: CW laser for seed and its wavelength is swept during measurement, PC: polarization controller, C: 200 GHz DWDM filter for pump and seed combining, NLI: nonlinear interferometer sample, ILP: in-line polarizer, F: 200 GHz DWDM filter for pump filtering, PM: power meter for pump power monitoring, OSA: optical spectrum analyzer for measuring seed power and generated signal spectrum.
Applsci 11 01429 g001
Figure 2. The measured joint spectral intensity (JSI) for various pump wavelengths, (a) 1550.92 nm, (b) 1555.75 nm, and (c) 1560.61 nm. (d) The plot of the diagonal line (white dotted line in (a)). (e) Peak frequency against the pump wavelength for m = 1, 2, and 3. Lines are theoretical predictions extracted from the calculated JSI by using Equation (1).
Applsci 11 01429 g002
Figure 3. The measured JSI for various dispersion-shifted fiber (DSF) lengths, (a) 100 m, (b) 150 m, and (c) 200 m. (d) The plot of the diagonal lines. Dotted lines are measured single stage ( N = 1 , non-interference) JSI case with same length. (e) Peak frequency against the DSF length for m = 1, 2, and 3. Lines are theoretical predictions extracted from the calculated JSI by using Equation (1) with (solid lines) and without (dashed lines) the phase shift induced in DSF ( Δ k DSF L DSF ).
Applsci 11 01429 g003
Figure 4. The measured JSI for various SMF lengths, (a) 50 m, (b) 94 m, (c) 140 m, and (d) 185 m. Spectra right side and above JSI in (a) are signal/idler filters (100-GHz DWDM filter (3dB-bandwidth ~ 80 GHz)). Inset in each JSI indicates the filtered JSI after the signal/idler filters within filter bandwidth. (e) Frequency difference against the SMF length for m = 1, 2, 3, and 4. Lines are theoretical predictions extracted from the calculated JSI by using Equation (1).
Applsci 11 01429 g004
Figure 5. The measured JSI for various number of stage (i.e., number of DSF sample): (a) 2, (b) 3, (c) 4, and (d) 5. Inset indicates JSI after signal/idler filter which is 400-GHz detuned 100-GHz DWDM filter (3dB-bandwidth ~ 80 GHz)). (e) The plot of the diagonal line. The black dashed line indicates signal/idler filter (flat-top spectral shape). (f) Full-Width at Half-Maximum (FWHM) bandwidth of each peak against the number of stages. Lines are theoretical predictions extracted from the calculated JSI by using Equation (1).
Applsci 11 01429 g005
Figure 6. The calculated (a,b) and measured (c,d) JSIs at (a,c) room temperature and (b,d) liquid nitrogen cooled with λ p = 1550.92   nm . The calculation of cooling condition is carried out with the assumption that λ 0 of DSF and SMF are shifted −4 nm and dispersion slopes are not changed. The x- and y-axes are shown ± 40   GHz from filter center which is equivalent to the 3-dB bandwidth of signal/idler filter.
Applsci 11 01429 g006
Publisher’s Note: MDPI stays neutral with regard to jurisdictional claims in published maps and institutional affiliations.

