Abstract
In recent years, Wireless Acoustic Sensor Networks (WASN) have been widely applied to different acoustic fields in outdoor and indoor environments. Most of these applications are oriented to locate or identify sources and measure specific features of the environment involved. In this paper, we study the application of a WASN for room acoustic measurements. To evaluate the acoustic characteristics, a set of Raspberry Pi 3 (RPi) has been used. One is used to play different acoustic signals and four are used to record at different points in the room simultaneously. The signals are sent wirelessly to a computer connected to a server, where using MATLAB we calculate both the impulse response (IR), and different acoustic parameters, such as the Speech Intelligibility Index (SII). In this way, the evaluation of room acoustic parameters with asynchronous IR measurements two different applications has been explored. Finally, the network features have been evaluated to assess the effectiveness of this system.
1. Introduction
Since Wallace Clement Sabine [1] published his research on reverberation in room acoustics, many researchers have devoted much effort to measuring acoustic behavior in indoor environments. The measurement procedure was standardized in ISO 3382 [2,3,4], and since then several revisions have been made. This standard makes some recommendations on different aspects related to the measurement procedure (e.g., exciting signal used, number of measurements, etc.), but also leaves some non-mandatory aspects to allow innovation. It also opens the possibility of evaluating other parameters related to the amount of energy from the impulse response in every receiver location.
Wireless Acoustic Sensor Networks (WASN) have allowed some technical automation of the measurement procedure following specific recommendations and following the ISO standard. Further research is needed to improve the measurement procedures by addressing different signal processing techniques [5,6,7,8,9] and the measurement protocols. Using WASN technology we gather the acoustic information of the whole room in one single shot from the sound source using a series of sensors distributed in the room.
In recent years, WASN has been widely applied to different acoustic fields in indoor and outdoor environments. Most of these applications are aimed at locating one or several sources [10,11], tracking [12] or identifying them [13], and measuring specific characteristics of the environment involved [14]. In [15], the authors use a WASN simulation to estimate the room acoustic performance, using localized and averaged Room Impulse Response (RIRs), and adapt the multipoint equalization of a sound system, to render the sound considering the inversion of the room acoustic model, and applied as a pre-filter to the “dry” signal before playback.
Most parameters used for acoustic analysis of rooms such as Reverberation Time 30 (TR30), TR60 and Clarity 80 and most of the parameters used for speech transmission analysis such as Speech Transmission Index (STI), Clarity 50 and Speech Intelligibility Index (SII) [16] make us think of traditional spaces such as theaters, cinemas, music schools or music production rooms. However, it is interesting and very relevant to make use of such parameters in rooms dedicated to other purposes where the transmission of the word is vital, such as teaching spaces or those dedicated to medical care, to assess their behavior and suitability [17,18,19] of speech transmission.
The afore mentioned parameters are calculated based on the impulse response of the room with the only exception of the SII [20], which is extracted from a speech signal recorded in the position of the room where we wish to analyze intelligibility. The calculation of parameters based on impulse response is much more complex than SII, so it is not possible to do it in a simple, fast or effective way in a node of our WASN, as it happens for example with the parameters of psychoacoustic disturbance [21]. In fact, we proposed to implement a convolutional neuronal network (CNN) that would allow us to successfully predict them, just as we did with the parameters of psychoacoustic disturbance [21]. Psychoacoustic annoyance quantifies how disturbing different sounds can be to humans. For this purpose, different psychoacoustic parameters (Loudness, Sharpness, Roughness and Fluctuation Strength) are calculated and used to calculate an annoyance marker: Psychoacoustic Annoyance. In this previous work, we used a CNN to perform the prediction of these parameters in a fast and accurate way and to be able to perform the calculations in the node of a WASN itself.
The implementation of SII from a speech signal recorded in any room location we wish to analyze, makes it much easier the necessary signal processing and therefore the calculation capacity of the devices used. Taking into account the current pandemic times and the problems derived from the COVID-19 in the field of education, the adaptation of classrooms originally not intended for teaching has been considered a must to deal with the implementation of social distancing policies (see Figure 1). In this context, we found particularly interesting to be able to have a rapid measurement of speech intelligibility at different points in a room and to be able to act accordingly.
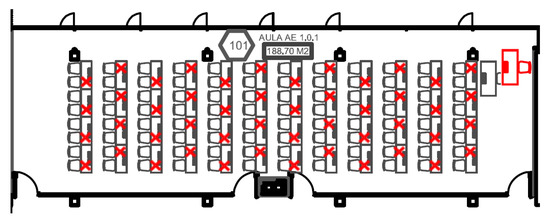
Figure 1.
Room schema as an example of social distancing and reduced capacity (red X locations are not occupied).
In this work, we present the design and implementation of a WASN system based on RPi, Portaudio library and MATLAB, to perform synchronous and asynchronous acoustic measurements mainly oriented to study the speech intelligibility in a room or SII parameter, as well as the early reflections in the room and the acoustic characteristics of the space.
Although SII can be computed asynchronously, because each node will give a value of SII, the other parameters have been recorded synchronously through the WiFi connection of the RPi. Although this synchronization is not too precise (due to the delays introduced by the network), it is good enough for the purpose of this analysis, which will allow us to have a general idea of the acoustic behavior of the room.
The paper is structured as follows. Section 1 focuses the problem and gives a slight focus on the related work discussing different approaches and establishing a framework for our proposal. Section 2 addresses the methodology and the materials used to measure the room parameters focused with the planned WASN. Section 3 describes the acoustical measurements performed in a lecture room at the ETSE of the University of Valencia with a discussion and finally, Section 4 gives some conclusion obtained from the deployment process.
2. Materials and Methods
To develop the aforementioned applications, we have used a WASN with 5 nodes based on the Raspberry Pi 3b (RPi) board, 4 for registration and one for emission, according to Figure 2. This platform is based on the Broadcom BCM2837 system on chip, which includes a 1.2 GHz quad-core ARM Cortex-A53 processor, with 512 KB of shared L2 cache, a VideoCore IV graphics processing unit (GPU) at 400 MHz clock frequency, with built-in WiFi (IEEE 802.11 b/g/n standard) and Bluetooth and 1 GB of LPDDR2 RAM at 900 MHz, with a micro-SD card memory. We installed in the measurement nodes an Andoer B01LCIGY8U-USB condenser microphone, with omnidirectional reception pattern, sensitivity = dB, SNR > 36 dB and linear frequency response between 20 Hz and 16 KHz.
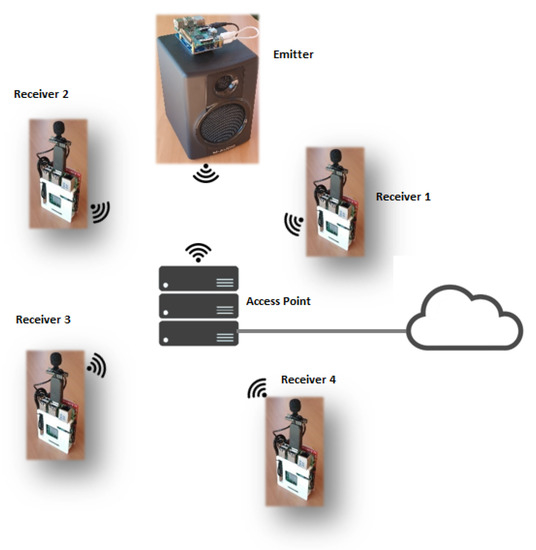
Figure 2.
Diagram of the IoT architecture for the room acoustics parameter measurement system.
The set configuration allows each node to be prepared to automatically acquire a configurable audio time with 16 bits per sample (allowing a dynamic range of dB) at a sampling frequency of 44.1 kHz. The RPi have been placed in protective structures, each with 3.7 V and 3800 mAh batteries. Measurements have provided us with results of approximately 10 h, more than enough time to perform the analysis, since it is done in minutes. It is very useful to have batteries, since in the case of SII, we can place the nodes in different positions and calculate intelligibility values in more than 4 locations, due to the fact that measurements do not have to be simultaneous. Thus, the sound picked up by the microphone of each node is used to calculate independently the acoustic parameters of the room (focusing on the SII), so it is not necessary in this case to make any data fusion.
Figure 3 shows the classroom prepared for measurement. As shown in Figure 2, the measurement system comprises the registration nodes and the broadcast nodes configured, with a NTP server configured to have the same time in all the nodes, from a central computer, which acts as a server. The synchronizing order is sent to the player node (with loudspeaker) to start playing the excitation signal and to the recorder nodes to start recording at the same time. In the case of playback, it is possible to play both a frequency sweep that will allow the extraction of the IR of the room and subsequent calculation of different parameters, and different speech signals, which will allow the direct calculation of the SII at the position of each node. Once the recording is finished, the audios are sent to the central equipment which is in charge of storing them along with the positions of each node and making the pertinent computations.
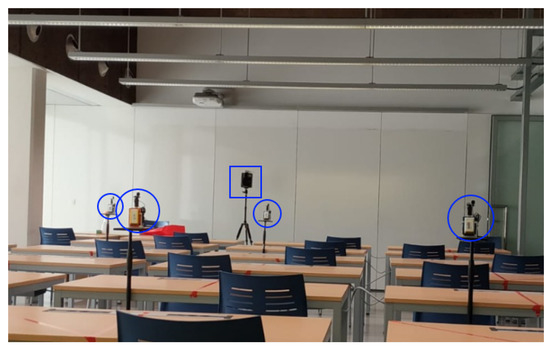
Figure 3.
Measurement of parameters in the classroom using the designed system. Detail of sound source location (square mark) and receiver nodes (circular mark).
Audios from 10 s to 1 min duration are used for frequency sweeps, but excellent results have been obtained for SII analysis with 10-s audios and even with 5-s audios of constant speech. The signals used to extract the average impulse response are frequency sweeps from 20 to 20 KHz of 5 and 10 s duration. The human speech signals have been previously recorded in an anechoic environment and belong to 6 professors of the department, 3 male and 3 female in order to have a diverse set of voices.
The software has been designed and tested initially with software simulations of classrooms and rooms of different geometries. Currently, the acquisition and calculation system is operational, and has been tested in different classrooms of the ETSE of the University of Valencia, taking advantage of their adaptation to the interpersonal distance required for teaching.
The parameters evaluated are shown in Table 1. We can calculate only one (SII) from a speech signal alone. Therefore, we will focus the presentation of results on this parameter. The study of SII can give us a clear idea of how the position of the source, distance, geometry and classroom materials affect the intelligibility of the word. Our system as a whole allows measurement of SII during a live class, without the need to interfere in it, only recording the speaker with the nodes located in the desired positions.

Table 1.
A set of room acoustic parameter, the source needed for computation and regulation if any.
SII Computation
The SII value ranges between 0 and 1, and it is highly correlated with speech intelligibility under adverse hearing conditions, such as auditory masking, filters, and reverberation [20]. The American National Standards Institute (ANSI) defined the standard SII to evaluate speech intelligibility in background noise. The measurement inputs are clean speech signal and noise, while the output is a scalar number that specifies the amount of speech intelligibility. A key component of the SII measure is the band importance function, which determines the contribution of each frequency band (e.g., the one-third octave bands) to speech intelligibility. This objective measure is based on the SNRs weighted, usually in the one-third octave bands. The SII measure is calculated by considering the SNR of each frequency band weighted according to its contribution to speech intelligibility. The SII has a bell-shaped band importance function, as we can see in Figure 4, with a value of 0.0083 for the one-third octave frequency band centered at 160 Hz, 0.0898 for the band centered at 2000 Hz, and 0.0185 for the band centered at 8000 Hz.
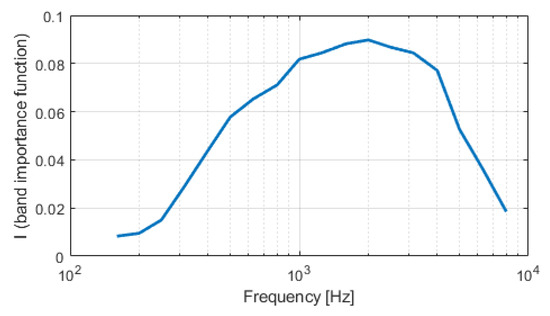
Figure 4.
Band Importance function values for average speech SII calculation.
The general formula for calculating the SII is:
where n is the number of individual frequency bands used for computing. Here, there is some flexibility in the definition of the SII standard [20] and it is possible to select the frequency measure bands (ranging from 6 [octave bandwidth] to 18 [critical bandwidth] bands). Generally speaking, the more frequency-specific your measures, the more accurate your computations. The values, also known as the band importance function (BIF), are related to the importance for each frequency band to speech understanding and are based on specific speech stimuli. When they are summed across all bands, they are 1. The standard also allows some flexibility in using the most appropriate BIF for each situation. Finally, the values, or band audibility function (BAF) -also ranging from 0 to 1-, indicate the proportion of speech cues that are audible in a given frequency band and its determination is based simply on the level of the speech, in a given frequency band, relative to the level of noise in that same band. For determining a dynamic range of speech of 30 dB is assumed. Using the basic formula for calculating , it is possible to subtract the spectrum level of noise from the spectrum level of the speech (in dB) in a given band, add 15 dB (the assumed speech peaks), and divide by 30. Resulting values greater than 1 or less than 0 are set to 1 and 0, respectively. This value essentially provides the proportion of the 30-dB dynamic range of speech that is audible to the listener.
Figure 5 provides a complete description of the SII algorithm based on ANSI standard [20], where the BIF are directly defined in the standard and the Equivalent Hearing Threshold levels are the ones used in an average normal audition pattern. This levels will modulate the BAF and combined with BIF, we obtain SII.
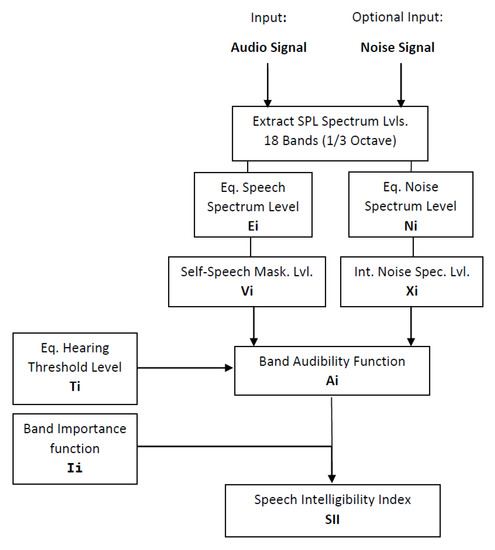
Figure 5.
Block diagrams of the SII calculation algorithm defined in ANSI S3.5-1997.
3. Results
The best synchronization that has been achieved with the system described in Figure 2 is 30us, so, although we record at 44.1 kHz our network recording system only allows reliable calculations up to a signal frequency of 16 kHz (as it is the nearest to Nyquist frequency with the synchronized signal), which is enough for the system we are concerned with applied to classrooms and speech, and that has allowed us to focus on SII. In fact, in SII, for example, the interesting thing is to analyze up to 8 kHz in 1/3 octave bands, which is the most precise thing described by the ANSI S3.5-1997 standard [20].
3.1. SII Evaluation
Focusing on SII, we have developed the algorithm following the norm ANSI S3.5-1997. We sampled at 44.1 KHz and from the total audible spectrum of 30 bands in 1/3 octave, we selected the 18 bands specified by the ANSI standard. These bands, as we can see in Figure 6, cover on the frequency content of the human voice and are between 160 and 8000 Hz. The results shown in this Figure describe two examples with high and low SII, taking into account the intelligibility scale from Table 2.
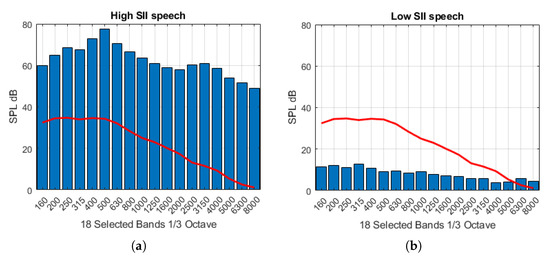
Figure 6.
18-band spectrum needed for SII computation for: (a) excellent intelligibility and (b) bad intelligibility. Equivalent hearing threshold levels for normal speech as the overlapping line (red).

Table 2.
Intelligibility scale according to SII parameter.
Figure 6a corresponds to a recording with SII around 0.79 and an excellent perception and Figure 6b shows the frequency bands of an audio corresponding to a room with SII around 0.48 and a bad intelligibility. Figure 6 also shows the Equivalent hearing threshold levels for normal speech used in the SII calculation. The lower the received audio SPL levels are below these levels, the worse will be the speech intelligibility.
As far as we can see in this figure, for the computation of SII, not only the Sound Pressure Levels (SPL) per band are important, but also their distribution in the spectrum, since each band is given a specific weight of importance according to the ANSI standard (the so-called “One-third octave frequency importance functions”).
3.2. Study of the Application of the SII Measurement System in a Room
Once the RT60, C50, C80 and STI parameters are determined in the evaluating room, we have applied the intelligibility analysis in different positions in a classroom to plot SII maps according to the position where the hearer is located and therefore, be able to estimate which locations have the worst perception for speech.
A representation system has been developed that reproduces in 2D and 3D the dimensions of the room to be treated, as well as the calculated values of SII for the indicated positions of each node. The system has been prepared to overprint a plan of the room if available to facilitate the analysis of the results.
Figure 7 shows two 3D models (out-of-scale) with a SII study in 2.1.1 and 1.0.1 classrooms at the ETSE of the University of Valencia. The dimensions of these rooms are 8 × 12 × 3 and 8 × 26 × 3 meters, respectively. In Figure 8, two heat-map-like (out-of-scale) representations of the SII can be seen, allowing us to graphically assess speaker distances and positions from which there may be intelligibility problems.
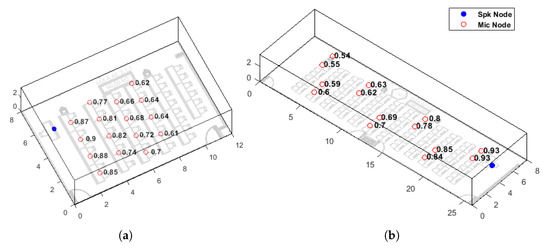
Figure 7.
3D models and SII measurement mappings in different rooms at the ETSE ((a). Classroom 2.1.1 and (b). Classroom 1.0.1). Marked positions of sound source node (blue dot) and receiver nodes (black circles).
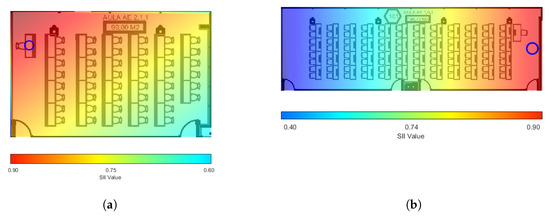
Figure 8.
Heat-maps of SII measurement mappings in different rooms at the ETSE ((a). Classroom 2.1.1 and (b). Classroom 1.0.1). Marked position of sound source node (blue cicle).
Since the SII measurements are asynchronous, we can place the 4 receiver nodes of our system in as many positions as we wish and take numerous samples of the intelligibility by executing the code multiple times. In Figure 7a, we can see the 16 positions where the measurements have been performed with the obtained SII values. On the other hand, in Figure 7b, we can see that 14 measurements have been taken, demonstrating the flexibility of the system when taking SII samples. In Figure 8, we can see 2 SII representations of the same classrooms (2.1.1 and 1.0.1) in the form of a heat-map, which allows a draft of the speech intelligibility in the room, at a glance. The more samples we take, the more accurately we will generate the heat-maps shown in Figure 8.
The values obtained represent accurately the perception of speech in the rooms studied. In the case of classroom 2.1.1, we have placed the node that simulates the speaker in the position of the teacher’s table, as we can see in Figure 7a and Figure 8a, since this is the most common place in this classroom. From the first rows with maximum SII values of 0.9 we see how the SII values decrease until the minimum of 0.61 in the last positions studied. The heat-map in Figure 8a helps us to see more easily how this drop in SII has a diagonal pattern from the speaker position to the opposite corner of the classroom.
The analysis of SII in classroom 1.0.1, shown in Figure 7b and Figure 8b, has been performed by placing the emitter node in a central position with respect to the transverse axis of the classroom, because in this classroom it is common for the speaker to be located in this area.
In Figure 7b we can see that the maximum values of SII are 0.93 while the minimum is 0.54. The values in the areas farther away from the speaker are now lower than in the previous case, a fact that is more easily observed in Figure 8b where darker shades of blue are visible in the background of the classroom. However, as class 1.0.1 is more than twice the size of class 2.1.1, SII would be even lower. We have found the explanation in the reverberation that reinforces the acoustic signals from the emitter and allows the SPL levels to not drop as much towards the end of the classroom as would be expected. Specifically, RT60 measured in classroom 2.1.1 is 0.58 s while RT60 in classroom 1.0.1 is 0.86 s, which explains the reinforcement of the acoustic signals towards the back of the room, due to reflections.
This representation is launched automatically as soon as the audios are received and the parameters are calculated, so you can put the system to record and automatically show the analysis and store it in a matter of seconds, which represents a saving in time and simplicity when evaluating rooms.
4. Conclusions
In this work has been designed, prototyped and deployed a IoT system for SII measurement, from the ANSI standard for acoustic assessment of rooms. At present, and due to the necessary social distance that has been implemented in schools, it is of particular interest to have a system such as the one designed to assess speech intelligibility in different spaces. It is true that there are systems on the market that offer similar analyses, at a very high price compared to the presented system, and with a technological complication also excessive for a first and quick analysis.
The complexity of the system has been reduced to a minimum so that the user does not have to worry about the technological part and only focuses on the positions he wants to analyze in each room. Likewise, to facilitate this task the nodes of our system are totally autonomous in terms of energy and communicate wirelessly, so it facilitates its deployment and location in any area. The designed system implements a data visualization in a clear, clean and fast way, since in a matter of seconds it allows graphical depiction of the measured results of SII allowing their evaluation by the user.
In addition, the system can store the desired data in a cloud server and be able to retrieve and display it at any time. Thanks to this, different speech intelligibility improvement techniques can be tested, such as those based on loudspeakers hardware systems and those based on signal processing software, and the results obtained can be measured and compared easily and quickly. All this allows analysis and improvement of speech intelligibility not only in teaching or lecture rooms, but also in any type of enclosure where speech transmission is critical, such as operating theaters, airport control rooms or hospital waiting rooms.
Author Contributions
Conceptualization, J.L.-B. and J.S.-G.; methodology, M.C.; software, J.L.-B.; validation, J.M.A.C.; formal analysis, M.C.; resources, S.F.-C. and M.G.-P.; writing—original draft preparation, J.L.-B. and S.F.-C.; writing—review and editing, J.M.A.C. and M.G.-P.; funding acquisition, J.S.-G. All authors have read and agreed to the published version of the manuscript.
Funding
This research has been partially funded by the Ministry of Innovation and Economy within the project with reference BIA2016-76957-C3-1-R (co-financed with FEDER funds) and the grant with reference BES-2017-082340, and by the Generalitat Valenciana, with grants BEST/2020/117 and AEST/2020/048.
Institutional Review Board Statement
Not applicable.
Informed Consent Statement
Not applicable.
Conflicts of Interest
The authors declare no conflict of interest. The funders had no role in the design of the study; in the collection, analyses, or interpretation of data; in the writing of the manuscript, or in the decision to publish the results.
References
- Sabine, W.C. Collected Papers on Acoustics; Peninsula Publishing: Los Altos, CA, USA, 1992. [Google Scholar]
- ISO 3382-1:2009. Acoustics–Measurement of Room Acoustic Parameters–Part 1: Performance Spaces; International Standard Organization: Geneva, Switzerland, 2009. [Google Scholar]
- ISO 3382-2:2008. Acoustics–Measurement of Room Acoustic Parameters – Part 2: Reverberation Time In Ordinary Rooms; International Standard Organization: Geneva, Switzerland, 2008. [Google Scholar]
- ISO 3382-3:2012. Acoustics–Measurement of Room Acoustic Parameters–Part 3: Open Plan Offices; International Standard Organization: Geneva, Switzerland, 2012. [Google Scholar]
- Schroeder, M.R. Integrated-Impulse Method Measuring Sound Decay without Using Impulses. J. Acoust. Soc. Am. 1979, 66, 497–500. [Google Scholar] [CrossRef]
- Farina, A. Simultaneous measurement of impulse response and distortion with a swept-sine technique. In Proceedings of the AES 108th Convention, Audio Engineering Society, Paris, France, 19–22 February 2000. Preprint 5093. [Google Scholar]
- Vorlander, M.; Kob, M. Practical aspects of MLS measurements in building acoustics. Appl. Acoust. 1997, 52, 239–258. [Google Scholar] [CrossRef]
- Stan, G.-B.; Embrechts, J.-J.; Archambeau, D. Comparison of different impulse response measurement techniques. J. Audio Eng. Soc. 2002, 50, 249–262. [Google Scholar]
- Mommertz, E.; Muller, S. Measuring Impulse Responses with Digitally Pre-emphasized Pseudorandom Noise Derived from Maximum-Length Sequences. Appl. Acoust. 1995, 44, 195–214. [Google Scholar] [CrossRef]
- Cobos, M.; Perez, J.J.; Felici, S.; Segura, J.; Navarro, J.M. Cumulative-sum-based localization of sound events in low-cost wireless acoustic sensor networks. IEEE/ACM Trans. Audio Speech Lang. Process. 2014, 12, 1792–1802. [Google Scholar] [CrossRef]
- Alexandridis, A.; Mouchtaris, A. Multiple sound location estimation and counting in a Wireless Acoustic Sensor Network. In Proceedings of the 2015 IEEE Workshop on Applications of Signal Processing to Audio and Acoustics, New Paltz, NY, USA, 18–21 October 2015. [Google Scholar]
- Malhotra, B.; Nikolaidis, I.; Harms, J. Distributed classification of acoustic targets in wireless audio-sensor networks. Comput. Netw. 2008. [Google Scholar] [CrossRef]
- Duarte, M.F.; Hen, H.Y. Vehicle classification in distributed sensor networks. J. Parallel Distrib. Comput. 2004, 64, 826838. [Google Scholar] [CrossRef]
- Pastor-Aparicio, A.; Segura-Garcia, J.; Lopez-Ballester, J.; Felici-Castell, S.; García-Pineda, M.; Pérez-Solano, J.J. Psychoacoustic Annoyance Implementation with Wireless Acoustic Sensor Networks for Monitoring in Smart Cities. IEEE Int. Things J. 2020, 7, 128–136. [Google Scholar] [CrossRef]
- van Waterschoot, T.; Moonen, M. Distributed estimation and equalization of room acoustics in a Wireless Acoustic Sensor Network. In Proceedings of the 20th European Signal Processing Conference (EUSIPCO 2012), Bucharest, Romania, 27–31 August 2012. [Google Scholar]
- Larm, P.; Hongisto, V. Experimental comparison between speech transmission index, rapid speech transmission index, and speech intelligibility index. J. Acoust. Soc. Am. 2006, 119, 1106–1117. [Google Scholar] [CrossRef] [PubMed]
- Lam, C.L.C. Improving the Speech Intelligibility in Classrooms; Department of Mechanical Engineering, The Hong Kong Polytechnic University: Hong Kong, China, 2010. [Google Scholar]
- McNeer, R.R.; Bennett, C.L.; Horn, D.B.; Dudaryk, R. Factors affecting acoustics and speech intelligibility in the operating room: Size matters. Anesth Analg. 2017, 124, 1978–1985. [Google Scholar] [CrossRef] [PubMed]
- Ryherd, E.E.; Moeller, M., Jr.; Hsu, T. Speech intelligibility in hospitals. J. Acoust. Soc. Am. 2013, 134, 586–595. [Google Scholar] [CrossRef] [PubMed]
- American National Standards Institute; Acoustical Society of America. Standards Secretariat. American National Standard: Methods for Calculation of the Speech Intelligibility Index; American National Standards Institute: New York, NY, USA, 1998. [Google Scholar]
- Lopez-Ballester, J.; Pastor-Aparicio, A.; Felici-Castell, S.; Segura-Garcia, J.; Cobos, M. Enabling Real-Time Computation of Psycho-Acoustic Parameters in Acoustic Sensors Using Convolutional Neural Networks. IEEE Sens. J. 2020, 20, 11429–11438. [Google Scholar] [CrossRef]
Publisher’s Note: MDPI stays neutral with regard to jurisdictional claims in published maps and institutional affiliations. |
© 2021 by the authors. Licensee MDPI, Basel, Switzerland. This article is an open access article distributed under the terms and conditions of the Creative Commons Attribution (CC BY) license (http://creativecommons.org/licenses/by/4.0/).