Article

Saururus chinensis Prevents Estrogen Deficiency-Induced Osteoporosis in Rats: A Metabolomic Study Using UPLC/Q-TOF MS

Korea Food Research Institute, 245, Nongsaengmyeong-ro, Iseo-myeon, Wanju-gun, Jeollabuk-do 55365, Korea
*
Author to whom correspondence should be addressed.
Appl. Sci. 2021, 11(4), 1392; https://doi.org/10.3390/app11041392
Submission received: 6 January 2021 / Revised: 26 January 2021 / Accepted: 29 January 2021 / Published: 4 February 2021
(This article belongs to the Special Issue Application of Spectroscopic Techniques to Metabolomic Research)

Abstract

:
Saururus chinensis (SC), a traditional medicine, has been used for the treatment of edema, jaundice, gonorrhea, and several inflammatory diseases in China and Korea. Our previous studies reported the anti-osteoporotic activity of SC extract (SCE) in ovariectomized (OVX) rats but the mechanism of this effect was unclear. The aim of this study was to explore the anti-osteoporotic effect of SCE and elucidate the underlying mechanisms in ovariectomized rats using a metabolomics approach based on ultra-performance liquid chromatography coupled with electrospray ionization quadrupole time-of-flight mass spectrometry (UPLC/ESI-Q-TOF MS) to analyze metabolic changes. Female Sprague-Dawley (SD) rats were divided into sham, OVX, and SCE treatment groups. Partial least squares-discriminant analysis (PLS-DA) and orthogonal partial least squares-discriminant analysis (OPLS-DA) score plots separated OVX and sham groups fairly well. Further, 22 potential biomarkers were identified in the rat models of estrogen deficiency-induced osteoporosis, and SCE showed regulatory effects on three vital metabolic pathways associated with these biomarkers, namely, glycerophospholipid metabolism, glycosylphosphatidylinositol-anchor biosynthesis, and linoleic acid metabolism. The metabolomics approach reliably confirmed that SCE exerted its anti-osteoporotic effect by intervening with lipid metabolism, thus preventing osteoporosis. This study also showed the promising potential of this approach in an evaluation of natural medicine efficacy.

1. Introduction

Osteoporosis is one type of metabolic bone disease characterized by low bone mass, impaired bone microarchitecture, and bone fragility and susceptibility to fracture. Osteoporosis typically presents in postmenopausal women, and the cause is reduced ovarian function, which results in decreased estrogen. Thus, hormone replacement therapy (HRT) has generally been used to prevent and treat menopausal symptoms, including osteoporosis [1]. However, many studies have shown that HRT has some serious side effects, such as increased risk of breast and endometrial cancers and cardiovascular diseases [2]. Therefore, compared with modern available therapeutic approaches, alternative therapies, such as health foods containing natural products, have attracted interest in the treatment of menopausal symptoms, including osteoporosis development [3,4].
Saururus chinensis (SC) has been effectively applied as a traditional medicine in Korea and China for edema, jaundice, gonorrhea, and several inflammatory diseases. SC extract (SCE) has been shown to exert anti-inflammatory, antioxidant, anti-asthmatic, antihypertensive, antiangiogenic, and anti-atopic effects [5,6,7]. Recently, our research showed the anti-osteoporotic activity of SCE in ovariectomized rats and that this activity is mediated by the inhibitory effect on bone resorption and osteoclast formation of the phytochemicals isolated from SC, such as sauchinone, (-)-saucerneol, and saurolactam [8,9,10].
Various studies have been conducted to analyze the effect of natural products in the treatment of osteoporosis. For example, an extract of Sinomenii Caulis was shown to partially alleviate osteoporosis by inhibiting pro-inflammatory cytokines and activating osteoporosis-related pathways in a zebrafish osteoporosis model [11]. In another study, isoflavone-enriched soybean leaves attenuated osteoporosis by suppressing osteoclasts via its anti-inflammatory activity [12]. Kukoamine B from Lycii Radicis Cortex was shown to regulate markers associated with osteoblast differentiation and bone mineral density in MC3T3-E1 cells, as well as improve OVX-induced bone mineral density loss and impaired bone structural properties in OVX mice [13].
Metabolomics is an emerging technique for quantitative and qualitative analysis in the field of systematic biology, and it explores the metabolic mechanism of the entire organism by detecting the changes in small endogenous metabolites with subsequent data analysis via multivariate statistical approaches [14]. Not only has its use been dramatically increased to identify potential biomarkers for disease diagnosis, it is also used to characterize natural products [15,16,17]. It is also a powerful tool to evaluate the therapeutic effects of herbal medicines and dissect their underlying mechanisms [18,19]. The technique has been applied to study numerous metabolic disorders, but few have investigated its use in osteoporosis [20,21,22,23,24]. Compared with other instrumental analysis tools that have been used for metabolite profiling [25], ultra-performance liquid chromatography/mass spectrometry (UPLC/MS) is considered more promising in metabolomics research owing to its high resolution and accuracy and good coverage of metabolites [26,27,28].
In this study, UPLC/ESI-Q-TOF MS was applied to obtain a holistic picture of metabolic changes in ovariectomized (OVX) models of estrogen deficiency-induced osteoporosis. Biomarkers of interest were identified via multivariate statistical analysis and metabolomics databases. Further, the metabolic pathways associated with these biomarkers were explored to further elucidate the mechanism underlying the bone-protective effect of SCE.

2. Materials and Methods

2.1. Animals and Reagents

The animal experiments were approved by the Korea Food Research Institute (KFRI) animal care and use committee. All animal experiments were conducted according to the KFRI animal science rules. Female Sprague-Dawley (SD) rats (6–7 months of age) were obtained from Charles River Korea (Seoul, Korea). The rats were housed at a specific temperature (22–26 °C) with 12 h light/dark cycle and allowed free access to food and water. These rats were body weight-matched and randomly divided into three groups, as follows: sham-vehicle group (sham group, n = 5), OVX group with vehicle treatment (OVX group, n = 8), and OVX group with SCE treatment (SCE group, n = 7, 1 g/kg body weight/twice per week). Except for the SCE groups, the sham and OVX groups were fed a soy-free control diet for 14 weeks and then sacrificed [8]. Serum was separated by centrifugation at 3000× g for 10 min at 4 °C. Aliquots of serum were stored at −80 °C until analysis.

2.2. Metabolic Profiling

Serum samples were prepared according to previous reports, with slight modification [29]. Serum samples were extracted by adding 300 µL of cold acetonitrile to a 100-µL aliquot of serum. The samples were integrated and centrifuged at 13,000 rpm for 10 min at −4 °C, and then the upper liquid was dried to dryness under nitrogen. The dried sample was resuspended in 100 µL of 20% methanol. The UPLC/Q-TOF/MS analyses for the serum samples were conducted with the Waters ACQUITYTM UPLC system with the Waters SYNAPTY G2 High-Definition Mass Spectrometer (Waters Corporation, Milford, MA, USA) with electrospray ionization (ESI) in positive and negative ion modes. Separation was performed using the Waters ACQUITYTM UPLC BEH C18 Column (1.7 µm, 2.1 × 100 mm) maintained at a temperature of 40 °C and a flow rate of 0.4 mL min−1. The mobile phases consisted of acetonitrile (A) and water (B), each containing 0.1% formic acid. The following solvent gradient system was used: 2–100% A for 24 min. The injection volume was 2 µL. The conditions of the ESI source were as follows: cone voltage was set to 30 V; capillary voltage was set to 3.0 kV; source temperature was 120 °C; desolvation temperature was 350 °C; and the cone and desolvation gas flow were 50 and 600 L/h, respectively. The full-scan mass spectral range was 100-100 m/z with a 0.5 s scan time and a 0.1 s interval scan time, with a collision energy of 6 eV in the positive and negative ion modes. Leucine enkephalin was used for lock, mass-generating a positive ion mode ([M+H]+ = 556.2771) and negative ion mode ([M-H] = 554.2615) to ensure accuracy.

2.3. Data Processing and Statistical Analysis

The raw UPLC/Q-TOF MS data were processed using the MarkerLynx v4.1 software (Waters, Milford, MA, USA) for alignment, deconvolution, data reduction, and normalization, among other processes. Next, the dataset was imported into the SIMCA-P+ 13.0 software (Umetrics, Umea, Sweden) for multivariate pattern recognition analysis. Principal component analysis (PCA), partial least squares-discriminant analysis (PLS-DA), and orthogonal partial least squares-discriminant analysis (OPLS-DA) were performed to discriminate the groups. The variables with their importance in the projection (VIP) values > 1.0 and p values < 0.05 from the t-test were selected as candidate markers and metabolomics pathway analysis. The selected potential biomarkers were searched and matched in online databases, such as the METLIN (http://metlin.scripps.edu/ (accessed on 2 February 2021)), HMDB (http://www.hmdb.ca/ (accessed on 2 February 2021)), MassBank (http://www.massbank.jp (accessed on 2 February 2021)), and LIPID MAPS (http://www.Lipidmaps.org/tools/index.html (accessed on 2 February 2021)). Potential biomarkers were imported into MetaboAnalyst (MetPA; http://www.metaboanalyst.ca/ (accessed on 2 February 2021)), which is a comprehensive tool dedicated to identifying potential associated core metabolic pathways.

3. Results

3.1. Effect of SCE on Body Weight and Serum Biochemistry

In our previous study [8], compared with the sham group, the body weight of the OVX group significantly increased. Moreover, the levels of biochemical markers, including osteocalcin (OC), alkaline phosphatase (ALP), and deoxypyridinoline (DPD), in the OVX group were significantly higher than those in the sham group. In OVX group, serum ALP levels, which are a bone turnover marker, and OC levels, which are a bone formation marker, were significantly elevated [30]. The body weight, as well as OC, ALP, and DPD levels, significantly decreased in the SCE-treated group compared with those in the OVX group. This effect might have been caused by decreased bone resorption. The clinical chemistry results indicated that the SCE group showed significantly lower total cholesterol (TC) and triglyceride (TG) levels than the OVX group. These results suggested that treatment with SCE significantly reversed the OVX-induced alterations in these parameters.

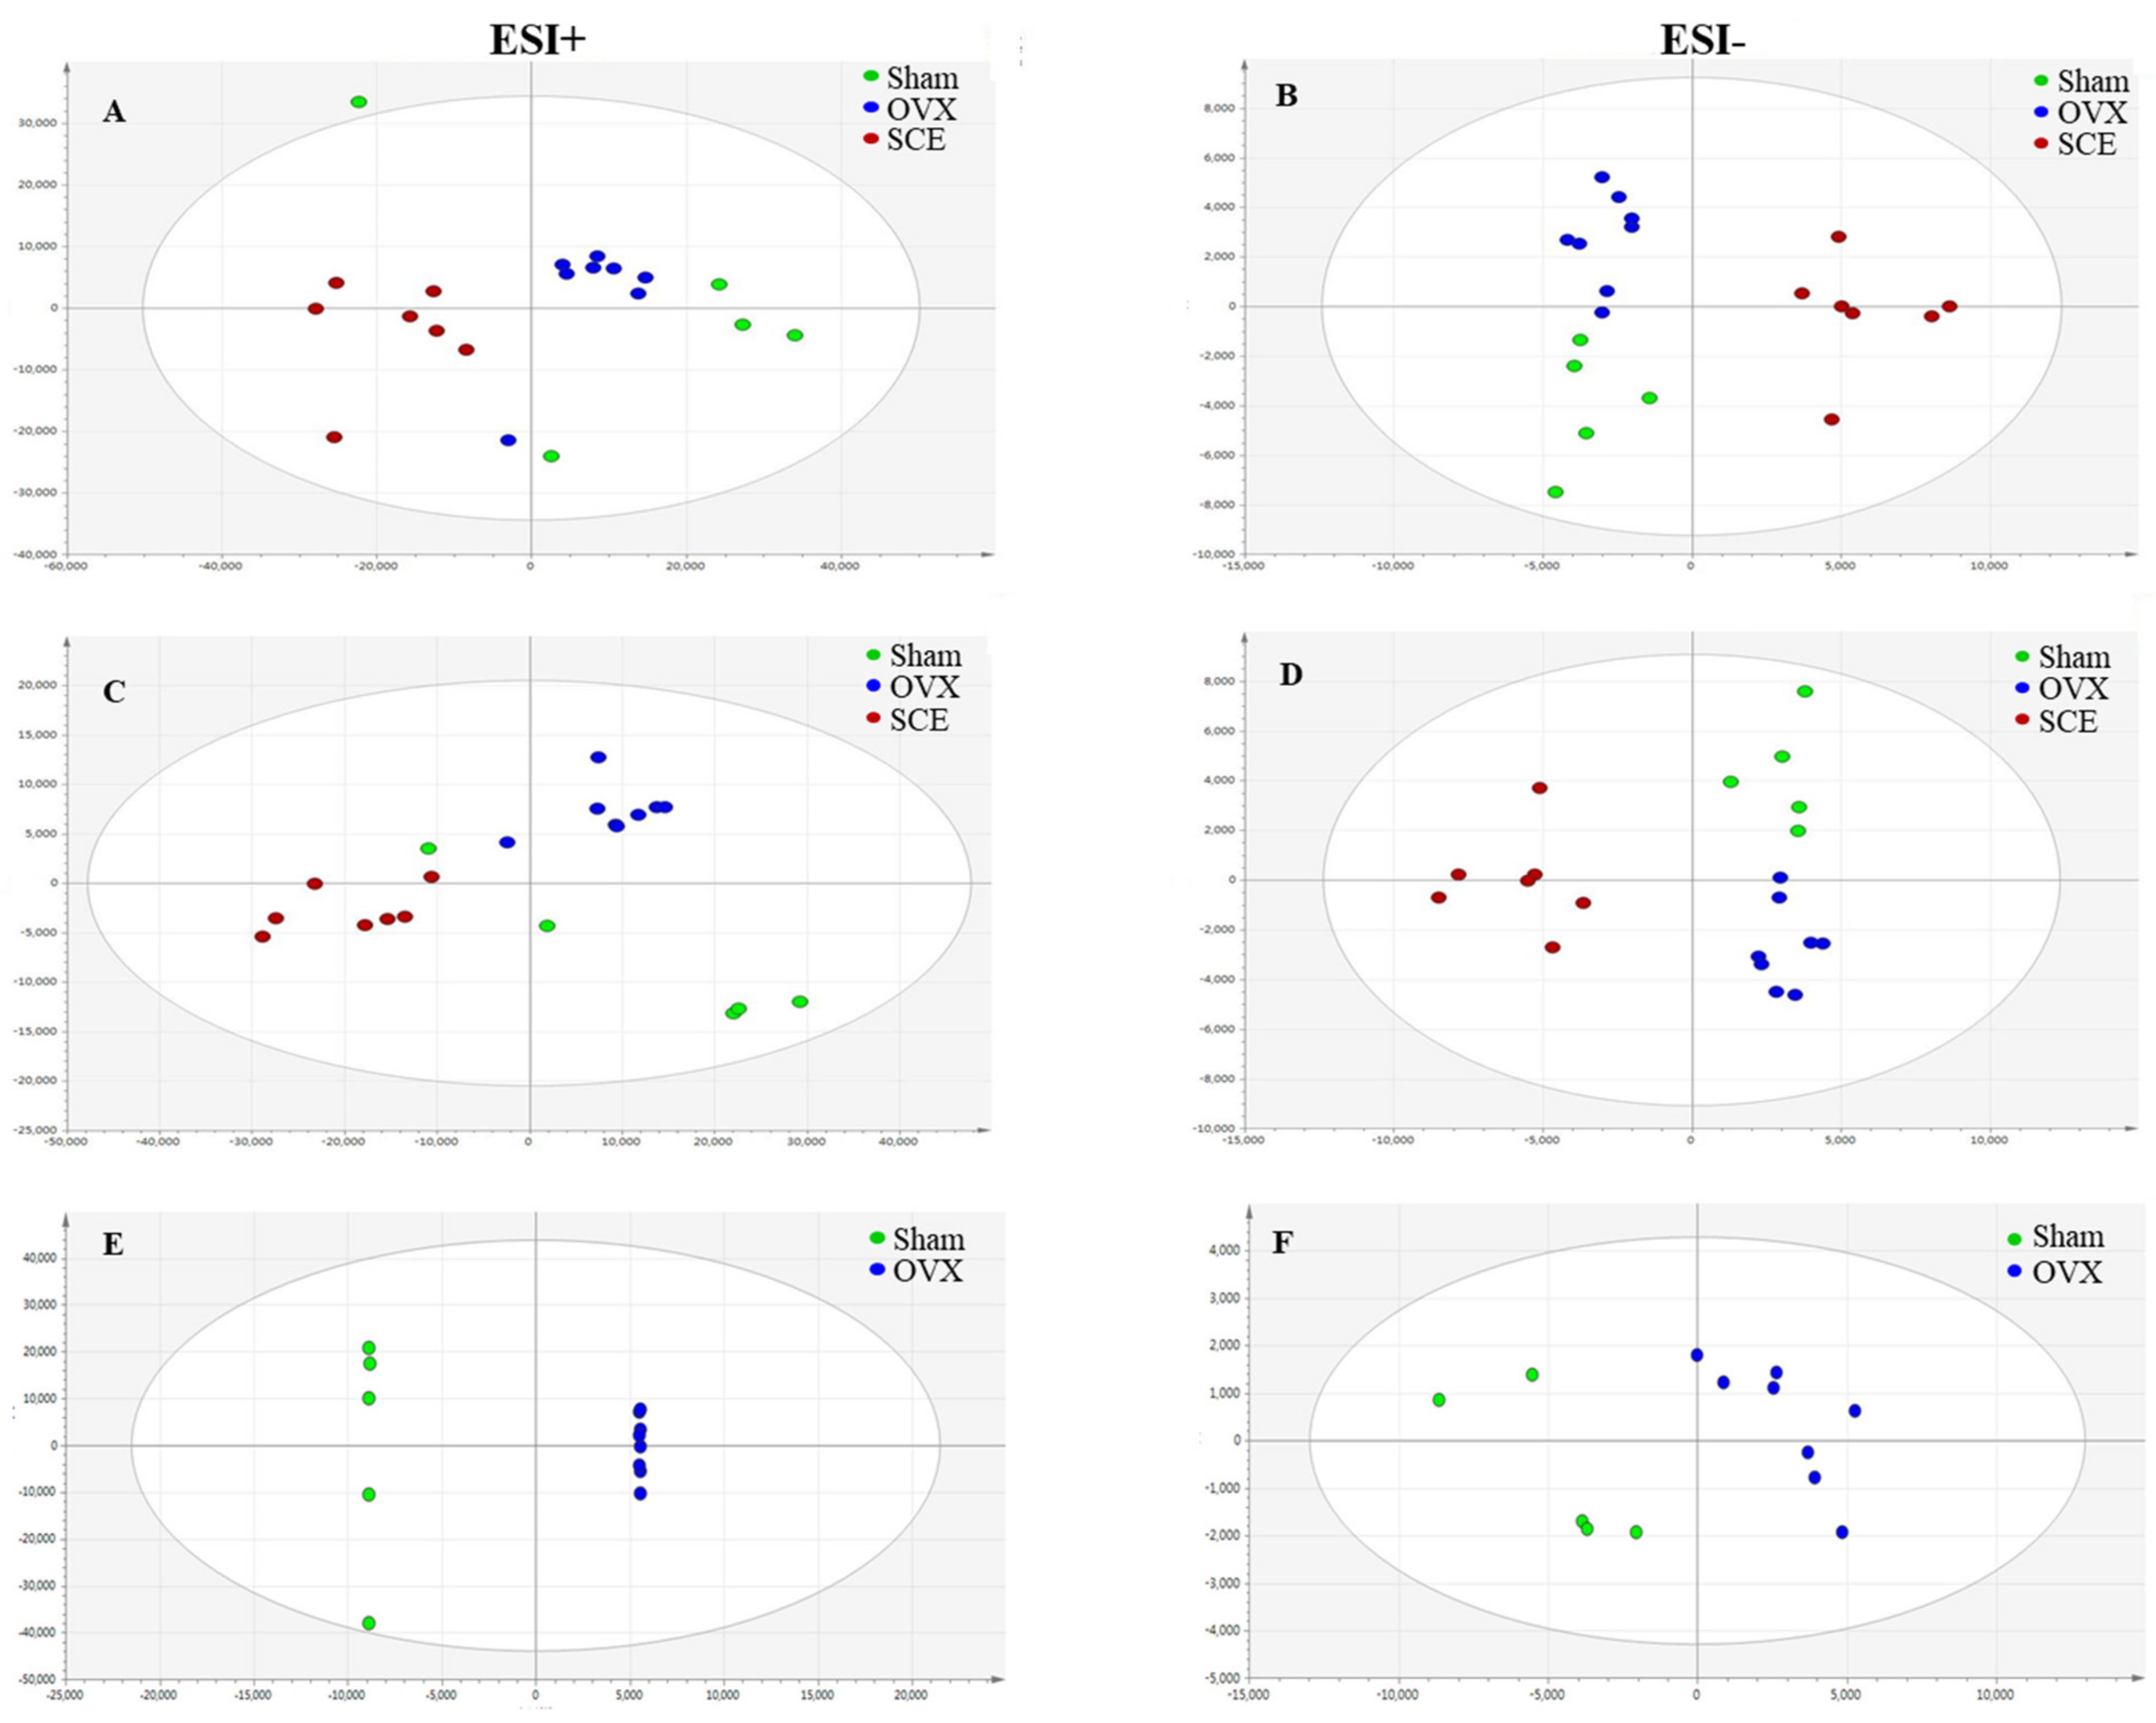
3.2. Metabolic Profiling Analysis

Rat serum UPLC/Q-TOF MS metabolite profiling was performed in both positive and negative ion modes. The base peak intensity (BPI) chromatograms of the serum of sham, OVX, and SCE groups in the positive and negative ion modes are shown in Figure 1.
Multivariate data analysis was performed using unsupervised PCA, and samples from different groups were scattered clearly. According to the statistical parameters from the PCA score plots, these two components explained the R2X value of 0.843 and 0.724, respectively, in positive and negative ion modes and predicted a Q2Y value of 0.675 and 0.572, respectively, in positive and negative ion modes for all sample variables (Figure 2A,B). To confirm the difference in metabolic profiles, supervised PLS-DA and OPLS-DA were performed to sharpen the established separation observed in Figure 2. To illustrate the effect of SCE, PLS-DA was performed to analyze the sham, OVX, and SCE groups. The PLS-DA score plots showed that the sham and OVX groups were separated; SCE treatment groups were closer to the sham group in both positive and negative ion modes, which showed that metabolic pattern was restored to near normal level after treatment of SCE (Figure 2C,D, ESI+: R2X = 0.487, Q2Y = 0.187; ESI-: R2X = 0.88, Q2Y = 0.867). As shown in the OPLS-DA score plots in Figure 2E,F, complete separation between the two groups was observed, which suggested that there were significant differences in metabolic profiles between sham and OVX groups. The metabolites with the VIP > 1 and p value < 0.05 were considered as potential biomarkers that distinguished the two groups.

3.3. Identification of Potential Biomarkers

To identify potential biomarkers, the accurate molecular ion of m/z and characteristic MS/MS fragment ions were compared with those in available databases, such as METLIN, HMDB, and LIPID MAPS. The screened potential biomarkers are listed in Table 1. Based on these findings, 25 endogenous metabolites were selected as potential biomarkers related to estrogen-deficiency-induced osteoporosis. Of these, the levels of uric acid, tyrosine, glutarylcarnitine, butyrylcarnitine, tryptophan, 14-HDoHE, LysoPE(16:0), LysoPE(20:1), LysoPE(20:2), LysoPE(18:0), LysoPC(16:1), LysoPC(15:0), LysoPC(17:0), LysoPC(18:2), LysoPC(20:3), LysoPC(22:5), PA(P-16:0/19:0), and PA(14:0/12:0) were significantly upregulated, whereas the levels of acetylcarnitine, arachidonic acid, nonate, cholic acid, LysoPC(22:5), PC (20:4/22:6), and PC(22:6/15:0) were downregulated in the OVX group.
The changes of 25 significant variables in the serum samples from the groups are shown in Figure 3. After SCE treatment, the levels of most of these metabolites were reversed and restored to near normal level. The results indicated that these metabolites were the potential biomarkers related to the anti-osteoporosis mechanism of SCE.

3.4. Effect of SCE on Metabolic Pathway

Metabolic profiling is based on the analysis of a group of metabolites related to a metabolic pathway in biological states. To explore the anti-osteoporosis mechanism of SCE, MetPA was employed for metabolic pathway analysis. According to the impact of pathways, the main pathological processes involved glycerophospholipid metabolism, glycosylphosphatidylinositol-anchor biosynthesis, and linoleic acid metabolism (Figure 4A). Figure 4B illustrates glycerophospholipid metabolism as an example of a biological pathway obtained from the analysis result. The three major metabolic pathways can be explained by the protective effect of SCE on lipid metabolism in OVX rats.

4. Discussion

SC has been effectively applied for the treatment of diseases, such as edema, gonorrhea, jaundice, and inflammation. In our previous study, SCE treatment was shown to increase bone mineral density, decrease separation of the bone trabecula, and positively regulate the biomarkers in OVX rat models, which is in agreement with the results of the present study [8,31].
In the present study, serum biomarkers in an estrogen deficiency-induced osteoporosis model and effects of SCE on the metabolites of OVX rats were analyzed by UPLC/Q-TOF MS-based metabolomics analysis. Changes in metabolites, potential biomarkers, and related pathways were observed. Estrogen deficiency induces bone loss, changes in lipid profiles, and bone mineral density [32]. Bone metabolism, bone formation, and bone resorption have a complex relationship with lipid metabolism. Blood lipid level is increased in osteoporotic postmenopausal women and significantly increased in OVX-induced osteoporotic rats [33]. Zhao et al. reported that lipid accumulation increases oxidation, not only inhibiting the differentiation of osteoblasts but also promoting bone marrow stromal cell differentiation into adipogenic cells [34]. Most lipids, including fatty acyls, glycerophospholipids (PC, PE, PA, phosphatidylserine (PS), phosphatidylglycerol (PG), and phosphatidylinositol (PI)), and sphingolipids, are components of the animal cell membrane and lipoproteins. LysoPCs, which result from the hydrolysis of PCs, are bioactive pro-inflammatory lipids generated through pathophysiological activities [35]. Increases in LysoPCs and PCs are suggestive of an oxidative stress response, and they are reportedly significantly upregulated in the plasma of osteoporotic mice; moreover, increases in reactive oxygen species lead to oxidative stress damage [36]. Oxidative stress may lead to increase bone mass loss and skeletal friability, resulting in aggravation of osteoporosis progression [37]. In this study, compared with that in the sham group, most of LysoPC, LysoPE, PC, and PA levels in the OVX groups significantly increased, suggesting that abnormal metabolism of glycerophospholipids was related to osteoporosis and was likely to enhance oxidative stress by generating reactive oxygen species [30]. In our current study, SCE showed the most significant effect on glycerophospholipid metabolism compared to that of other metabolic pathways, and SCE effectively reversed decreases in LysoPC, LysoPE, PC, and PA levels in the OVX group, which can be used as targets for the future clinical treatment of osteoporosis [38].
In a study by El Refaey et al., a high level of tryptophan in bone marrow mesenchymal stem cells due to the osteogenic induction associated with alkaline phosphatase protein expression was reported to be a risk marker for osteoblastic differentiation [39]. Aging negatively affects bone marrow mesenchymal stem cells by depleting normal anabolic tryptophan signals. Glutaryl-coenzyme A is an intermediate in the metabolism of lysine and tryptophan [40]. Mainly, glutaryl-CoA dehydrogenase converts tryptophan into glutaric acid and glutarylcarnitine in the catabolic pathways of tryptophan. In our model, the levels of tryptophan and glutarylcarnitine, which indicated the involvement of the catabolic pathways of tryptophan, were significantly upregulated in the OVX group. The levels of these metabolites were restored to normal level after treatment with SCE.
Carnitine transports long-chain fatty acids for oxidation, thus directly promoting the metabolism of osteoblasts. Moreover, increasing acetylcarnitine in aging rats leads to improved mitochondrial energy metabolism and reduced oxidative stress [32]. Butyrylcarnitine is involved in the oxidation of long-chain fatty acids and an increase in long-chain fatty acid oxidation due to a decrease in acetylcarnitine, which increases butyrylcarnitine levels in the OVX group [41]. Therefore, the levels of acetylcarnitine and butyrylcarnitine were significantly up- and downregulated in OVX rats in response to treatment with SCE.
Bile acids, including cholic acid, are known to regulate bile flow and lipid secretion, play a role in glucose and lipid metabolism, and regulate intestinal flora [42]. A recent study reported that bile acid has protective effects on the bones, and abnormal bile acid turnover has been linked with osteoporosis in postmenopausal women [43,44]. Our results showed that the serum level of cholic acid in OVX rats was significantly downregulated and restored by treatment with SCE.
This study discovered significantly altered metabolites in the development of osteoporosis, as well as specific metabolic pathways that can be used as targets for treatment, thereby accelerating the efficacy of natural medicine, especially in osteoporosis treatment [45].

5. Conclusions

A metabolomic approach by UPLC/Q-TOF MS was successfully applied to investigate the anti-osteoporosis effects of SCE against estrogen deficiency-induced osteoporosis in rats. The PLS-DA score plot showed the complete separation between the sham, OVX, and SCE groups. Furthermore, twenty-two potential metabolite biomarkers were identified, and the related main metabolic pathways, including glycerophospholipid metabolism, glycosylphosphatidylinositol-anchor biosynthesis, and linoleic acid metabolism, were restored to normal levels in the SCE-treated group compared with those in the OVX group. This finding suggests that SCE exerts its anti-osteoporosis effects by regulating lipid metabolites. Our study shows that the metabolomics-based approach reflects the systemic regulatory mechanism of a natural medicine, making it a promising tool in the evaluation of natural medicine efficacy.

Author Contributions

Conceptualization, Writing—original draft, and Writing—review and editing, S.L.; Formal analysis, M.Y. and H.J.H.; Investigation, G.J.J.; Resources, M.J.S. All authors have read and agreed to the published version of the manuscript.

Funding

This research was supported by the Korea Food Research Institute and Korea Institute of Planning and Evaluation for Technology in Food, Agriculture, and Forestry (grant number GA119027-3).

Institutional Review Board Statement

The animal experiment was approved by the Institutional Animal Care and Use Committee of the Korea Food Research Institute (KFRI-M-10002).

Informed Consent Statement

Not applicable.

Data Availability Statement

The data presented in this study are available in article.

Acknowledgments

The authors thank Yumi Kim, for editing the figures in this manuscript.

Conflicts of Interest

The authors declare no conflict of interest.

References

  1. Gambassiani, M.; Cagnacci, A.; Lello, S. Hormone replacement therapy and prevention of chronic conditions. Climacteric 2019, 22, 303–306. [Google Scholar] [CrossRef]
  2. Marjoribanks, J.; Farquhar, C.; Roberts, H.; Lethaby, A.; Lee, J. Long-term hormone therapy for perimenopausal and postmenopausal woman. Cochrane Database Syst. Rev. 2017, 1, CD004143. [Google Scholar] [PubMed]
  3. Pandey, M.K.; Gupta, S.C.; Karelia, D.; Gilhooley, P.J.; Shakibaei, M.; Aggarwal, B.B. Dietary nutraceuticals as backbone for bone health. Biotechnol. Adv. 2018, 36, 1633–1648. [Google Scholar] [CrossRef]
  4. Taku, K.; Melby, M.K.; Takebayashi, J.; Mizuno, S.; Ishimi, Y.; Omori, T.; Watanabe, S. Effect of soy isoflavone extract supplements on bone mineral density in menopausal women: Meta-analysis of randomized controlled trials. Asia Pac. J. Clin. Nutr. 2010, 19, 33–42. [Google Scholar] [PubMed]
  5. Ryu, S.Y.; Oh, K.S.; Kim, Y.S.; Lee, B.H. Antihypertensive, vasorelaxant and inotripic effects of an ethanolic extract of the roots of Saururus Chinensis. J. Ethnopharmacol. 2008, 18, 284–289. [Google Scholar] [CrossRef]
  6. Lee, D.H.; Kim, D.H.; Oh, I.Y.; Kim, S.Y.; Lim, Y.Y.; Kim, H.M.; Kim, Y.H.; Chio, Y.M.; Kim, S.E.; Kim, B.J.; et al. Inhibitory effects of saururi chinensis extracts on melanin biosynthesis in B16F10 melanoma cells. Biol. Pharm. Bull. 2013, 36, 772–779. [Google Scholar] [CrossRef] [PubMed] [Green Version]
  7. Cho, H.Y.; Cho, C.W.; Song, Y.S. Antioxidative and anti-inflammatory effects of Saururus chinensis methanol extract in RAW 264.7 macrophages. J. Med. Food 2005, 8, 190–197. [Google Scholar] [CrossRef] [PubMed]
  8. Sung, M.J.; Davaatseren, M.; Hur, H.J.; Kim, H.J.; Ryu, S.Y.; Choi, Y.H.; Cha, M.R.; Kwon, D.Y. Antiosteoporotic activity of Saururus chinensis extract in ovariectomized rats. Phytother. Res. 2012, 26, 1182–1188. [Google Scholar] [CrossRef]
  9. Han, K.Y.; Yang, D.; Chang, E.J.; Lee, Y.; Huang, H.; Sung, S.H.; Lee, Z.H.; Kim, Y.C.; Kim, H.H. Inhibition of osteoclast differentiation and bone resorption by sauchinone. Biochem. Pharmacol. 2007, 74, 911–923. [Google Scholar] [CrossRef]
  10. Kim, S.N.; Kim, M.H.; Kim, Y.S.; Ryu, S.Y.; Min, Y.K.; Kim, S.H. Inhibitory effect of (-)-saucerneol on osteoclast differentiation and bone pit formation. Phytother. Res. 2009, 23, 185–191. [Google Scholar] [CrossRef]
  11. Liu, W.J.; Jiang, Z.M.; Chen, Y.; Xiao, P.T.; Wang, Z.Y.; Huang, T.Q.; Liu, E. Network pharmacology approach to elucidate possible action mechanisms of Sinomenii Caulis for treating osteoporosis. J. Ethnopharmacol. 2020, 257, 112871. [Google Scholar] [CrossRef] [PubMed]
  12. Xie, C.L.; Park, K.H.; Kang, S.S.; Cho, K.M.; Lee, D.H. Isoflavone-enriched soybean leaves attenuate overiectomy-induced osteoporosis in rats by anti-inflammatory activity. J. Sci. Food Agric. 2020, jsfa10763. [Google Scholar] [CrossRef]
  13. Park, E.; Kim, J.; Kim, M.C.; Yeo, S.; Kim, J.; Park, S.; Jo, M.; Choi, C.W.; Kim, H.S.; Lee, S.W.; et al. Anti-osteoporotic effects of kikoamine B isolated from Lycii Radicis Cortex extract on osteoblast and osteoclast cells and ovariecromized osteoporosis model mice. Int. J. Mol. Sci. 2019, 20, 2784. [Google Scholar] [CrossRef] [Green Version]
  14. Cheng, J.; Lan, W.; Zheng, G.; Gao, X. Metabolomics: A high-throughput platform for metabolite profile exploration. Methods Mol. Biol. 2018, 1754, 265–292. [Google Scholar] [PubMed]
  15. Capati, A.; Ijare, O.B.; Bezabeh, T. Diagnostic applications of nuclear magnetic resonance-based urinary metabolomics. Magn. Reson. Insights 2017, 10, 1178623X17694346. [Google Scholar] [CrossRef] [Green Version]
  16. Li, X.; Sun, H.; Zhang, A.; Liu, Z.; Zou, D.; Song, Y.; Wang, X. High-throughput LC-MS method for the rapid characterization of multiple chemical constituents and metabolites of Da-Bu-Yin-Wan. J. Sep. Sci. 2017, 40, 4102–4112. [Google Scholar] [CrossRef] [PubMed]
  17. Lindon, J.C.; Holmes, E.; Bollard, M.E.; Stanley, E.G.; Bicholson, J.K. Metabonomics technologies and their applications in physiological monitoring, drug safety assessment and disease diagnosis. Biomarkers 2004, 9, 1–31. [Google Scholar] [CrossRef] [PubMed]
  18. Huang, Y.; Liu, X.; Zhao, L.; Xiong, Z. Kidney tissue targeted metabolic profiling of glucocorticoid-induced osteoporosis and the proposed therapeutic effects of Rhizoma Drynariae studied using UHPLC/MS/MS. Biomed. Chromatogr. 2014, 28, 878–884. [Google Scholar] [CrossRef]
  19. Xu, T.; Feng, G.; Zhao, B.; Zhao, J.; Pi, Z.; Liu, S.; Song, F.; Liu, Z. A non-target urinary and serum metabolomics strategy reveals therapeutical mechanism of Radix Astragali on adjuvant-induced arthritis rats. J. Chromatogr. B 2017, 1048, 94–101. [Google Scholar] [CrossRef]
  20. Jambocus, N.G.S.; Saari, N.; Ismail, A.; Khatib, A.; Mahomoodally, M.F.; Hamid, A.A. An investigation into the antiobesity effects of Marinda citrifolia L. leaf extract in high fat diet induced obese rats using a (1)H NMR metabolomics approach. J. Diabetes Res. 2016, 2016, 2391592. [Google Scholar]
  21. Lai, Y.S.; Chen, W.C.; Kuo, T.C.; Ho, C.T.; Kuo, C.H.; Tseng, Y.J.; Lu, K.H.; Lin, S.H.; Panyod, S.; Sheen, L.Y. Mass-spectrometry-based serum metabolomics of a C57BL/6J mouse model of high-fat-diet-induced non-alcoholic fatty liver disease development. J. Agric. Food Chem. 2015, 63, 7873–7884. [Google Scholar] [CrossRef]
  22. Cao, H.; Zhang, A.; Sun, H.; Zhou, X.; Guan, Y.; Liu, Q.; Kong, L.; Wang, X. Metabolomics-proteomics profiles delineate metabolic changes in kidney fibrosis disease. Proteomics 2015, 15, 3699–3710. [Google Scholar] [CrossRef]
  23. Wang, D.; Li, R.; Wei, S.; Gao, S.; Xu, Z.; Liu, H.; Wang, R.; Li, H.; Cai, H.; Wang, J.; et al. Metabolomics combined with network pharmacology exploration reveals the modulatory properties of Astragali Radix extract in the treatment of liver fibrosis. Chin. Med. 2019, 14, 30. [Google Scholar] [CrossRef] [Green Version]
  24. Shon, J.C.; Kim, W.C.; Ryu, R.; Wy, Z.; Seo, J.S.; Choi, M.S.; Liu, K.H. Plasma lipidomics reveals insights into anti-obesity effect of Chrysanthemum morifolium Ramat leaves and its constituent luteolin in high-fat diet-induced dyslipidemic mice. Nutrients 2020, 12, 2973. [Google Scholar] [CrossRef] [PubMed]
  25. Wolfender, J.L.; Marti, G.; Thomas, A.; Bertrand, S. Current approaches and challengers for the metabolites profiling of complex natural extracts. J. Chromatogr. A 2015, 1382, 136–164. [Google Scholar] [CrossRef] [PubMed]
  26. Wang, J.; Zhao, A.; Hou, X.; Zheng, X.; Chen, P.; Bao, Y.; Jia, W.; Hu, C.; Zhang, Z.L.; Jia, W. Discovery of potential biomarkers for osteoporosis using LC-MS/MS metabolomic methods. Osteoporos. Int. 2019, 30, 1491–1499. [Google Scholar] [CrossRef] [PubMed]
  27. Zheng, S.; Yu, M.; Lu, X.; Huo, T.; Ge, L.; Yang, J.; Wu, C.; Li, F. Urinary metabolomic study on biochemical changes in chronic unpredictable mild stress model of depression. Clin. Chim. Acta 2010, 411, 204–209. [Google Scholar] [CrossRef] [PubMed]
  28. Huo, T.; Cai, S.; Lu, X.; Sha, Y.; Yu, M.; Li, F. Metabolomic study of biochemical changes in the serum of type 2 diabetes mellitus patients after the treatment of metformin hydrochloride. J. Pharm. Biomed. Anal. 2009, 49, 976–982. [Google Scholar] [CrossRef] [PubMed]
  29. Lee, L.S.; Chio, J.H.; Sung, M.J.; Hur, J.Y.; Hur, H.J.; Park, J.D.; Kim, Y.C.; Gu, E.J.; Min, B.; Kim, H.J. Green tea changes serum and liver metabolomic profiles in mice with high-fat diet-induced obesity. Mol. Nutr. Food Res. 2015, 59, 784–794. [Google Scholar] [CrossRef]
  30. El-Nabarawi, N.; El-Wakd, M.; Salem, M. Atorvastatin, a double weapon in osteoporosis treatment: An experimental and clinical study. Drug Des. Dev. Ther. 2017, 11, 1383–1391. [Google Scholar] [CrossRef] [Green Version]
  31. Hertrampf, T.; Schleipen, B.; Offermanns, C.; Velders, M.; Laudenbach, U.; Diel, P. Comparison of the bone protective effects of an isoflavone-rich diet with dietary and subcutaneous administrations of genistein in ovariectomized rats. Toxicol. Lett. 2009, 184, 198–203. [Google Scholar] [CrossRef]
  32. Qi, H.; Bao, J.; An, G.; Ouyang, G.; Zhang, P.; Wang, C.; Ying, H.; Ouyang, P.; Ma, B.; Zhang, Q. Association between the metabolome and bone mineral density in pre- and post-menopausal Chinese women using GC-MS. Mol. Biosyst. 2016, 12, 2265–2275. [Google Scholar] [CrossRef] [PubMed]
  33. Xue, L.; Wang, Y.; Liu, L.; Zhao, L.; Han, T.; Zhang, Q.; Qin, L. A 1HNMR-based metabonomics study of postmenopausal osteoporosis and intervention effects of Er-Xian decoction in ovariectomized rats. Int. J. Mol. Sci. 2011, 12, 7635–7651. [Google Scholar] [CrossRef] [Green Version]
  34. Zhao, H.; Li, X.; Zhang, D.; Chen, H.; Chao, Y.; Wu, K.; Dong, X.; Su, J. Integrative Bone Metabolomics—Lipidomics Strategy for Pathological Mechanism of Postmenopausal Osteoporosis Mouse Model. Sci. Rep. 2018, 8, 16456. [Google Scholar] [CrossRef] [PubMed]
  35. Zhang, C.; Wang, Y.; Wang, F.; Wang, Z.; Lu, Y.; Xu, Y.; Wang, K.; Shen, H.; Yang, P.; Li, S.; et al. Quantitative profiling of glycerophospholipids during mouse and human macrophage differentiation using targeted mass spectrometry. Sci. Rep. 2017, 7, 412. [Google Scholar] [CrossRef] [PubMed] [Green Version]
  36. Liu, X.; Zhang, S.; Lu, X.; Zheng, S.; Li, F.; Xiong, Z. Metabonomic study on the anti-osteoporosis effect of Rhizoma Drynariae and its action mechanism using ultra-performance liquid chromatography-tandem mass spectrometry. J. Ethnopharmacol. 2012, 139, 311–317. [Google Scholar] [CrossRef] [PubMed]
  37. Ibanez, L.; Ferrandiz, M.L.; Brines, R.; Guede, D.; Cuadrado, A.; Alcaraz, M.J. Effects of Nrf2 deficiency on bone microarchitecture in an experimental model of osteoporosis. Oxidative Med. Cell. Longev. 2014, 2014, 726590. [Google Scholar] [CrossRef] [PubMed]
  38. Liu, X.; Liu, Y.; Cheng, M.; Zhang, X.; Xiao, H. A metabolomics study of the inhibitory effect of 17-beta-estradiol on osteoclast proliferation and differentiation. Mol. Biosyst. 2015, 11, 635–646. [Google Scholar] [CrossRef] [PubMed]
  39. El Refaey, M.; Watkins, C.P.; Kennedy, E.J.; Chang, A.; Zhong, Q.; Ding, K.H.; Shi, X.; Xu, J.; Bollag, W.B.; Hill, W.D.; et al. Oxidation of the aromatic amino acids tryptophan and tyrosine disrupts their anabolic effects on bone marrow mesenchymal stem cells. Mol. Cell. Endocrinol. 2015, 410, 87–96. [Google Scholar] [CrossRef] [Green Version]
  40. Rao, K.S.; Albro, M.; Dwyer, T.M.; Frerman, F.E. Kinetic mechanism of glutaryl-CoA dehydrogenase. Biochemistry 2006, 45, 15853–15861. [Google Scholar] [CrossRef]
  41. Tsuda, S.; Hayashi, T.; Egawa, T. The effects of caffeine on metabolomic responses to muscle contraction in rat skeletal muscle. Nutrients 2019, 11, 1819. [Google Scholar] [CrossRef] [PubMed] [Green Version]
  42. Verma, A.; Maxwell, J.D.; Ang, L.; Davis, T.; Hodges, S.; Northfield, T.C.; Zaidi, M.; Pazianas, M. Ursodeoxycholic acid enhances fractional calcium absorption in primary biliary cirrhosis. Osteoporos. Int. 2002, 13, 677–682. [Google Scholar] [CrossRef] [PubMed]
  43. Loomes, K.M.; Spino, C.; Goodrich, N.P.; Hangartner, T.N.; Marker, A.E.; Heubi, J.E.; Kamath, B.M.; Shneider, B.L.; Rosenthal, P.; Hertel, P.M.; et al. Bone Density in children with chronic liver disease correlates with growth and cholestasis. Hepatology 2019, 69, 245–257. [Google Scholar] [CrossRef] [PubMed] [Green Version]
  44. Hanly, R.; Ryan, N.; Snelling, H.; Walker-Bone, K.; Dizdarevic, S.; Peters, A.M. Association between bile acid turnover and osteoporosis in postmenopausal women. Nucl. Med. Commut. 2013, 34, 597–600. [Google Scholar] [CrossRef] [PubMed]
  45. Luo, D.; Li, J.; Chen, K.; Rong, X.; Guo, J. Untargeted metabolomics reveals the protective effects of Fufang Zhenshu Tiaozhi (FTZ) on aging-induced osteoporosis in mice. Front. Pharmacol. 2018, 9, 1483. [Google Scholar] [CrossRef] [PubMed]
Figure 1. Base peak intensity (BPI) chromatogram of rat serum in (A) positive and (B) negative ion mode.
Applsci 11 01392 g001
Figure 2. Results of multivariate data analysis obtained from LC-QTOF/MS. (A,B) PCA score plots in different groups; (C,D) PLS-DA score plots among Sham, OVX, and SCE groups; (E,F) OPLS-DA score plots between Sham and OVX groups in positive mode and negative mode.
Applsci 11 01392 g002
Figure 3. Relative box plot of intensity of 25 potential biomarkers of anti-osteoporosis of SCE in rat serum. * p < 0.05; ** p < 0.01; *** p < 0.001 compared with sham group; # p < 0.05; ## p < 0.01; ### p < 0.001 compared with OVX group.
Applsci 11 01392 g003
Figure 4. The pathway analysis with MetPA of SCE treatment effect: (A) including glycerophospholipid metabolism; (B) the compounds of the red boxes are LysoPE, LysoPC, and LysoPC(18:1) by serum metabolomics.
Applsci 11 01392 g004
Table 1. Identification of potential biomarkers in rat serum.
Mass FragmentMetabolites bAdductElemental CompositionFold ChangeChange Trend Compared with OVX Group a
OVX/ShamSCE/OVXShamSCE
167.0206Uric acid[M-H]-C5H4N4O31.810.67↓ ***↓ ***
204.1219Acetylcarnitine[M+H]+C9H18NO40.771.65↑ ***
180.0662Tyrosine[M-H]-C9H11NO32.060.59↓ ***↓ ***
276.1477Glutarylcarnitine[M+H]+C12H22NO61.320.95↓ **
232.1546Butyrylcarnitine[M+H]+C11H21NO41.750.55↓ **↓ **
203.0828Tryptophan[M-H]-C11H12N2O21.340.95↓ *
187.0996Nonate[M-H]-C9H16O41.301.08↓ *
349.2361Arachidonic acid[M+FA-H]-C20H32O20.020.30↑ ***↓ **
407.2763Cholic acid[M-H]-C24H40O50.454.18↑ *↑ **
512.2966LysoPE(16:0)[M+CH3COO]-C21H44NO7P1.620.54↓ **↓ ***
494.3177LysoPC(16:1)[M+H]+C24H48NO7P1.440.39↓ **↓ ***
564.3281LysoPE(20:2)[M+CH3COO]-C25H48NO7P1.730.86↓ ***↓ *
520.3392LysoPC(18:2)[M+H]+C26H50NO7P1.230.64↓ *↓ ***
540.3308LysoPE(18:0)[M+CH3COO]-C23H48NO7P1.300.63↓ ***↓ ***
570.3566LysoPC(22:5)[M+H]+C30H52NO7P0.313.19↑ ***↑ ***
546.3596LysoPC(20:3)[M+H]+C28H52O7NP1.580.30↓ **↓ ***
566.3455LysoPE(20:1)[M+CH3COO]-C25H50NO7P1.420.72↓ ***↓ ***
605.4123DG(18:3/14:1)[M+2Na-H]C35H60O50.214.41↑ ***↑ ***
480.3074LysoPC(15:0)[M-H]-C23H48NO7P1.510.62↓ ***↓ ***
568.3600LysoPC(17:0)[M+CH3COO]-C25H52NO7P1.290.73↓ ***↓ ***
711.469314-HDoHE[2M-H]-C23H32O31.530.72↓ ***↓ ***
711.4706PA(P-16:0/19:0)[M+K-2H]-C38H75O7P1.530.71↓ ***↓ ***
601.3294PA(14:0/12:0)[M+K-2H]-C29H57O8P1.530.71↓ ***↓ ***
854.5827PC(20:4/22:6)[M+H]+C50H80NO8P0.570.16↑ *↓ ***
850.5619PC(22:6/15:0)[M+CH3COO]-C45H78NO8P0.431.62↑ **↑ **
a Comparison of OVX model group with sham group, SCE group, respectively, the putative identifications are increased (↑) or decreased (↓). * p < 0.05; ** p < 0.01; *** p < 0.001, compared with OVX group. b Abbreviations: lysophosphatidylcholines (LysoPC); lysophosphatidylethanolamine (LysoPE); diacylglyc erol (DG); phosphatidic acid (PA); phosphatydylcholine (PC).
Publisher’s Note: MDPI stays neutral with regard to jurisdictional claims in published maps and institutional affiliations.

