Article

Urinary 1H-NMR Metabolic Signature in Subjects Undergoing Colonoscopy for Colon Cancer Diagnosis

1
Department of Biomedical Science, University of Cagliari, 09124 Cagliari, Italy
2
Department of Surgery, Colorectal Cancer Surgery Center, University Hospital, University of Cagliari, 09124 Cagliari, Italy
3
Department of Metabolism, Digestion and Reproduction, Imperial College, London SW7 2AZ, UK
4
Department of Surgical Sciences, Neonatal Intensive Care Unit, Puericulture Institute and Neonatal Section, University Hospital, University of Cagliari, 09124 Cagliari, Italy
5
Laboratory Unit, Department of Surgical Sciences, University of Cagliari, 09124 Cagliari, Italy
*
Author to whom correspondence should be addressed.
Appl. Sci. 2020, 10(16), 5401; https://doi.org/10.3390/app10165401
Submission received: 16 July 2020 / Revised: 31 July 2020 / Accepted: 1 August 2020 / Published: 5 August 2020
(This article belongs to the Special Issue Application of Spectroscopic Techniques to Metabolomic Research)

Abstract

:

Featured Application

Metabolomics can be a useful tool to support the diagnosis and the monitoring of colon cancer.

Abstract

Metabolomics represents a promising non-invasive approach that can be applied to identify biochemical changes in colorectal cancer patients (CRC) and is potentially useful for diagnosis and follow-up. Despite the literature regarding metabolomics CRC-specific profiles, discrimination between metabolic changes specifically related to CRC and intra-individual variability is still a problem to be solved. This was a preliminary case-control study, in which 1H-NMR spectroscopy combined with multivariate statistical analysis was used to profile urine metabolites in subjects undergoing colonoscopy for colon cancer diagnosis. To reduce intra-individual variability, metabolic profiles were evaluated in participants’ urine samples, collected just before the colonoscopy and after a short-term dietary regimen required for the endoscopy procedure. Data obtained highlighted different urinary metabolic profiles between CRC and unaffected subjects (C). The metabolites altered in the CRC urine (acetoacetate, creatine, creatinine, histamine, phenylacetylglycine, and tryptophan) significantly correlated with colon cancer and discriminated with accuracy CRC patients from C patients (receiver operator characteristic (ROC) curve with an area under the curve (AUC) of 0.875; 95% CI: 0.667–1). These results confirm that urinary metabolomic analysis can be a valid tool to improve CRC diagnosis, prognosis, and response to therapy, representing a noninvasive approach that could precede more invasive tests.

1. Introduction

Colorectal cancer (CRC) diagnosis is mainly based on invasive, costly, and time-consuming methods (e.g., endoscopic, histological, and radiographic techniques), as noninvasive methods, such as stool-based tests (e.g., fecal occult blood test, FOBT) or the carcinoembryonic antigen (CEA) test, lack sensitivity and specificity [1,2,3]. Indeed, the diagnostic power of the noninvasive techniques mentioned above, such as FOBT, is higher in the presence of advanced tumors, while survival and prognosis for CRC are positively correlated with an early stage of neoplasia at the time of diagnosis [4]. Thus, new CRC diagnostic tools and a better understanding of the molecular events implicated in CRC onset and progression are needed for successful treatment [5]. Every cell function is based on metabolic pathways, and their alterations are reflected by changes in related metabolites. Systematic analysis of the full set of metabolites in a biological sample is the focus of metabolomics, a major constituent of a new type of integrated approach called “systems biology”, which might represent a promising noninvasive tool for the identification of potential markers involved in human tumorigenesis [6,7]. In the last decade, metabolomics analysis of samples from CRC patients has led to the identification of several molecules specifically expressed, and the monitoring of their fluctuations is emerging as an important way to detect the early stages of CRC [6,8,9,10,11,12]. On this basis, the present study aimed to analyze by 1H-NMR spectroscopy the urine metabolomics profile of CRC patients and cancer-free controls, to identify a possible specific set of metabolic biomarkers that could be proposed as a noninvasive diagnostic tool to identify CRC patients.

2. Materials and Methods

2.1. Patients and Sample Collection

The study was conducted on patients admitted to the Colorectal Surgical Unit, University Hospital of Cagliari, with a suspected diagnosis of CRC from fecal occult blood presence or for familiarity risk. Patients were subjected to colonoscopy. A few days before the colonoscopy procedure they started a low-fiber diet. The day before the colonoscopy they did not eat solid food, but only liquids. The night before the colonoscopy, patients took strong laxatives to clear the digestive tract. On the day of the colonoscopy, they could drink water up to 2 h before the procedure. Based on the outcome of this examination, the population was divided into two groups: CRC group, comprising 6 cases of rectal, 7 of colon, and 1 of caecum adenocarcinomas, and unaffected subjects (C) group, including 10 individuals without colon pathologies. Participant characteristics are indicated in Table 1. Patient status was confirmed by subsequent histological analysis. This study was approved by the Ethical Committee of the University Hospital of Cagliari, and all participants gave informed consent.

2.2. Urine Samples Preparation

Urine samples were collected just before colonoscopies from participants in the study. An aliquot of 800 µL of urine was transferred into a tube with 8 µL of a 1% aqueous solution of NaN3, to inhibit bacteria growth, and was stored at −80 °C. Afterwards, to remove solid particles, the sample was centrifuged at 12,000× g for 10 min at 4 °C. The supernatant (630 µL) was mixed with 70 µL of potassium phosphate buffer in D2O (1.5 M, pH 7.4) containing sodium 3-trimethylsilyl-propionate-2,2,3,3,-d4 (TSP) as an internal standard (98 atom% D, Sigma-Aldrich, Milan, Italy). An aliquot of 650 µL was transferred to NMR glass tubes for 1H-NMR analysis [13].

2.3. 1H-NMR Spectroscopic Analysis

1H-NMR measurements of urine samples were carried out at 298 K using a Bruker DRX 500 spectrometer operating at 500 MHz (Bruker Biospin, Rheinstetten, Germany). 1H-NMR spectra were obtained using a 1D Nuclear Overhauser Enhancement Spectroscopy (NOESY) pulse sequence to suppress water signals (relaxation delay of 3 s). For each sample, 128 free induction decays (FIDs) were collected into 64 K data points with a spectral width of 6000 Hz with a 90° pulse, an acquisition time of 2 s, and a mixing time of 150 ms. The FIDs were weighted by an exponential function with a 0.5 Hz line-broadening factor before Fourier transformation.

2.4. NMR Data Preprocessing and Multivariate Statistical Analysis

The phase and baseline of NMR spectra were corrected using ACDlab Processor Academic Edition (Advanced Chemistry Development, 12.01, 2010, Toronto, ON, Canada). The spectral region comprising the signal of residual water and urea (4.5–6.0 ppm) was removed. The final spectral regions considered were between 0.5 and 4.5 ppm as well as 6.0 and 9.5 ppm. The ACD Labs intelligent bucketing method was used for spectral integration [14]. A 0.01 ppm bucket width was defined with an allowed 50% looseness. The intelligent bucket method finds local minima in spectra and adjusts the buckets accordingly. In this way, a peak is integrated into one bucket. The area of bucketed regions was normalized using Median Fold Change Normalization [15], largely preferred to total sum normalization when studying urine samples, and a matrix was generated. The resultant data sets were then imported into SIMCA software (Version 15.0, Sartorius Stedim Biotech, Umea, Sweden) for multivariate statistical analysis. The data sets were then Pareto scaled. Pareto scaling, where each variable is divided by the square root of the standard deviation, gives greater weight to NMR variables with low intensity, but it is not as extreme as the UV (Unit Variance) scaling method. Principal component analysis (PCA) and Orthogonal Partial Least-Squares Discriminant Analysis (OPLS-DA) were used for multivariate statistical analyses of NMR data. PCA was performed to identify any possible relation (trends, outliers) between the samples. As far as the outliers are concerned, Hotelling’s T2 and DModX tests were applied. OPLS-DA analysis was used to reduce model complexity and to better highlight sample discrimination. The goodness of the model was evaluated using a 7-fold cross-validation and a “permutation test” (400 permutations). The permutation test was calculated by randomizing the Y-matrix (classification components) while the X-matrix (peak intensity in NMR spectra) was kept constant. The permutation plot shows the correlation coefficient between the original and the permuted y-variables on the x-axis, versus the cumulative R2 and Q2 on the y-axis, and draws the regression line. Q2Y intercept values are a measure of the overfit, and values <0.05 are indicative of a valid model. To highlight potential metabolites that mainly contributed to group separation, an S-plot for the OPLS-DA model was created. The S-plot reveals the contribution of each variable to the predictive component, matching the covariance p and the correlation p(corr) obtained from the OPLS-DA model. The axes plotted in the S-plot from the predictive component are p1 versus p(corr)1, representing the magnitude (modelled covariance) and reliability (modelled correlation) respectively. The variables characterized by high magnitude and reliability values have an important role in the separation of different groups of samples. In the S-plot both magnitude (intensity) and reliability are plotted. The statistical significance of the difference in metabolite concentrations, quantified using Chenomx NMR suite 7.1 (Chenomx Inc., Edmonton, AB, Canada), was calculated using an unpaired Welch t-test with a 95% confidence interval. Chenomx NMR Suite software is useful for identifying and quantifying the metabolites in NMR spectra [16]. It is equipped with reference libraries containing numerous compound models that are identical to the spectra of pure compounds obtained under similar experimental conditions. Basically, a Lorentzian peak shape model of each reference compound is created from database information and is overlapped with the actual spectrum. The linear combination of modeled metabolites gives rise to the total spectral fit, which can be assessed with a summation line [16]. The metabolites with both VIP > 1 (Variable Importance for the Projection) and a p-value ≤ 0.05 were considered statistically significant. The Metaboanalyst program (https://www.metaboanalyst.ca/) [17] was used to generate receiver operator characteristic curves (ROC), calculate sensitivity, specificity, and the area under the ROC curve (AUC), and Matlab (http://it.mathworks.com/) was used to generate the box-and-whisker plots. The Random Forest algorithm was used to construct the ROC. It identifies important features through repeated random sub-sampling cross-validation (CV). In each CV, two-thirds (2/3) of the samples are used to evaluate the importance of each feature based on decreases in accuracy. The top features are used to build classification/regression models that are validated on the one-third (1/3) of samples that were left out of the original model.

2.5. Serum Carcinoembryonic Antigen Level Determination

Blood samples for CEA analysis were collected just before colonoscopy, centrifuged, and stored at −80 °C before use. The cut-off for CEA 1 was >2.5 ng/mL [12].

3. Results

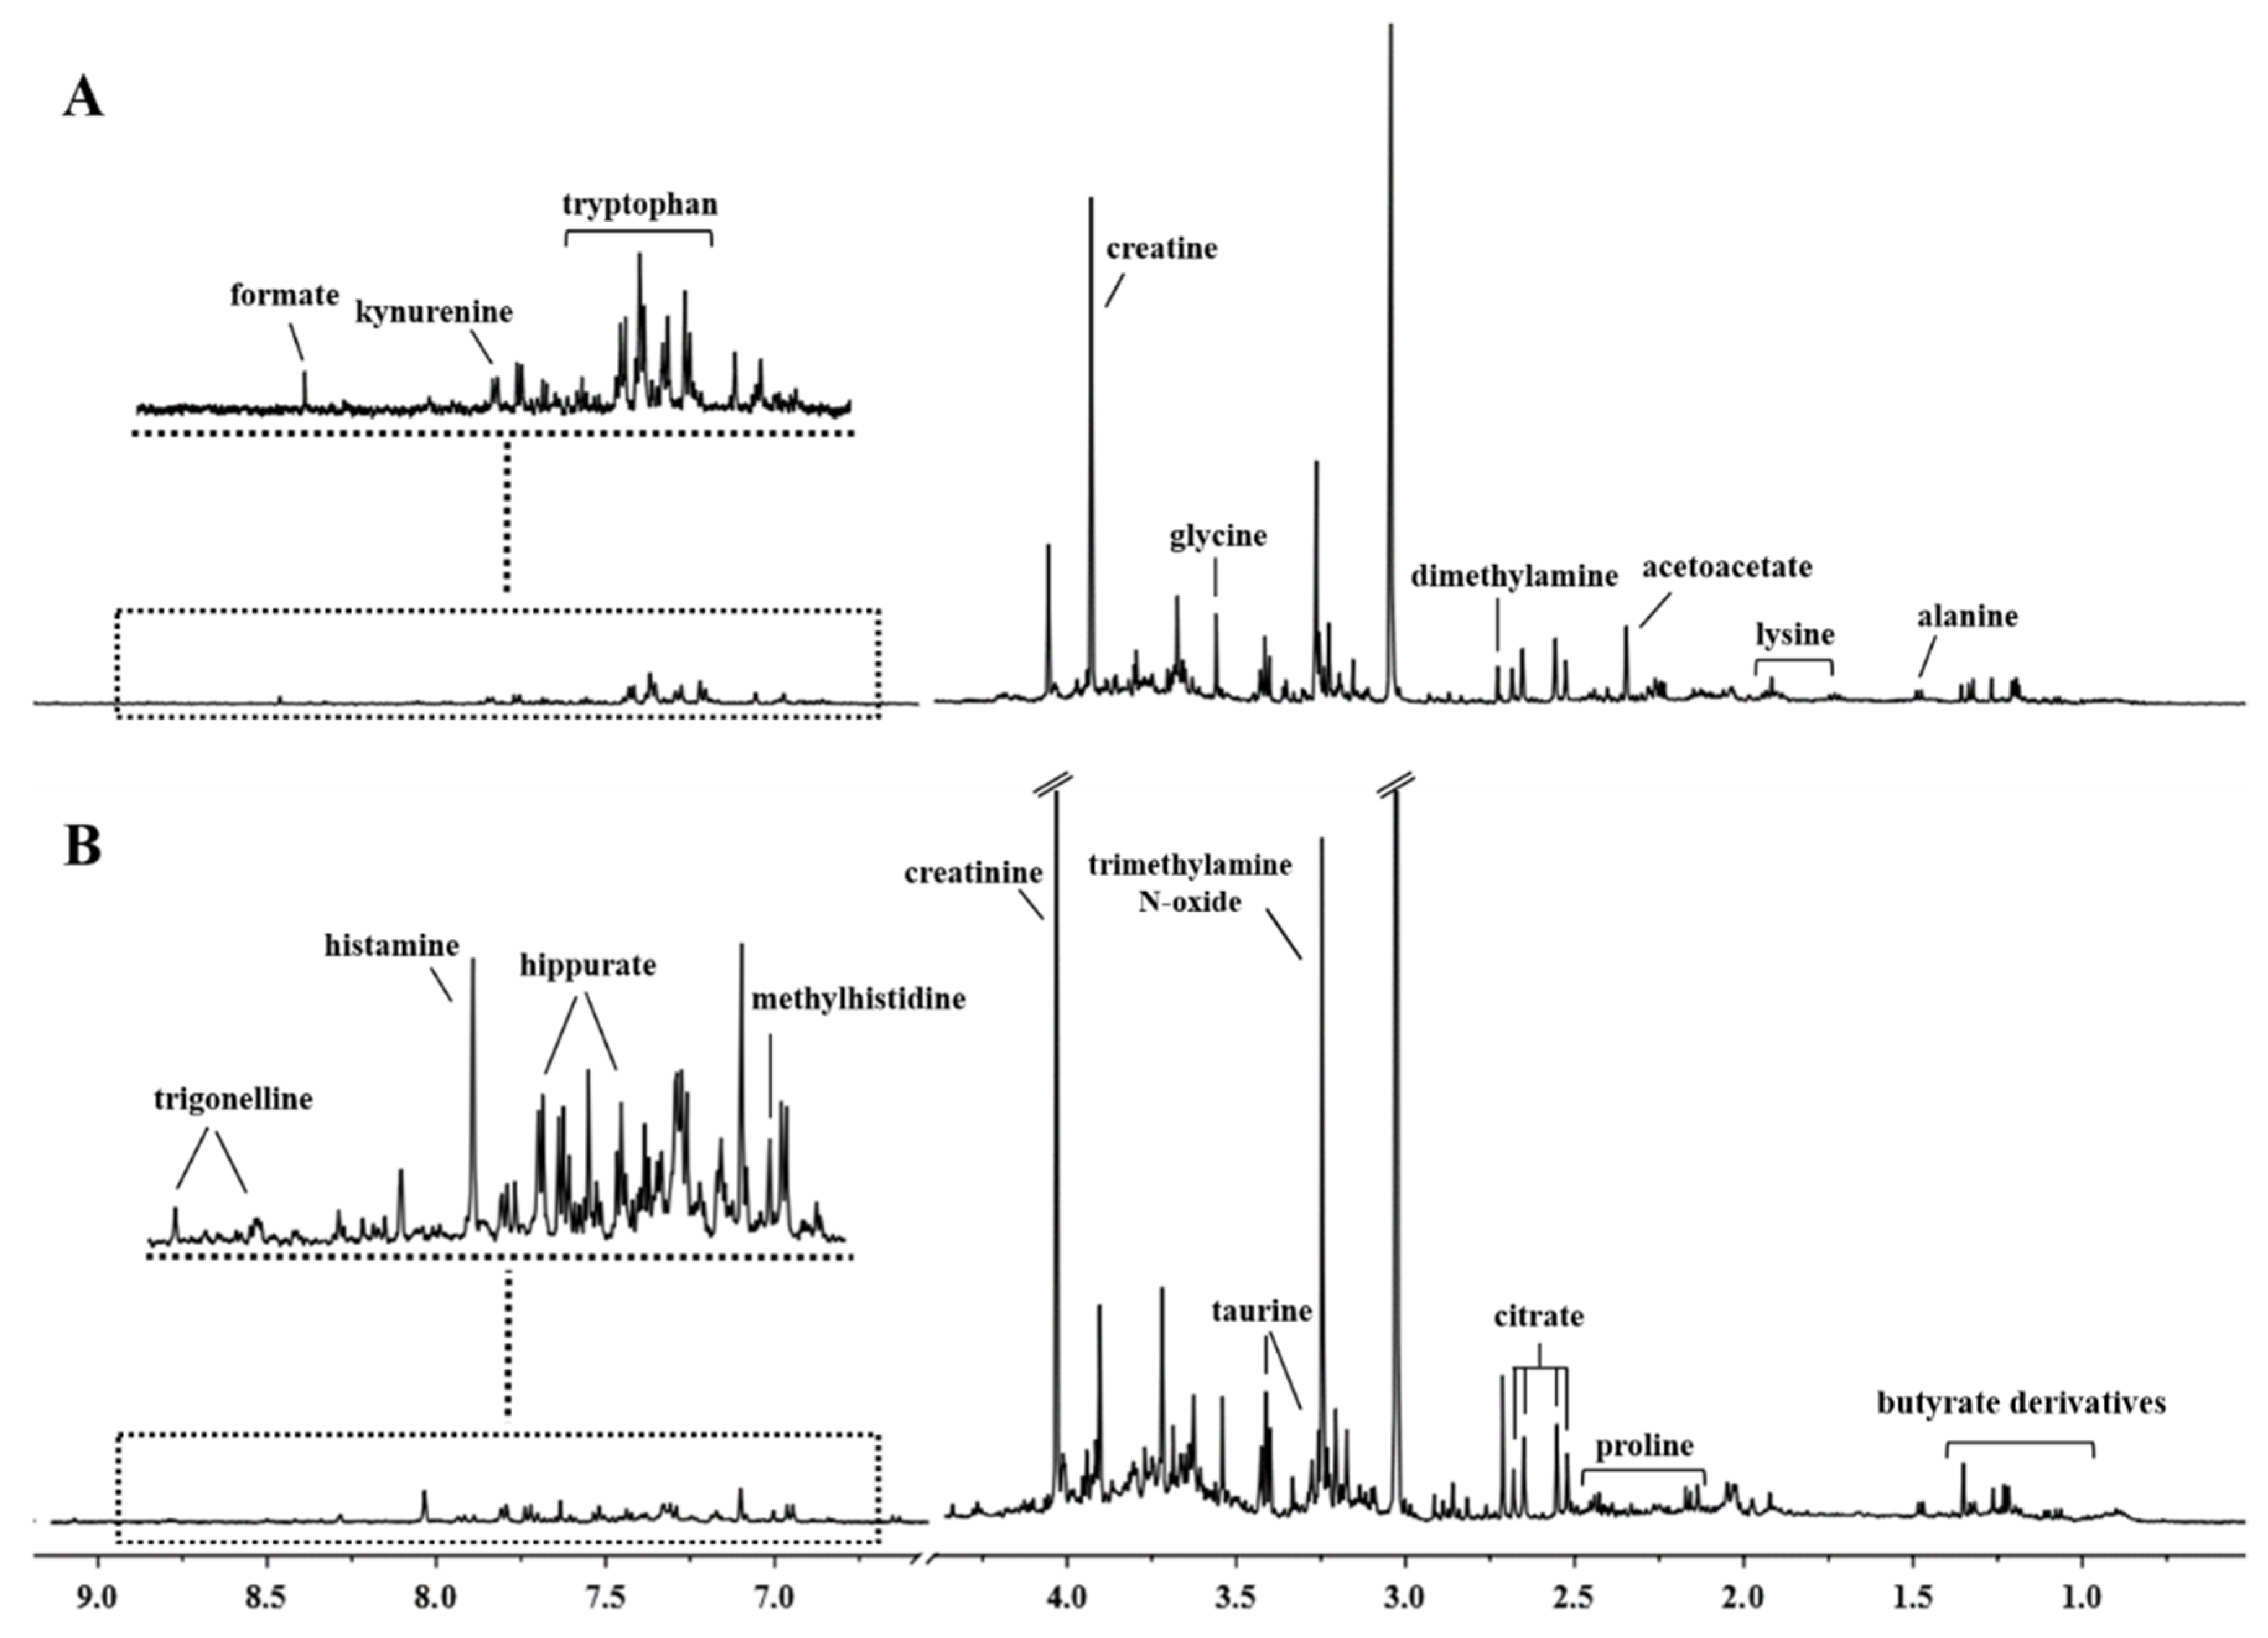
3.1. 1H-NMR Spectra of Urine Samples

NMR spectral analysis of urine samples revealed a distinct metabolic signature between C and CRC subjects (Figure 1). The resonance of spectra was assigned to different metabolites based on data published in the literature [18] and by using the library from the Chenomx NMR suite. Representative spectra of C and CRC are shown in Figure 1A,B. Major peak assignments of urine samples are reported in Figure 1, while the chemical shifts of metabolites are summarized in Table S1.

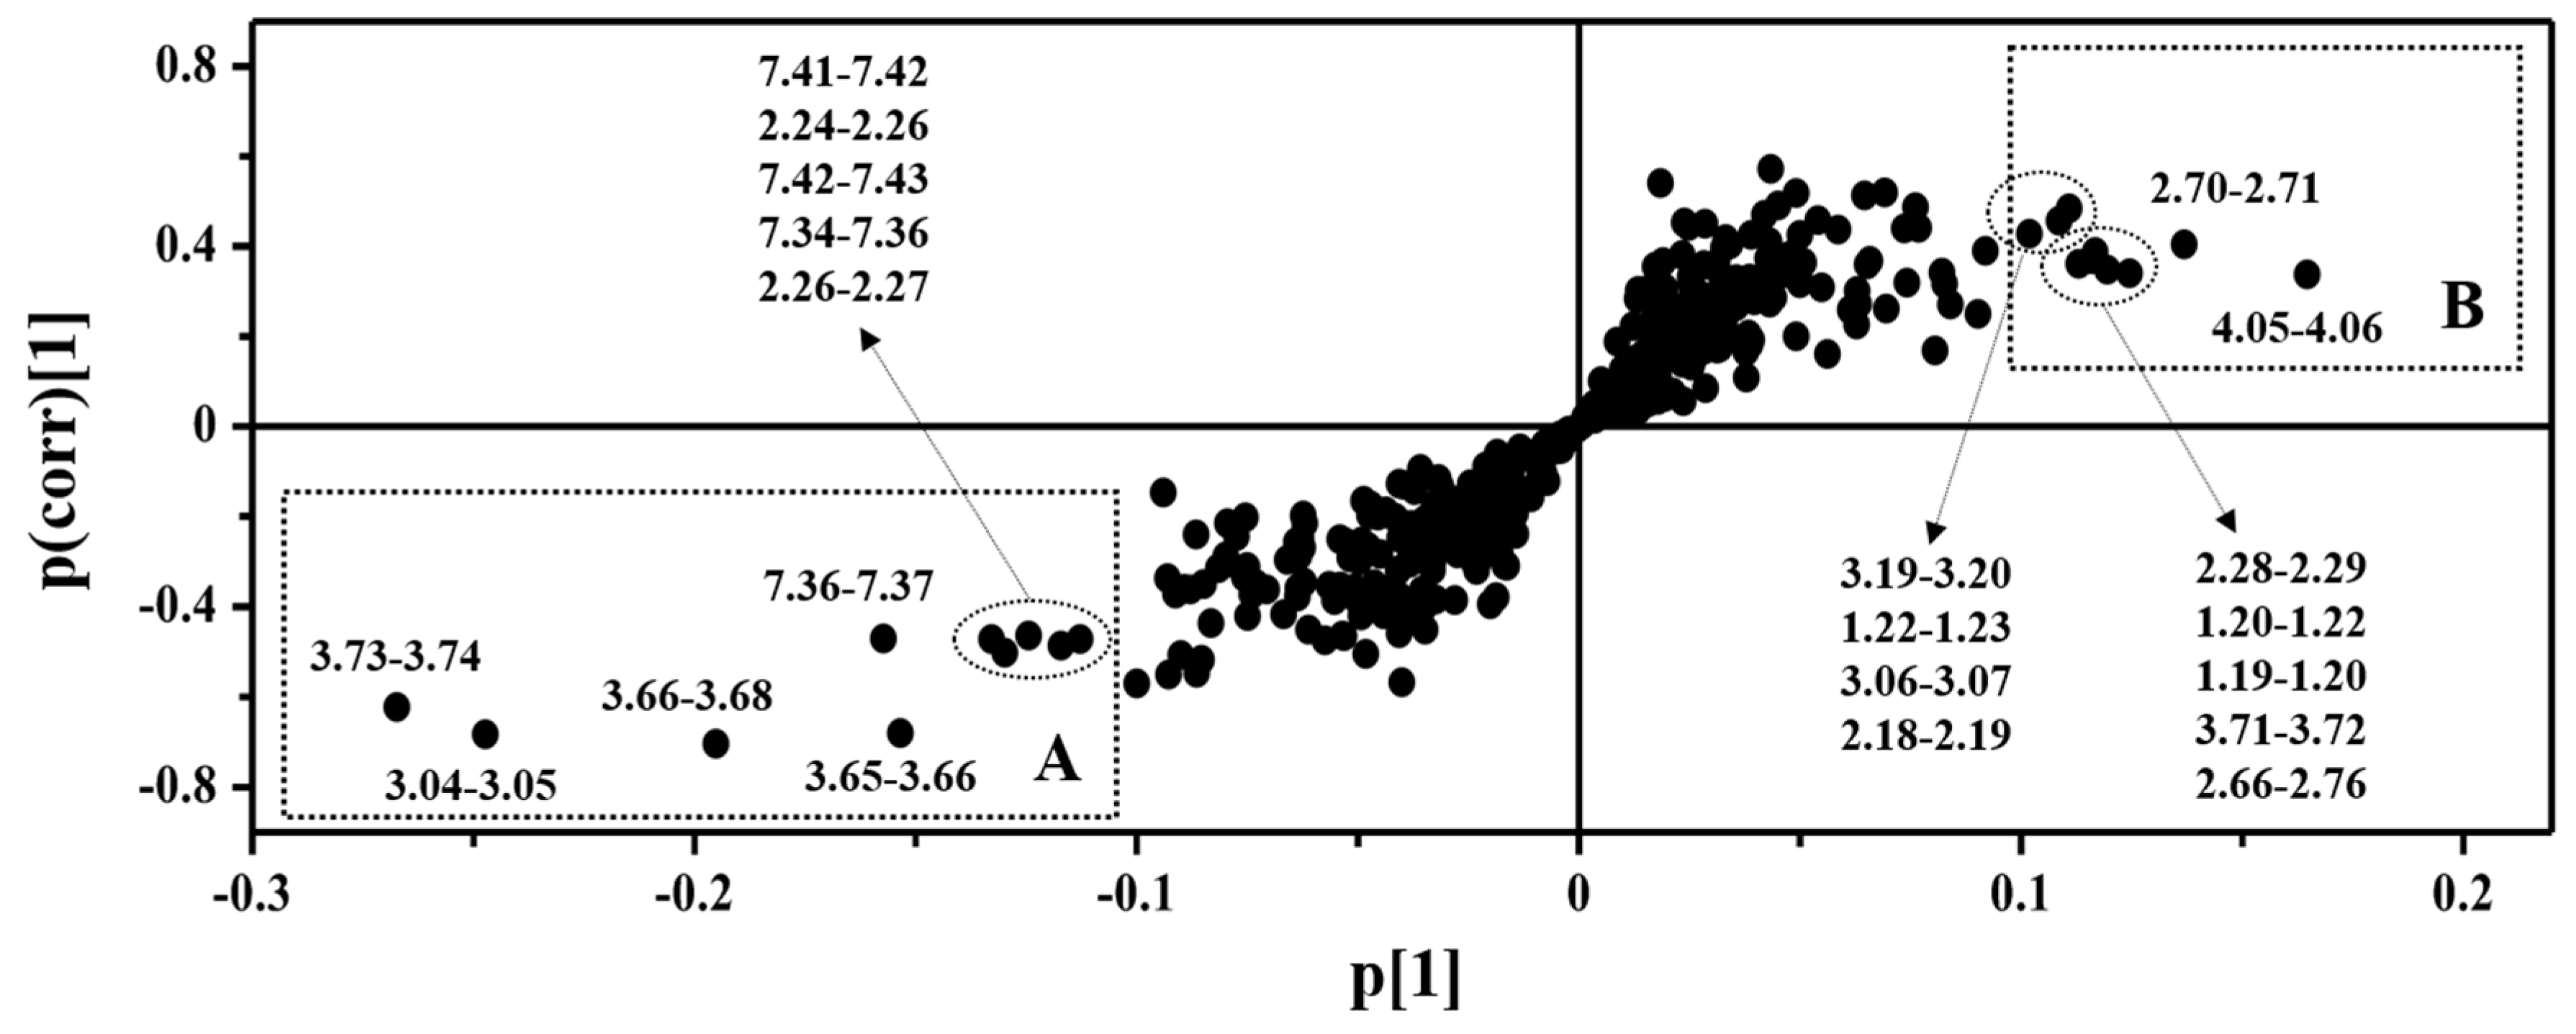
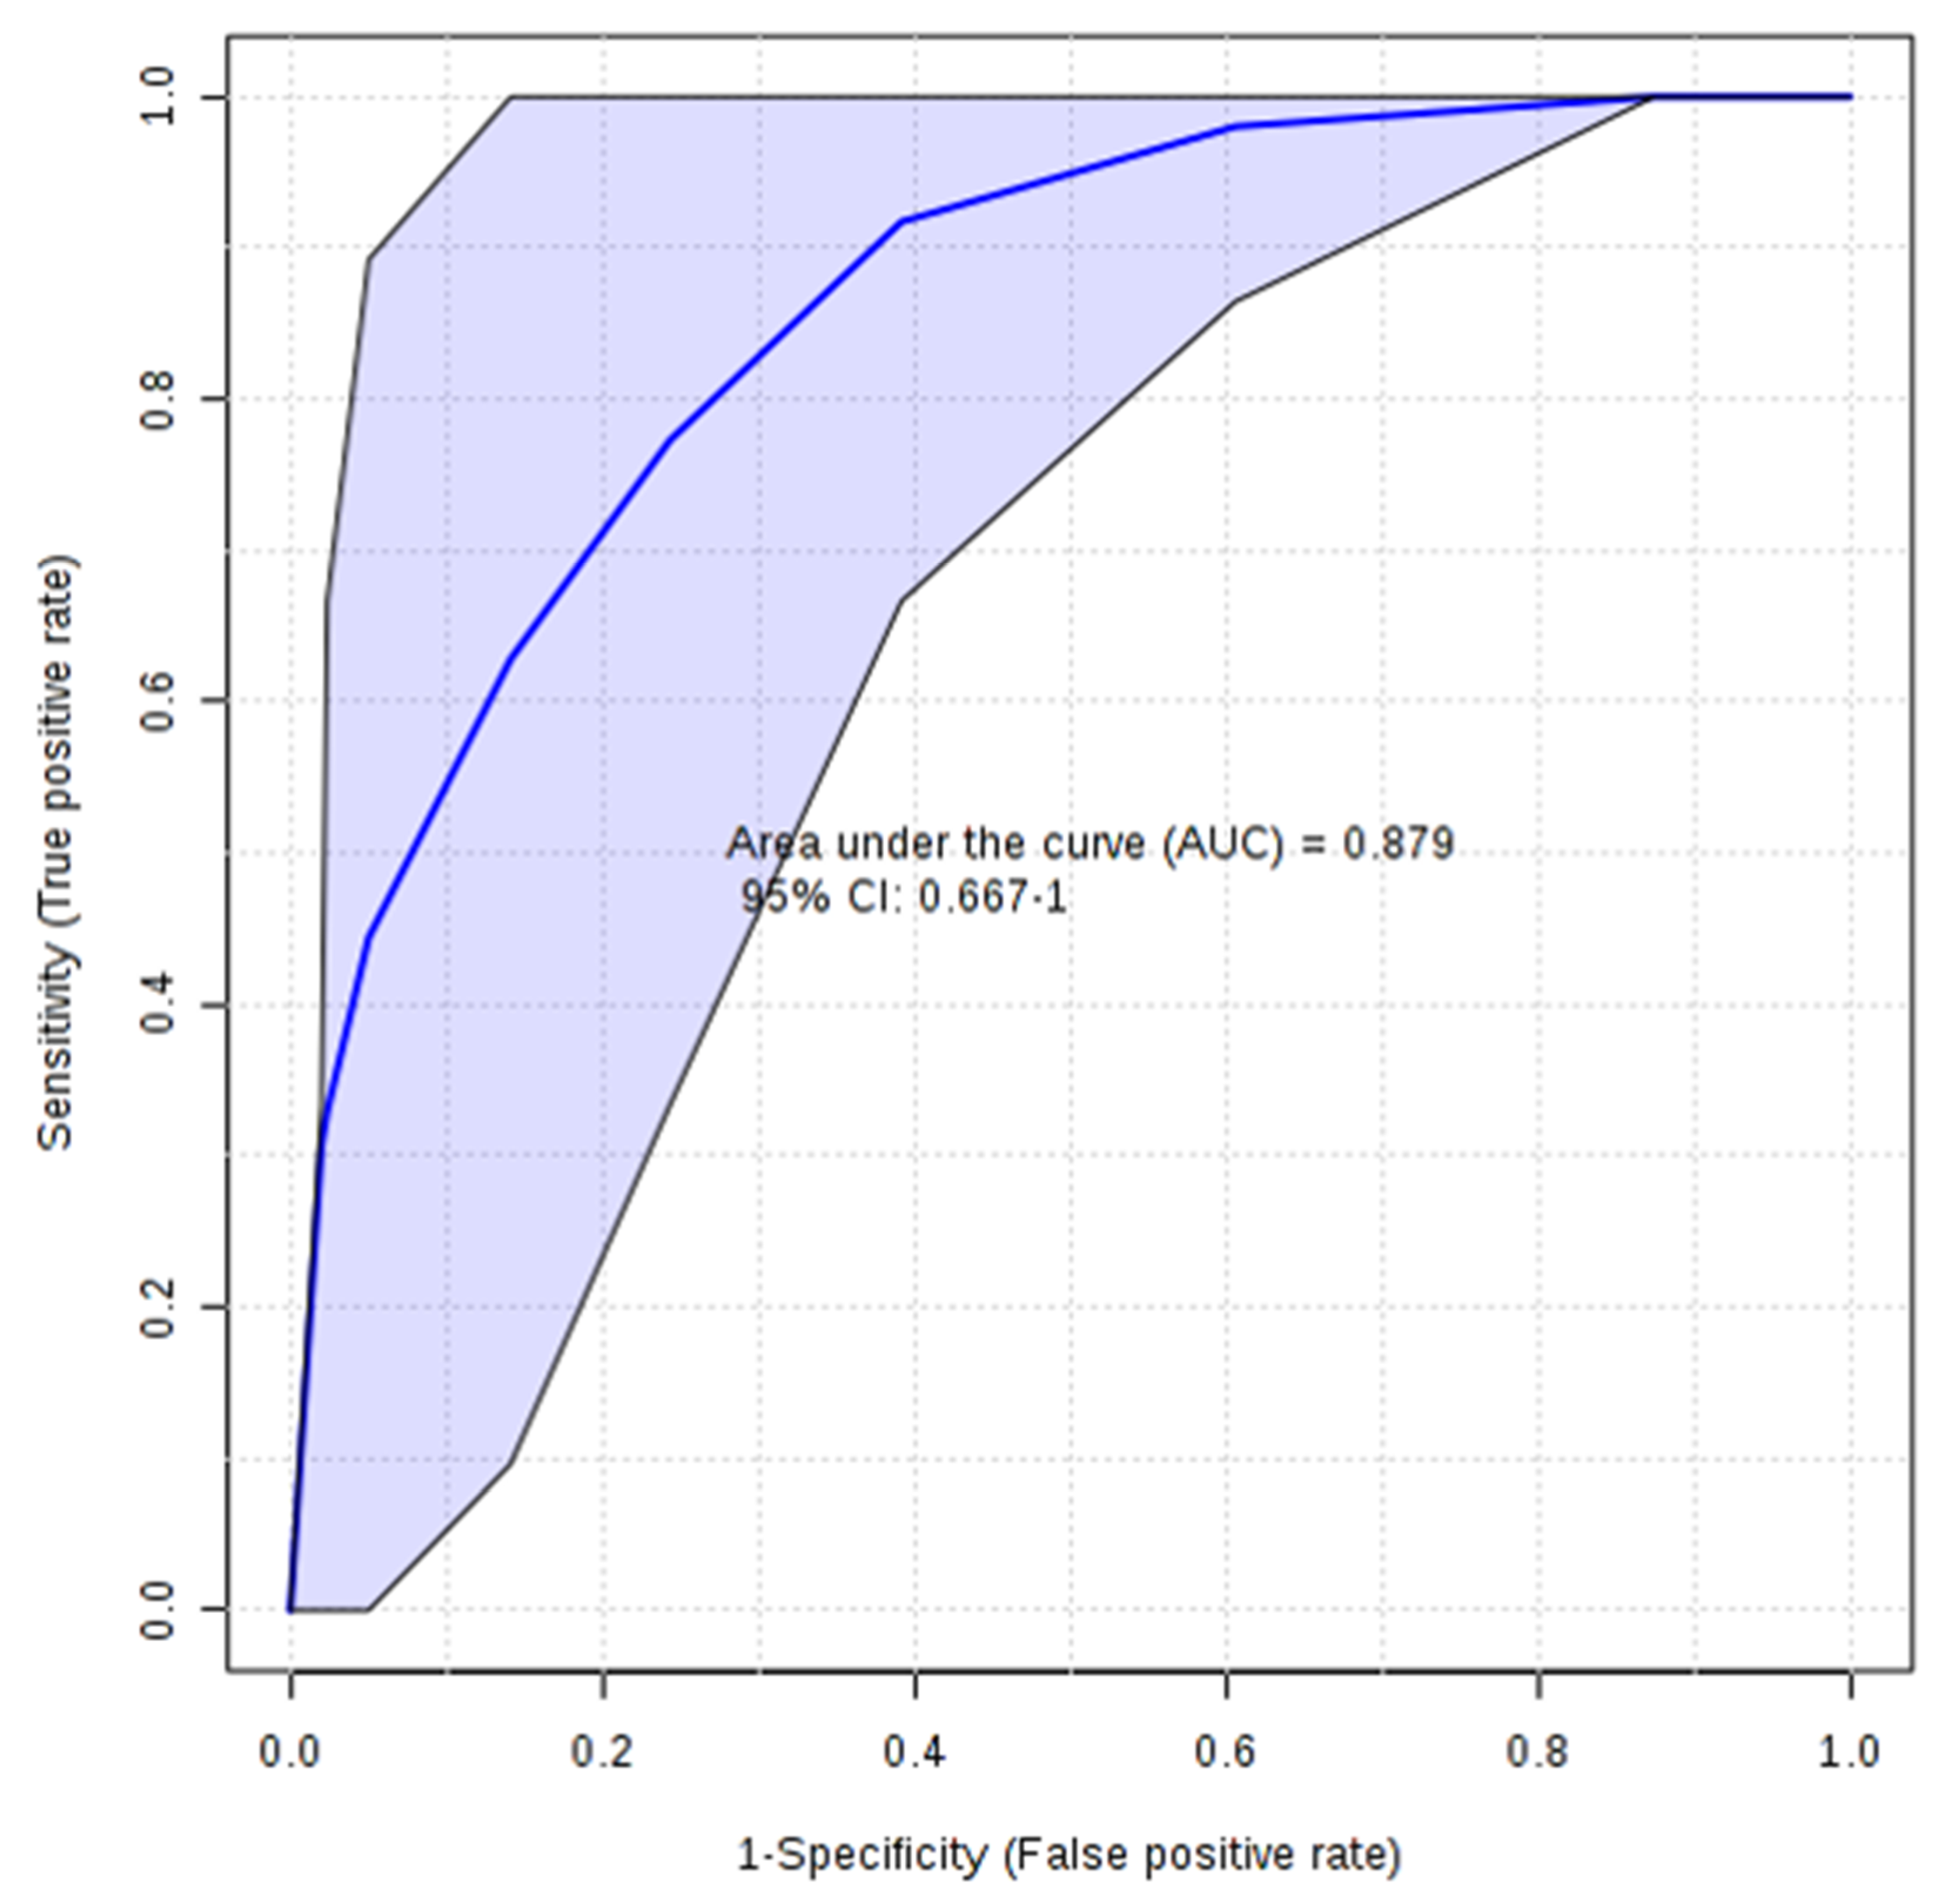
3.2. Multivariate Statistical Analysis of NMR Data

PCA was initially applied to the complete data set to highlight possible metabolic differences among the urine samples of control and CRC subjects and to identify potential outliers (Figure S1 in Supporting Information). Based on Hotelling’s T2 and DModX tests, two samples were considered outliers and were removed from the analysis (Figure S2 in Supporting Information). To optimize the separation between the CRC and C urine samples, the supervised OPLS-DA model was applied. As displayed in Figure 2, the OPLS-DA scores plot showed clear separation between the two groups of samples. To test the validity of the model, a permutation test on the PLS-DA model was performed. Results showed that the model was statistically valid, with a Q2 intercept value of −0.192. To identify the metabolites that mainly contributed to group separation, an S-plot was constructed (Figure 3). As shown in Figure 3, the variables selected in the S-plot are indicated with a dotted rectangle and represent the metabolites responsible for differentiation in the OPLS-DA scores plot. Cutoff values for the covariance of |p| ≥ 0.1 and the correlation |p(corr)| ≥ 0.2 were used. In the S-plot, the control samples were characterized, based on the discriminant regions, by high creatine, sn-glycero-3-phosphocholine, phenylacetylglycine, and proline (Figure 3 square A), whereas an increase in citrate, creatinine, acetoacetate, 3-hydroxybutyrate, 3-aminoisobutyrate, tyrosine, tryptophan, histamine, methylhistidine, and fucose characterized the CRC samples (Figure 3, square B). The relative concentrations of metabolites highlighted in the S-plot were verified with Chenomx NMR Suite 7.1 and were subjected to the Welch t-test to identify significant variations in concentration in the two groups. Significantly discriminant metabolites were characterized by VIP > 1 and p ≤ 0.05. After this analysis, 14 metabolites exhibited VIP > 1, but only acetoacetate, creatine, creatinine, histamine, phenylacetylglycine, and tryptophan showed significant variation (with p ≤ 0.05) (Table 2). The relative concentrations, calculated by normalization of the molar concentration of each metabolite to the total molar concentration of all 14 metabolites for each sample in the two groups, were compared using box-and-whisker plots. As shown in Figure 4, the data obtained demonstrated that the CRC group showed increased relative levels of acetoacetate, creatinine, and histamine, whereas creatine, phenylacetylglycine, and tryptophan levels were lower compared to the C group. A ROC curve was constructed using only the metabolites with a significant statistical variation, and the area under the curve of the ROC analysis was found to be 0.879 (95% CI: 0.667–1), indicating high predictive accuracy of the model (Figure 5). Significantly, only 5/12 CRC patients had increased CEA levels (CEA > 2.5 ng/mL), showing 42% sensitivity.

4. Discussion

Previous studies [6,9,10,11,12,19] have suggested the use of a metabolomics approach to identify tumor-associated biological alterations in CRC patients.
In the present study, 1H-NMR spectroscopy coupled with pattern recognition was used to profile urine metabolites of subjects with (CRC) or without (C) CRC. Significantly, metabolic perturbations were evaluated between the urine samples of CRC patients and individuals undergoing colonoscopy for positive FOBT or familial risk of CRC, to whom a similar low-fiber, controlled diet had been administered for few days before they were subjected to the examination. Urine samples were collected just before the colonoscopy. Therefore, both CRC and C groups were evaluated in the same short-term dietary conditions, consisting of a low-fiber diet for a few days. Since diet represents an important factor that contributes to inter-individual variability, our sample collection approach reduced variability related to a different nutritional status. To date, our study, despite the small number of subjects analyzed, is the first to investigate the metabolomics profiles of potential CRC patients under a similarly controlled short-term diet. Based on identification of metabolites with significant statistical variations between CRC and C groups, a ROC curve was constructed to assess the sensitivity and specificity of the biomarker candidates for early detection of CRC. The AUC of the ROC analysis denoted high predictive accuracy of the model. Furthermore, CRC patients showed a urine metabolic profile characterized by a higher sensitivity compared to CEA serum levels. The sensitivity of CEA is well known to be low, but it is often used as a serum biomarker in CRC for integrating diagnosis and monitoring the follow up [20]. Our data confirmed CEA detection limitations, including its relatively low sensitivity and specificity [2], and suggested the possibility of integrating these data with the metabolomics approach. Our study indicates a better sensitivity and specificity of the urine profile test in CRC samples compared to those analyzed with 1H-NMR spectroscopy by Wang et al. [21] in adenomatous polyp samples. The improved sensitivity and specificity of urine profile tests in CRC samples may be due to a more advanced stage of colon disease in our samples in the CRC group. In our study, the metabolites identified were the end products of several metabolic pathways relating to lipid and amino acid metabolism, which are known to be perturbed during tumor cell proliferation [10]. We found that the levels of acetoacetate, creatinine, and histamine were increased, while those of creatine, phenylacetylglycine, and tryptophan decreased in the urine of the subjects affected by CRC. The increased concentrations of acetoacetate observed in CRC urine may be related to lipid metabolic changes associated with tumor development. The increased content of acetoacetate in our CRC samples could be related to increased β-oxidation due to the strong energy demands accompanying tumor growth. Indeed, in tumor cells, acetyl-CoA is not converted into citrate by the tricarboxylic acid cycle but is processed through an alternative pathway to form ketone bodies, which represent a very efficient fuel source, preferable even to glucose [11,22].
Cancer cells use some amino acids as an energy source [23]. In our study, we found that creatinine levels increased while those of creatine and tryptophan decreased in the urine of CRC patients. Urinary creatinine increase is normally connected to muscle catabolism, breakdown of proteins, or a combination of the two processes [24]. The increased creatinine levels observed in our tumor samples may be due to the non-enzymatic and irreversible conversion of creatine [25], resulting in significantly decreased levels in CRC urine samples. On the other hand, we found decreased tryptophan levels in CRC urine samples. Altered levels of tryptophan in urine have been observed in other types of tumors, such as breast and bladder cancer [26]. Tryptophan is an essential amino acid metabolized in tumor microenvironments, immune-privileged, or inflammation sites. Degradation of tryptophan by the enzyme indoleamine-2,3-dioxygenase (IDO) is considered to be an immune defense mechanism, which inhibits the growth of intracellular bacteria, viruses, parasites [27], and malignant tumor cells [28]. Based on different pieces of evidence [29,30], the catabolic products of tryptophan in cancer are considered important microenvironmental factors that suppress antitumor immune responses. Another metabolite that was increased in our CRC urine samples was histamine. It has been reported that histamine can regulate the proliferation and angiogenesis of cancer cells [31,32,33]. Finally, another metabolite decreased in our CRC urine samples was phenylacetylglycine, which is considered a minor metabolite of fatty acids. Increased excretion of phenylacetylglycine has been observed in gastric cancer patients, in which its levels correlated with the cancer T stage [6], and in rats treated with alkylating agents that produced precancerous colorectal lesions possibly related to gut microflora metabolism dysbiosis [34]. Significantly, even if the low number of subjects investigated does represent a limit of the work, a recent study by Wang et al. [11] analyzing the metabolomics profiles of CRC versus healthy patients reported similar results for acetacetate and phenylalanine, a precursor of phenylacetylglycine. In addition, a recent study by Deng et al. [35] identified four metabolites as robust CRC urine biomarkers: proline, diacetylspermine, kynurenine, and glucose. Because kynurenine is a tryptophan metabolite, its increased levels correlate well with the decrease of tryptophan found in our CRC samples.
In conclusion, metabolomics analysis showed a different urinary metabolic profile between CRC patients and healthy controls undergoing colonoscopy. Altered levels of some metabolites resulted in a significant correlation with colon cancer and were able to distinguish with accuracy CRC patients from C. Both our results and data from literature confirm that urinary metabolic profiling is an effective tool for identifying CRC, and it may be useful in improving diagnosis, prognosis, and response to therapy, representing a noninvasive diagnostic support to be used before other more invasive tests. Though a limit of the study is the number of subjects investigated, a strength of the study is the similar nutritional status of all the subjects undergoing colonoscopy. Our results suggest that for CRC identification, the metabolomics analysis does not need to be associated with colonoscopy considering that similar discriminant results can be observed without it. The next important step is the validation of these data in an independent larger group of patients to transfer this information into the clinic.

Supplementary Materials

The following are available online at https://www.mdpi.com/2076-3417/10/16/5401/s1, Figure S1: Principal Component Analyses (PCA) scores plot of 1H-NMR spectra of urine samples: C (full circle) and CRC (open circle) subjects. Two outliers are indicated with arrows. Figure S2: Hotelling’s T2 versus DModX plot: C (full circle) and CRC (open circle) subjects. Table S1: Proton chemical shifts of the metabolites identified in the 500 MHz 1H-NMR spectra of urine samples.

Author Contributions

L.Z. and L.A. conceived the study and supervised the project. A.R., F.C. obtained the samples and clinical details. C.P. and V.P.L. performed metabolomics experiments and data analysis. C.P., M.P., and J.L.G. wrote the first draft of the manuscript, and C.P., M.P., L.A., V.F., and M.M., contributed to the final version. C.P., M.P., L.A., J.L.G., L.Z., V.F., and M.M. critically reviewed the data and the manuscript. All the authors have read and approved the whole content of this submitted manuscript.

Funding

This work was supported by R.A.S. LR7/2007. Grant Code CRP 18488 (L.A.).

Conflicts of Interest

The authors declare no conflicts of interest.

References

  1. Soerjomataram, I.; Lortet-Tieulent, J.; Parkin, D.M.; Ferlay, J.; Mathers, C.; Forman, D.; Bray, F. Global burden of cancer in 2008: A systematic analysis of disability-adjusted life-years in 12 world regions. Lancet 2012, 380, 1840–1850. [Google Scholar] [CrossRef]
  2. El-Awady, S.; Lithy, R.; Morshed, M.; Khafagy, W.; Abd Monem, H.; Waleed, O.; Badr, S.; Fekry, A.; El Nakeeb, A.; Ghazy, H.; et al. Utility of serum preoperative carcinoembryonic antigen in colorectal cancer patients. Hepato-Gastroenterology 2009, 56, 361–366. [Google Scholar] [PubMed]
  3. Hewitson, P.; Glasziou, P.; Watson, E.; Towler, B.; Irwig, L. Cochrane systematic review of colorectal cancer screening using the fecal occult blood test (hemoccult): An update. Am. J. Gastroenterol. 2008, 103, 1541–1549. [Google Scholar] [CrossRef] [PubMed]
  4. Ahlquist, D.A.; Hongzhi, Z.; Domanico, M.; Mahoney, D.W.; Yab, T.C.; Taylor, W.R.; Butz, M.L.; Thibodeau, S.N.; Rabeneck, L.; Paszat, L.F.; et al. Next-Generation Stool DNA Test Accurately Detects Colorectal Cancer and Large Adenomas. Gastroenterology 2012, 142, 248–256. [Google Scholar] [CrossRef] [Green Version]
  5. Grady, W.M.; Markowitz, S.D. The molecular pathogenesis of colorectal cancer and its potential application to colorectal cancer screening. Dig. Dis. Sci. 2015, 60, 762–772. [Google Scholar] [CrossRef] [Green Version]
  6. Jung, J.; Jung, Y.; Bang, E.J.; Cho, S.; Jang, Y.J.; Kwak, J.M.; Ryu, D.H.; Park, S.; Hwang, G.S. Noninvasive diagnosis and evaluation of curative surgery for gastric cancer by using NMR-based metabolomic profiling. Ann. Surg. Oncol. 2014, 21, 736–742. [Google Scholar] [CrossRef]
  7. Nicholson, J.K.; Holmes, E.; Kinross, J.M.; Darzi, A.W.; Takats, Z.; Lindon, J.C. Metabolic phenotyping in clinical and surgical environments. Nature 2012, 491, 384–392. [Google Scholar] [CrossRef]
  8. Chan, E.C.Y.; Koh, P.K.; Mal, M.; Cheah, P.Y.; Eu, K.W.; Backshall, A.; Cavill, R.; Nicholson, J.K.; Keun, H.C. Metabolic profiling of human colorectal cancer using high-resolution magic angle spinning nuclear magnetic resonance (HR-MAS NMR) spectroscopy and gas chromatography mass spectrometry (GC/MS). J. Proteome Res. 2009, 8, 352–361. [Google Scholar] [CrossRef]
  9. Barberini, L.; Restivo, A.; Noto, A.; Deidda, S.; Fattuoni, C.; Fanos, V.; Saba, L.; Zorcolo, L.; Mussap, M. A gas chromatography-mass spectrometry (GC-MS) metabolomics approach in human colorectal cancer (CRC): The emerging role of monosaccharides and amino acids. Ann. Transl. Med. 2019, 7, 727. [Google Scholar] [CrossRef]
  10. Cheng, Y.; Xie, G.; Chen, T.; Qiu, Y.; Zou, X.; Zheng, M.; Tan, B.; Feng, B.; Don, T.; He, P.; et al. Distinct urinary metabolic profile of human colorectal cancer. J. Proteome Res. 2012, 11, 1354–1363. [Google Scholar] [CrossRef] [PubMed]
  11. Wang, Z.; Lin, Y.; Liang, J.; Huang, Y.; Ma, C.; Liu, X.; Yang, J. NMR-based metabolomic techniques identify potential urinary biomarkers for early colorectal cancer detection. Oncotarget 2017, 8, 105819–105831. [Google Scholar] [CrossRef] [PubMed] [Green Version]
  12. Nicholson, B.D.; Shinkins, B.; Pathiraja, I.; Roberts, N.W.; James, T.J.; Mallett, S.; Perera, R.; Primrose, J.N.; Mant, D. Blood CEA levels for detecting recurrent colorectal cancer. Cochrane Database Syst. Rev. 2015, 12, CD011134. [Google Scholar] [CrossRef] [PubMed] [Green Version]
  13. Piras, C.; Pintus, R.; Pruna, D.; Dessì, A.; Atzori, L.; Fanos, V. Pediatric Acute-onset Neuropsychiatric Syndrome and Mycoplasma PneumoniaeInfection: A Case Report Analysis with a Metabolomics Approach. Curr. Pediatr. Rev. 2019, 15. [Google Scholar] [CrossRef] [PubMed]
  14. Sousa, S.A.A.; Magalhaes, A.; Ferreira, M.M.C. Optimized bucketing for NMR spectra: Three case studies. Chemometr. Intell. Lab. 2013, 122, 93–102. [Google Scholar] [CrossRef]
  15. Wu, Y.; Li, L. Sample normalization methods in quantitative metabolomics. J. Chromatogr. A 2016, 1430, 80–95. [Google Scholar] [CrossRef]
  16. Weljie, A.M.; Newton, J.; Mercier, P.; Carlson, E.; Slupsky, C.M. Targeted Profiling: Quantitative Analysis of 1HNMR Metabolomics Data. Anal. Chem. 2006, 2, 4430–4442. [Google Scholar] [CrossRef]
  17. Chong, J.; Soufan, O.; Li, C.; Caraus, I.; Li, S.; Bourque, G.; Wishart, D.S.; Xia, J. MetaboAnalyst 4.0: Towards more transparent and integrative metabolomics analysis. Nucl. Acids Res. 2018, 46, W486–W494. [Google Scholar] [CrossRef] [Green Version]
  18. Schicho, R.; Shaykhutdinov, R.; Ngo, J.; Nazyrova, A.; Schneider, C.; Panaccione, R.; Kaplan, G.G.; Vogel, H.J.; Storr, M. Quantitative metabolomic profiling of serum, plasma, and urine by 1H-NMR spectroscopy discriminates between patients with inflammatory bowel disease and healthy individuals. J. Proteome Res. 2012, 11, 3344–3357. [Google Scholar] [CrossRef]
  19. Bathe, O.F.; Farshidfar, F. From Genotype to Functional Phenotype: Unraveling the Metabolomic Features of Colorectal Cancer. Genes 2014, 5, 536–560. [Google Scholar] [CrossRef] [Green Version]
  20. Lin, J.K.; Lin, C.C.; Yang, S.H.; Wang, H.S.; Jiang, J.K.; Lan, Y.T.; Lin, T.C.; Li, A.F.Y.; Chen, W.S.; Chang, S.C. Early postoperative CEA level is a better prognostic indicator than is preoperative CEA level in predicting prognosis of patients with curable colorectal cancer. Int. J. Colorectal Dis. 2011, 26, 1135–1141. [Google Scholar] [CrossRef]
  21. Wang, H.; Tso, V.; Wong, C.; Sadowski, D.; Fedorak, R.N. Development and Validation of a Highly Sensitive Urine-Based Test to Identify Patients with Colonic Adenomatous Polyps. Clin. Trans. Gastroenterol. 2014, 5, e54. [Google Scholar] [CrossRef] [PubMed]
  22. Jobard, E.; Pontoizeau, C.; Blaise, B.J.; Bachelot, T.; Elena-Herrmann, B.; Trédan, O. A serum nuclear magnetic resonance-based metabolomic signature of advanced metastatic human breast cancer. Cancer Lett. 2014, 343, 33–41. [Google Scholar] [CrossRef] [PubMed]
  23. Argiles, J.; Azco Bieto, J. The metabolic environment of cancer. Mol. Cell. Biochem. 1988, 81, 3–17. [Google Scholar] [CrossRef] [PubMed]
  24. Eisner, R.; Stretch, C.; Eastman, T.; Xia, J.; Hau, D.; Damaraju, S.; Greiner, R.; Wishart, D.S.; Baracos, V.E. Learning to predict cancer-associated skeletal muscle wasting from 1H-NMR profiles of urinary metabolites. Metabolomics 2011, 7, 25–34. [Google Scholar] [CrossRef]
  25. Wyss, M.; Kaddurah-Daouk, R. Creatine and creatinine metabolism. Physiol. Rev. 2000, 80, 1107–1213. [Google Scholar] [CrossRef]
  26. Bryan, G.T. The role of urinary tryptophan metabolites in the etiology of bladder cancer. Am. J. Clin. Nutr. 1971, 24, 841–847. [Google Scholar] [CrossRef]
  27. Denz, H.; Orth, B.; Weiss, G.; Herrmann, R.; Huber, P.; Wachter, H.; Fuchs, D. Weight loss in patients with hematological neoplasias is associated with immune system stimulation. Clin. Investig. 1993, 71, 37–41. [Google Scholar] [CrossRef]
  28. Carlin, J.M.; Ozaki, Y.; Byrne, G.I.; Brown, R.R.; Borden, E.C. Interferons and indoleamine 2,3-dioxygenase: Role in antimicrobial and antitumor effects. Experientia 1989, 45, 535–541. [Google Scholar] [CrossRef]
  29. Murr, C.; Bergant, A.; Widschwendter, M.; Heim, K.; Schrocksnadel, H.; Fuchs, D. Neopterin is an independent prognostic variable in females with breast cancer. Clin. Chem. 1999, 45, 1998–2004. [Google Scholar] [CrossRef] [Green Version]
  30. Platten, M.; Wick, W.; Van den Eynde, B.J. Tryptophan catabolism in cancer: Beyond IDO and tryptophan depletion. Cancer Res. 2012, 72, 5435–5440. [Google Scholar] [CrossRef] [Green Version]
  31. Medina, V.A.; Rivera, E.S. Histamine receptors and cancer pharmacology. Br. J. Pharmacol. 2010, 161, 755–767. [Google Scholar] [CrossRef] [PubMed] [Green Version]
  32. Cricco, G.P.; Mohamad, N.A.; Sambuco, L.A.; Genre, F.; Croci, M.; Gutiérrez, A.S.; Medina, V.A.; Bergoc, R.M.; Rivera, E.S.; Martín, G.A. Histamine regulates pancreatic carcinoma cell growth through H3 and H4 receptors. Inflamm. Res. 2008, 57, 23–24. [Google Scholar] [CrossRef] [PubMed]
  33. Medina, V.; Croci, M.; Crescenti, E.; Mohamad, N.; Sanchez-Jiménez, F.; Massari, N.; Nuñez, M.; Cricco, G.; Martin, G.; Bergoc, R.; et al. The role of histamine in human mammary carcinogenesis: H3 and H4 receptors as potential therapeutic targets for breast cancer treatment. Cancer Biol. Ther. 2008, 7, 28–35. [Google Scholar] [CrossRef] [PubMed] [Green Version]
  34. Qiu, Y.; Cai, G.; Su, M.; Chen, T.; Liu, Y.; Xu, Y.; Ni, Y.; Zhao, A.; Cai, S.; Xu, L.X. Urinary metabonomic study on colorectal cancer. J. Proteome Res. 2010, 9, 1627–1634. [Google Scholar] [CrossRef]
  35. Deng, L.; Ismond, K.; Liu, Z.; Constable, J.; Wang, H.; Alatise, O.I.; Weiser, M.R.; Kingham, T.P.; Chang, D. Urinary Metabolomics to Identify a Unique Biomarker Panel for Detecting Colorectal Cancer: A Multicentre Study. Cancer Epidemiol. Prev. Biomark. 2019, 28, 1283–1291. [Google Scholar] [CrossRef] [PubMed]
Figure 1. Spectral area and major peak assignments of a representative 1H-NMR spectra of urine obtained from unaffected subjects (C) (A) or colorectal cancer patients (CRC) (B).
Applsci 10 05401 g001
Figure 2. OPLS-DA scores plot of 1H-NMR spectra of urine samples: C (full circle) and CRC (open circle) subjects. The OPLS-DA model was performed using one predictive and one orthogonal component and is described by R2X, R2Y, and Q2 values of 0.328, 0.957, and 0.539, respectively.
Applsci 10 05401 g002
Figure 3. S-Plot corresponding to the OPLS-DA model used to characterize the most significant variables associated with group C (dotted rectangle A) and CRC (dotted rectangle B) subjects. Cutoff values for the covariance of |p| ≥ 0.1 and for the correlation |p (corr)| ≥ 0.2 were used. Values of discriminant ppm regions are shown.
Applsci 10 05401 g003
Figure 4. Box-and-whisker plots showing an altered expression of metabolites including acetoacetate, creatine, creatinine, histamine, phenylacetylglycine, and tryptophan between C and CRC patients. Median values are highlighted by solid lines. Statistical significance of the metabolites (p ≤ 0.05) is presented in Table 2.
Applsci 10 05401 g004
Figure 5. Receiver Operating Characteristic (ROC) analysis. Area under the curve (AUC) was found to be 0.879. CI: Confidence Interval.
Applsci 10 05401 g005
Table 1. Characteristics of the study population.
CRC PatientsControls
Number1410
Age (median, range)67.4, 40–8856.3, 47–67
Male/female ratio11/37/3
CEA (>2.5 ng/mL)50
Cancer site
Colon6-
Rectum7-
Caecum1-
FOBT
Positive9N/A
Negative5N/A
Dukes’ Stage
A3-
B7-
C3-
D1-
FOBT: Fecal Occult Blood Test; N/A: Not available.
Table 2. Statistical differences of metabolites characterized by Variable Importance for the Projection (VIP) > 1.
MetabolitesMean (SD) of Group (mM) ap-Value bFC c (log2 CRC/C)
CCRC
Phenylacetylglycine2.07 ± 0.651.34 ± 0.720.01−0.623
Histamine1.14 ± 0.492.26 ± 0.850.020.988
Creatine6.64 ± 3.341.49 ± 0.980.03−2.150
Tryptophan1.01 ± 0.460.71 ± 0.270.03−0.517
Acetoacetate0.85 ± 0.281.64 ± 1.370.050.970
Creatinine26.12 ± 17.9637.83 ± 14.590.050.535
3-hydroxybutyrate1.00 ± 0.541.64 ± 1.450.100.706
Tyrosine0.82 ± 0.410.62 ± 0.370.12−0.409
Proline2.93 ± 1.123.38 ± 0.590.130.202
3-Aminoisobutyrate1.09 ± 0.542.08 ± 2.870.150.933
Sn-glycero-3-phosphocholine1.62 ± 0.671.88 ± 0.710.19−0.215
Fucose1.28 ± 0.541.16 ± 2.870.250.145
Methylhistidine1.09 ± 0.671.23 ± 0.370.26−0.180
Citrate8.57 ± 4.127.53 ± 6.940.340.187
Metabolites were selected on VIP > 1 based on Orthogonal Partial Least Squares Discriminant Analysis (OPLS-DA). a Relative concentrations were calculated by normalization of the molar concentration of each metabolite to the total molar concentration of all 14 metabolites for each sample. b A Welch t-test was performed and the p-value reported. c FC indicates the fold change (FC) between CRC and C patients. FC with a positive value indicates a relatively higher concentration present in CRC patients, and a negative value shows a relatively lower concentration as compared to the C.

